Embed Size (px)
Citation preview

Circular economy: what we want to know and can measure Framework and baseline assessment for monitoring the progress of the circular economy in the Netherlands
Policy Report

Circular economy: what we want to know and can measure
Raw materials for Dutch consumption, examples per priority
Source: PBL
Fossil fuel
Metal
Industry
MineralsBiomass
Biomass and food:Meat
Manufacturing: New laptops sold
4.4 million
54,850 houses 3,596 million
57 million euros
Construction: Completed new builds
Plastics: Number of plastic bo�les
Consumer goods: Material value (e.g. gold) of electronics in residual waste
3.16 million kg 2016 2016
2016
2016
2014
2016
pbl.n
l
28 billion kg56 billion kg
23 billion kg 32 billion kg

Circular economy: what we want to know and can measure Framework and baseline assessment for monitoring the progress of the circular economy in the NetherlandsJosé Potting and Aldert Hanemaaijer (eds.) (PBL) Roel Delahaye and Rutger Hoekstra (CBS) Jurgen Ganzevles and Johannes Lijzen (RIVM)

This publication can be downloaded from: www.pbl.nl/en. Parts of this publication may be reproduced, providing the source is
stated, in the form: José Potting and Aldert Hanemaaijer (eds.), Roel Delahaye, Jurgen Ganzevles, Rutger Hoekstra and Johannes
Lijzen (2018), Circular Economy: what we want to know and can measure. Framework and baseline assessment for monitoring the progress of the
circular economy in the Netherlands. PBL Netherlands Environmental Assessment Agency, The Hague.
PBL Netherlands Environmental Assessment Agency is the national institute for strategic policy analysis in the fields of the
environment, nature and spatial planning. We contribute to improving the quality of political and administrative decision-making by
conducting outlook studies, analyses and evaluations in which an integrated approach is considered paramount. Policy relevance is
the prime concern in all of our studies. We conduct solicited and unsolicited research that is both independent and scientifically
sound.
Circular economy: what we want to know and can measure. Framework and baseline assessment for monitoring the progress of the circular economy in the Netherlands
© PBL Netherlands Environmental Assessment Agency The Hague, 2018PBL publication number: 3217
Corresponding [email protected]
AuthorsJosé Potting[1] and Aldert Hanemaaijer[1] (eds.), Roel Delahaye[2], Jurgen Ganzevles[3], Rutger Hoekstra[2] and Johannes Lijzen[3]
[1] PBL Netherlands Environmental Assessment Agency[2] Statistics Netherlands (CBS)[3] National Institute for Public Health and the
Environment (RIVM)
Lead authors Chapter 3: Jurgen Ganzevles and Johannes Lijzen (RIVM); lead authors Chapter 5: Roel Delahaye, Rutger Hoekstra and Kees Baldé (CBS); lead authors remaining chapters: José Potting and Aldert Hanemaaijer (PBL). Anne Hollander, Lavinda Kok, Joris Quik, Elias de Valk, Manon Zwart (all RIVM) and Guus van den Berghe and Mandy Willems (both RWS) contributed to the research for Chapter 3. Chapter 4 was co-authored by Marko Hekkert and Denise Reike of Utrecht University (UU). Patrick Bogaart, Krista Keller, Niels Schoenaker, Adam Walker and Bert Wit (all CBS) contributed to Chapter 5. Denise Reike (UU) contributed to Section 2.4.
GraphicsPBL Beeldredactie
Production coordinationPBL Publishers

Contents
Main findings 7
Summary and Main Findings 8
Full results 17
1 Introduction 181.1 Reasons for a circular economy 181.2 Dutch circular economy policy objectives and strategy 191.3 Monitoring the circular transition 201.4 Report structure 21
2 Underlying principles 222.1 Compatibility with policy evaluation scheme 222.2 Effect goals for resource use reduction 242.3 Achievement goals (~ strategic objectives) 262.4 Existing circular economy indicators 272.6 Interrelationships between monitoring components 282.7 Priority themes and monitoring 292.8 Tiered monitoring structure 292.9 In summary 30
3 Actions 323.1 Methodology 323.2 Baseline assessment – general results 333.3 Baseline assessment – intervention theme results 363.4 Baseline assessment actions – priority theme results 363.5 Further development of action monitoring 383.6 In summary 38
4 Transition dynamics 404.1 Underlying principles 404.2 Indicator framework 41

4.3 Developing quantifiable indicators 424.4 Available information 444.5 Baseline assessment 444.6 Future steps 454.7 In summary 45
5 Effects 465.1 What we want to know 475.2 What we can measure: national baseline assessment 495.3 What we can measure: baseline assessment of the priority themes 535.4 Effect monitoring: specific product groups 555.5 Growth model for effect monitoring 56
6 Reflection 586.1 Transition agenda monitoring 586.2 Status of baseline assessment 596.3 Status of monitoring system 606.4 International context 626.5 Growth model 62
7 Conclusions 64
Appendices 66Appendix 1: Glossary 66Appendix 2: Examples of circularity strategies per priority theme 70Appendix 3: Examples of action indicators 73Appendix 4: National effect monitoring conceptional framework 74Appendix 5: The five priority themes, per sector 80Appendix 6: Results per priority theme 81
References 86

MAIN FINDINGS
MAI
N F
IND
ING
S

8
| Circular economy: what we want to know and can measure
The Dutch Government has outlined its plans for the transition to a circular economy in the government-wide circular economy policy programme, entitled ‘A circular economy in the Netherlands by 2050’. A monitoring system is required to determine whether this transition is progressing as planned, a proposal for which is made in this report. This monitoring system will document ‘what we want to know, and what we can already measure’ (the latter being the baseline assessment).
In the monitoring system, a distinction is made between the desired effects and the transition process that needs to take place to bring about these effects. The most important desired effect of the transition to a circular economy is a reduced consumption of natural resources. This will result in fewer environmental effects (e.g. due to greenhouse gas emissions) and reduce our dependence on natural resource imports, and therefore increase resources supply security. Reducing natural resource consumption requires circularity strategies, for example by extending the lifetime of products and product components, such as for smartphones, or through encouraging the sharing of certain products, such as cars. This will call for efforts to ensure that such circularity strategies are adopted, for example by encouraging cooperation between product chain partners, removing regulatory barriers and designing circular products. This is a complex and, initially, slow process. Furthermore, it will take a while before the effects can be seen. Monitoring of both the transition process and its effects, therefore, is relevant.
In this report, we propose indicators for monitoring both the transition process and the effects achieved. We are already able to monitor the effects to some extent, in particular the effects of natural resource consumption, greenhouse gas emissions and waste and waste treatment. These effects are being monitored for the Netherlands as a whole and for the five priority themes of the government-wide programme: biomass and food, plastics, manufacturing, construction, and consumer goods. Transition teams have been appointed for each priority theme and have each drawn up a transition agenda (published at the same time as this report).
Not all the indicators proposed in the monitoring system can currently be measured; this applies in particular to those relating to the transition process. The monitoring system described in this report should therefore be regarded as a growth model. The aim is to develop the monitoring system further in the coming years, together with other knowledge institutes and partners involved in the five transition agendas.
Focus on reduction in natural resource consumption
In the 2016 government-wide circular economy policy programme, the Dutch Cabinet outlined its plans for the restructuring of the economy to achieve a circular economy that makes optimum use of natural resources. The government specified the following strategic objectives:1. Extend the lifetime of products and product
components and recycle materials to produce high-grade secondary materials (i.e. improve the natural resource efficiency in existing product chains).
2. If new natural resources are needed to produce new materials, use renewable and commonly available natural resources as substitutes for critical, not sustainably extracted or processed abiotic resources.
3. Design new products, develop new production methods and encourage new ways of consumption (i.e. invest in new product chains).
The government and its societal partners, thus, aim to reduce natural resource consumption while also minimising the risk to humans and the environment in the rest of the resource chain. The preliminary government target for 2030 is a 50% decrease in the use of primary abiotic resources (minerals, metals and fossil fuels), while the target for 2050 is a fully circular economy in the Netherlands. It should be noted that the government-wide policy programme does not give a
Summary and Main Findings

9Summary and Main Findings |
maximum figure for biomass consumption, even though biomass is an important renewable (biotic) natural resource with a limited supply.
Need to monitor circular economy progress
It is important to measure the progress being made in the transition to the circular economy. This helps both the government and its partners make sure the transition is on course, and enables course corrections to be made. At the request of the Dutch Government, PBL Netherlands Environmental Assessment Agency, Statistics Netherlands (CBS) and the National Institute for Public Health and the Environment (RIVM) have developed a monitoring system and baseline assessment made up of three monitoring components:
− actions from the government-wide policy programme (RIVM, in cooperation with Rijkswaterstaat);
− transition dynamics (PBL, in cooperation with Utrecht University);
− effects on natural resource consumption, the environment and the economy (CBS).
The aim of this system is to monitor the efforts made by government authorities and other societal partners, and to show the effects of these efforts. In this way, an evaluation can be made of the factors for success and failure in the transition process towards the circular economy. Based on the indicators for each of the monitoring components, the monitoring system can be used to analyse what we want to know, what we can already measure, and which elements of monitoring components require further development. ‘What we can already measure’ has been established as the baseline assessment. The results show us where we stand right now in the transition to the circular economy. What we want to – but cannot yet – measure sets the agenda for the further development of the monitoring system (see ‘Growth model’).
Transition process with future effects in mind
Although the transition to the circular economy is a long process, monitoring it as we go along helps us to understand the factors of success and failure, allowing course corrections to be made. Monitoring can also help us assess the feasibility of bringing about the desired effects in the long term. To do this, the monitoring
system makes a distinction between monitoring the transition process and monitoring the effects.
There are two components to the monitoring of the transition process: monitoring the transition dynamics and monitoring the actions. Transition dynamics monitoring identifies what is actually taking place in specific product groups, such as in terms of product design, and whether the proportion of circular products is increasing (and therefore the proportion of linear products is decreasing). The action monitoring shows the progress being made regarding the actions in the government-wide policy programme that are to accelerate the transition dynamic.
Effect monitoring shows the effects of the transition process on natural resource consumption, environmental pressure and socio-economic development (e.g. economic growth and jobs).
This distinction between transition process and effects follows a similar distinction as made in the policy evaluation scheme drawn up by the Netherlands Court of Audit (2005) (Figure 1). In this scheme, the transition process is similarly differentiated according to means, activities and achievements. Utilising means (input) and undertaking activities (throughput) ideally produces achievements (output) that bring about the intended effects (outcome).
Reduction goal needs further specification
For monitoring to take place, the preliminary goal – to halve the consumption of abiotic natural resources by 2030 – needs to be further elaborated. The first point for consideration is the base year. Following consultation with the former Dutch Ministries of Infrastructure and the Environment (IenM) and Economic Affairs (EZ)1, 2014 was chosen as the base year against which the 50% reduction goal is to be compared.
The second point concerns whether the 50% reduction goal only refers to natural resource consumption in the Netherlands (direct consumption), or also to the indirect resource consumption during the production of imported materials, product components and products (the footprint). Both can be meaningful, and the monitoring system, therefore, includes effect indicators for both direct consumption and footprints. The footprint indicators relate to the first and third strategic objectives of the government-wide policy programme (both focus on closing product chains). The transition agendas for the five priority themes also focus on chain responsibility.

10 | Circular economy: what we want to know and can measure
bioplastics, biomaterials, biofuels and other products. However, sustainable biomass is limited in its supply. In a circular economy, we need to make efficient use of all our natural resources, including biomass, and therefore produce and process it sustainably.
Fewer natural resources needed for ‘higher’ circularity strategies
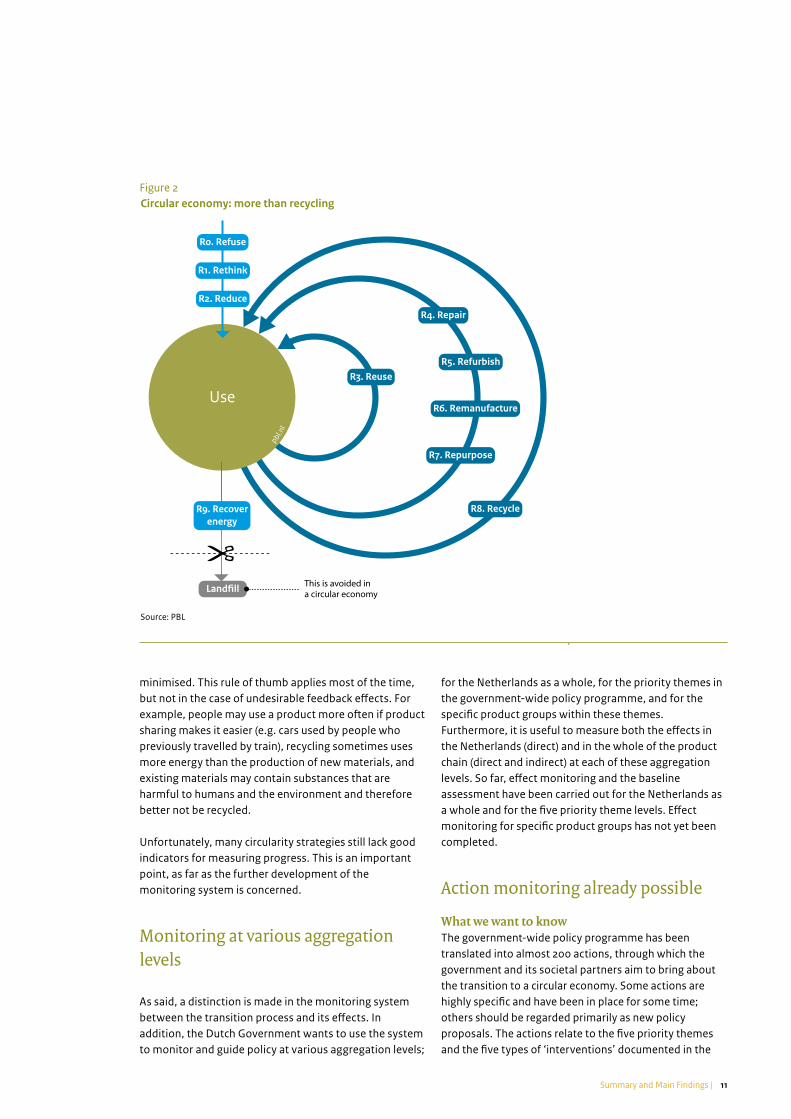
In pursuing the three strategic objectives of the government-wide policy programme, the aim is to halve the consumption of abiotic resources by 2030, and to achieve a fully circular economy in the Netherlands by 2050. The government aims to substitute abiotic resources for renewable and commonly available natural resources (second strategic objective), and to make efficient use of all natural resources in all product chains (first and third strategic objectives). Figure 2 shows the order of priority for circularity strategies; a ‘circularity ladder’ based on product function.
As a rule of thumb, circularity strategies higher up the ladder require fewer materials, and these materials are more often made from recycled (secondary) materials. This means that fewer natural resources need to be extracted to produce new (primary) materials. The environmental effects of this reduced natural resource extraction and primary material production are thus also
This leads, thirdly, to the question of whether the footprints apply to production or consumption in the Netherlands. The production footprint concerns the effects in the supply chain for everything that is produced in the Netherlands, while the consumption footprint relates to the effects along the entire product chain of products that are consumed in the Netherlands (by consumers, public bodies and business investments). Both approaches can be worthwhile.
Fourthly, specifying the 50% reduction goal in more detail may facilitate better management of the natural resources for which a reduction in consumption is the most urgent. For example, a higher reduction goal could be implemented for critical natural resources (e.g. rare earth metals) and natural resources the extraction and use of which exerts high environmental pressure (e.g. leading to greenhouse gas emissions).
The final and fifth point: does the reduction goal apply to the Netherlands as a whole, or should it be translated into separate reduction goals for each of the priority themes? This requires policy choices to be made. It should be noted that the 50% reduction goal cannot apply to the biomass and food priority theme. This is because biomass is one of the most important ‘renewable and commonly available natural resources’, to be used to substitute abiotic resources wherever possible (the second strategic objective). As a result, biomass will increasingly be used in the production of medicines,
Figure 1Policy assessment framework for measuring the progress of the transition towards a circular economy
Source: Netherlands Court of Audit 2005; adaptation by PBL
Output: Results of theactivities?
Outcome:E�ect results?
Policygoal
Means
Transition process(actions and transition dynamics)
E�ects
Achievements E�ectsActivities
Input: Actors, technology, funding?
Throughput:Who, when, what, how?
Approach Implementation Policy results Policy e�ects
E�ciency Autonomous factors
E�ectiveness
Transition towards a circular economy
During policy process(ex durante)
Proposed policy(ex ante)
Finalised policy(ex post)
- Resource use- Environmental pressures- Socio-economic developments
pbl.n
l
11Summary and Main Findings |
for the Netherlands as a whole, for the priority themes in the government-wide policy programme, and for the specific product groups within these themes. Furthermore, it is useful to measure both the effects in the Netherlands (direct) and in the whole of the product chain (direct and indirect) at each of these aggregation levels. So far, effect monitoring and the baseline assessment have been carried out for the Netherlands as a whole and for the five priority theme levels. Effect monitoring for specific product groups has not yet been completed.
Action monitoring already possible
What we want to knowThe government-wide policy programme has been translated into almost 200 actions, through which the government and its societal partners aim to bring about the transition to a circular economy. Some actions are highly specific and have been in place for some time; others should be regarded primarily as new policy proposals. The actions relate to the five priority themes and the five types of ‘interventions’ documented in the
minimised. This rule of thumb applies most of the time, but not in the case of undesirable feedback effects. For example, people may use a product more often if product sharing makes it easier (e.g. cars used by people who previously travelled by train), recycling sometimes uses more energy than the production of new materials, and existing materials may contain substances that are harmful to humans and the environment and therefore better not be recycled.
Unfortunately, many circularity strategies still lack good indicators for measuring progress. This is an important point, as far as the further development of the monitoring system is concerned.
Monitoring at various aggregation levels
As said, a distinction is made in the monitoring system between the transition process and its effects. In addition, the Dutch Government wants to use the system to monitor and guide policy at various aggregation levels;
Figure 2Circular economy: more than recycling
Source: PBL
Use
R0. Refuse
R1. Rethink
R2. Reduce
R3. ReuseR5. Refurbish
R6. Remanufacture
R7. Repurpose
R4. Repair
R8. Recycle
Land�ll
R9. Recoverenergy
This is avoided in a circular economy
pbl.nl

12 | Circular economy: what we want to know and can measure
Not all actions in the government-wide policy programme have been formulated as SMART actions; these therefore need to be clarified in terms of what they involve and what needs to be done and when. This also applies to the definition of the intended effect of the action or policy achievement. Actions that have already been initiated in the priority themes relate primarily to recycling and waste treatment or, more generally, to instrument or network development. Less attention has clearly been paid to circularity strategies higher up the ladder (Figure 3).
Monitoring transition dynamics in the start-up phase
What we want to knowThe starting point, speed and direction of the transition to the circular economy will vary, depending on the priority theme and its specific product group. Transition dynamics monitoring tracks the means, the activities and the resulting achievements for specific product groups. The three strategic objectives, with the circularity strategies as outcomes of the first and third objectives, represent the core achievements of the transition process that need to bring about a lower consumption of natural resources, fewer environmental effects and an increase in socio-economic development.
government-wide policy programme and, ideally, contribute either directly or indirectly to the natural resource reduction goal and the three strategic objectives.
Of course, monitoring should show the progress being made in terms of implementation of the actions, but also the extent to which the actions contribute to the transition dynamics and the intended effects (smart monitoring). This will help the government to ensure that the policy programme remains on course, while also making it easier to anticipate necessary corrections to the actions. The new actions named in the transition agendas have not yet been included in the monitoring system as described in this report, as the transition agendas and the monitoring system have been developed in parallel.
What we can already measure, and therefore know: baseline assessmentThe baseline assessment for action monitoring consists of preliminary results for 2017. A final assessment for 2017 will take place in early 2018. Data have been obtained for two thirds of the actions, and more than half the actions have now been initiated. Some actions need to wait for the completion of other actions; for example, the implementation of some actions depends on the biomass and food, manufacturing and construction transition agendas.
Figure 3
Refuse (R0)
Rethink (R1)
Reduce (R2)
Reuse (R3)
Repair (R4)
Refurbish (R5)
Remanufacture (R6)
Repurpose (R7)
Recycling (R8)
Recover energy (R9)
Generic
Unknown orirrelevant
0 10 20 30 40
actions
Source: RIVM 2017
pbl.n
l
Priorities
Biomass and food
Construction
Consumer goods
Plastics
Manufacturing
Actions government-wide policy programme circular economy, per circularity strategy, 2017

13Summary and Main Findings |
Although assigning an indicator to a circularity strategy helps to interpret the measured indicator, it may not provide all the necessary information. For example, rules and regulations may apply either to a specific product group, or to many product groups (e.g. the Ecodesign Directive). Because of such differences, additional information is needed to determine the level of influence per indicator. This type of monitoring, which produces qualitative information that requires further interpretation, is still relatively uncharted territory.
Some of the information about transition dynamics, such as that relating to investments, networks and knowledge exchange, is already available in knowledge and implementing organisations. An example is the information contained in the databases of government-subsidised projects run by the Netherlands Enterprise Agency (RVO.nl). This information still needs to be extracted from the databases, which means that the baseline assessment for transition dynamics is not yet complete.
Effect monitoring possible to some extent
What we want to knowEffect monitoring measures the consumption of natural resources and materials (various indicators), security of resource supply, environmental effects (water and land use, greenhouse gas emissions), growth in the circular economy and employment levels, for the priority themes and for the Netherlands as a whole. Some of the required indicators cannot yet be fully quantified. For example, the footprint indicators for natural resource use and environmental effects would ideally measure both the direct effect in the Netherlands and the effects in the product chain elsewhere. However, it is currently only possible to measure effects in the whole of the product chain (the footprint) for natural resource use and greenhouse gases, and not for water and land use. Possibilities for measuring the effects due to all manufacturers or all consumers are also limited. The measurement of such ‘sub-sections’ will enable further development and specification of the natural resource reduction goal in the government-wide policy programme. Monitoring the priority themes and the Netherlands as a whole makes use of the CBS databases. It is also interesting to know whether effects are the result of the implemented circularity strategies, or of other autonomous factors, such as population growth, economic growth or economic structure. Methods are being developed to determine how important each implemented circularity strategy or autonomous factor is
Circular innovation in product chains plays an important role in each of the three strategic objectives. Circular innovation could be represented by a smart revenue model, clever product design or a new technology (including materials made from renewable and commonly available natural resources). For these to be implemented in production processes and consumer goods, it is essential to work together both with the business community (circular production) and with consumers (circular consumption). This involves making changes to written and unwritten rules, customs and beliefs. To achieve this, innovating organisations need to work in a context that supports innovation. Such a context must make it possible for organisations:
− to be able to innovate, for example by funding innovation projects, circular knowledge development and experimentation;
− to be allowed to innovate, by changing rules and regulations;
− to want to innovate, for example by encouraging the development of a vision and cooperation in product chains and by making natural resource consumption financially unattractive through taxation.
This supportive context is primarily forged in the formative phase (pre-development and take-off), making a rapid increase in the share of circular products and services possible in the phase of growth (acceleration and stabilisation). Experience is still limited when it comes to monitoring the progress made in the – often long – formative phase. However, Table 4.1 of the report’s ‘Full Results’ section makes some suggestions for measurable and generic indicators to monitor ‘able, allowed and want’. As part of the continued development of the monitoring system, the decision may be made together with other societal partners to expand or refine this set of generic indicators, using indicators that are more specific to a priority theme or product group.
How we are going to monitor, and what this tells us The monitoring system needs to be developed further, over the coming years (growth model). This includes translating the transition dynamics indicators into concrete, measurable indicators. Indicators being monitored are distinguished according to the circularity strategy they contribute to. For example, the ‘number of introduced circular rules and regulations’ indicator will make it clear how many of those rules and regulations relate to materials and energy (R8 – R9), how many to extending the lifetime of products or product components (R3 – R7) and how many to the smarter production and consumption of products (R0 – R2). Recycling (R9) is still very much part of the linear economy, while the higher level circularity strategies (R7 – R0) come closer to the circular economy.

14 | Circular economy: what we want to know and can measure
macroeconomic effects are difficult to measure; partly because the share of circular activities in these organisation is difficult to determine.
Monitoring of transition agendas requires further elaboration
The national natural resources agreement (Grondstoffen-akkoord) gives a large role to societal partners in the transition to the circular economy. In parallel to the development of the monitoring system described in this report, five transition teams have worked hard to define transition agendas for the five priority themes of biomass and food, plastics, manufacturing, construction and consumer goods. The transition agendas include starting points for monitoring the agendas and their effects. The transition agendas are written in the context of the day-to-day work of the transition teams, influenced for example by the activities of the business community and environmental and consumer organisations. However, a more theoretical approach has been taken to the development of the monitoring system, and work needs to be done to reconcile the two.
The transition agendas and interviews with the transition teams make it clear that there is a need for unambiguous, controllable and independent methods to determine the environmental pressure caused by a product chain (life-cycle assessment). There is also a need to measure the preservation of value in specific product group chains. A method for calculating environmental pressure has been developed for the construction sector: the environmental performance of buildings and civil engineering works (Milieuprestatie gebouwen en GWW-werken), making use of the national environmental database (NMD). This requires further development to evaluate the different circularity strategies. Similar methods and databases could be developed and implemented for other product groups.
Growth model
The monitoring system helps us to analyse what we want to know, what we can already measure, and which monitoring system components require further development. It is, therefore, not yet complete. It seems sensible to continue its development in collaboration with societal partners and other knowledge institutes in the Netherlands, and the following steps are advised, for the coming years:
for natural resource consumption, environmental effects and socio-economic development (decomposition model).
What we can already measure, and therefore know: baseline assessmentIt is already possible to monitor some of the effects for the Netherlands as a whole and for each of the priority themes, in particular in relationship to natural resource consumption, greenhouse gas emissions and waste, waste treatment and recycling. The direct use of 314 billion kilos of natural resources in Dutch manufacturing in 2016 remained roughly constant, compared with 2014, but decreased by about 7% compared with 2010, mainly due to a decrease in mineral imports and natural gas extraction. However, the use of natural resources in the product chain increased by 3% compared with 2010, mainly due to increased imports of semi-manufactured goods and final products. This, however, may not represent a structural trend as it concerns a relatively short and economically turbulent period (i.e. the economic crisis).
Natural resource consumption in the product chain – the natural resource footprint – showed a slight decrease in 2016 when compared with 2014, but a 26% decrease compared with 2010. This is mainly due to decreased mineral imports for the construction sector during the economic crisis. However, economic recovery in the sector will again cause an increase in the consumption of natural resources.
The Netherlands has been at the forefront of recycling in Europe for many years, with over 80% recycling and material productivity (euros/kilos material). However, the use of secondary materials in the Dutch economy is just 8%. This huge difference can be explained by the fact that much more material is required as input than can be produced through recycling. This is because many materials are physically ‘stored’ in products with a long service life, such as buildings. In addition, a large proportion of natural resource use in the Netherlands is for food and energy (which can never be based for 100% on secondary materials). The goal to halve the use of abiotic resources, therefore, represents a considerable challenge.
The Netherlands’ greenhouse gas footprint is smaller than direct greenhouse gas emissions in the Netherlands. The reason for this is that we export energy-intensive products. Although only a limited number of companies in the environmental sector currently focus on reducing natural resource consumption, this number did grow between 2010 and 2016. The same also applies to employment levels in this sector. However, these

15Summary and Main Findings |
Important developments for the medium to long term − Continue to develop the monitoring system to include
scenario studies of future natural resource demands within global limits.
− Coordinate the Dutch monitoring system with those of other EU Member States and the European Commission.
The Netherlands internationally at the forefront
The European Commission first published the EU Resource efficiency scoreboard in 2013; this shows the resource efficiency of individual Member States and the EU as a whole. Another set of 10 indicators for the circular economy was proposed in mid 2017, primarily for natural resource consumption, waste production and recycling. Other aspects of the transition to the circular economy receive only limited attention. Furthermore, the 10 indicators have been developed to measure progress in individual Member States and in the EU as a whole, and are therefore less suited to monitoring the progress made in the priority themes and specific product groups.
The monitoring system described in this report goes beyond these 10 EU indicators. It systematically and comprehensively analyses what the current effects of the transition process are, and which conditions the transition process should meet to bring about the desired effects. It has also been developed to enable monitoring of the progress made, not just in the Netherlands as a whole, but also within the priority themes and the specific product groups. Furthermore, the aim of the monitoring system is to measure effects in the Netherlands (direct effects), as well as in the whole of the product chain (direct and indirect effects). The product chain approach is important, because many natural resources, semi-manufactured goods (materials and product components) and products used by Dutch manufacturers and consumers are imported from other countries (indirect effects).
The Netherlands is at the forefront, internationally, with this comprehensive monitoring system. Monitoring progress towards the circular economy includes monitoring the transition process (action monitoring and transition dynamics monitoring) and effect monitoring. The transition dynamics monitoring represents an innovative contribution that may provide additional options for course correction in policy development. Regarding the further development of the monitoring system, it is important to bear in mind the balance between the administrative burden on companies and the value of the information that the indicators provide.
Decide on the reporting structure − Identify a finite set of key indicators for a quick
overview and dashboard indicators for a more detailed analysis (layered monitoring structure).
− Publish information online (continuous reporting) and regularly produce progress reports to interpret figures and trends.
− Aim for a circular equivalent of the National Energy Outlook that shows how the transition is progressing, including an evaluation of implemented policy.
Continue to develop existing monitoring components − Enable monitoring of not-yet-measurable effect
indicators (e.g. footprints and critical natural resources) using the materials monitor and other CBS data.
− Enable monitoring of the circularity strategies at various aggregation levels, such as for the Netherlands as a whole, per priority theme and sector, and for specific product groups.
− Enable monitoring of not-yet-measurable transition dynamics indicators by extracting data from information that is already available, for example from RWS, RVO, provinces and municipalities.
− Continue to develop action monitoring: cluster actions for a better overview, link actions to transition dynamics and effect indicators, and make a connection with new actions generated by the transition agendas.
− Develop a decomposition model to analyse the relationships between effect and circularity strategy monitoring results and autonomous factors.
− Extend the monitoring system to explore the relationship between the role of societal partners and the various phases in the transition towards the circular economy.
− Find out how the transition to a circular economy will contribute to a healthy and safe physical environment and therefore minimise risks to humans and the environment. This includes the development of a better analysis of the toxicity of substances in material flows that are candidates for recycling.
− Enable comparison between the monitoring system with two transition phases described in this report (the formative and growth phases) and the four-phase monitoring system for the energy transition (pre-development, take-off, acceleration and stabilisation) by adjusting one or both monitoring systems accordingly.
Ideas from the transition agendas − Include monitoring of transition agenda actions − Develop unambiguous, controllable and independent
methods for determining environmental effects (life-cycle assessment) and value retention for specific product groups.
− Develop specific indicators for the priority themes and include these in the monitoring system where necessary.

16 | Circular economy: what we want to know and can measure
Note
1 Under the current, new government: Ministry of
Infrastructure and Watermanagement (IenW) and Ministry
of Economic Affairs and Climate (EZK).

FULL RESULTS
FULL
RES
ULT
S

18
ON
E
| Circular economy: what we want to know and can measure
Introductionone
In September 2016, the Dutch Government (‘Rutte II’) presented the House of Representatives with the government-wide policy programme A circular economy in the Netherlands by 2050 (IenM and EZ, 2016a,b). This policy programme outlines the government’s vision for a future-proof and sustainable economy – the circular economy – that uses fewer natural resources and extracts and processes those that are used in a more sustainable way. The government-wide policy programme considers natural resource consumption to be the largest challenge we face in the 21st century. The Dutch Government included the programme in its 2017 Coalition Agreement.
To determine whether the transition to the circular economy is progressing as planned, we need to define the starting point (baseline) and monitor the progress made. With this in mind, the former ministries of Infrastructure and the Environment (IenM) and Economic Affairs (EZ) – now Infrastructure and Water Management (IenW) and Economic Affairs and Climate Policy (EZK) – asked PBL, CBS and RIVM to develop a monitoring system and baseline assessment. In this report, we describe the principles behind and the development of the monitoring system and baseline assessment. This introductory chapter first explains why the circular economy is so important (Section 1.1), then goes on to give an overview of the government-wide policy programme (Section 1.2). Section 1.3 describes the aim of the monitoring and intended purpose of this report, and Section 1.4 outlines its structure and content.
1.1 Reasons for a circular economy
The global consumption of natural resources has increased eightfold over the last century (Krausmann et al., 2009; UNEP, 2011), and the world’s richest countries currently consume, on average, 10 times more natural resources than the poorest countries. Over the last few decades,
this increase in natural resource consumption has been driven by income growth rather than population growth (UNEP, 2016). In recent years, we have seen a decrease in poverty and an increase in wealth, on a global level; in particular, in upcoming economies such as those of Asia and Latin America (PEW, 2015; World Bank, 2016). The World Bank (2016) expects this trend to continue, while the United Nations predict ongoing population growth, from currently over 7 billion people to almost 10 billion by 2050 (UN, 2015). All else being equal, this therefore means a roughly threefold increase in global natural resource demand (UNEP, 2011). Such growth, however, is unsustainable, as increasing demand for natural resources can result in competition for these resources, leading to economic and geopolitical tension (IenM and EZ, 2016a; UNEP, 2011, 2016).
One of the main problems associated with an increase in natural resource consumption is an increase in the already large pressure on the environment. This may be expressed, for example, as climate change, biodiversity loss, or natural capital loss and degradation (IenM, 2016a; Krausman et al., 2009; UNEP, 2011). Natural resource use by the Netherlands causes environmental pressure both in the Netherlands and abroad, as the extraction of those resources and the manufacturing of semi-manufactured goods and products for Dutch consumption and production largely take place outside the Netherlands. However, the processing of imported natural resources, such as petroleum, and those extracted in the Netherlands, such as natural gas and gravel, only cause environmental pressure in the Netherlands. The use of products (and their treatment) once they have been discarded also causes environmental pressure, especially if discarded products are incinerated or disposed of as landfill (Vollebergh et al., 2017). Although waste disposal as landfill is practically banned in the Netherlands (BBSA, 2012, 2001), it is more common in other countries, both in Europe and in the rest of the world (e.g. see EEA, 2016a).

191 Introduction |
ON
E
ONE
According to the government-wide policy programme, the conservation of natural capital and reduced environmental pressure from direct and indirect natural resource use by the Netherlands are important reasons for switching to a circular economy (IenM and EZ, 2016a,b). In fact, these are the main reasons as far as some societal partners (MVO, 2015) and scientists are concerned. However, the government-wide policy programme also gives resource availability, or security of resource supply, as another important reason for the circular economy (IenM and EZ, 2016a,b).
The Netherlands extracts its own natural resources, but is also a net importer of many smaller resource flows and bulk commodities, such as petroleum, some agricultural crops (including soya for cattle feed), sand, gravel, iron and steel (CBS, 2016a). Many natural resources are also imported indirectly in semi-manufactured goods and final products. Following the European Commission (EC, 2014a,b, 2010), Bastein and Rietveld (2015) assessed the importance and security of supply (criticality) of 64 minerals and metals, ordering them according to this criticality. The low security of supply of critical resources and the dependence on the import of these critical resources present a risk in terms of the stability of the Dutch economy. Some Dutch companies, in particular in the metal and high-tech sectors, are already experiencing problems with the security of supply of natural resources (Bastein and Rietveld, 2015), M2i/TNO/TUD, n.d.). Bastein and Rietveld (2015) also assessed the influence on economic sectors of price volatility and reputational damage due to environmental pressure, poor social conditions and legislation relating to conflict minerals. The electronics, electrical equipment, machinery, metal production and transport equipment sectors are particularly susceptible, and these are also the sectors that use relatively more of the critical minerals and metals assessed in the study.
Enthusiasm for the circular economy is high in the Netherlands (Jonker et al., 2017; Nederland Circulair!, n.d.; Remmerswaal et al., 2017) as it is seen as a solution to the supply security issue, while also offering opportunities for the Dutch economy and boosting its international competitive position (Bastein et al., 2015; Bastein and Rietveld, 2015; IenM, 2016a,b; Nederland Circulair!, n.d.). Bastein et al. (2013) estimated that the circular economy could generate over 7 billion euros and about 54,000 new jobs, although it should be noted that the effect of changes in the economic sectors examined on other sectors was not included in the estimation (SER, 2016).
1.2 Dutch circular economy policy objectives and strategy
It is against this background that the government and its societal partners want the Netherlands to accomplish a transition to an economy in which efficient use and optimum reuse is made of natural resources, and natural resources are extracted in a sustainable manner. Fewer natural resources are needed, because more efficient products and services are developed, and risks to health and the environment are minimised (IenM and EZ, 2016b). The preliminary target for 2030 is a 50% reduction in the use of primary abiotic resources (minerals, metals and fossil fuels), and the Netherlands wants to be fully circular by 2050 by using sustainably extracted, renewable and widely available natural resources, wherever possible (IenM and EZ, 2016a). This goal goes beyond the goals of other European countries, with the possible exception of Germany and Austria. Austria aims to double its resource productivity by 2020 compared with 2008, and to increase it by 4 to 10 times by 2050. Germany wants to double its abiotic resource productivity by 2020 compared with 1994 (EEA, 2016b). However, resource productivity is a relative measure, which means that – while Germany and Austria have set relative goals (improve resource productivity) – the Netherlands has set an absolute goal (to halve primary abiotic resource use by 2030).
The Dutch goal does however need further elaboration. For example, it could be differentiated into natural resources for which a reduction is urgent, and those for which such a reduction is less urgent. This could result in a larger reduction goal for critical resources (e.g. rare earth metals) and natural resources that cause large environmental pressure (e.g. greenhouse gas emissions). There are also other reasons why further elaboration of the reduction objective is desirable (see Section 2.2).
As described in the government-wide policy programme, a circular economy requires a change in the way we use our natural resources. Three strategic objectives have been defined that aim to accelerate the transition to the circular economy (IenM and EZ, 2016a):1. Make better use of natural resources in existing
product chains by using and reusing products and product parts and recycling of materials as efficiently as possible, therefore minimising the risk to people and the environment. This should reduce resource demand in existing product chains.

20 | Circular economy: what we want to know and can measure
ON
E
1.3 Monitoring the circular transition
It is important to measure the progress being made in the transition to the circular economy, as this helps both the government and societal partners understand whether the transition is proceeding as planned or whether course corrections need to be made. The development of a monitoring protocol was announced in the government-wide policy programme (IenM and EZ, 2016a) and, in its natural resources agreement (Grondstoffenakkoord, 2017), the government gives knowledge institutes the assignment to develop this monitoring system and baseline assessment, based on the widely accepted, relevant physical, economic and social indicators, which focuses on:
− the progress of the agreed actions; − developments in resource flows to, within and from the
Netherlands; − transition dynamics (where we are in the transition, the
role of individuals and organisations in the transition, and how to couple partner interventions to the transition phase of each product chain or sector).
PBL (project leader), Statistics Netherlands (CBS) and the National Institute for Public Health and the Environment (RIVM) were commissioned by the Dutch Government to develop a monitoring system and conduct a baseline assessment. Other knowledge institutes were asked to contribute on specific areas (see below). Analogous to the three parts of the natural resource agreement, the monitoring system and baseline assessment are also divided into three monitoring components:
− actions from the government-wide policy programme (RIVM, Rijkswaterstaat);
− effects on natural resource use, the environment and the economy (CBS);
− transition dynamics (PBL, Utrecht University).
The monitoring system has been presented to the Dutch House of Representative in 2018.
Development of the monitoring system starts with an analysis of what is needed to measure the progress being made towards a circular economy and what is already possible in terms of available indicators and data, both for the Netherlands as a whole and for priority themes and specific product groups within these themes. Although indicators have been proposed for measuring such progress, most of these focus primarily on effects. Only a few relate to transition dynamics but, even then, they monitor at country level only, and do not consider product chains (see Section 2.4, for an overview).
2. If new natural resources are needed to produce new materials, substitute abiotic resources with renewable, widely available natural resources. This should conserve natural capital.
3. Develop new production methods and product designs, encourage new ways of consuming and implement new forms of spatial planning. This should result in new product chains that make it even easier to achieve the required reduction (first strategic objective) and substitution (second strategic objective).
The Council for the Environment and Infrastructure (Rli, 2015) and the Social and Economic Council of the Netherlands (SER, 2016) have listed the obstacles to the circular economy. The government-wide policy programme aims to remove these obstacles with the implementation of five interventions (stimulative legislation, smart market incentives, funding, knowledge and innovation, and international cooperation). For each of these interventions, the policy programme indicates which concrete actions the government has undertaken and which are still to be implemented. These intervention actions form the programme’s generic change policy (IenM and EZ, 2016a). Change in behaviour is also named as an important theme in the policy programme.
The government is aware that the transition to a circular economy also requires a specific transformation policy for each economic sector or resource chain. The focus in the government-wide policy programme is on five priority themes that are important for the Dutch economy, cause large environmental pressure and have already mobilised substantial societal interest in terms of the transition to a circular economy. The priority themes in the Dutch policy programme are biomass and food, construction, consumer goods, plastics and manufacturing (IenM and EZ, 2016a), and are consistent with the focal areas of the European Commission as described in its action plan for the circular economy in Europe (plastics, food waste, critical resources, construction and demolition, biomass and bio-based products) (EC, 2015).
For each of the five priority themes, the Dutch policy programme describes which actions are currently ongoing and which are to be initiated (IenM and EZ, 2016a). The government has also drawn up a natural resources agreement (Grondstoffenakkoord) with over 325 societal partners (companies, financial institutes, trade associations, employee organisations and knowledge institutes) (Grondstoffenakkoord, 2017; Programmabureau Nederland Circulair, 2017). Based on this agreement, transition teams are currently working on developing a transition agenda for each priority theme, to be published at the same time as this report.

211 Introduction |
ON
E
ONE
1.4 Report structure
In this report, we describe the monitoring system and baseline assessment in terms of what we want to know and what we can measure now (baseline) in the circular economy. In Chapter 2, we present the underlying principles and conceptual framework for the monitoring system. This system and the baseline assessment are then described further in the following chapters (actions in Chapter 3, transition dynamics in Chapter 4 and effects in Chapter 5). In Chapter 6, we reflect on the monitoring system as described in Chapters 3 to 5. Finally, the main conclusions are presented in Chapter 7.

22
TWO
| Circular economy: what we want to know and can measure
Underlying principlestwo
This chapter discusses the principles that underlie the monitoring system and the three monitoring components (action monitoring, transition dynamics monitoring and effect monitoring), as well as the baseline assessment. It also briefly addresses the interrelationships between the three monitoring components. A general explanation is also given of the key concepts of natural resources, materials and products. Other terms and concepts are introduced where relevant, and a description of all the terms and concepts used in the report can be found in Appendix 1.
The main aim of the circular economy is to reduce natural resource use (which has several positive effects; see Chapter 1). In practise, the terms resource and material are often used interchangeably. In this report, however, the term ‘resource’ means something that is extracted from nature (e.g. sand, petroleum or flax). A resource is therefore always new or primary (i.e. never secondary). Resources are used to make new primary materials such as glass, plastic or linen, which in turn are used to manufacture products such as drinking glasses, plastic bottles or linen clothing. In some cases, a resource and a material, or a resource and a product, may be more or less the same thing (groundwater and drinking water, or fruit on a tree and fruit sold in a shop). Usually, however, a number of processing steps are required to make a primary material from a resource, and then to turn this into a product. It is also possible to extract materials from discarded products, and these materials are then called secondary materials or recyclate. Materials can therefore be primary (new) or secondary (recycled).
2.1 Compatibility with policy evaluation scheme
To monitor the transition to the circular economy, a distinction should be made between the effects that the government-wide policy programme aims to bring about,
and the change (transition) process that should result in these effects (Potting et al., 2016). The circular transition therefore consists of the transition process and the effects of that process. This distinction is made clear in the three monitoring components that the three knowledge institutes were asked to develop. Monitoring the actions and the transition dynamics measures the progress made in the transition process, whereas monitoring the effects measures progress towards the desired effects of the transition process on resource use, environmental pressure and socio-economic development.
This distinction – between the transition process and its effects – is also clearly seen in the policy evaluation scheme drawn up by the Netherlands Court of Audit (AR, 2005). This scheme forms the basis of the Netherlands Court of Audit guidelines for evaluating government policy in terms of cost (efficiency) and result (effectiveness) – since 1991 a legal requirement for Dutch ministries, who must submit all policy to a periodic evaluation of efficiency and results effectiveness (AR, 2005).
The Court of Audit policy evaluation scheme consists of four aspects (means, activities, achievements and effects), which can also be regarded as the four phases of the policy process (input, throughput, output and outcome). The aim of the first three aspects or phases is to initiate a change process. Utilising means (input) and undertaking activities (throughput) results in achievements (output) that bring about the intended effects (outcomes) (AR, 2005). The full policy process therefore consists of the change process (here the transition process) and the intended effects (here transition effects, or effects). The policy evaluation scheme, and the place of the three monitoring components within the scheme, is shown in Figure 2.1.
The monitoring system is particularly useful for assessing the effectiveness of the government-wide policy programme. This concerns the effectiveness of both the transition process and its intended effects. There are two

232 Underlying principles |
TWO
TWO
reasons why we need to evaluate the effectiveness of the transition process and the intended effects.
1: Obtain insight into the progress made in the transition process before the effects become visibleOur current economic system is very much based on prevailing social and institutional structures. For a transition to a circular economy to take place, these existing structures need to be replaced with new social and institutional structures. Take, for example, the switch from coal to natural gas in the 1960s. As well as requiring changes to the physical infrastructure (gas pipes and stoves), gas fitters and households also had to get used to working with gas. The transition process, which involves dismantling old and building up new social and institutional structures, can take a long time – in some cases several decades. It can therefore take a while before the effects of this transition process become visible (Loorbach et al., 2014). This is why the government-wide policy programme has set the preliminary 50% reduction target for 2030 (12 years from today) and the final, fully circular economy target for 2050 (32 years from today). As it takes this long for the effects of the transition process to become visible, it is useful to monitor the progress being made.
2: Correct the transition process based on success and failure factorsUsing measured indicators for the transition process and its effects, it is possible to assess whether the means and
activities employed lead to the desired achievements and therefore the intended effects. For example, have the means and activities employed led to fewer regulatory barriers, more reparation of products and higher quality recycling? Have these achievements reduced resource use and environmental pressure? Are these developments improving health and safety? To assess whether the effects are in fact the result of the transition process, we also need to understand the influence of autonomous factors (AR, 2005), such as developments in the economy and population. The analysis must therefore assess whether the measured effects can in fact be traced back to the employed means and activities and achievements. The relationships found between effects, achievements, activities and means can provide information about success and failure factors, enabling course corrections to be made in the transition process. The monitoring therefore also serves as an input into a management system.
2.2 Effect goals for resource use reduction
The Dutch Government and its societal partners aim to achieve a fully circular economy in 2050 by making use of sustainably extracted, renewable and widely available natural resources, wherever possible. Consumption of these resources will therefore increase, but the
Figure 2.1Policy assessment framework for measuring the progress of the transition towards a circular economy
Source: Netherlands Court of Audit 2005; adaptation by PBL
Output: Results of theactivities?
Outcome:E�ect results?
Policygoal
Means
Transition process(actions and transition dynamics)
E�ects
Achievements E�ectsActivities
Input: Actors, technology, funding?
Throughput:Who, when, what, how?
Approach Implementation Policy results Policy e�ects
E�ciency Autonomous factors
E�ectiveness
Transition towards a circular economy
During policy process(ex durante)
Proposed policy(ex ante)
Finalised policy(ex post)
- Resource use- Environmental pressures- Socio-economic developments
pbl.n
l

24 | Circular economy: what we want to know and can measure
TWO
Direct use, use in the chain and 50% reduction goalIt is important to establish whether the 50% reduction goal only applies to resource use in the Netherlands (direct consumption), or whether it also includes indirect resource use in the rest of the product chain of imported materials, products and product parts. Together, direct and indirect use form the product chain (the footprint). A product chain approach, therefore, means that all resource use is taken into account, including the indirect effects.
The ex-ante evaluation of the government-wide policy programme by Bastein et al. (2017) assumes a 50% reduction in direct ‘material’ use in the Netherlands. This includes resources that are extracted in or imported into the Netherlands (direct use), plus resources that are physically stored in semi-manufactured goods (materials and product parts) and products (indirect use). This direct and indirect use covers almost the whole of the product chain (over 90%), but excludes resources that are not physically stored in imported semi-manufactured goods and products (e.g. fossil fuels for energy and cooling water). Bastein et al. (2017) have estimated that this indirect, additional resource use, may be as much as almost 8% for forestry and almost 7% for the textile, clothing and leather industry.
Both the ex-ante evaluation by Bastein et al. (2017) and the focus of the government-wide policy programme on product chains in its first and third strategic objectives (IenM and EZ, 2016b) suggest that the 50% reduction goal applies to resource use in the whole of the product chain, rather than just to direct resource use. This product chain approach is also clearly visible in the transition teams’ agendas for the five priority themes, which focus in particular on product chain responsibility (Transitieteams, 2018).
Dutch production and consumption and 50% reduction goalThe government-wide policy programme does not assign any particular responsibility for achieving the 50% reduction goal (production, consumption, or both). A large proportion of the products manufactured in the Netherlands are exported and therefore not consumed in the Netherlands. Conversely, statistically speaking, a large proportion of the products, final products and final consumption in the Netherlands is related to import. In statistical terminology, final consumption also includes consumer and government spending and company investments, and it may be useful to assess the contributions made by each of these. The extraction of resources and the production of semi-manufactured
government-wide policy programme states that optimum use should be made of all resources by 2050 (not just abiotic resources), although this is not quantified. However, a quantitative, preliminary goal has been set for 2030, which is to reduce abiotic resource use by 50% (IenM and EZ, 2016a). It is important that this 50% reduction goal is elaborated further, to be able to monitor progress towards the circular economy.
Base year for 50% reduction goal The government-wide policy programme does not name a base year against which the 50% reduction in abiotic resources is to be measured (IenM and EZ, 2016b). Although resource use in the Netherlands decreased by 14% between 2004 and 2014, it fluctuates slightly from year to year. Furthermore, resource use in 2013 was significantly lower than in the previous and following year. As 2014 is the most recent year for which consolidated CBS data is available, this year was chosen as the base year, in consultation with the ministries of IenW and EZK. The baseline assessment of the effects will therefore be carried out for this year (CBS, 2016).
Resources and 50% reduction goal The 50% reduction goal in the government-wide policy programme applies to abiotic resources in general (IenM and EZ, 2016b). In the ex-ante feasibility study of the government-wide policy programme, carried out by Bastein et al. (2017), a 50% reduction is assumed for each individual resource. The 50% reduction can also be taken to be an average, in which case further specification of the reduction goal per resource would be required, as otherwise the goal could be achieved by focusing purely on reducing the use of widely available minerals, such as sand and gravel. Minerals dominate resource use in the Netherlands, but are less dominant than metals and fossil fuel in terms of their contribution to greenhouse gas emissions and water and land use (Bastein et al., 2017). Stricter reduction goals could therefore be set for critical resources and resources with a higher environmental impact during extraction or processing (Section 1.1). After all, these are the resources for which a reduction is most urgent.
Priority themes and 50% reduction goal In its natural resources agreement with societal partners, the Dutch Government strongly promotes the role of the transition teams in the transition towards a circular economy. Even so, the 50% reduction goal in the government-wide policy programme (IenM and EZ, 2016b) is not included in the agreement (Grondstoffenakkoord, 2017). As with resources, it may be useful to differentiate the reduction goal according to the five priority themes.

252 Underlying principles |
TWO
TWO
study by Van der Esch et al. (2017) concluded that a growing world population and increasing prosperity, combined with continued land degradation, will result in greater competition for land in the future, and possible conflict over land for, for example, food and biofuel production and that used for nature and tourism. This study included biomass for green energy, but not for biomaterials. Many research projects are currently being carried out into the possibilities of biomaterials (e.g. bioplastics) and biochemicals (e.g. see Ganzevles et al., 2016). Although these projects focus primarily on waste biomass from agriculture and food manufacturing, it is clear that there are limits to the amount of biomass available for producing materials.
2.3 Achievement goals (~ strategic objectives)
The government-wide policy programme aims to substitute abiotic resources with renewable and widely available resources (second strategic objective), wherever possible, and reduce all resource use by using resources as efficiently as possible in existing product chains (first strategic objective), and by developing new product chains for new ways of consumption and production (third strategic objective) (IenM and EZ, 2016b).
Regarding the first and third strategic objectives, PBL published a circularity strategy ladder in 2016 that aims for reduced resource use in product chains (Figure 2.2) (Potting et al., 2016). The circularity ladder prioritises the order in which more efficient products and services should be developed in existing (first strategic objective) and new (third strategic objective) product chains. The
goods (materials and product parts) and products to be used in Dutch production and consumption have significant environmental impacts outside the Netherlands. It is therefore useful to consider both the production and the consumption perspectives.
The points named above are important for answering questions such as ‘Who causes what, and what is the best way to define the goal, given the desired objectives and effects?’ In fact, this all comes down to responsibility. We need to obtain clearer answers to questions such as ‘Who is responsible for what, and how should this responsibility be apportioned?’ (Table 2.1). To answer these questions, the 50% reduction goal needs to be formulated more specifically to be able to measure the progress towards the circular economy. The ‘smart’ differentiation of the 50% reduction goal by resource can clarify the extent to which the reduced use of each resource contributes to an increase in security of resource supply and a decrease in environmental pressure (climate change, biodiversity loss and natural capital loss and degradation). After all, it is not so much about quantity, but about the impact of resource use on the environment and security of resource supply. This should therefore be taken into account in the further elaboration of the 50% reduction goal for abiotic resources in 2030.
Limit to renewable resource useThe second strategic objective in the government-wide policy programme states that fossil, critical and unsustainably produced resources are to be substituted with renewable and widely available resources wherever possible. In general, ‘renewable resources’ are taken to mean biomass. However, as is correctly noted in the biomass and food transition agenda (Transitieteams, 2018), there are limits to the use of biomass. A recent
Table 2.1 Division of responsibilities
What is the Netherlands responsible for?
Direct use (resource use in the Netherlands): Use of resources extracted in the Netherlands plus imported and minus exported resources
Use in the product chain (resource use for the Netherlands): Direct plus indirect resource use for imported products and semi-manufactured goods (materials and product parts) by the Netherlands, minus exported ones.
Where does responsibility lie in the Netherlands?
Production: Resource use for products and semi-manufactured goods (materials and product parts) produced in the NetherlandsConsumption: Resource use for products consumed by households, government and companies (investments) in the Netherlands
How should this responsibility be divided?
Would the 50% objective apply to each separate part, or should the percentage for some parts be a higher or lower?• critical and non-critical resources• resources with high environmental impact • the five priority themes

26 | Circular economy: what we want to know and can measure
TWO
point in the circular economy (e.g. if car-sharing vehicles really have come to the end of their lives), then recycling is still a possible circularity strategy. Currently, the recovery and recycling of materials from discarded products often produces materials that cannot be used to make the same product, due to pollution and mixing of materials (which reduce quality). In many cases, therefore, these materials find an application in other products with lower quality requirements. For example, recycled mixed plastic is used to make reflective posts. Incineration with energy recovery is a final possibility, but as this destroys the product and its parts and materials, it is not considered a circularity strategy in this report.
In a circular economy, the materials that are recovered or recycled from discarded products ideally retain their original quality so that they can be applied again in a similar product (without harming people or the environment). For example, concrete is recycled to be used again as concrete in a new building. This means that, given a sufficient supply of recyclate, natural resources are no longer needed to produce materials, and discarded products no longer become waste. However, this ‘ultimate circularity’, in which a product chain is closed because the materials can be applied over and over again, is probably not feasible in practice. Even so, it is the ideal situation that the circular economy aims to bring about.
The PBL circularity ladder takes the prevention (R0–R2) and reuse (R3–R7) in the Lansink Ladder, named after a government resolution of MP Ad Lansink that was adopted by the House of Representatives in 1997, a step further. Since its adoption, the Lansink Ladder has played an important role in Dutch and European waste policies (waste hierarchy; e.g. see EC, 2010a). The government-wide policy programme represents a shift in focus from waste to resources (IenM and EZ, 2016a; Blomsma and Brennan, 2017).
2.4 Existing circular economy indicators
Many indicators are available for measuring effects on resource use, environmental pressure and socio-economic development, on both national and international levels. However, as appears from reviews conducted by, for example, CSR Netherlands (MVO Nederland, 2015), RIVM (2016) and EEA (2017), not many indicators exist for measuring transition dynamics. This is not immediately obvious from the overview in Table 2.2 of internationally available, policy-relevant sets of indicators for monitoring the transition to the circular economy or the strongly related policy area of resource efficiency. Looking more
PBL circularity ladder is based on product function, whereas other circularity ladders focus mainly on products (e.g. see CE and MVO, 2015; EMF, 2013; RLI, 2015; Vermeulen et al., 2014).
As a rule of thumb, resource use, and therefore environmental pressure, decrease the higher the circularity strategy is on the ladder (and therefore the lower R is). The logic behind this is simple: fewer primary materials are required if secondary materials are recovered from discarded products and product parts, if fewer materials are required because products and their parts are used for longer, and if products are manufactured and used more intelligently. If fewer resources are needed to produce new materials, this also reduces the environmental pressure of resource extraction and of every subsequent step in the chain.
This rule of thumb no longer applies if more resources are used due to undesirable rebound effects, for example if people use a product more often if product sharing makes this easier (people who previously travelled by train take part in a car share scheme), or if recycling uses more resources (e.g. for energy) than the production of new materials.
The ‘Value Pyramid’ and ‘Moerman’s Ladder’ – which is similar to the circularity ladder shown in Figure 2.2 – are also sometimes used to prioritise circularity strategies for the biomass and food priority theme (Rood et al., 2016). This is illustrated in Appendix 2, which also provides concrete examples of each circularity strategy named in Figure 2.2 for the other priority themes.
As we said, the PBL circularity ladder (Potting et al., 2016) focuses on product function, and therefore differs from most other circularity ladders, which usually focus on the product itself (e.g. see CE and MVO, 2015; EMF, 2013; RLI, 2015; Vermeulen et al., 2014). The focus on product function makes it possible to consider how certain functions can be provided using radically different ‘products’. Examples are placing blankets instead of heaters outside bars and restaurants, or streaming films and music rather than selling CDs and DVDs. This increases the market share of the alternative product, but results in decreasing sales of the replaced product, an effect that is also seen in the supply chain. This also applies to more intensive product use, which means that fewer products are needed to provide the same function.
Circularity ladders focus primarily on circularity in product chains. A product chain tracks a product from the extraction of natural resources to waste treatment after it has been discarded. If a product and its parts can no longer be used or reused, which will also happen at some

272 Underlying principles |
TWO
TWO
of indicators presented in Table 2.2 have been developed mainly for following resource and material flows using national statistical data, but more work needs to be done on their relevance to specific products and circular initiatives for those products. The indicators developed by the Ellen MacArthur Foundation (EMF, 2015) and the circular economy toolkit (2013) do apply to specific products, but need to be reviewed to determine whether they can be quantified at the national level.
While various scientific publications also focus on indicators for the circular economy, a quick scan of the literature suggests that these mainly concern product chain indicators for specific product groups (e.g. see Geng et al., 2011; Huysman et al., 2017; Saidani et al., 2017).
closely, it appears that most work has been done on developing output indicators for quantifying waste production, waste treatment and recycling, on a national level. This makes sense, given that these indicators were used for waste policy introduced in the 20th century. Various quantifiable indicators have now also been developed for resource use at the national level, for example for direct material use, material use in the product chain and resource productivity.
As far as indicators for the other effects and transition dynamics are concerned, they either need to be adapted to the circular economy, are still being drafted, or there is not enough data for their proper quantification. The sets
Figure 2.2Order of priority for circularity strategies in the product chain
Source: Rli , 2015; adaptation by PBL
R0 Refuse
R1 Rethink
R2 Reduce
R3 Reuse
R4 Repair
R5 Refurbish
R6 Remanu-facture
R7 Repurpose
R8 Recycle
R9 Recover
Linear economy
Circular economy
IncreasingcircularityIncreasingcircularity
Rule of thumb:More circularity =
fewer naturalresources and
less environmentalpressure
Smartercreation and
use ofproducts
Extending the lifespan of
products and parts
Usefull application of
materials
Turning a product redundant by cancelling its function, or by substituting it with a radically di�erent product.
Intensifying product use (e.g. via product sharing or multifunctional products).
More e�cient use and/or manufacture of products through the use of fewer natural resources and materials.
Reuse of discarded yet still usable product, for the same purpose, by a di�erent user.
Repair and maintenance of broken or malfunctioning product, to enable continuation of its original function.
Refurbishing and/or modernising an older product, so that the improved version can be used in the product’s original function.
Using parts of a discarded product in a new product of the same function.
Using discarded products or their parts in new products with a di�erent function.
Processing of materials to achieve the original high-quality or reduce to low-quality.
Incineration of materials, recovering their energy.
pbl.n
l
Strategies

28 | Circular economy: what we want to know and can measure
TWO
indicators for the three monitoring components. Actions for the five priority themes are also proposed in the transition agendas (Transitieteams, 2018), to be published soon. Again, the indicators developed for the transition agenda actions may overlap with the indicators for the transition dynamics and actions from the government-wide policy programme.
Ideally, the transition process will result in the implementation of the chosen circularity strategies (main achievements), which in turn will lead to the intended effects on resource use, environmental pressure and the economy. The implemented circularity strategies therefore form a link between the transition process and the effects, and for this reason are discussed in Chapter 5 (effects).
2.6 Interrelationships between monitoring components
The policy evaluation scheme in Figure 2.1 gives an idea of the interrelationships between the monitoring of the actions in the government-wide policy programme (IenM and EZ, 2016b) and the monitoring of the transition dynamics. Both actions and transition dynamics contribute to the transition process, which should bring about the intended effects on resource use, environmental pressure and the economy. The translation of action and transition dynamics monitoring into concrete indicators is expected to result in an overlap in indicators for each of the monitoring components. We will return to this in Chapter 6, where we reflect on the
Table 2.2Overview of policy-relevant indicator sets for measuring progress in the transition to the circular economy
Source Description Types of indicators addressed
Transition process Effects
R8 and R9 recycling and recovery
R0–R7 Transition dynamics
Resources Environ-mental pressure
Socio-economic develop-ment
Circular economy
EC (2017a) Proposed EU monitoring system with 10 core indicators
X X X X X
Magnier et al. (2017) French monitoring system with 10 core indicators
X X X X
EEA (2016c) Explorative study on required indicators for circular economy monitoring in the EU
X X X
EASAC (2016) Explorative study on available indicators for circular economy monitoring
X X
Potting et al. (2016) Explorative study on required indicators for circular economy monitoring in the Netherlands
X X X X X X
CBS (2016) Quantification of several indicators for which data is available
X X X
EMF (2015) Description of a material circularity indicator X
Circular economy toolkit (2013)
Online tool for identifying product improvement options
X X X X
Resource efficiency
EC (2016a) EU resource efficiency scoreboard X X X X
EC (2017b), Giljum et al. (2016a,b)
EU eco-innovation scoreboard X X
EC (2016a) EU raw materials scoreboard X X X X
EEA (2016c) Inventory of EU and four national resource efficiency policies, including indicators
X
Jacob et al. (2014) Outlook study on resource efficiency indicators for the German environmental protection agency (Umweltbundesamt)
X X

292 Underlying principles |
TWO
TWO
− the replaceability of a material (whether replacement is possible using recyclate or materials produced from renewable and widely available resources);
− the position of the Dutch manufacturer in the product value chain and the influence that the Dutch manufacturer has on this value chain;
− the starting point, that is, the current status of a product regarding the implementation of circularity strategies.
Each of these differences between priority themes, and more specifically between the product groups within the priority themes, can significantly affect the strategies chosen and the possibility of achieving circularity for the particular product group.
2.8 Tiered monitoring structure
The European Commission’s (EC, 2016a) resource efficiency scoreboard has three tiers of indicators. The first tier consists of a single lead indicator, the second tier consists of several dashboard indicators and the third tier consists of specific indicators (thematic indicators) (EC, 2016a). The lead indicator provides a clear overview, in this case of the progress being made with regard to resource efficiency improvements. The dashboard indicators provide a more nuanced view and, finally, the specific indicators provide greater detail. In response to the European Commission’s monitoring proposal for the circular economy (EC, 2017a), a group of European environmental protection agencies (EPAs) have developed a similarly tiered monitoring structure for measuring progress towards the circular economy at the European level (Potting et al., 2017). In line with the EPA proposal, the monitoring system described in this report also employs a tiered monitoring structure (Figure 2.3).
This monitoring system has a top layer with generic core indicators, a second layer with generic dashboard indicators and a third layer with priority-theme-dependent and product-specific indicators. In each layer, a distinction is made between transition process indicators and effect indicators. The transition dynamics and effect monitoring described in this report use generic indicators. Although some of these generic indicators may need priority-theme-dependent or product-specific elaboration, it must remain possible to aggregate the same indicator for different priority themes or product groups. The monitoring system allows for priority-theme-dependent and product-group-specific monitoring of the transition agendas using the third tier in Figure 2.3, but this is not addressed further in this report.
2.7 Priority themes and monitoring
At the same time as this monitoring system was being developed, five transition teams were also working hard on drawing up transition agendas for the priority themes. These transition agendas also include an action agenda. Therefore, in addition to the actions from the government-wide policy programme (IenM and EZ, 2016b), there are also new actions from the transition agendas, and there may be some overlap between the two. The transition agendas also make it clear that additional, priority-theme-dependent and product-group-specific monitoring is required (Transitieteams, 2018), although this has not yet been included in the monitoring system described in this report.
The priority-theme-dependent and product-group-specific views on what should be monitored are not the same for each transition agenda, although there is some overlap between the priority themes (Transitieteams, 2018). The differences in views on what is relevant to be monitored are due to the variety in product groups within the priority themes. For example, the transition agenda for the manufacturing industry focuses on medical equipment, road vehicles, machinery, construction products and computer hardware (Transitieteams, 2018). The plastics transition team, on the other hand, distinguishes between different types of plastics and identifies a range of products for each type (e.g. PET bottles, PP plant pots, PVC window frames, PUR sponges, and PS disposable cups) (Transitieteams, 2018).
There are differences between the priority themes, and in particular between the product groups within the priority themes. These differences may relate to (Potting et al., 2016; Transitieteams, 2018):
− the function of the product groups (which may have consequences for the selected circularity strategies and their effects; Figure 2.2);
− the type of product user (can be roughly defined as individuals/households, public bodies or institutes/companies; in accordance with spending statistics);
− the technical lifetime and/or utilisation time of a product (from disposable products to products with a long life, such as buildings, often with consecutive users);
− the product composition (from simple to complex with several materials and/or product parts);
− the technical lifetime and/or utilisation time of materials and product parts (e.g. in buildings or transport infrastructure);
− used materials (required material quality, price, criticality, environmental pressure of material, available recycling methods);

30 | Circular economy: what we want to know and can measure
TWO
(Figure 2.2). The monitoring system takes into account the fact that both direct and indirect effects, and Dutch production and consumption, need to be monitored.
− The intended result of the transition process is the implementation of higher level circularity strategies that reduce resource use (first and third strategic objectives in the government-wide policy programme). These strategic objectives apply to all natural resources, including the renewable and widely available resources that are to substitute abiotic resources.
− The transition process consists of utilising means (input) and undertaking activities (throughput) to bring about achievements (output).
− Actions and transition dynamics both contribute to the transition process but are monitored separately, as reflected in the monitoring components.
− The transition agendas contain new actions. The actions in the government-wide policy programme are monitored using the action monitoring, but agreements still need to be made concerning monitoring of the transition agenda actions.
− In this report, monitoring of the transition dynamics and effects is based on generic indicators. Although some of these generic indicators may be applied to a specific priority theme or product, it must be possible to aggregate the same indicator for different priority themes or products.
2.9 In summary
As the literature review in Section 2.5 makes clear, although some elements are in place for monitoring progress made in the transition to the circular economy, these are not enough to develop a comprehensive monitoring system as described in this report. The monitoring system and baseline assessment described in this report should therefore be regarded as a growth model. The possibilities for this growth model are discussed further in Chapter 6, where we also reflect on the developed monitoring system and the other underlying principles described in this chapter. For now, it is sufficient to be aware of the principles on which development of the three monitoring components is based:
− The monitoring system, in line with the Court of Audit policy evaluation scheme (AR, 2005), makes a distinction between the transition process and its effects on resource use, environmental pressure and socio-economic developments.
− The aim of effect monitoring is to determine whether we are on course regarding the reduction goal for abiotic resources in the government-wide policy programme (a 50% reduction by 2030 and fully circular by 2050; IenM and EZ, 2016b). This requires further elaboration of the goal by the Dutch Government
Figure 2.3Monitoring structure circular economy
Source: PBL
All indicators,
in principle, are based on
the entire product
chain
Core(generic)
Dashboard (generic)
Product-speci�c
Tansit
ion p
roce
ss in
dicato
rs Core(generic)
Dashboard (generic)
Product-speci�c
E�ect indicators
Products PrioritiesNetherland as a whole
To be measured at the level of:
pbl.n
l

TWO

32
THRE
E
| Circular economy: what we want to know and can measure
Actions three
Almost 200 actions that actively involve the government were identified in the government-wide policy programme in 2016 (IenM and EZ, 2016). These actions are highly diverse, ranging from monitoring plastic flows, to implementing a concrete agreement, to developing the circular economy as a cross-sectoral theme in top sector policy. Some actions, such as adapting European Ecodesign legislation, are expected to have much more of an impact than others.
A distinction is made between actions that have already been initiated and those that have not. Ongoing actions come from other policy programmes, such as From Waste to Resources (VANG). The many new actions will be implemented when the time is deemed right, for example within a transition agenda programme. Both the old and new actions are structured in line with the five priority and intervention themes (see Chapter 1), and most actions are currently assigned to one or more ‘action owners’, usually a policy adviser. Since Autumn 2017, there has been some discussion regarding the extent to which existing actions should be supplemented or combined with actions from the natural resources agreement (Grondstoffenakkoord) and the transition agendas. Although the transition agenda actions are not included in the baseline assessment, they will have a role to play in the continued development of the action monitoring.
Smart action monitoring makes it easier to make timely course corrections. This goes further than simply noting whether actions have been implemented, for example using a ‘traffic light’ system. Smart action monitoring helps action owners reflect on the contribution that ‘their’ actions are making, helps achieve policy outcomes, and contributes to resource use reduction and other strategic objectives. It also gives government officials the opportunity to change or increase the type and number of actions in which the government is involved, to achieve the set goals. The information provided by action monitoring can also help product chain partners,
knowledge institutes and other public bodies in the transition process.
RIVM consulted the various action owners at the ministries involved to obtain information that can be used as input to the development of such a smart action monitoring system. This had two purposes: to determine the status (indicative baseline) of the actions, and to explore possible resulting policy outcomes of the actions and the extent to which individual actions can reasonably be linked to quantitative and qualitative indicators that say something about the transition process and the effects that the government ultimately aims to bring about with the circular economy.
In this chapter, we first present the methodology followed by and with the policy advisers (Section 3.1). We then describe the general results of the baseline assessment (Section 3.2). In Sections 3.3 and 3.4, we focus on the results for specific intervention and priority themes. We then reflect on the results (Section 3.5): how should the action monitoring be developed further? We close the chapter with the main research findings (Section 3.6).
3.1 Methodology
Development of the action monitoring was largely interactive, with action owners involved in the research in various ways. Two online questionnaires were sent, in July and September 2017, and some action owners were asked to provide additional information. Meetings were organised for most of the five priority and intervention themes, to which action owners considered to have a good overview of the actions for a particular priority or intervention theme were invited. The actions baseline assessment is indicative and reflects the situation at the end of 2017.

333 Actions |
THRE
E
THREE
As previously mentioned, the aim of the action monitoring is to provide insight into the current status of the actions from the government-wide policy programme (the baseline). In concrete terms, this means finding out who within which ministry is responsible for which actions, and what progress has been made.
A tentative, preliminary analysis was also made of the relationship between the actions and the objectives that the government ultimately hopes to bring about with a circular economy. For this analysis, RIVM assigned scores to the actions based on its own expert judgement, in cooperation with PBL and, of course, making use of the information provided by the policy advisers. Scores were determined for the level of circularity (is the focus primarily on recycling, or on higher level circularity strategies such as avoiding use or designing for reuse), the phase in the product chain on which actions focus, and the extent to which an action corresponds with one or more of the programme’s core goals.
As also mentioned above, the second goal of the action monitoring is to explore how individual actions can be more closely linked to achievements, effects and indicators. With this in mind, policy advisers were challenged to examine ‘their’ actions – which usually take
the form of activities – in terms of achievements and effects, in line with the policy evaluation scheme applied in this report (see Chapter 2).
3.2 Baseline assessment – general results
Most actions initiatedTwo thirds of the actions in the government-wide policy programme are new: in other words, they were named for the first time in the programme. The other third are existing actions that were initiated in earlier programmes, such as VANG. Information is available for two thirds of the actions, and the current status of the actions is shown in Figure 3.1.
As can be seen, more than half of the actions, including the new actions, have been initiated, either recently or some time ago. Some of the new actions will not be initiated before the transition agendas are published, and some need to wait for the completion of other actions. Yet others first need to be revised, or require the input of certain capacities or resources.
Figure 3.1
Priorities
Biomass and food
Construction
Consumer goods
Plastics
Manufacturing industry
Interventions
Knowledge and innovation
Stimulative legislation
Smart market incentives
International cooperation
Cooperation, government role, monitoring
Funding
0 5 10 15 20 25 30
actions
Source: RIVM 2017
pbl.n
l
Completed
Started
Not started
No data available
Actions in government-wide policy programme circular economy, per priority and type of intervention, 2017

34 | Circular economy: what we want to know and can measure
THRE
E
Not all actions finalisedSome actions need to be revised or reformulated, in most cases to reflect the transition agendas or new ideas. The reason for not all the actions having been fully finalised is that the government-wide policy programme is still in the start-up phase. Actions are being developed that were initiated in other programmes, such as VANG, and new actions have also been added, as the circular economy consists of more than turning waste into new resources but is also about restructuring product chains and introducing new circular chains. Some new actions are in fact policy proposals that will take shape in later phases of the programme. Most actions have not yet been expressed as SMART goals.
Contribution of the actions to the circular economy The current government-wide policy programme and resulting actions have largely been developed bottom-up, and broadly represent existing, proposed and possible policy. Although the actions were not necessarily developed with this in mind, links can be made to the top-down core goals of the policy programme (see Figure 3.2). Based on expert judgement, an estimate has been made of the extent to which an action focuses on one or more of these core goals. This means that each action in the figure has an equal weighting, and therefore provides an initial idea of the focus areas of the actions.
Figures 3.3 and 3.4 present the actions from two other perspectives: that of the circularity strategies and that of the phase in the product chain for which the action is relevant. As can be seen, most actions focus on the ‘end’ of the product chain. Actions relating to the closing of product chains mainly concern recycling and waste treatment. Although circularity strategies that are higher up the circularity ladder (see Chapter 2) do receive some attention, it is clearly less (Figure 3.3). Furthermore, many action descriptions do not specify exactly what ‘circular’ means, which keeps things general but also provides the freedom to move higher up the circularity ladder. That other circularity strategies are possible can be seen in the various actions that focus on other phases of a product’s life cycle, not just disposal and recycling (Figure 3.4).
The Dutch Government has clearly decided to take a facilitating role, as the actions largely focus on supporting innovation in other market sectors and organisations. This support includes promoting knowledge exchange, the transition agendas and top sector policy. Many of the actions that aim to promote innovation focus on increasing capacity, for example by encouraging product chain agreements. Actions relating to regulations and standards mainly aim to remove existing regulatory barriers (e.g. through the Smart Regulation for Green Growth programme). Very rarely do actions focus on new
Figure 3.2
Main objective
50% reduction in primaryresources by 2030
Strategic objectives
1. High-quality utilisation ofresources in existing product chains
2. Substitution of unsustainableresources with sustainable resources
3. Development of new productsand production methods
Generic
Unknown orirrelevant
0 10 20 30 40 50
actions
Source: RIVM 2017
pbl.n
l
Priorities
Biomass and food
Construction
Consumer goods
Plastics
Manufacturing industry
Actions in government-wide policy programme circular economy, per objective, 2017

353 Actions |
THRE
E
THREE
Figure 3.3
Refuse (R0)
Rethink (R1)
Reduce (R2)
Reuse (R3)
Repair (R4)
Refurbish (R5)
Remanufacture (R6)
Repurpose (R7)
Recycling (R8)
Recover energy (R9)
Generic
Unknown orirrelevant
0 10 20 30 40
actions
Source: RIVM 2017
pbl.n
l
Priorities
Biomass and food
Construction
Consumer goods
Plastics
Manufacturing
Actions government-wide policy programme circular economy, per circularity strategy, 2017
Figure 3.4
Resource extraction
Material production
Product manufacturing
Product use (includingproduct reuse)
Processing discardedproducts
Entire chain
Generic
Unknown orirrelevant
0 10 20 30 40
actions
Source: RIVM 2017
pbl.n
l
Priorities
Biomass and food
Construction
Consumer goods
Plastics
Manufacturing industry
Actions in government-wide policy programme circular economy, per product chain phase, 2017

36 | Circular economy: what we want to know and can measure
THRE
E
standards or legislation, an exception being an action that addresses the European conflict metals regulation and an action for expanding the Ecodesign directive. However, where they do exist, they can have a large impact.
3.3 Baseline assessment – intervention theme results
Stimulative legislation. Many actions focus on removing obstacles (changing existing policy), on the policy process and on research. One example is the Smart Regulation for Green Growth programme, which aims to remove 130 obstacles in existing policy. We can examine what the likely impact of this will be. The European Ecodesign directive action is one of the few actions that focuses on new policy and regulations that will lead to reduced resource consumption and more recycling. Almost all the actions aim to bring about policy achievements that relate to policy instruments.
Smart market incentives. These actions focus on many different instruments, such as stimulation through socially responsible procurement and fiscal benefits, calculators for CO2 equivalents and sustainability frameworks, and fiscal measures such as waste taxes. Because pricing incentives have a direct influence on supply and demand, many actions are expected to have a large impact on circularity. In many cases, these actions consist of exploring the instruments available rather than implementing measures. Monitoring the share of socially responsible procurement could be used as an indicator for the transition process, as could the take-up of certain regulations with fiscal benefits, such as the MIA (environmental investment rebate) and Vamil (arbitrary depreciation of environmental investments) schemes for companies that invest in environmentally friendly measures. See Appendix 3, for an overview of examples of indicators for each intervention and priority theme.
Funding. These actions focus on stimulating and supporting businesses in the development of new circular revenue models. Policy is developed to provide the necessary means (money and energy) for the Nederland Circulair! programme, to stimulate circular entrepreneurship. The government therefore takes a facilitatory role, while the actions are largely the responsibility of the product chain partners. Possible indicators could be the take-up of funding and the number of start-up companies (in Nederland Circulair!).
Knowledge and innovation. These actions focus on three main areas: developing networks (e.g. Knowledge and Innovation Mapping, From Waste to Resources, or KIEM-VANG 2017) to which some concrete policy outcomes, such as the development of a knowledge and innovation agenda, are coupled; the use of instruments, such as the ‘resources tool’ for companies; or an achievement in the form of a policy paper or other knowledge development publication, such as an updated Atlas of Natural Capital or the circular economy top sectors Knowledge and Innovation Agenda. The development of a regional tool for building regional business cases and the CIRCO programme, which focuses on product design, are expected to have particularly large impacts.
International cooperation. Actions are being developed in the government-wide policy programme that focus on international cooperation, and in particular legal and economic conditions (e.g. the EU Plastics Strategy), a European market for Dutch companies (e.g. Holland Circular Hotspot) and the Dutch input to a circular economy that does not shift problems elsewhere (e.g. the Global Partnership on Marine Litter).
Cooperation between government and chain partners. As well as intervention actions, there are many other actions that focus primarily on the transition process, such as the development of a product chain approach. Actions that are expected to have a particularly large impact are the development of the transition agendas for all priority themes, the development and implementation of the monitoring programme and the application and further development of the government-wide policy programme strategy.
3.4 Baseline assessment actions – priority theme results
Biomass and food. Regarding this priority theme, there seems to be a strong correlation between the actions in the government-wide policy programme and those in the recently developed transition agenda. Attention is paid in the transition agenda to the coupling of actions to achievements and effects and, in some cases, to indicators that measure the actual progress made. The actions in the government-wide policy programme focus primarily on bringing about achievements that create certain conditions (e.g. the promotion of the European Sustainable Phosphorus Platform), and less on results to

373 Actions |
THRE
E
THREE
which concrete goals and indicators can be coupled (such as the use of wood pellets to generate steam for industry).
Actions for this priority theme focus mainly on the second strategic objective (substitution), in particular the use of renewable resources (e.g. the ‘Bio-based chemical production in the Netherlands’ action, which is in fact about ‘sustainable chemicals’). Some actions contribute to the first strategic objective, which is the ‘high-grade application of materials in existing product chains’ (closing nutrient cycles; strategy R9 on the circularity ladder). If natural resources are to be used efficiently, it is important to continue to promote high-grade applications for biomass waste that focus on adding value and conserving materials wherever possible (R1 – R7).
Attention needs to be paid to the selection of suitable indicators for measuring progress. Examples of relevant indicators are the amount of biomass consumed, the amount of recycled phosphate exported and the number of sustainability certificates issued for biomass products (see Appendix 3).
Plastics. The actions in the government-wide policy programme are largely regarded as ambitions, or mindsets. Some actions focus primarily on coming to agreements with the main stakeholders, for example the Framework Agreement Packaging II. Because this agreement contains accountable goals (e.g. a recycling percentage per type of packaging), it is possible to monitor the increase in recycling (an increase in the percentage of recycled plastic packaging). The ‘plastic bag ban’ action is an example of a policy achievement that focuses on ‘Refuse’ (R0 on the circularity ladder), and roughly 70% fewer new plastic bags are now used (SAMR, 2017). With the exception of this example, little attention is as yet paid to higher level circularity strategies (R7 and higher) compared with the waste and recycling strategies (R8 and R9). More can therefore be done to increase awareness of reducing the use of plastics in consumer goods. However, we need to be careful not to shift consumption to other resources, such as paper for paper bags, thereby simply transferring the environmental pressure to a different product chain.
There are several indicators for measuring achievements in the plastics priority theme, such as ‘recycling percentage for plastics’ and ‘amount of plastic in litter’. It is also desirable to develop indicators to monitor the quality of recycled plastic flows and the work done to develop higher level circularity strategies. Suitable indicators can be defined in consultation with the relevant stakeholders.
Manufacturing. As for plastics, the actions for this priority theme should be regarded primarily as an agenda for further development. Such development is currently taking place with the addition of more actions to the transition agenda. Some action owners have pointed to the tension that exists between available resources and funding, and planning of action implementation.
Many actions focus on strengthening cooperation in the product chain. These actions contribute primarily to the ‘new ways of producing and consuming’ strategic objective (e.g. the CIRCO project), and are placed higher up the circularity ladder (R0 – R7). Only those indicators that focus on monitoring activities and process-related achievements (e.g. the number of successful coalitions with serious business cases, see Appendix 2) seem to be feasible at present.
Construction. Actions for the construction priority theme focus primarily on stimulating initiatives and establishing networks. In addition to the activities undertaken by the transition team for the ‘construction’ priority theme, there is also a strong focus on the agreement on concrete (‘Betonakkoord’). The actions mainly contribute to the government-wide programme’s strategic objective of ‘high-grade application of materials in existing product chains’, by focusing on a more circular construction sector. More actions could be developed that focus on substitution and new ways of producing and consuming (the other objectives of the programme).
It is important to develop a good definition of circularity for the construction sector that takes into account total material use, the actual percentage of materials recycled into new products and the reusability of construction materials. This is important, both to be able to contribute to the ‘high quality’ and ‘substitution’ strategic objectives and to determine the corresponding material flows (e.g. fill sand). Examples of indicators for the construction priority theme are given in Appendix 2.
As there is plenty of data available on material flows in the construction sector, it is possible to define several indicators for this priority theme. For example, achievements are named in the City Deal of ‘Nature in the City’ (Waarden van groen en blauw in de stad) and in the concrete agreement, for which indicators can be defined to monitor progress (such as the percentage of secondary concrete granulate reused to make concrete). A good example of an indicator for monitoring progress is the number of new buildings for which MPG scores (Milieu Prestatie Gebouwen; environmental performance of buildings) have been calculated, as well as the actual scores.

38 | Circular economy: what we want to know and can measure
THRE
E
achievement (When are you satisfied? What is the result?), it is possible to clarify the action, or what it is to bring about. In many cases, it is also possible to couple SMART goals with concrete indicators to the actions (e.g. the number of successful coalitions with serious business cases, the number of sustainability certificates issued, or the number of companies that use the resource tool). Some actions are purely facilitatory, but for some it is useful to explore the impact of the policy achievement on resource use, environmental pressure and economic effects. This can also help distinguish between ‘light’ and ‘heavy’ actions or, in other words, which actions have less of an impact than others.
Expand, adapt and widen actions and action monitoringOther points are the clustering of the monitored actions and the coupling of these with the transition agendas. It is important to follow these action clusters and the relevant indicators, to monitor the transition process towards the circular economy. While writing this report, a debate was ongoing regarding the extent to which the monitoring of existing actions should be expanded (or combined) with actions from the natural resources agreement and the transition agendas. Once the transition agendas have been published, work can start in early 2018 on examining the correlation between the actions from the government-wide policy programme and the new actions, in relation to the transition goals and the transition phases of the various product chains and sectors. Smart action monitoring requires making sure that the monitoring ‘language’ is tailored to and becomes common parlance in the ministries and among the stakeholders involved in developing and implementing the transition agendas. This applies, for example, to the difference between the terms ‘policy achievement’ (including circularity) and ‘effect’ (including resource reduction, environmental benefit and employment opportunities). Although these are important terms in this report, their meaning is not immediately clear to everyone.
3.6 In summary
Most of the actions in the government-wide policy programme have been initiated and are ongoing. Some of the actions should be primarily regarded as lines of thought (this applies in particular to plastics and manufacturing), rather than actions to be implemented soon. The baseline assessment of the actions shows that actions higher up the circularity ladder are underrepresented. The circular economy is of course more than recycling, but the number of actions that explicitly go further than this are limited. This remains a point of attention for the coming years.
Consumer goods. As far as consumer goods are concerned, many actions have already been initiated in various programmes, such as the Household Waste Implementation Programme (Uitvoeringsprogramma huishoudelijk afval) and the non-household waste VANG programme (VANG Buitenshuis). Many of these actions focus on more and better waste separation and recycling. While there are also actions that focus on higher level circularity strategies for extending product lifespans with reparation and smart design, these are clearly fewer, and largely in the start-up phase. The focus is on developing knowledge and influencing behaviour to increase waste separation, as well as promoting cooperation in the product chain. Policy achievements mainly relate to increasing separation percentages and reducing the amount of waste. However, not many actions focus on promoting higher level R strategies, for example by influencing behaviour in this direction. Many indicators for monitoring the amount of recycled and incinerated waste are available in the periodic Rijkswaterstaat reports (‘Waste database’ (Afvaldatabase) and ‘Dutch waste in figures’ (Nederlands afval in cijfers)). However, information is also needed on the shift to strategies higher up the circularity ladder, such as product lifespan extension (R3 – R7). Examples are the number of times products are repaired, or the growth in specific second-hand markets (e.g. clothing).
3.5 Further development of action monitoring
More than a traffic light tableSmart action monitoring offers more than a traffic light table – in other words, it does more than indicate whether or not an action is being implemented. A carefully developed action monitoring system invites reflection, challenging action owners and those responsible for the implementation of actions to ensure that actions stay on course in terms of the achievements they are to bring about and that they contribute – either directly or indirectly – to the 50% reduction goal and the strategic objectives of the government-wide policy programme. Also assessed is the continued applicability of the actions in the face of ongoing developments, and whether new actions are required.
Clarify relationship between actions, goals and strategic objectives of government-wide policy programme An overarching conclusion drawn from the questionnaires and interviews is that it is possible to further specify the relationship between the bottom-up actions and the top-down objectives of the government-wide policy programme. By asking questions about the policy

393 Actions |
THRE
E
THREE
Product chain partners are expected to have an important role to play in the implementation of the transition agendas. However, the resource reduction goal has not yet been included in either the natural resources agreement or the transition agendas. The government therefore needs to make sure that it maintains its focus on meeting the resource reduction goal and the corresponding strategic objectives. After all, in addition to requiring support from societal partners, a true transition implies a role for government as a ‘launching customer’ in circular procurement, in removing barriers in existing and, usually, new legislation, and in developing additional actions on top of the focus, for example, on changes to the European Ecodesign directive.

40
FOU
R
| Circular economy: what we want to know and can measure
Transition dynamicsfour
In its government-wide policy programme, the Dutch Government describes its aim to reduce the use of abiotic resources by substituting them with renewable, and widely available resources (second strategic objective) and make better, more efficient use of all resources in existing and new product chains (first and third strategic objective).
Because of the differences between the priority themes, and more specifically between the product groups within the priority themes (see Section 2.6), choices need to be made regarding the suitable circularity strategies and which abiotic resources are to be substituted with which renewable, and widely available resources. Both circularity strategies and substitution require innovation in technology, product design and revenue models, as well as socio-institutional change (written and unwritten rules, customs and beliefs) (Jonker et al., 2017; Potting et al., 2016).
Achieving socio-institutional change and innovation, and subsequently the implementation of circularity strategies, can take considerable time, but by systematically monitoring the transition dynamics, we can see whether we are on course in terms of bringing about the transition effects. Of course, employing certain means and undertaking certain activities will not necessarily bring about the desired achievements, and certain achievements may not always lead to the intended transition effects. In principle, however, monitoring the transition dynamics and effects makes it possible to follow the progress being made in the transition to the circular economy, and to assess whether course corrections need to be made. Monitoring the transition dynamics therefore makes it possible to manage and steer the transition towards the circular economy.
Transition dynamics monitoring is relatively uncharted territory, and in this chapter we describe the current status and the further development of a set of indicators for monitoring the transition dynamics.
4.1 Underlying principles
The starting point and speed of the transition to the circular economy will vary, depending on the priority theme and the specific product group within the theme (Section 2.6). To measure the progress being made, therefore, it is useful to identify groups of similar products or specific products within each priority theme. For example, food in the biomass and food priority theme can be further specified as greenhouse vegetables, bread, fruit, meat, and so on. The plastics priority theme comprises products (including semi-manufactured goods) with applications in, for example, packaging, electronics and electrical equipment, the construction sector and the automotive industry (Plastics Europe, 2015).
Often, four phases are defined in the innovation and transition literature to describe the development of the innovation and transition process. These phases are pre-development, take-off, acceleration and stabilisation (Hekkert and Ossebaard, 2010). The transition dynamics monitoring framework is here simplified to two phases: the formative phase (pre-development and take-off) and the growth phase (acceleration and stabilisation) (Figure 4.1). In the formative phase, the conditions are created for strong growth in circular products and services later in the transition process. This typically involves experimentation with circular products and services, vision development, the creation of new networks and product chain relationships, new revenue and business models, new partners and changes to existing organisations in line with the circular economy. In this formative phase, therefore, the innovation system is put in place that is required for the transition to the circular economy. The growth phase is characterised by a rapid increase in the market share of circular products and services. In the literature, the boundary between the formative and growth phase is set at 2.5% of the potential market share of circular products and services (Bento and Wilson, 2016).
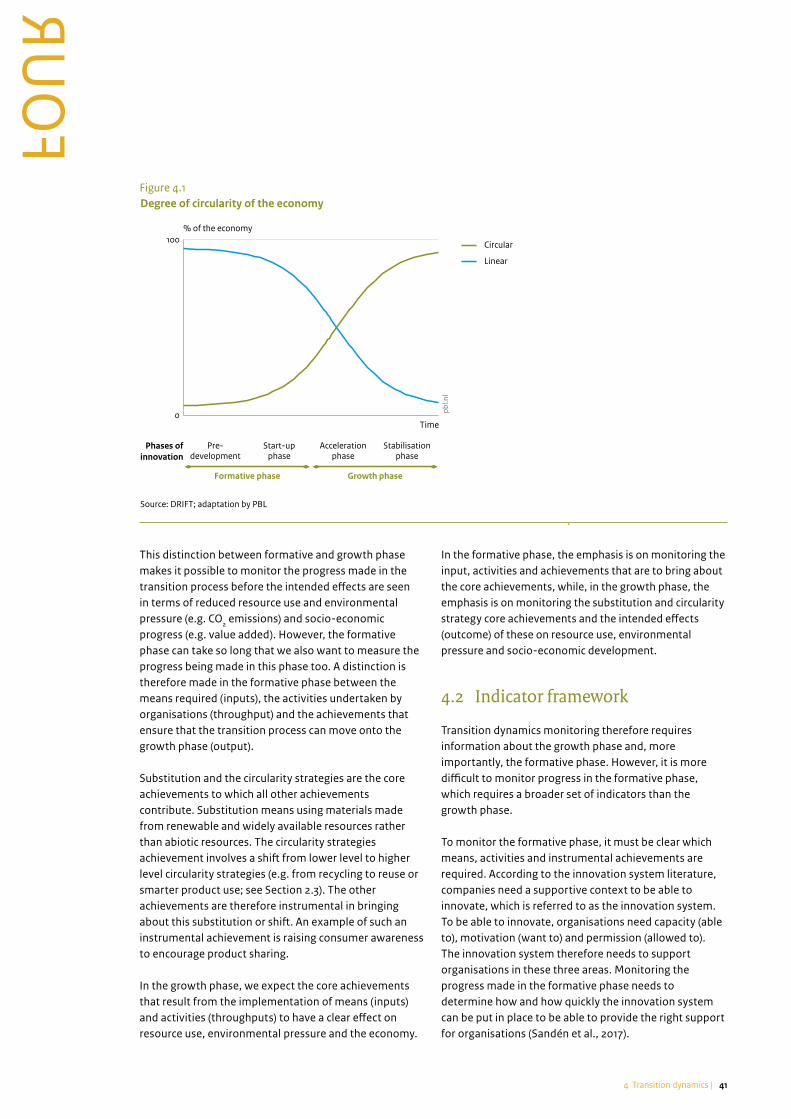
414 Transition dynamics |
FOU
R
FOUR
This distinction between formative and growth phase makes it possible to monitor the progress made in the transition process before the intended effects are seen in terms of reduced resource use and environmental pressure (e.g. CO2 emissions) and socio-economic progress (e.g. value added). However, the formative phase can take so long that we also want to measure the progress being made in this phase too. A distinction is therefore made in the formative phase between the means required (inputs), the activities undertaken by organisations (throughput) and the achievements that ensure that the transition process can move onto the growth phase (output).
Substitution and the circularity strategies are the core achievements to which all other achievements contribute. Substitution means using materials made from renewable and widely available resources rather than abiotic resources. The circularity strategies achievement involves a shift from lower level to higher level circularity strategies (e.g. from recycling to reuse or smarter product use; see Section 2.3). The other achievements are therefore instrumental in bringing about this substitution or shift. An example of such an instrumental achievement is raising consumer awareness to encourage product sharing.
In the growth phase, we expect the core achievements that result from the implementation of means (inputs) and activities (throughputs) to have a clear effect on resource use, environmental pressure and the economy.
In the formative phase, the emphasis is on monitoring the input, activities and achievements that are to bring about the core achievements, while, in the growth phase, the emphasis is on monitoring the substitution and circularity strategy core achievements and the intended effects (outcome) of these on resource use, environmental pressure and socio-economic development.
4.2 Indicator framework
Transition dynamics monitoring therefore requires information about the growth phase and, more importantly, the formative phase. However, it is more difficult to monitor progress in the formative phase, which requires a broader set of indicators than the growth phase.
To monitor the formative phase, it must be clear which means, activities and instrumental achievements are required. According to the innovation system literature, companies need a supportive context to be able to innovate, which is referred to as the innovation system. To be able to innovate, organisations need capacity (able to), motivation (want to) and permission (allowed to). The innovation system therefore needs to support organisations in these three areas. Monitoring the progress made in the formative phase needs to determine how and how quickly the innovation system can be put in place to be able to provide the right support for organisations (Sandén et al., 2017).
Figure 4.1
Time0
100% of the economy
Source: DRIFT; adaptation by PBL
pbl.n
l
Circular
Linear
Degree of circularity of the economy
Phases ofinnovation
Pre-development
Start-upphase
Accelerationphase
Stabilisationphase
Formative phase Growth phase

42 | Circular economy: what we want to know and can measure
FOU
R
4.3 Developing quantifiable indicators
The challenge is to translate the suggestions made in Table 4.1 into concrete, quantifiable indicators. First of all, it is important to use the indicators in Table 4.1
to find out how far the transition is in terms of its progress towards the circular economy. It is therefore recommended to identify for each indicator in Table 4.1 whether the monitored means, activities or achievements contribute to substitution or the implementation of one or more circularity strategies as the core achievement.
Many recycling-based (R8) circularity initiatives have already been introduced, as have initiatives based on higher level circularity strategies such as product reuse (R3) and repair (R4). It is therefore recommended to determine on which of the three main categories of the circularity ladder the means, activities and achievements to be monitored focus, for each of the indicators in Table 4.1. This means that each indicator will have the sub-classes ‘smarter product use and manufacture’ (R0 – R2), ‘extend lifespan of product and its parts’ (R3 – R7) and ‘useful application of materials’ (R8 – R9). This makes it possible to distinguish between progress in material recycling and progress in product lifespan extension or smarter product design. A step further could be to use each circularity strategy from the R ladder as a sub-class to which indicators can be assigned. As Ganzevles et al. (2016) and Potting et al. (2016) show, assigning a score to circularity activities in terms of their contribution to the circularity strategies is not difficult, but this may be a step too far in the transition dynamics monitoring described here.
What is difficult is to quantify the implementation of the circularity strategies themselves, in other words how many products are being shared (R1) or reused (R3), and so on. Such quantification, currently, is only possible for the useful application of materials (recycling (R8) and incineration of materials with energy recovery (R9)), which has been the focus of policy for some time. The reason for this is that these circularity strategies are closer to the linear economy and the subject of policy focus for many years. These strategies are usually in the middle, if not towards the end, of the growth phase (e.g. glass, metal and paper recycling). As far as the higher circularity strategies are concerned, the transition process is usually still in the formative phase, which has received far less attention. In most cases, no indicators have yet been developed to measure these transition processes – an important point as, ultimately, they are to lead to the intended transition effects.
The innovation literature describes the processes that need to take place in innovation systems (Sandén et al., 2017; Hekkert et al., 2007). These are listed below and grouped according to the three support dimensions.
Innovation system processes that support capacity (able to): 1. Mobilisation of human capital for innovation 2. Mobilisation of physical means, knowledge infra-
structure and technology for innovation3. Mobilisation of financial means for innovation 4. Mobilisation of knowledge5. Development of networks that provide access to
knowledge and means
Innovation system processes that support motivation (want to):6. Creation of markets and demand7. Development of positive expectations and guidance
of search process8. Laws and regulations that discourage linear practices
(and therefore encourage circular practices)9. Development of circular product chains
Innovation system processes that support permission (allowed to): 10. Laws and regulations that encourage the circular
economy 11. Development of standards and routines
Quantifiable indicators need to be identified and/or defined to measure capacity (able to), motivation (want to) and permission (allowed to), and for each of these indicators needs to be determined whether they belongs to input (means), throughput (activities) or output (achievements). A start is made on this in Table 4.1, with suggestions given for such indicators. Although these indicators can be used for measuring the transition dynamics in all the priority themes (generic indicators), it may also be useful to develop priority-theme-dependent or product-specific indicators based on these generic indicators. These can then be aggregated per priority theme or across different priority themes, making it possible to monitor the transition to the circular economy at the priority theme level and, in theory, at the national level (only in theory, because the five priority themes do not include every sector and/or product in the Dutch economy).
It may also be desirable to supplement the generic indicators listed in Table 4.1 with priority-theme or product-specific indicators (which are therefore not measured for the other priority themes). The choice of additional priority-theme-dependent or product-specific indicators should take into account the goals set by the transition teams in the transition agendas for their priority themes.
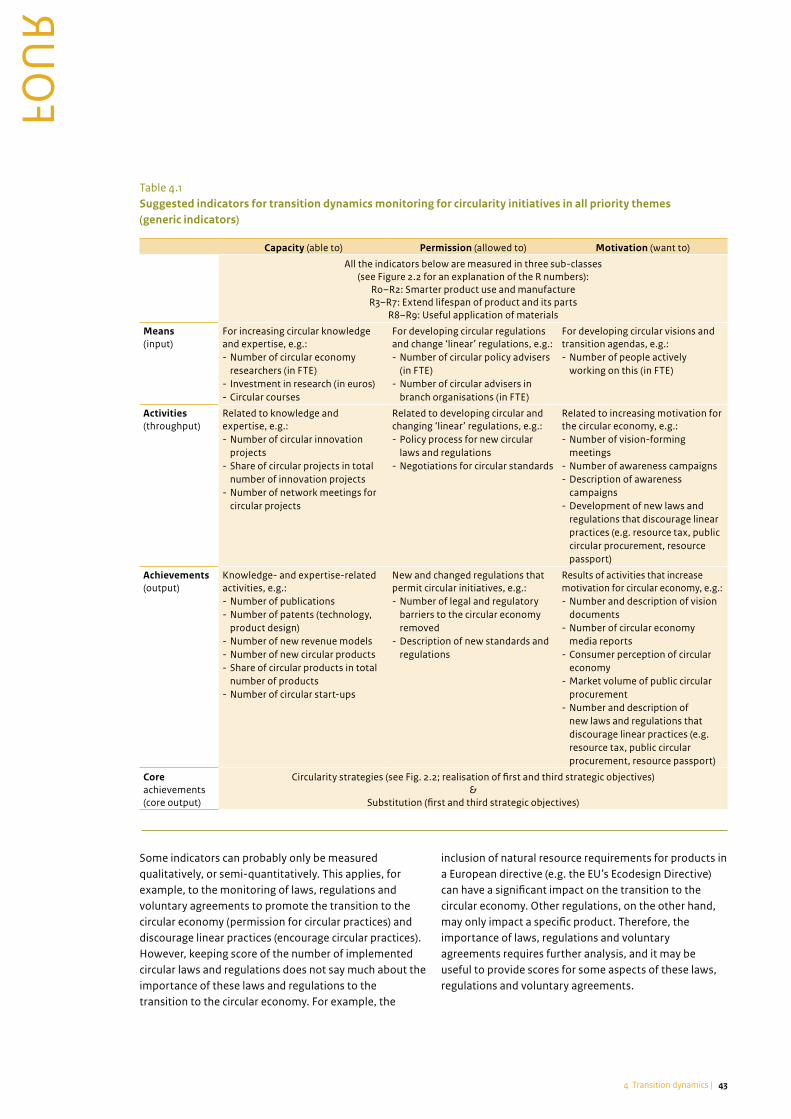
434 Transition dynamics |
FOU
R
FOUR
inclusion of natural resource requirements for products in a European directive (e.g. the EU’s Ecodesign Directive) can have a significant impact on the transition to the circular economy. Other regulations, on the other hand, may only impact a specific product. Therefore, the importance of laws, regulations and voluntary agreements requires further analysis, and it may be useful to provide scores for some aspects of these laws, regulations and voluntary agreements.
Some indicators can probably only be measured qualitatively, or semi-quantitatively. This applies, for example, to the monitoring of laws, regulations and voluntary agreements to promote the transition to the circular economy (permission for circular practices) and discourage linear practices (encourage circular practices). However, keeping score of the number of implemented circular laws and regulations does not say much about the importance of these laws and regulations to the transition to the circular economy. For example, the
Table 4.1Suggested indicators for transition dynamics monitoring for circularity initiatives in all priority themes (generic indicators)
Capacity (able to) Permission (allowed to) Motivation (want to)
All the indicators below are measured in three sub-classes (see Figure 2.2 for an explanation of the R numbers):
R0–R2: Smarter product use and manufactureR3–R7: Extend lifespan of product and its parts
R8–R9: Useful application of materials
Means (input)
For increasing circular knowledge and expertise, e.g.:- Number of circular economy
researchers (in FTE) - Investment in research (in euros)- Circular courses
For developing circular regulations and change ‘linear’ regulations, e.g.:- Number of circular policy advisers
(in FTE)- Number of circular advisers in
branch organisations (in FTE)
For developing circular visions and transition agendas, e.g.: - Number of people actively
working on this (in FTE)
Activities (throughput)
Related to knowledge and expertise, e.g.:- Number of circular innovation
projects- Share of circular projects in total
number of innovation projects- Number of network meetings for
circular projects
Related to developing circular and changing ‘linear’ regulations, e.g.:- Policy process for new circular
laws and regulations- Negotiations for circular standards
Related to increasing motivation for the circular economy, e.g.:- Number of vision-forming
meetings- Number of awareness campaigns- Description of awareness
campaigns- Development of new laws and
regulations that discourage linear practices (e.g. resource tax, public circular procurement, resource passport)
Achievements (output)
Knowledge- and expertise-related activities, e.g.:- Number of publications- Number of patents (technology,
product design) - Number of new revenue models- Number of new circular products- Share of circular products in total
number of products- Number of circular start-ups
New and changed regulations that permit circular initiatives, e.g.:- Number of legal and regulatory
barriers to the circular economy removed
- Description of new standards and regulations
Results of activities that increase motivation for circular economy, e.g.:- Number and description of vision
documents- Number of circular economy
media reports - Consumer perception of circular
economy- Market volume of public circular
procurement- Number and description of
new laws and regulations that discourage linear practices (e.g. resource tax, public circular procurement, resource passport)
Core achievements (core output)
Circularity strategies (see Fig. 2.2; realisation of first and third strategic objectives)&
Substitution (first and third strategic objectives)

44 | Circular economy: what we want to know and can measure
FOU
R
however possible to show what such a baseline assessment could look like, using the example of RVO.nl subsidised projects and the bio-based economy, which has been monitored by RVO.nl for several years (Kwant et al., 2016, 2017). This example is relevant for two reasons. Firstly, the bio-based economy forms the basis for the substitution of abiotic resources with biomass-based resources (second strategic objective). Secondly, the indicators and trends monitored for the bio-based economy are illustrative of the type of information that is considered useful for the circular economy and that needs to be uncovered to enable monitoring of the circular economy. As mentioned in Section 4.4, the information obtained from RVO.nl must first be converted into a form that can be used to measure the progress towards the circular economy. Even so, the information in its current form already provides a few interesting insights that also apply to the circular economy.
Results of bio-based economy monitoringBiomass consumption in the Netherlands is steadily growing, and currently totals about 13 million tonnes, per year. Between 2010 and 2014, biomass use for applications such as materials decreased, and increased for energy (Kwant et al., 2016). Subsequently, a slight decrease for energy and a slight increase for material applications was seen in 2015 (Kwant et al., 2017).
There has been a rapid increase in the number of companies, government bodies and knowledge institutes active in the bio-based economy (from about 950 in 2010 to over 1100 in 2014), and these are also increasingly working together (both within regions and between sectors). Such cooperation helps the Netherlands secure European projects, disseminate knowledge to companies and, in a later phase, operate successfully in the relevant markets. As well as providing synergy for the marketing of technology outside the Netherlands, working together also makes it possible to present a united front to obtain funding. The number of participants in bio-based economy-related networks has also grown (Kwant et al., 2016, 2017).
Investment in the bio-based economy totalled about 2 billion euros in 2014, which is 0.5 billion euros more than in 2013. Of this investment, about three quarters was for bio-energy and one quarter for bio-based materials or chemicals (Kwant et al., 2016). According to RVO.nl, the bio-based sector is still however in the start-up phase if we consider investments by companies. Many projects that focus on biomaterials are still in the applied R&D phase, while many projects with a bio-energy focus are in the market entry phase.
The Dutch share in global bio-based patents was 3.5% in 2011. However, the Netherlands clearly does better when
4.4 Available information
Useful indicators and other available data were obtained from the international indicators literature (Section 2.4), and an assessment was made of the data available from the Netherlands Enterprise Agency (RVO.nl).
The international indicators literature provides information on ways in which some of the indicators in Table 4.1 can be quantified, and the type of information that they can provide. This applies in particular to the innovation index – and the underlying indicators from the eco-innovation scoreboard – which, like the monitoring system in this report, is subdivided into input, throughput, output and outcome (EC, 2017c; Giljum, 2016a,b). Most of these scoreboard indicators are found in the capacity (able to) column in Table 4.1. The European Commission’s proposal for a circular economy monitoring system (2017b) also contains several indicators that are named in Table 4.1. However, the eco-innovation scoreboard and the circular economy monitoring system were developed for monitoring at the national level and have not yet been classified in terms of their contribution to substitution or the circular strategies (Section 4.3).
In the Netherlands, a lot of information about innovation projects is gathered by RVO.nl, which is the government agency responsible for implementing most government subsidy programmes for innovation projects, including those relevant to the circular economy (Green Deals, Bio-based Economy and other green growth themes). As such, RVO.nl collects a lot of information to measure the progress of these innovation projects, and therefore expects to be able to provide concrete information for about half of the indicators in Table 4.1. This information does however need to be converted into a form relevant to the circular economy (RVO.nl, 2017a,b), for example as described in Section 4.3.
Various pieces of information are therefore available in the Netherlands and other countries for monitoring the transition to the circular economy using the indicators in Table 4.1, although this information needs to be converted into a form relevant to the circular economy, as described in Section 4.3.
4.5 Baseline assessment
Some information is therefore currently available for monitoring the transition process of the circular economy, but most of this information needs to be converted into a form that can be used to measure the indicators in Table 4.1. It is therefore not yet possible to conduct a baseline assessment for transition dynamics monitoring. It is

454 Transition dynamics |
FOU
R
FOUR
provinces and municipalities regarding access to their data. This should include a discussion on monitoring frequency (e.g. once a year), to limit the workload for the relevant partners.
4.7 In summary
The systematic monitoring of the transition dynamics, that is, the use of means and the undertaking of activities to bring about achievements at the specific product group level, provides information about the progress being made in realising the intended transition effects. However, transition dynamics monitoring is relatively uncharted territory and often requires more qualitative monitoring.
The starting point, the speed and the direction of the transition to the circular economy will vary, depending on the priority theme and the specific product group within the priority theme. The generic indicators shown in Table 4.1 may therefore need to be adapted to fit the priority themes or specific product groups. It is then theoretically possible to aggregate these indicators per priority theme or across different priority themes. It may also be useful to add priority-theme-dependent or product-group-specific indicators to Table 4.1.
In this chapter, we provide a foundation for the implementation of transition dynamics monitoring in 2018. The aim of the proposed growth model is to quantify the transition dynamics indicators by first gathering all the available data (e.g. from RVO.nl, provinces and municipalities). When this has been done, we can determine which indicators still require data.
it comes to biomass gasification. The number of bio-based patents was however roughly average for fermentation and biomaterials (Figure 4.2). The Dutch Government invested almost 90 million euros in the bio-based economy in 2015, through tax exemptions, top sector policy and funding for research institutes. In the same year, the industrial sector invested about 275 million euros in bio-based R&D (Kwant et al., 2017).
4.6 Future steps
A suggestion is given in Table 4.1 for a set of generic indicators to monitor the dynamics of the transition to the circular economy at the specific product group level. We recommend involving RVO.nl in the monitoring of the transition dynamics as it is already involved in monitoring in other areas. Furthermore, these other areas can provide data for monitoring the transition dynamics. It is also recommended to involve other parties in the transition monitoring, such as CBS and Rijkswaterstaat; therefore, not only PBL and UU – who developed this monitoring component – but also, for example, provincial and municipal representatives who subsidise the circularity initiatives.
The form that the transition dynamic monitoring is to take has therefore not yet been finalised, but it is proposed to make use of a growth model approach. An impression of what is currently possible for bio-based projects at RVO.nl is given in Section 4.5, and the application of this data would help in the development of the indicators named in Table 4.1. Use could also be made of data from other relevant RVO.nl dossiers. At the same time, a dialogue should be entered into with the
Figure 4.2
Bioplastics/materials
Fermentation
Bio-gassing/pyrolysis
Catalysis andfermentation
Waste incinerationand other
0 1 2 3 4 5 6
% of global patents, per category
Source: RVO
pbl.n
l
Share of Dutch bio-based patents, 2008 – 2013
Average

46
FIVE
| Circular economy: what we want to know and can measure
The circular economy government-wide policy programme aims to halve the use of primary minerals, metals and fossil resources by 2030. This should relieve the pressure on the environment by reducing greenhouse gas emissions and water and land use. Furthermore, the circular economy transition should contribute to economic growth, jobs and reduced economic risk (e.g. security of supply and price volatility). These are the intended effects of the transition to the circular economy (IenM and EZ, 2016b).
The implemented circularity strategies, such as improving reuse (R3 – R7) and recycling (R8), are achievements that contribute to bringing about the effects named above. It is therefore relevant to determine which effects result from the adoption of the circularity strategies, and which are due to other autonomous factors such as economic growth, changes in the economic structure and population growth. In fact, this information is essential for the assessment and management of circular economy policy.
We explore three questions in this chapter: − Which indicators are required for effect monitoring?
We examine various ways in which measures of effects and achievements such as circularity strategies can be quantified.
− Which data is currently available? This can be used to develop a preliminary ‘baseline assessment’ for the Netherlands as a whole and for the various transition priority themes, but does not yet provide a comprehensive description of all the required indicators.
− What other data is required to achieve more comprehensive effect monitoring?
This chapter focuses on the national level: that is, it examines the whole of the Dutch economy and the information that this provides for the priority themes. To do this, a macroeconomic statistical framework is used. Information on resource use is obtained from the
Material Flow Monitor (Pol-de Jongh et al., 2016), and most of the remaining information is obtained from the national accounts (CBS, 2016b), environmental accounts and environmental statistics. The Material Flow Monitor describes the physical material flows, measured in kilograms, of natural resources, semi-manufactured goods and final products, to, from and within the Dutch economy. As the national accounts are compatible with the Material Flow Monitor, physical information (kilograms) can be coupled to economic information (euros). The Material Flow Monitor is therefore part of an integrated data framework that allows natural resources to be coupled to the environment, the economy and employment figures. The effects calculated in this way can also be coupled to the circularity strategies and autonomous factors such as population growth and economic development.
The CBS Material Flow Monitor and national accounts cluster millions of products into about 380 goods groups and 210 services groups (about 590 product groups in total). The hundreds of thousands of companies in the Netherlands are also grouped into 133 sectors, based on their main activities. The transition teams, however, often require detailed information about particular products, which is usually obtained through life-cycle analysis (LCA). This chapter therefore also discusses detailed effect monitoring, in particular as it applies to products.
In this chapter, we first discuss the effects that need to be measured to assess the progress being made in the transition to the circular economy (Section 5.1), addressing the points made in Section 2.2 regarding specification of the reduction goal. We then zoom in on what we can measure now and present the results of the baseline assessment of the national total (Section 5.2) and the priority themes (Section 5.3), before moving on to the monitoring of specific products using LCA techniques (Section 5.4). Finally, in Section 5.5, we address the growth model for effect monitoring and the requirements of the transition teams.
Effectsfive

475 Effects |
FIVE
FIVE
5.1 What we want to know
5.1.1 Effect indicators: national levelThe intended effects of the transition to the circular economy will be brought about by using fewer natural resources, reducing the pressure on the environment and improving economic growth, job opportunities and security of supply of resources. An overview is given of the indicators that can be used to measure these effects in Table 5.1.
ResourcesAs can be seen in Table 5.1, two approaches can be taken to measuring resources: 1) direct use versus use along the entire product chain, and 2) production versus consumption. These are shown at the top of Table 5.1. We can also couple the resources to existing indicators that are often applied in European policy, such as Domestic Material Consumption (DMC) and Raw Material Consumption (RMC), which are used, for example, in the European Commission’s Resource Efficiency Scoreboard (EC, 2015).
First shown in Table 5.1 is direct resource use, which is quantified using the Domestic Material Input (DMI)1 indicator. This indicator is the sum of resources extracted in the Netherlands plus imported resources that are used for production (e.g. iron ore to produce steel) and consumption (e.g. wood for consumers). The indicator measures direct resource use but does not take into account the use of resources in the rest of the product chain. For example, if a Dutch machinery manufacturer buys German sheet steel, this has no effect on the DMI because sheet steel is a semi-manufactured product, not a natural resource. Natural resources are however used to make the sheet steel. To analyse these flows, a chain indicator such as Raw Material Input (RMI) is used. As well as direct resource use, RMI also includes resource use for imported semi-manufactured goods and products, and therefore, in this example, the resources required to make the sheet steel used by Dutch machinery manufacturers.
If a Dutch machinery manufacturer were to decide to move production to Germany, the RMI would decrease. Ultimately, therefore, if every sector that uses direct and indirect resources were to leave the Netherlands, this would have a beneficial effect on DMI and RMI. However, it would not benefit resource use for Dutch consumption activities, which is why ‘consumption footprints’ are often calculated. These assign resources to the domestic final consumption. This means that, if a car is purchased in the Netherlands, it makes no difference whether the car was produced in the Netherlands or in Germany. The resources used are assigned to Dutch ‘consumption’
whatever the origin – this is the RMC indicator. The term ‘consumption footprint’ can be confusing, as it includes government consumption and investments made by companies, in addition to household consumption. We therefore use the term ‘consumer footprint’ in this report when talking specifically about the environmental footprint of households.
As discussed in Chapter 2 and here above, there are different ways of working towards the government-wide policy programme 50% reduction goal. On the one hand, we can measure the direct effects or the effects in the chain; on the other, we can consider the production or consumption perspective. This choice also affects the responsibility of the Netherlands for resource use ‘elsewhere’, that is in other countries. The formulas for the various indicators can be found in Appendix 4.
A second aspect that was also mentioned in Chapter 2 is the lack of distinction by resource type. The volumes of the various resources and their resulting environmental impact may vary enormously but, for indicators such as DMC, DMI and RMC, resources are calculated based on weight. It is therefore recommended to make the 50% reduction goal ‘smarter’, by taking urgency into account based on environmental impact, or economic risks or opportunities relating to resources and materials.
One last important aspect is the statistical reliability of the indicators. Generally speaking, the direct indicators are easier to measure and are more robust, as the product chain figures are based on estimates of the indirect effects, which requires information about other countries and model assumptions. As this information is stored in different databases and using different methods, the results may be inconsistent (Eisenmenger et al., 2016). If the product chain figures are to play an important role in the monitoring, it is important to develop a calculation method that takes into account the plausibility of the results, the ability to produce recent figures, the availability of data sources in the future and calculations made using limited means.
Environmental pressure and socio-economic effects The aim of the transition to the circular economy is to reduce resource use, but also to reduce environmental pressure and benefit the economy. The Dutch Coalition Agreement emphasises, for example, the benefits of the circular economy for climate policy. Greenhouse gas emissions – direct and in the product chain – are therefore one of the required indicators. It is also important to monitor the conservation of natural capital during the transition to the circular economy, which is why land use and water use in the Netherlands and in the product chain are included as indicators.

48 | Circular economy: what we want to know and can measure
FIVE
autonomous factors in an economy can also influence resource use, such as economic growth and population growth, but also changes in economic structure, such as globalisation, growth in the service economy, investment decisions and consumption patterns.
The ultimate goal of an effect monitor is to quantify the relationship between achievements, effects and autonomous factors. Although not fully quantified here, a start is made in Appendix 4. This requires integration of the various circularity strategies within the framework of the Material Flow Monitor/national accounts.
5.1.3 Effect indicators: priority themesIn theory, the same indicators are used for the priority themes as for the national level. In some cases, however,
Important socio-economic indicators are security of supply/self-sufficiency, growth in the circular economy and circular jobs. Although the direct effects are relevant here, some studies also highlight the importance of indirect employment effects due to the circular economy (Circle economy/Ehero, 2017).
5.1.2 Achievement indicators and autonomous factors: national level
Several variables influence resource use (and other circular economy effects). First of all, there are circular economy transition achievements, which can be measured using indicators such as material use or waste production. These generic indicators are influenced by the chosen circularity strategies, such as improved reuse (R3 – R7) and recycling (R8). However, many other
Table 5.1Summary of desired indicators for effects, autonomous factors and achievements
Effects
Direct Product chain
Resources
Production (input)
Consumption
Total DMI (resources)
Environment & nature
Land use Direct land use Land footprint
Water use Direct water use Water footprint
Greenhouse gas emissions Direct GHG emissions GHG footprint
Socio-economic
Security of supply/ self-sufficiency Extraction in NL for DMI (resources)
Circular value added Percentage of value added
Circular jobs Percentage of jobs
Autonomous factors
Population Population, jobs
Economic growth/structure Gross domestic product (GDP), globalisation measures, etc.
Achievements
General
Material use DMI (materials)
Waste production Waste production
Circularity ladder
Landfill
Incineration (R9)
Recycling (R8)
Repurpose (R7)
Remanufacture (R6)
Refurbish (R5)
Repair (R4)
Reuse (R3)
Reduce (R2)
Rethink (R1)
Refuse (R0)

495 Effects |
FIVE
FIVE
5.2.1 ResourcesFigure 5.1 shows the material flows in the Netherlands. These material flows are made up of resources and materials, including materials that are used in product parts and final products. Final products are categorised according to their primary constituent material; for example, cars are categorised as ‘metal’, as are iron ore and metal sheeting. Figure 5.1 presents both the production (processed materials) and consumer (material use) perspectives and shows recycling (R8) as a circularity strategy. The aim is to also include the other circularity strategies in this Sankey diagram at some point in the future.
Given the short time period of six years, it is not yet possible to draw conclusions about structural trends. This is because any differences seen are affected by the economic climate during these six years, which means that certain increases or decreases may be temporary rather than structural. This must be taken into account when interpreting the figures shown. The year 2014 is the base year against which the 50% reduction goal for 2030 will be compared. As far as the baseline assessment is concerned, this would seem to be well chosen as the Netherlands was just emerging from the economic crisis in 2014 (the economic crisis was still ongoing in 2010).
Resource use in the chain increases and direct resource use decreasesThe direct input (DMI) of raw materials for production in the Netherlands remained, at 314 billion kilos, roughly constant in 2016 compared with 2014, but decreased by about 7% compared with 2010. Domestic extraction consists primarily of natural gas, sand and gravel, as well as harvested crops. If biomass is not included, as is proposed in the main objective of the government-wide policy programme, the resource input decreased by 10% between 2010 and 2016, mainly due to a decrease in mineral imports and natural gas extraction.
Resource use in the product chain for production in the Netherlands (RMI), at 614 billion kilograms, is considerably higher than direct resource use, as indirect resources are required to manufacture imported product parts and final products. The RMI increased by 3% between 2010 and 2016, in contrast to the decrease in the direct input (DMI) of raw materials. This is due to the increase in the input of non-resources such as product parts and final products for Dutch consumption or export. This therefore illustrates how figures relating to direct use and use in the product chain can change and, therefore, the importance of a directive for monitoring the resource reduction goal.
priority-theme-dependent indicators are used. For plastics, for example, domestic plastic production is included as a specific indicator. The intention was to also include the achievement and effect indicators developed by the transition teams but these will not be finalised until early 2018 and will therefore be integrated into the monitoring system at a later stage.
Environmental and socio-economic effects can be assigned to various priority themes in three different ways: 1. By sector. Industrial sectors can be assigned to the five
priority themes, for example by including the furniture branch under manufacturing. Such divisions are also applied in top sector policy.
2. By product. It is also possible to focus on products. For example, we do not consider the automotive industry as a sector, but rather as the product ‘cars’. This is the perspective applied in the construction sector, for example, where we consider the environmental pressure of the built environment (the product of the construction sector).
3. By material. It is also possible to take a material perspective. Plastic in particular is a material that plays an important role in many different sectors and products.
There may be some overlap between these perspectives. For example, from a product perspective, construction may include the whole of the built environment, but under a sector perspective, buildings are assigned to their owners (e.g. households or the manufacturing industry). No clear demarcation is chosen for the different priority themes in the government-wide policy programme, and each perspective produces a different outcome. In this chapter, for purely practical reasons, we chose to take the sectoral perspective, as it is for this perspective that the most data is available. Where relevant, and where data is available, use is also made of the product or material perspectives.
5.2 What we can measure: national baseline assessment
In the previous section, we considered suitable indicators for effect monitoring. This chapter describes a preliminary ‘baseline assessment’ for both the Netherlands as a whole and the different priority themes, based on the available data. Note that this is a preliminary assessment, as not all the required data are available, there may be other data sources that we are as yet unaware of, and not all the requirements of the transition teams have been included.

50 | Circular economy: what we want to know and can measure
FIVE
Figure 5.12
Material �ows Dutch economy, 2014
Source: CBS
In billion kilos
Import
Domestic extraction
Biomass
Fossil
Metal
Mineral
ExportProcessedmaterials
Re-export
371
Energy use75
Short-cycleproducts (e.g. food)
15Materialconsumption
Addition to2014 stocks
Stocks refer to all products used for more than 1 year (e.g. buildings, telephones)
146
Stocks
130
43
Waste59
Recycling48
Into theenvironment
86130
328
430
119
pbl.n
l
Increased dependence on resources A little more than one third of the resources used directly in the Netherlands are also extracted in the Netherlands. For the rest, we depend on imports from abroad. The share of resources obtained from extraction in the Netherlands decreased by 15% between 2010 and 2016. This decrease in self-sufficiency, or shift from extraction to import, was particularly strong for fossil fuels.The resource consumption in the chain (RMC)3 indicator shows the resource footprint for the Netherlands. Although the RMC4 showed a slight decrease in 2016 compared with 2014, it decreased by 26% compared with 2010. A similar change was seen for the RMC excluding biomass. This decrease is mainly due to the drop in activities in the construction sector, which uses many minerals. The economic growth seen in the construction priority theme, as a whole, was entirely due to construction-related services.
Dutch economy resource-intensive, but resource use relatively low The resource input into the Dutch economy is high compared with the EU28 average. Even so, per capita resource consumption is low. This is because almost two thirds of the resource input is for export products. The
Netherlands is an export country, and a large proportion of its export consists of resource-intensive products. Fossil fuel consumption is however relatively high in the Netherlands, due to its energy-intensive sectors and low share of renewable energy in the energy mix (almost 6% in 2016) compared with other EU countries.
5.2.2 Environmental impactIn this section, we consider direct and indirect CO2 emissions, land use and water abstraction at the national level.
CO2 emissionsDirect CO2 emissions in the Netherlands decreased by 5% between 2010 and 2016. Even so, the Netherlands was one of the largest per capita emitters of CO2 in the EU28 in 2016. This is due in part to the energy-intensive economic structure of the Netherlands. The CO2 footprint due to Dutch consumption activities was lower than direct emissions from the Dutch economy in 2016. This is because import-related emissions were lower than export-related emissions, due in part to the export of energy-intensive products. Furthermore, the CO2 footprint decreased by 14% between 2010 and 2016. The reason for this is a decrease in emissions from the Dutch economy
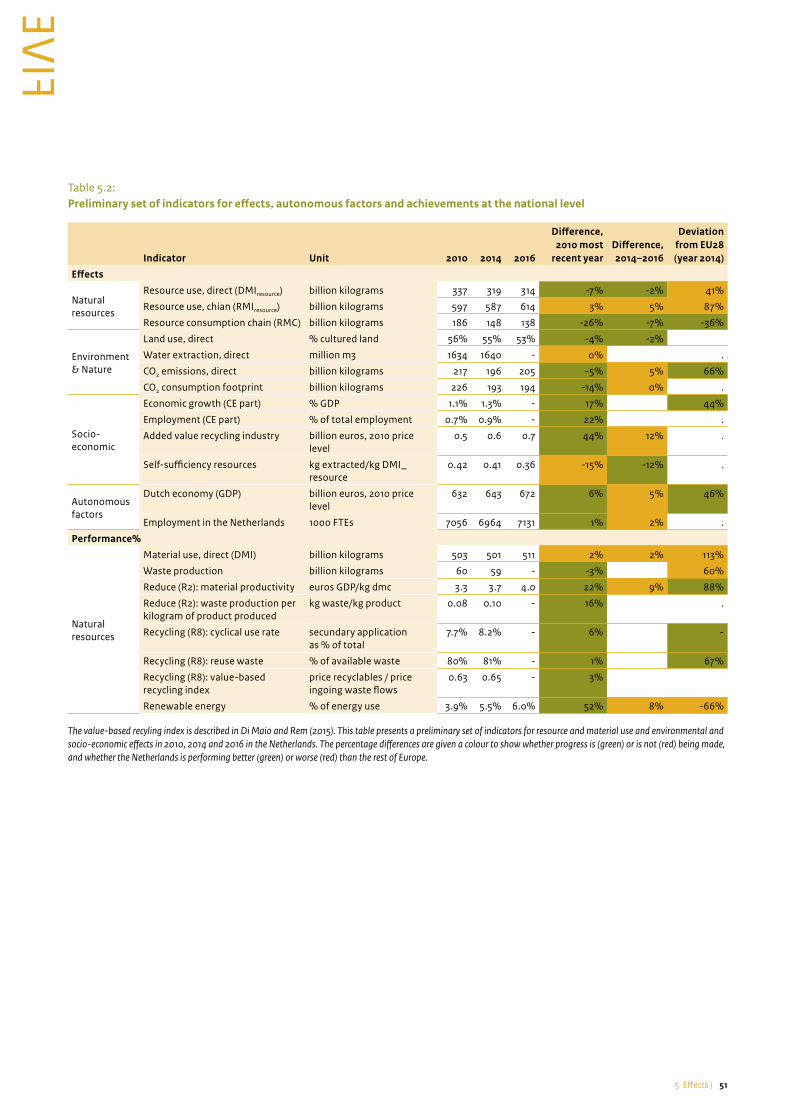
515 Effects |
FIVE
FIVE
Table 5.2: Preliminary set of indicators for effects, autonomous factors and achievements at the national level
Indicator Unit 2010 2014 2016
Difference, 2010 most
recent yearDifference, 2014–2016
Deviation from EU28 (year 2014)
Effects
Natural resources
Resource use, direct (DMIresource) billion kilograms 337 319 314 -7% -2% 41%
Resource use, chian (RMIresource) billion kilograms 597 587 614 3% 5% 87%
Resource consumption chain (RMC) billion kilograms 186 148 138 -26% -7% -36%
Environment & Nature
Land use, direct % cultured land 56% 55% 53% -4% -2%
Water extraction, direct million m3 1634 1640 - 0% .
CO2 emissions, direct billion kilograms 217 196 205 -5% 5% 66%
CO2 consumption footprint billion kilograms 226 193 194 -14% 0% .
Socio-economic
Economic growth (CE part) % GDP 1.1% 1.3% - 17% 44%
Employment (CE part) % of total employment 0.7% 0.9% - 22% .
Added value recycling industry billion euros, 2010 price level
0.5 0.6 0.7 44% 12% .
Self-sufficiency resources kg extracted/kg DMI_resource
0.42 0.41 0.36 -15% -12% .
Autonomous factors
Dutch economy (GDP) billion euros, 2010 price level
632 643 672 6% 5% 46%
Employment in the Netherlands 1000 FTEs 7056 6964 7131 1% 2% .
Performance%
Natural resources
Material use, direct (DMI) billion kilograms 503 501 511 2% 2% 113%
Waste production billion kilograms 60 59 - -3% 60%
Reduce (R2): material productivity euros GDP/kg dmc 3.3 3.7 4.0 22% 9% 88%
Reduce (R2): waste production per kilogram of product produced
kg waste/kg product 0.08 0.10 - 16% .
Recycling (R8): cyclical use rate secundary application as % of total
7.7% 8.2% - 6% -
Recycling (R8): reuse waste % of available waste 80% 81% - 1% 67%
Recycling (R8): value-based recycling index
price recyclables / price ingoing waste flows
0.63 0.65 - 3%
Renewable energy % of energy use 3.9% 5.5% 6.0% 52% 8% -66%
The value-based recyling index is described in Di Maio and Rem (2015). This table presents a preliminary set of indicators for resource and material use and environmental and socio-economic effects in 2010, 2014 and 2016 in the Netherlands. The percentage differences are given a colour to show whether progress is (green) or is not (red) being made, and whether the Netherlands is performing better (green) or worse (red) than the rest of Europe.

52 | Circular economy: what we want to know and can measure
FIVE
2014, and this growth was translated into jobs. CBS figures are currently only available for the Dutch environmental sector, which includes activities such as environmental protection and natural resource management. A better analysis of the ‘circular economy’ part of the environmental sector will be made in the future, to enable the better assessment of its contribution to the socio-economic effects.
The Dutch research institute TNO estimates that an increase in the circular economy will produce over 50.000 jobs and more than 7 billion euros (Bastein et al., 2013). These calculations are however indicative, as they do not take into account all the relevant economic effects (SER, 2016). A study by Circle economy/Ehero (2017) came to an estimate of 810,000 jobs due to the circular economy if indirect and support jobs are also included. This large difference demonstrates that a good look needs to be taken at the definitions and concepts applied to calculate the number of circular jobs.
5.2.4 Resources and achievementsThe economy grew by 6% between 2010 and 2016 – an important autonomous factor that increases resource demand due to increased consumption and investment. One achievement that may help reduce resource demand is material productivity. Material productivity may be expressed as GDP per unit material consumption (DMC). Between 2010 and 2016, material productivity increased by 22% in the Netherlands. Resources are also used more efficiently if less waste is produced per unit manufactured product (R2). This improved slightly between 2010 and 2014.
An increase in the use of secondary resources compared with primary resources also reduces resource demand (R8). Secondary resources consist primarily of waste materials that are recycled when a product is discarded. A total of 59 billion kilograms of waste was produced in 2014, of which over 80% was recycled (R8). This is the highest percentage of any country in Europe. However, the high percentage says nothing about the quality of the recyclate. The value-based recycling index (R8) shows that the price (turnover/kilogram product) of the recyclate was a factor of 0.65 of the price of the incoming waste streams ((purchase price + processing costs)/kilogram waste material) in 2014. This is because processing costs were paid for a third of the waste, and because these waste streams have no or very little value as recyclate, although this has improved slightly since 2010. About 8% of the total material input5 to the Dutch economy is secondary resource use. This share (also called the cyclical material use rate6 (R8)) has increased slightly since 2010. The main reason for this is an increase in recycled metal and mineral waste. Despite the high recycling percentage,
(domestic), plus an increase in the emission trade balance: export-related emissions have increased while import-related emissions have decreased. The CO2 footprint remained stable in 2016 compared with 2014.
A decomposition analysis (Meijer-Cheung et al., 2016) of the increase in direct CO2 emissions in the Netherlands shows that economic growth has been the main driver of CO2 emissions over the last 20 years. Without the reduction achieved in energy intensity and, to a lesser extent, the change in the energy mix, greenhouse gas emissions would in fact have grown much faster. The energy mix may play a bigger role in the future if more use is made of solar and wind energy. It remains to be seen to what extent circular economy-related achievements will contribute to a decrease in CO2 emissions.
Land use/biodiversityThe amount of agricultural land as a proportion of the total surface area of the Netherlands decreased by 4% between 2010 and 2016. However, in a circular economy, more use will be made of biomass as a renewable resource for the chemistry, construction and energy sectors, and its production will require more agricultural land. There is therefore a risk that this will be at the cost of natural capital and related ecosystem services.
Three quarters of the Dutch land footprint is located outside the Netherlands and, in 2010, this land footprint was equivalent to about three times the surface area of the Netherlands. The Dutch land footprint lies primarily in Western Europe, South America and Southeast Asia (Wilting et al., 2015).
Water abstraction and water footprintGroundwater and surface water abstraction in the Netherlands varies from year to year and shows no clear increase or decrease. Water is not, in general, a scarce commodity, and environmental damage due to drought is rare, and only seen during certain times of the year. The water footprint shows the amount of fresh water used for consumption activities in the Netherlands. Direct water use by households represents just a few percent at the most of the total water footprint for Dutch consumption, and most water is used for imported agricultural products (Mekonnen and Hoekstra, 2011). Although there is enough fresh water available for the present and future generations, the uneven geographical distribution of fresh water means that serious drought is experienced in other areas of the world (Wilting et al., 2015).
5.2.3 Socio-economic effectsThe proportion of economic activities that focuses on resource conservation represents just over 1% of value added. However, this increased by 17% between 2010 and

535 Effects |
FIVE
FIVE
In addition, data is currently only available for 2010 and 2014. However, this period is too short to be able to draw conclusions about structural trends, also because of the specific economic developments that took place during this time.
5.3.1 Sectoral comparison of priority themesThis section compares the effect indicators for the various priority themes. It does so purely from a sectoral perspective, and therefore does not consider the material or product perspectives. This sectoral perspective does not result in any overlap between priority themes, which made it possible to produce the figure shown below. Certain economic activities in the Netherlands, such as transport and electricity generation, are beyond the scope of this report and labelled ‘non-priority’.
The priority themes are together responsible for 60% of the direct resource input in the Dutch economy. A large proportion of this is biomass for the biomass and food priority theme and minerals for the construction priority theme. Metal ores, which represent a smaller mass, are only used by the manufacturing industry (base metals). Only for fossil fuels, the non-priorities have the largest share, as their direct use is mainly for electricity generation and transport sector services. However, this changes if a product chain perspective is taken, as many of these services are supplied for priority themes. This can be demonstrated using CO2 emissions. If a product chain (production footprint) approach is taken, the share of the priority themes is larger because the CO2 released during electricity generation is assigned to the related priority theme.
The five priority themes are addressed in the following sections. The results for each indicator are presented in Appendix 6.
5.3.2 Biomass and foodThe biomass and food sector made direct use of approximately 70 billion kilograms of natural resources in 2014, primarily in the food and beverages industry. Most of this was agricultural produce (biomass). Biomass waste is used to produce feed in the cattle feed industry. Although the resource input increased by 3% between 2010 and 2014, it remained less than the increase in value added (5%). This would imply a slight increase in resource productivity, although no significant change was seen in material productivity. Agricultural yield per hectare did increase, while it was already high compared with other countries. However, efficient land use is also accompanied by the intensive use of artificial fertilizers and pesticides.
therefore, a relatively large amount of primary resources is still required for production. It should also be noted that the Netherlands also has the highest cyclical material use rate in Europe7.
This large difference (over 80% recycling but about 8% secondary material use) can be explained by the fact that about 5 times more material is required as input in the Dutch economy than is produced as waste. In addition, the share of secondary resources will never be 100%, as a large proportion of biomass is used as food and because fossil fuels are still used for energy generation.
There are of course other achievements in the circularity ladder that influence resource demand, such as product lifespan extension, other ways of consuming, and the substitution of scarce, non-renewable resources with renewable resources. Substitution is achieved to some extent through the energy transition from fossil to renewable fuels. It is currently not possible to quantify the extent to which the various factors and achievements contribute to a change in resource demand (see Section 5.1 and Appendix 4). One example given above is the decrease in mineral use in the construction sector. Further analysis is needed to assess whether this decrease is due to the more efficient use of minerals (achievement) or a decrease in construction activities as a result of economic developments (autonomous factor).
5.3 What we can measure: baseline assessment of the priority themes
In the previous section, we discussed the effects and achievements at the national level. Five priority themes are defined for the Netherlands that can be used to work on the transition to the circular economy. These five priority themes are biomass and food, construction, manufacturing, plastics, and consumer goods.
As sectoral data is currently available, CBS has worked together with the transition teams to define the priority themes along the lines of the economic sectors. It should however be noted that this represents a preliminary definition, as some sectors could not be split as required within the scope of this project. For example, in the current definition, the plastics priority theme is overestimated and the construction sector theme is underestimated. This is discussed in full in Appendix 5. Some transition teams indicated that they would also welcome the further development of the product and material perspectives.

54 | Circular economy: what we want to know and can measure
FIVE
of plastics produced. Little biomass is currently used to produce plastic, which means that the flows cannot yet be measured properly at the macroeconomic level. According to the CPB Netherlands Bureau for Economic Policy Analysis (CPB), the share of bioplastics is about 1% (CPB, 2017), which would indicate that the bio-based economy is still in the start-up phase.
Total waste production decreased, but this was due to a section of the chemical industry (closure of a phosphorus factory) that was not involved in plastic production. Very little plastic waste is produced directly in the plastic sector. More relevant, however, is the total amount of plastic waste (including plastic in composite products, plastic litter and plastic in the oceans). Although a comprehensive overview is not yet available (CPB, 2017; KIDV, 2017), figures are available for the amount of plastic waste that is suitable for processing by recycling companies (this increased between 2010 and 2014). As far as plastic collected from households is concerned, most of it is a mix of all kinds of plastics and films, which makes recycling difficult (CPB, 2017). Regarding the circularity ladder, information on secondary material input (R2) is not yet suitable for publication.
5.3.4 Manufacturing industryOf the 12 billion kilograms of natural resources used in total (metal ores and fossil fuels), most of this is used in the base metal industry. Direct resource input decreased
As far as waste is concerned, the results show that the waste indicators were reasonably stable (both waste production and food wastage). The circularity ladder has indicators for R2 (reduce) and R8 (recycling). Both in agriculture and in the food industry, a considerable proportion of resources are input as secondary resources (animal manure in agriculture and vegetable waste in the food industry). The amount of waste produced per unit product decreased between 2010 and 2014, mainly due to an increase in resource input in agriculture, while waste production remained constant.
Regarding the product perspective, data is available on the consumption of organic food, which showed a strong increase between 2010 and 2014, although it did start at a low level.
Direct CO2 emissions decreased by about 15% between 2010 and 2014, mainly due to reductions in the agricultural sector, while a slight increase was seen in the food and beverages industry. The CO2 production footprint also decreased, although less than direct emissions.
5.3.3 PlasticsThe plastics sector declined between 2010 and 2014, both in terms of value added (2%) and jobs (3%). However, resource use (in particular fossil fuels) decreased much more than this (17%) due to an increase in material productivity. Slight growth was seen in the total amount
Figure 5.28
Natural resources
Biomass, direct
Fossil, direct
Metals, direct
Minerals, direct
Environment
CO2 emissions, direct
CO2 emissions, chain
0 20 40 60 80 100
% of total
Source: CBS 2016
pbl.n
l
Priorities (sectoral division)
Biomass and food
Construction
Consumer goods
Plastics
Manufacturing industry
No priority
Share of priorities in effect, 2014
555 Effects |
FIVE
FIVE
5.3.6 Consumer goodsDirect household resource use decreased by 9% between 2010 and 2014. The main resources used were fuels (gas and transport fuel) and biomass (in the form of food). The decrease in resource use is largely due to a decrease in fuel use, which is also reflected in a decrease in direct CO2 emissions. The amount of waste produced also decreased (10%), while the amount of waste remaining after recyclable waste has been removed decreased by 5%.
As far as the circularity ladder is concerned, a significant increase was seen in reuse indicators (R3). The value added of second-hand shops as a percentage of total retail trade also increased by 28%. A study by CBS shows that households are placing more goods for sale online (CBS, 2013), which indicates that households increasingly sell their goods before they have technically reached the end of their useful lives. We also see an increase in product sharing, such as car share schemes. The number of cars in such a scheme increased from 2.000 in 2010 to 11.000 in 2014. Nevertheless, the number of cars per capita also increased in recent years.
Regarding repair (R4), a slight decrease was seen in household spending on repair services between 2010 and 2014. As far as recycling (R8) is concerned, the value of resources in waste (after recyclable waste has been removed), in particular gold in discarded consumer electronic goods, totals about 57 million euros.
5.4 Effect monitoring: specific product groups
Another dimension to effect monitoring became clear during the interviews conducted with the transition teams, which is that, for an individual company or organisation, the purpose and scale of effect monitoring is very different than for monitoring at the national level. Many companies are interested in exploring the environmental impacts (or economic aspects) of their products and are prepared to base operational or supplier chain activities on the results. Using life-cycle analysis (LCA), companies can obtain detailed information that helps them decide which actions they can best take to reduce the environmental impact of their products. Various LCA methodologies are applied by research institutes and commercial parties, and the methods, assumptions and data used can differ. Several transition teams therefore indicated a need for more consistency between these methodologies.
by 14% between 2010 and 2014, despite a 5% increase in value added in this sector. Although a particularly strong increase in value added was seen in the electronics sector, this is barely reflected in the direct material input as this sector largely uses small amounts of high-value products.
An improvement was seen in waste production and circularity ladder achievements for all indicators. An improvement was also seen in material productivity. The available environmental and socio-economic indicators also all show an improvement, with the exception of jobs. The base metal industry makes by far the largest contribution to direct CO2 emissions and water abstraction. The share of the manufacturing industry that provides products and services that focus on resource management – in particular fossil fuel reduction – is about 1%, but this did increase between 2010 and 2014. The same applies to employment.
5.3.5 Construction sectorFollowing the economic crisis, the construction sector went through a period of decline between 2008/09 and 2013, followed by recovery. A significant drop was also seen in the number of jobs at this time (10% between 2010 and 2014). As a result, resource use also decreased during the same period (12%), as did direct CO2 emissions (9%) and water abstraction (29%). The construction sector, and in particular the building industry, is a relatively large user of resources, in particular mineral resources. Most mineral waste is produced during demolition activities, but almost all of this is used again in other construction activities such as civil engineering projects.
Material productivity in the construction sector improved by 17% and the amount of waste produced decreased by 5%. A slight improvement was seen in the achievement on the circularity ladder (R2) – waste produced per kilogram of manufactured product for the building materials industry. An improvement was also seen in the cyclical material use rate (R8). Secondary resource input increased from 30% of the total input in 2010 to 33% in 2014.
All kinds of economic activities are included in the construction sector, from estate agents and architects who provide services and use few materials, to installation and finishing activities that use a lot of semi-manufactured and final products, to other construction activities and the building materials industry which use a lot of raw materials. Most of the natural resources used consist of domestic sand and imported gravel. Demolition activities are a special case as they use few materials but produce construction and demolition waste.

56 | Circular economy: what we want to know and can measure
FIVE
Transition agenda requirements Various interviews and meetings were held to discuss the monitoring requirements for the transition agendas. However, as the final reports are not expected until early 2018 it is not possible to address all the requirements in this monitor, and they will need to be added to future versions of the circular economy monitor.9
Classification of the sectors into priority themes was conducted in consultation with the transition teams. However, it was not possible to meet every requirement. For example, we were unable to sub-divide some sectors as requested. This led in particular to an overestimate of the effects for plastics10 and an underestimate for the construction sector. It is therefore recommended to reclassify the sectors in the next monitor. It is also important to classify the priority themes from the product and material perspectives, as these are important aspects in the debate of some transition teams.
Stocks/urban mineOne aspect that has not yet been addressed is the importance of stocks. The effect monitoring described in this report is based on material flows, but there is a large amount of stocks stored in the Dutch economy, such as capital goods (e.g. machines and buildings) that are released at the end of the lifespan of these products. These materials could then be reused in the economy as resources. It is useful to analyse the amount and potential of materials in this ‘urban mine’, as this contributes to our understanding of what will be released in the future.
National effect monitoring A number of specific improvements to the national effect monitoring framework are discussed below. 1. Measuring effects a. Although national figures are published regularly for
resource use (RMC) and the production and consumption CO2 footprints, other footprint figures (e.g. water, land use, biodiversity) are not.
b. The resource indicators only provide information on changes in the total mass of a particular resource. However, weight is not a suitable measure of the urgency of reductions in the various material flows. Additional criteria are therefore required that say something about the economic and environmental impact, such as scarcity, security of supply, ecological limits or safety. Such criteria can be used to make the 50% reduction goal ‘smarter’.
c. An economy consists of various actors (households, companies, financial institutes and government bodies) that operate at different levels, and each of
Another point often made during interviews with the transition teams was the use of the term ‘preservation of value’. This could be taken to mean something relatively simple, such as the price difference between secondary and primary materials, but it could also include social value.
5.5 Growth model for effect monitoring
In this chapter, we identify the first elements for effect monitoring for the circular economy. This will need to be developed further in the years to come, and various suggestions for doing this are made below.
Update existing dataData can be brought up-to-date by producing more recent figures but also by ensuring that existing data reflects the needs of the monitor. Currently, the most recent year of the Material Flow Monitor is 2014, which clearly needs updating. It is also important to create a time series prior to 2010 for some aspects of the Material Flow Monitor, to assess whether certain changes are structural or simply an artefact of a short, economically turbulent, period. Improvements could also be made to the data and indicators derived from this data. For example, investments can be attributed to specific sectors, and the cyclical material use rate could be determined excluding biomass and fossil fuels (for energy applications).
Purpose and scale of effect monitoring As mentioned in Section 5.4, the national scale may be too high a level of aggregation for effect monitoring for individual companies or organisations. Although we have focused primarily on effect monitoring at the national level in this chapter, it is also important to concentrate on the product level in the growth model.
Various transition teams mentioned the usefulness of harmonising the LCA methodologies applied. Many different methodologies are currently used, which vary in their approach and the data they use. This can produce results that are confusing and possibly less credible. More harmony between the LCA methods would therefore increase the robustness of the effect monitoring. Despite the many differences between LCA methods and product footprint calculations at the national level, there are also many similarities. We therefore recommend analysing the methodological and empirical differences between the methods and, where possible, turning these to an advantage.

575 Effects |
FIVE
FIVE
c. As the CPB has pointed out, it is difficult to calculate exactly how much plastic there is in composite products. However, this problem does not just apply to plastics. Product composition information that can be coupled to the Material Flow Monitor is important for calculating security of supply, substitution and waste flow composition.
Notes
1 There are two types of DMI. DMI for resources only includes
resource inputs. DMI for materials, just like DMC and RMC
indicators applied in European policy, however, includes all
materials (natural resources, semi-manufactured goods and
final products).
2. Adapted from Haas et al. (2015). An important difference in
methodology is that biomass consumption is included as
‘material use’ and not as ‘energy use’ in the Sankey for the
Netherlands. The quantity of materials in ‘stocks’ is
unknown. The figures shown may differ from those in
Table 5.2 due to differences in methodology and definitions.
3 RMC calculations are made based on a model developed by
Eurostat (Eurostat, 2016). This model is still being developed
and will be tested further by CBS. Other models used to
calculate the RMC give different results (Eisenmenger et al.,
2016). In choosing a model, a balance needs to be found
between calculations that are reliable, up-to-date and not
too complex.
4 Instead of RMC, DMC is often used internationally as a proxy
for calculating domestic resource consumption. DMC is
relatively simple to calculate and therefore a robust
indicator that can be used by several countries. However,
RMC is regarded as a better indicator than DMC because the
resources required to make each product are calculated. As
a result, heavy industry moving abroad does not affect the
RMC, while it improves the DMC.
5 Excluding re-exports and sand used for raising roads and
embankments.
6 Adapted from the cyclical material use rate indicator,
developed by Kovanda (2014).
7 This Eurostat figure is however based on material
consumption and not material input, which is what the 8%
calculated for the Netherlands is based on. Improving the
compatibility of the CBS and Eurostat methods will be
investigated in 2018.
8 Water abstraction does not include cooling water. The
‘consumer goods’ priority theme only includes households.
9 There is also a need for international benchmarking. We
therefore recommend that certain indicators are also
collected for other European countries.
10 This is an unusual priority theme in that the sector is
relatively small at the national scale but, from a materials
perspective, plastics are an important resource in Dutch
society.
these actors plays a different role in the transition process. Compiling the statistics from an ‘actor perspective’ enables analysis of these roles. For example, a government body may act as a ‘launching customer’, or companies may carry out investments to develop their production technology.
d. The current government’s Coalition Agreement emphasises the contribution that the transition to a circular economy will make to climate goals. For this to be achieved, however, the relationship between material use, energy and emissions will need to be more precisely defined in existing databases. This can be done, for example, by considering the energy mix (in particular for electricity) and transport emissions, but also the carbon account (Lof et al., 2017), which incorporates the carbon in materials and emissions as well as carbon storage.
e. Calculating the share of the economy and jobs that can be considered circular requires further development of the methodology. Some components, such as the number of jobs in the environmental service sector, are easily measured. Others, such as ‘repair’ as a manufacturing industry sub-activity, require sectors to be more precisely defined. The share of the circular economy in the environmental sector also needs to be determined more accurately.
f. The term ‘preservation of value’, which relates to the high-quality application of resources, is often named in the transition debate and needs to be defined more accurately.
g. The security of supply of critical materials, which also plays an important role, needs to be calculated empirically. A TNO study that focused on this was based on data from the Material Flow Monitor (Bastein et al., 2013), and could be elaborated to develop an official indicator for security of supply in the circular economy monitor.
2. Achievements/factors and effects a. Although the model for coupling the achievements/
factors has not been fully developed in this chapter, an initial attempt is made in Appendix 4. This model could be used in decomposition analyses (historical analysis) or in studies such as the TNO ex-ante evaluation (Bastein et al., 2017).
b. Data is not yet available for all the achievements on the circularity ladder. Furthermore, the data that is available for some achievements does not yet quantify exactly what we want to measure. Data could be added to the model if the circularity ladder were to be included in the Material Flow Monitor/national accounts framework. It is however recom-mended to start with the elements in the circularity ladder that have the most impact on resources at the macro level.

58
SIX
| Circular economy: what we want to know and can measure
Reflectionsix
The monitoring system that is described in the preceding chapters for measuring the progress made in the transition to the circular economy in the coming years, places the Netherlands at the international forefront of such developments. At the same time, a set of 10 indicators have been developed in France (Magnier et al., 2017) and the European Commission has published a set of 10 circular economy indicators (EC, 2018). Both of these sets of indicators focus on monitoring at the national level, while the European Commission also places an accent on waste and recycling. Furthermore, both of these sets contain only a few indicators for measuring the progress made in the transition process that is to bring about the intended circular effects. The monitoring system developed in this report lays a broad, firm foundation for systematic monitoring of both the transition process and its effects, at the national level and at the level of the priority themes and specific product groups. By monitoring the transition process, and more specifically the transition dynamics, this monitoring system represents an important, innovative contribution, both nationally and internationally.
The monitoring system developed in this report consists of three monitoring components: action monitoring, transition dynamics monitoring and effect monitoring. For each of the three components, a description is given of the form that the monitoring is expected to take, what we can already measure using available indicators and data (the baseline assessment) and what actions still need to be taken for full implementation of the monitoring system. The monitoring system should therefore be considered a growth model. This chapter reflects on the monitoring system as it currently stands and what, given its growth model, still requires development.
The focus in this chapter is on the monitoring system as a whole. This monitoring system also allows for monitoring of the transition agendas, as discussed in Section 6.1. In the next section, we consider what, drawing from the baseline assessment, we can say about
the progress being made in the transition to the circular economy (Section 6.2). This also illustrates what we are currently able to measure and what we are not yet able to measure. This is followed by a discussion of further developments required in the monitoring system (Section 6.3). A summary is given at the end of the chapter, in the context of the monitoring system growth model (Section 6.5). In Section 6.4, we consider the monitoring system described in this report in relation to circular economy monitoring in the international context.
6.1 Transition agenda monitoring
In parallel to the development of the monitoring system described in this report, the five transition teams worked hard to draw up transition agendas for the priority themes (Transitieteams, 2018). The transition agendas provide a starting point for priority-theme-dependent and product-group-specific monitoring, and development of such monitoring is considered part of the growth model in this report. Some general reflections can be made, based on these transition agendas and the framework developed in this report.
In Section 2.2, the question was posed whether the 50% reduction goals for 2030 should be differentiated by priority theme. The transition agendas do not yet include concrete resource reduction goals (or a resource ceiling for the biomass and food priority theme), nor are the objectives for achieving the circularity strategy described in any detail. Such goals and objectives are however important for measuring the progress of the transition to the circular economy in each priority theme, and this should therefore be a focal point of future work. Of course, such goals should be agreed on with the further development of the transition agendas.
The circularity ladder shown in Figure 2.2 takes a central role in the developed monitoring system (Section 2.3). After all, it is the circularity strategies described in the

596 Reflection |
SIX
SIX
ladder that are to bring about the reduction in resource use. The circularity ladder in Figure 2.2 focuses on product function, whereas other circularity ladders largely focus on the products themselves. This focus on product function makes it possible to deliver functions using radically different ‘products’. For example, vegetables can be labelled using laser marking rather than plastic packaging, blankets can be used outside bars and restaurants instead of heaters, and car sharing can replace car ownership. Some transition agendas already make use of a circularity ladder, although not necessarily the ladder shown in Figure 2.2. Other transition agendas do not yet use the circularity ladder, or seem to be stuck on the lower level circularity strategies (recycling, e.g., which is still close to a linear economy strategy) (Potting et al., 2016; Ganzevles et al., 2016). For monitoring to be consistent and meaningful, it is recommended that the transition teams all use the circularity ladder shown in Figure 2.2 and that they actively incorporate it in the further development of their transition agendas.
Some of the transition agendas already include focal points for monitoring the progress of the circular transition in their priority theme. All the transition teams are very much interested in the environmental impact of the product groups within their priority themes and focus on the whole of the product chain rather than just their particular part of it. Life-cycle analysis (LCA) is considered to be the obvious method for assessing this impact, although the transition teams do express a need for clear, controllable and independent LCA. The construction sector uses a specific method for determining the environmental performance of buildings and civil engineering works (Milieuprestatie gebouwen en GWW-werken) as well as the national environmental database (NMD) for this. This method includes calculation rules and validation guidelines for calculating the environmental performance of a whole project based on the performance of the products and elements used (SBRCURnet, 2015; Stichting Bouwkwaliteit, 2017).
Similar calculation rules could also be developed for other priority themes or for the specific product groups within these themes. In addition, the NMD could be extended to include data relevant to these specific product groups. Alternatively, such data could be obtained from the CBS databases. This would mean that the same data is used for effect monitoring at the national level and for the priority themes and specific product groups, benefitting consistency at the various monitoring levels. One disadavantage of this is that the CBS data can ‘only’ be organised in 280 product groups whereas, as the transition agendas show, there are many
more specific product groups in the priority themes than possible in the CBS data.
The development of clear, controllable and independent forms of LCA at the product group level will improve acceptance of the results amongst societal partners. However, the variety in products means that this involves a lot of work. A start could be made with a few ‘easy’ product groups, and this is part of the monitoring system growth model developed in this report.
6.2 Status of baseline assessment
We already have a good idea of the quantities of resources used for production and consumption in the Netherlands, the amount of waste produced and how much of this is recycled to produce secondary materials. For many years, the Netherlands has been at the forefront of waste recycling (80%) and material productivity (in euros/kilos material) in Europe. However, the use of secondary materials in the Dutch economy is just 8%. This large difference (over 80% recycling but 8% secondary material use) can be explained by the fact that about 5 times more material is required as input in the Dutch economy than is released as waste. A large proportion of natural resource use in the Netherlands is for food and energy (which can never be based for 100% on secondary materials). The goal to halve the use of abiotic resources therefore represents a considerable challenge.
It is not yet possible to fully quantify the environmental and socio-economic effects of the transition to the circular economy. This applies not just to recycling (R8), but also to other circularity strategies such as ‘extend lifespan of products and it parts’ (R3 – R7) or ‘smarter product use and manufacture’ (R0 – R2) (Figure 2.2). Because the circularity strategies cannot yet be quantified, it is difficult to calculate the share of the circular economy in the total economy or the number of circular economy-related jobs. It should be noted that changes in employment levels between sectors are often difficult to measure anyway. In the case of the circular economy, this may be because a company decides to start carrying out repairs without a change in the number of employees – a variable that is easier to measure at the macroeconomic level. Changes within companies are therefore difficult to discern in the statistics. Furthermore, most of the information currently available for many indicators applies to the national level and the five priority themes in the government-wide policy programme, and much less to the specific product groups.

60 | Circular economy: what we want to know and can measure
SIX
6.3 Status of monitoring system
6.3.1 Smart effect goalsThe government states in the government-wide policy programme that it aims to reduce abiotic resource use in the Netherlands by 50% by 2030, and that the country will be fully circular by 2050. As described earlier in Section 2.2, this goal requires further elaboration. The monitoring system assumes that both the consumption and production footprints are useful tools for closing chains, reflecting the first (focus on efficiency in existing chains) and the third (focus on new chains) strategic objectives. Differentiation of the reduction goal by resource can illustrate the extent to which the reduced use of each resource benefits security of supply and the environment (climate change, biodiversity and natural capital, health and safety).
The reduction goal can also be formulated in terms of carbon dioxide. A generic reduction goal for carbon dioxide (and other greenhouse gases) puts the focus on resources and the semi-manufactured goods and products made using these resources with a large carbon dioxide footprint. However, the government-wide policy programme does not focus specifically on carbon dioxide and the climate, but also focuses on other environmental goals (e.g. for water use, land use and biodiversity) and on security of resource supply and future availability. Reformulation of the reduction goal in terms of carbon dioxide (or greenhouse gases) is however in line with the current government’s Coalition Agreement, which links implementation of the government-wide policy programme to climate goals.
These points should therefore be taken into account in the further elaboration of the 50% reduction goal for abiotic resources in 2030. After all, it is not so much about reducing resource tonnage, but the effects of resource use on the environment and security of resource supply. This will enable the smarter definition of the 50% goal, and also allow it to be related to ecological limits. It is therefore important to consider these issues, as progress towards the circular economy can only be measured against a concrete reduction goal.
6.3.2 Monitoring components and indicator typesThe effect monitoring and the action monitoring are ready for implementation, although it is not yet possible to measure all the indicators. Indicators have been proposed for the transition dynamics monitoring, but these still need to be made quantifiable, and this requires suitable data. Despite the fact that not all the indicators for the three monitoring components can currently be quantified, it is clear that the type of indicator differs
Various actions are described in the government-wide policy programme that require input from the government. The status of these actions is known, and more than half of them have either recently been initiated or were initiated some time ago. Some of the actions will not be initiated until the transition agendas have been published, and some are waiting for the completion of other actions. In addition, some of the actions need to be revised or reformulated, in most cases to reflect the transition agendas or new ideas. Furthermore, although some actions have been expressed as SMART objectives (Specific, Measurable, Acceptable, Realistic and Time-bound), most have not. The actions’ relationship with the effects and the transition process, in particular regarding the intended policy output, could also be made more explicit than it currently is.
Policymakers have high expectations of the transition agendas in terms of bringing about the resource reduction and strategic objectives of the government-wide policy programme. However, as the transition teams point out in their transition agendas and interviews, more binding measures are also needed to bring about the resource reduction goal. These are already provided to some extent in the government-wide policy programme (IenM and EZ, 2016b), with its broad set of generic instruments, including pricing and dynamic legislation. However, the further implementation of the proposed actions for each intervention and priority theme need to continue during the coming years.
Transition dynamics monitoring is relatively uncharted territory. Because the starting point, the speed and the direction of the transition to the circular economy will vary depending on the specific product groups within a priority theme, it is therefore recommended to ascertain the progress made in the specific product groups within that priority themes. This requires further development of the generic indicators presented in this report, as well as the possible development of priority-theme-dependent or product-specific indicators. The formative phase of the innovation process in particular requires a different type of indicator; in many cases, an indicator that is descriptive and requires further clarification for interpretation of the results (see Section 6.3.2). Such indicators are not yet available, or very rarely. Consequently, no comprehensive baseline assessment has as yet been conducted for the transition dynamics. These more qualitative indicators could be developed together with the stakeholders involved in the transition agendas. Various quantitative information is also available, but this needs to be converted into a useable form. Concrete indicators therefore often also need to be developed for this monitoring component.
616 Reflection |
SIX
SIX
the circularity strategies (Figure 2.2). For example, this can clarify the number of media reports for each circularity strategy. As a general rule of thumb, higher level circularity strategies benefit resource use and the environment more than lower level circularity strategies. The hierarchy of the circularity strategy sub-classes helps in the interpretation of the qualitative (nominal) indicators. It remains important, though, to provide a clear explanation of the information on which the indicators are based.
As with the effect indicators, it is possible to measure the implementation of the circularity strategies on a sliding scale. Examples are the amount of recycling or the value added of the share economy.
6.3.3 Reflective monitoringBecause the transition process can take a long time and does not immediately result in quantifiable effects, we make a distinction in the monitoring system between intended effects and the process of change, or transition process that is required to bring about these effects. We need to monitor the transition process so that we can assess the progress being made: are we on course in terms of achieving the long-term effects, or do adjustments need to be made, and what are the corresponding factors for success and failure (reflective monitoring). The monitoring system therefore serves as input to a management system.
6.3.4 Tiered monitoring structureA tiered structure for the monitoring system was proposed in Section 2.7 to measure the progress made in the transition to the circular economy (Figure 2.3). This tiered monitoring structure is based on a proposal made by a group of European environmental protection agencies (EPAs) for a monitoring structure that measures the progress made in the transition to the circular economy at the European level (Potting et al., 2017). The EPAs, in turn, based their work on a similar tiered structure in the European Commission Resource Efficiency Scoreboard (EC, 2016a).
The monitoring system in Figure 2.3 shows a top layer with generic core indicators, an interim layer with generic dashboard indicators and a third layer with priority-dependent and product-specific indicators. In each layer, a distinction is to be made between transition process indicators and effect indicators. The third layer for priority-dependent and product-group-specific monitoring also allows for input from the transition agendas.
The idea behind this tiered structure is that the core indicators provide a quick overview of the progress being made towards the circular economy, while the dashboard
between – and, to some extent, within – the three monitoring components.
For example, the effect monitoring consists entirely of quantitative indicators that measure effects on a sliding scale that includes zero. Conclusions can therefore be drawn about the measured effects in terms of increases and decreases. Decomposition analysis can also be applied to assess the influence of certain achievements on the effects (resources, greenhouse gas emissions, the economy and jobs). As a result, circularity ladder achievements and resource substitution can be related to effects. The action monitoring and transition dynamics monitoring consist of a mixture of quantitative and qualitative indicators. Up to now, the implementation of many actions has been measured as a qualitative indicator (they have been implemented or not). The same applies to some transition dynamics indicators. This has consequences both for the continued relevance of these indicators and their explanatory power.
Once an action has been completed and a follow-up action has been initiated, the first action usually no longer needs to be measured, as a different indicator is used for the subsequent action. The situation is similar for transition dynamics monitoring. The drawing up of the Dutch natural resources agreement was an important step, but has become less relvant in the development of a generally accepted approach to the circular economy transition. After all, the transition teams have now translated this natural resources agreement into concrete transition agendas. The relevance of the concrete indicators for the action and transition dynamics monitoring can therefore change in time, while the relevance of the quantitative effect indicators generally remains stable.
In terms of the contribution made to the transition process, the number of circular economy media reports for example says little about the importance of each individual report (considering, e.g., the number of copies of the medium in which the report appeared). Furthermore, although the number of obstacles removed in laws and regulations may give some information, the influence that this has can vary enormously.
Quantitative indicators, measured on a sliding scale that includes zero, therefore provide clearer information than qualitative indicators. However, such qualitative indicators are more powerful if they include a clear explanation of the information on which they are based. As a first step, the action and transition dynamics monitoring can be made more powerful by measuring the contribution that the qualitative indicators make to
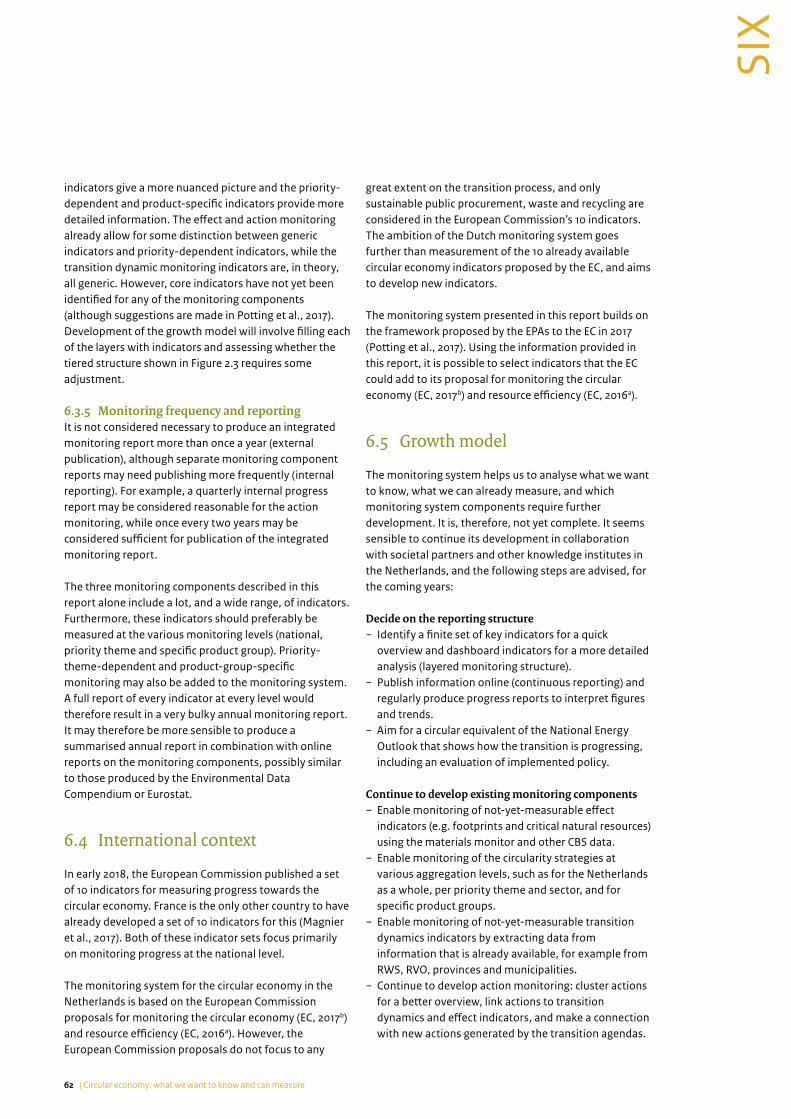
62 | Circular economy: what we want to know and can measure
SIX
great extent on the transition process, and only sustainable public procurement, waste and recycling are considered in the European Commission’s 10 indicators. The ambition of the Dutch monitoring system goes further than measurement of the 10 already available circular economy indicators proposed by the EC, and aims to develop new indicators.
The monitoring system presented in this report builds on the framework proposed by the EPAs to the EC in 2017 (Potting et al., 2017). Using the information provided in this report, it is possible to select indicators that the EC could add to its proposal for monitoring the circular economy (EC, 2017b) and resource efficiency (EC, 2016a).
6.5 Growth model
The monitoring system helps us to analyse what we want to know, what we can already measure, and which monitoring system components require further development. It is, therefore, not yet complete. It seems sensible to continue its development in collaboration with societal partners and other knowledge institutes in the Netherlands, and the following steps are advised, for the coming years:
Decide on the reporting structure − Identify a finite set of key indicators for a quick
overview and dashboard indicators for a more detailed analysis (layered monitoring structure).
− Publish information online (continuous reporting) and regularly produce progress reports to interpret figures and trends.
− Aim for a circular equivalent of the National Energy Outlook that shows how the transition is progressing, including an evaluation of implemented policy.
Continue to develop existing monitoring components − Enable monitoring of not-yet-measurable effect
indicators (e.g. footprints and critical natural resources) using the materials monitor and other CBS data.
− Enable monitoring of the circularity strategies at various aggregation levels, such as for the Netherlands as a whole, per priority theme and sector, and for specific product groups.
− Enable monitoring of not-yet-measurable transition dynamics indicators by extracting data from information that is already available, for example from RWS, RVO, provinces and municipalities.
− Continue to develop action monitoring: cluster actions for a better overview, link actions to transition dynamics and effect indicators, and make a connection with new actions generated by the transition agendas.
indicators give a more nuanced picture and the priority-dependent and product-specific indicators provide more detailed information. The effect and action monitoring already allow for some distinction between generic indicators and priority-dependent indicators, while the transition dynamic monitoring indicators are, in theory, all generic. However, core indicators have not yet been identified for any of the monitoring components (although suggestions are made in Potting et al., 2017). Development of the growth model will involve filling each of the layers with indicators and assessing whether the tiered structure shown in Figure 2.3 requires some adjustment.
6.3.5 Monitoring frequency and reportingIt is not considered necessary to produce an integrated monitoring report more than once a year (external publication), although separate monitoring component reports may need publishing more frequently (internal reporting). For example, a quarterly internal progress report may be considered reasonable for the action monitoring, while once every two years may be considered sufficient for publication of the integrated monitoring report.
The three monitoring components described in this report alone include a lot, and a wide range, of indicators. Furthermore, these indicators should preferably be measured at the various monitoring levels (national, priority theme and specific product group). Priority-theme-dependent and product-group-specific monitoring may also be added to the monitoring system. A full report of every indicator at every level would therefore result in a very bulky annual monitoring report. It may therefore be more sensible to produce a summarised annual report in combination with online reports on the monitoring components, possibly similar to those produced by the Environmental Data Compendium or Eurostat.
6.4 International context
In early 2018, the European Commission published a set of 10 indicators for measuring progress towards the circular economy. France is the only other country to have already developed a set of 10 indicators for this (Magnier et al., 2017). Both of these indicator sets focus primarily on monitoring progress at the national level.
The monitoring system for the circular economy in the Netherlands is based on the European Commission proposals for monitoring the circular economy (EC, 2017b) and resource efficiency (EC, 2016a). However, the European Commission proposals do not focus to any

636 Reflection |
SIX
SIX
− Develop a decomposition model to analyse the relationships between effect and circularity strategy monitoring results and autonomous factors.
− Extend the monitoring system to explore the relationship between the role of societal partners and the various phases in the transition towards the circular economy.
− Find out how the transition to a circular economy will contribute to a healthy and safe physical environment and therefore minimise risks to humans and the environment. This includes the development of a better analysis of the toxicity of substances in material flows that are candidates for recycling.
− Enable comparison between the monitoring system with two transition phases described in this report (the formative and growth phases) and the four-phase monitoring system for the energy transition (pre-development, take-off, acceleration and stabilisation) by adjusting one or both monitoring systems accordingly.
Ideas from the transition agendas − Include monitoring of transition agenda actions − Develop unambiguous, controllable and independent
methods for determining environmental effects (life-cycle assessment) and value retention for specific product groups.
− Develop specific indicators for the priority themes and include these in the monitoring system where necessary.
Important developments for the medium to long term − Continue to develop the monitoring system to include
scenario studies of future natural resource demands within global limits.
− Coordinate the Dutch monitoring system with those of other EU Member States and the European Commission.

64
SEVE
N
| Circular economy: what we want to know and can measure
This report lays the foundation for a system to monitor progress in the transition to the circular economy in the coming years. The monitoring results should illustrate whether the transition process and its effects on resource use, environmental pressure and the economy are progressing as planned. More specifically, the monitoring results will show whether we are on course for achieving the resource reduction goal in the government-wide policy programme (2016b) (50% reduction in use of abiotic resources by 2030 and fully circular by 2050). The reflectivity built into the monitoring system means that the monitoring results will also provide insight into success and failure factors, which can be used to make course adjustments to the transition process. This includes insight into substances that present a health and safety risk. This reflective monitoring serves as an input into a management system.
It is already possible to measure the progress being made regarding the actions of the government-wide policy programme. Effect monitoring is also possible to some extent, primarily for resource use and greenhouse gas emissions at the national and priority theme level. Waste flows and waste processing can also be quantified at this level, but there are as yet no good indicators for the other circularity strategies. Furthermore, there is currently little information available in a form suitable for transition dynamics monitoring.
There are three components to the monitoring system developed in this report: action monitoring, transition dynamics monitoring and effect monitoring. For each of the three components, a description is given of the form that the monitoring should take, what we can already measure using available indicators and data (the baseline assessment) and what actions still need to be taken for full implementation of the monitoring system.
The monitoring system described in this report for measuring the progress made in the transition to the circular economy in the coming years places the Netherlands at the international forefront of such developments. The European Commission (2017b) is expected to publish a set of 10 circular economy indicators in early 2018. These indicators focus on monitoring at the Member State and European level, with an accent on waste and recycling, while only a few indicators have been developed for monitoring the progress in the transition process, which is to bring about the intended circular effects. The monitoring system developed in this report provides a broad, firm foundation for the systematic monitoring of both the transition process and its effects, at the national level and at the level of the priority themes and specific product groups. The monitoring of the transition process (and more specifically the transition dynamics), and the various approaches applied means that this monitoring system represents an important, innovative contribution, both nationally and internationally.
Conclusionsseven

SEVE
N

66 | Circular economy: what we want to know and can measure
Appendices
Appendix 1: Glossary
− Abiotic resources (minerals, metals and fossil resources): resources obtained from non-living organisms and therefore non-renewable (see ‘Finite resources’).
− Actions (as in the policy evaluation scheme in Figure 2.1 and Chapter 3): concrete commitments made in the government-wide policy programme to employ means, undertake activities or bring about achievements to support and promote the transition to the circular economy.
− Activities (as in the policy evaluation scheme in Figure 2.1): all the steps to be taken to bring about an achievement (e.g. an awareness campaign to influence consumer behaviour or innovation research for biomaterial production).
− Anthropogenic resources: see ‘Resources’. − Policy evaluation scheme: Court of Audit evaluation
scheme (AR, 2005) for evaluating policy costs in relation to results achieved (efficiency) and the extent to which the policy broughtings about the intended results (effectiveness).
− Biomass: all biotic substances of plant or animal origin (including microbial origin), such as ‘clean’ mono-streams or relatively clean mixed streams from agriculture (including forestry and fisheries) and industry, or ‘dirty’ mixed streams from households (organic waste). Without further specification of the biomass type, little can be said about possible applications.
− Biorefinery: the use of chemical processes to convert biomass into chemicals, materials and fuels (also see ‘Recycling’).
− Biotic resources: resources obtained from living organisms, in other words of plant or animal origin, and therefore renewable (also see ‘Biomass’ and ‘Renewable resources’).
− Circular economy: an economic system in which production and consumption are based on the reusability of products and their parts, the recyclability
of materials and the sustainable extraction of any other resources required. This assumes the recovering ability of natural resources, minimising value destruction and optimum value creation in every link of the production and consumption chain.
− Circularity strategies: strategies to reduce resource use and therefore environmental pressure from resource extraction and material production. The circularity strategies have a hierarchical structure, and, in general, resource use and environmental pressure decrease with higher circularity strategies (or from a high to low ‘R’ value). The strategies are: refuse (R0), rethink (R1), reduce (R2), reuse (R3), repair (R4), refurbish (R5), remanufacture (R6), repurpose (R7), recycle (R8) and recover (R9). Recover (R9) means incineration (or fermentation) with energy recovery and is part of the linear economy as materials are lost for ever. Recycle (R8) is also still close to the linear economy. Also see the R strategies below for a brief explanation of each circularity strategy.
− Cascading: making optimum use of a recovered (secondary) material in consecutive products whereby the quality (and monetary value) of the recovered (secondary) material decreases as little as possible. An example is the paper cascade (new paper → recycled paper → newspaper → toilet paper) (also see ‘Recycle’).
− Direct (as in direct resource use and direct effects): resources used directly by a confined user (here usually to referring the Netherlands as a country), and effects to which a confined user directly contributes.
− Downcycling: see ‘Recycle’. − Finite resources: abiotic resources that are not
supplemented by natural processes and can therefore run out.
− Finite materials: materials produced from finite resources.
− Exergy: the maximum amount of work that can be obtained from an energy or material flow.
− Final products: see ‘Products’. − Consumer goods: strictly speaking, there is a difference
between consumer goods and consumable goods.

67Appendices |
Consumable goods, such as food, fuel or printer ink, are used up and can therefore only provide their function once. Consumer goods, on the other hand, can be used multiple times for the same function, and are not substantially changed by this use. However, this nuance between consumer and consumable goods is often lost, and the terms are therefore not used in this report.
− Resource use and consumption: a distinction is sometimes made in the scientific literature between resource use (input) and resource consumption. Use, or input, is about use in a specific process or specific series of processes (e.g. set by national borders). This may be direct resource use (see ‘Direct’) or resource use in the chain of extraction up to and including the output of a certain process (or series of processes). The terms process requirement (direct use) and gross requirement (use in the chain up to and including process output) are also used. Consumption – sometimes called cumulative requirement – refers to the net use and release of resources in, for example, a country or a product chain. However, this nuance between resource use (input) and consumption is often lost. The terms are nevertheless used in Chapter 5 of this report.
− Resources: the word resource is often used mistakenly as a synonym for material. Resources are found in nature, and natural resources are extracted from nature. In this report, the word resource means natural resource. The term anthropogenic resource may also be used. Anthropogenic resources are found throughout the economic system, for example in landfill sites (extracted by using landfill mining), in products with a long lifespan (extracted by using urban mining) or in subgrade used in road construction. Natural and anthropogenic resources first need to be separated from other elements before they can be processed or converted to make new materials. Biomass – biotic resources – are also often called raw materials. Other resources include natural capital such as water, air, land and wild plants and animals.
− Resource extraction: the removal of resources from nature. This can include the mechanical separation of resources and other components.
− Resource recovery: there is no such thing as natural resource recovery, although it is possible to talk of anthropogenic resource recovery (see ‘Resources’).
− Semi-manufactured goods: every item, with the exception of resources, produced by the industrial and commercial sectors that requires further processing before it can be sent to the end user (see ‘Products’). Materials, product parts and chemicals are typical examples of semi-manufactured goods.
− Reuse: the use of products and their parts again without a significant change in form or composition. Materials cannot be reused, but they can be recycled.
Recycling does change the form and structure of the material (e.g. the granulation, melting and casting of plastics; see ‘Recycling’).
− Renewable resources: natural resources that replenish themselves (biomass, but also wind, water and sun).
− Renewable materials: materials made from renewable resources.
− Input (as in the policy evaluation scheme in Figure 2.1): see ‘Means’.
− Chain: the complete process of obtaining materials from resources, through any pre-processing and semi-manufactured goods, to final products and then to users and disposal companies. A linear product chain starts with resource extraction, followed by material production and product manufacture, and ends – after the product has been used – with waste processing, while a circular product chain starts and ends with recycling.
− Critical materials: scarce materials that are essential for certain branches of industry and for which the security of supply is low.
− Launching customer: a major customer whose purchasing and procurement policy contributes to the creation of markets for innovative products, services or processes. This customer serves as an example to other parties, who are also encouraged to purchase the product or service.
− Life-cycle assessment (LCA): a method for drawing the impact of a product or material system on the environment. In practise, LCA is often described as a method for assessing the environmental effects of products, but in fact it is a method for evaluating a product system based on its function (the functional unit). Only then does it make sense to compare, for example, a disposable cup and a reusable cup. In this case, washing is also included in the product system for the reusable cup. Product system is therefore a better term than product chain. However, because so many people are familiar with the term product chain, and not product system, the term product chain is used in this report (see ‘Product chain’). A full LCA assesses the product system as a whole (also called cradle-to-grave LCA). A partial LCA is used for part of a product system, such as the system up to and including production of a material (cradle-to-gate LCA) or from a discarded product up to and including waste processing (gate-to-grave LCA).
− Security of supply: the certainty that a company, the government or a consumer has regarding the uninterrupted supply of a resource, semi-manufactured good (materials and product parts) or product.
− Linear economy: an economy in which new resources must be continually extracted to produce new materials and in which products are incinerated (destroyed) after use (also called ‘take, make, waste’).

68 | Circular economy: what we want to know and can measure
(new or primary) material (high-grade recycling). In practise, however, the quality (and monetary value) of the secondary material is often lower than that of the primary material, due to pollution and the mixing of products in discarded products (low-grade recycling). This is called downcycling. A material cascade consists of a consecutive chain of products that make use of secondary materials of decreasing quality (and monetary value) (also see ‘Cascading’). The quality (and monetary value) of a secondary material almost never increases compared with the primary material. An example of an exception to this rule is biorefinery, in which high-grade products are produced from biomass (see ‘Biorefinery’). These products often have a higher monetary value than the biomass from which they are made. This is also called upcycling.
− Reduce (R2): increase efficiency in product use (e.g. washing machines that use less energy, water or detergent) or product manufacture (e.g. a car that is designed to be made using less body material) without affecting the function of the product.
− Refurbish (R5): bring a product that is still functional up-to-date through renovation (e.g. buildings) or modernisation (e.g. the fairphone), in many cases increasing the basic functionality.
− Refuse (R0): make products redundant by abandoning their function (e.g. alcohol or narcotics) or by offering the same function with a radically different product (e.g. Spotify instead of CDs or blankets rather than heaters outside bars and restaurants).
− Rethink (R1): make product use more intensive by, for example, sharing products (e.g. car sharing or flats with shared facilities), or by making multifunctional products (e.g. smartphones or multifunctional printers). In this way, a single product can offer a larger ‘volume of function’.
− Reuse (R3): use a discarded product that is still in good working condition again (e.g. vintage clothing, second-hand cars, crockery or any other products bought second-hand online or in second-hand or antique shops). Second-hand products are sometimes restored before they are sold (overlap with repair and refurbish).
− Repair (R4): repair and maintenance of defective products for use again in their original function (e.g. cars and clothes).
− Remanufacture (R6): the use of product parts from discarded products in new products with a similar function.
− Repurpose (R7): the use of product parts from discarded products in new products with a different function.
− Raw materials: extracted biomass, minerals, metals and fossil resources that require further processing to produce materials (see ‘Resources’).
− Manufacturing industry: companies that make product parts or final products from materials (see too ‘Product part’ and ‘Products’).
− Material: a natural or manufactured substance intended for processing into useable products.
− Material cascade: see ‘Cascading’. − Material chain: see ‘Product chain’. − Means (as in the policy evaluation scheme in Figure 2.1):
for example, money, personnel, machines and available technology that are required in the transition process.
− Milieuprestatie Gebouwen (MPG; environmental performance of buildings): a measure of the sustainability of a building in terms of energy consumption and material use.
− Natural resources: see ‘Resources’. − Non-renewable resources: see ‘Finite resources’. − Non-renewable materials: see ‘Finite materials’. − Output (as in the policy evaluation scheme in Figure 2.1):
see ‘Achievements’. − Plant-based resources: biomass of plant origin (see too
‘Biomass’ and ‘Resources’). − Product chain: a linear product chain starts with the
extraction of resources followed by material production and product manufacture, and ends after product use with incineration of the disposed product (or disposal as landfill). A circular product chain starts and ends with the recycling of materials once a product and its parts can no longer be reused. In practise, the term product chain is also used as a synonym for part of the product chain, for example from resource extraction to material production, or from product disposal to waste processing.
− Achievements (as in the policy evaluation scheme in Figure 2.1): the results of the means applied and the activities implemented using these means.
− Products (final products in statistical terminology): the final article produced by industry or the commercial sector for use (or consumption) by consumers, the government or other organisations.
− Product chain: see ‘Chain’. − Product part: a component of a product, consisting of
one or more materials, with a clear, independent sub-function in the product and final function of that product.
− Recover (R9): incineration or fermentation of a product with energy recovery. The retrieval of nutrients through composting is also a form of recovery. In the recovery process, a discarded product or material is processed to make something useful but the product or material is lost.
− Recycle (R8): the recovery of materials from discarded products or product parts (secondary materials) and their use in new products. The secondary material should preferably be of the same quality as the original

69Appendices |
− Socio-institutional: written and unwritten rules, customs and beliefs.
− Throughput (as in the policy evaluation scheme in Figure 2.1): see ‘Activities’.
− Transition: structural change in society due to mutually interacting and mutually reinforcing large-scale technological, economic, ecological, socio-cultural and institutional developments. For this to take place, an existing situation needs to be broken down (change) and a new situation built up. This is often a long, painful process with winners and losers. An example of a well-known transition is from coal to natural gas, and everything this involved. The digital revolution is another example.
− Transition process: the process of change. − Transition effects: the results of the change or
transition process. − Urban mining: the recovery of materials (and
sometimes resources) from the built environment for recycling (see ‘Recycle’).
− Upcycling: see ‘Recycle’. − Consumable goods: see ‘Consumer goods’. − Material, energy or resource consumption: see
‘Resource use and consumption’. − Preservation of value: the reuse of products or product
parts or the recycling of materials whereby the value is equal to the value of the original products, product parts or materials.
70 | Circular economy: what we want to know and can measure
As a rule of thum, fewer new (= primary) materials are used as we move from lower level (high R) to higher level (low R) circularity strategies. Less primary material use also means less resource extraction for, and less production of, primary materials. Avoided resource extraction and primary material production also prevents any related pressure on the environment. Examples are given below of circularity strategies for specific product groups within each priority theme. These examples do not take into account undesirable or unpredicted knock-on effects in the product chain or in other products chains that may undo the intended reduction in resource use and environmental pressure. However, logical reasoning and a quick scan of the relevant information on the Internet often shows whether such knock-on effects will not, or will probably not, lead to a reduction in resource use and environmental pressure, or whether further evaluation is required to assess the influence of these effects on resource use and environmental pressure. Ganzevles et al. (2016) briefly describe a reasoning scheme, which they develop for five circularity initiatives (including a quick scan of information found on the Internet).
Appendix 2: Examples of circularity strategies per priority theme
This appendix gives some concrete examples of circularity strategies, listed by priority theme (see tables below).
It is important to remember that the circularity ladder is based on the product and, more specifically, the product function. Refuse (R0), rethink (R1) and reduce (R2) all relate to the smarter provision of the main function of the product through the smarter use or manufacture of the product. As a result, less product is required per unit product function provided. Products and their parts can also be used for longer. For products this is represented by reuse (R3), repair (R4) and refurbish (R5). Product parts can be used again to make similar products (remanufacture; R6) or to make a completely different product (repurpose; R7). If products or their parts are discarded because they can no longer be used, the product’s materials and parts can be recovered as secondary materials (recycle; R8). The quality of these secondary materials should preferably be the same as the quality of the original, primary material, so that the secondary material can be used to make similar products. In practise, however, the quality of the secondary material often decreases due to pollution or mixing with other materials in the discarded products (down-cycling). Moving from high-level (low R) to low-level (high R) circularity strategies, therefore, the focus shifts from product function (R0 – R2), to products and their parts (R3 – R7), to materials and energy (R8 – R9).

71Appendices |
Construction sector
Circularity strategies Examples
R0 Refuse - Tiny house (fully equipped house no larger than 28 square metres as a permanent residence)- Forgo second home
R1 Rethink - Microliving: small flat with communal facilities (e.g. laundry room, library, Internet, garden, car) - Shared use of buildings (e.g. working and living, day and night school, day school hired out in
evenings, conference centre and cinema)
R2 Reduce - Energy-neutral building, through improved insulation or solar panels- Durable materials, so that less materials are required during the lifespan of a building- Foam concrete or hollow bricks (less bearing power but better insulation)
R3 Reuse
} Already common practise in buildingsR4 Repair
R5 Refurbish
R6 Remanufacture - Elements of old buildings used in new buildings
R7 Repurpose - Old wooden floors and doors used to make ‘vintage’ furniture
R8 Recycle - Recover steel and use again- Concrete to concrete recycling
R9 Recover - Incinerate building/demolition waste with energy recovery
Biomass and food – food for people
Circularity strategies Examples
R0 Refuse - Eat less by avoiding sweets and snacks - Eat less of certain types of food (e.g. meat, which can be replaced with protein-rich plant-based
products (e.g. pulses and nuts))
R1 Rethink - Use more parts of food crops for food (e.g. the leaves of carrots or radishes) - Use lower quality food ingredients in other ways (such as smoothies made from overripe fruit, soup
from misshapen cucumbers, beer from lower quality potatoes)- Use old bread in other ways (e.g. to make toasted sandwiches, croutons or French toast)- Preserve excess food or food that is reaching its expiry date (e.g. pot fruit and vegetables or salt
meat and fish)
R2 Reduce - Use more efficiently prepared food (such as ‘industrial’ food like tinned vegetables and bags of soup)- Eat more ‘efficiently’ by choosing food that makes you feel full more quickly
R3 Reuse - Reheat leftover food to eat later- Use leftover food ingredients or scraps in other meals (e.g. in soups, salads on omelettes) - Take food still in its packaging that has not reached its expiry date to a food bank
R4 Repair n/a
R5 Refurbish - Refresh vegetables in cold water
R6 Remanufacture n/a
R7 Repurpose - Use leftover food to feed cattle- Use crop residues to feed cattle
R8 Recycle - Biorefinery of food waste and crop residues (e.g. for pharmaceuticals, colourings and other fine chemicals)
- Use crop residues to produce materials (such as bioplastics, bioresins and biocomposites)
R9 Recover - Anearobic digestion of food waste and crop residues to produce biogas and substrate nutrients- Compost food waste and crop residues to produce substrate nutrients- Incinerate food waste and crop residues with energy recovery

72 | Circular economy: what we want to know and can measure
Manufacturing industry – household appliances (washing machines, dryers, fridges and freezers; by Potting et al., 2015)
Circularity strategies Examples
R0 Refuse - Hang washed clothes to dry (use dryer not at all or less)- Use cellar or cool cupboard to keep products cool (no or smaller fridge)- Use products that can be stored outside the fridge/freezer (e.g. pre-baked bread; no or smaller freezer)
R1 Rethink - Share washing and drying facilities in appartmet buildings- Pay for household appliances per unit consumption (incentive to consumer to use more efficiently
and to producers to maintain cost-efficiency; R4–R5)- Include fridge and freezer in rental price of house (incentive to landlord to optimise cost-efficiency;
R4–R5)- Wash less frequently by hanging clothes outside to air (use washing machine less)
R2 Reduce - Washing machines that match water and soap to amount of clothes to be washed- Washing machine or dryer that clothes can be added to during cycle
R3 Reuse - Reuse household appliances from friends or family or purchase second-hand
R4 Repair - Extend lifetime of appliances with service and maintenance contracts
R5 Refurbish - Extend lifetime of appliances by implementing innovations in existing products
R6 Remanufacture - Use parts from discarded household appliances in new household appliances
R7 Repurpose - Use parts from household appliances to make new electrical appliances- Use glass in washing machine door as a salad bowl
R8 Recycle - Recover materials from discarded product parts (such as steel, glass and plastic)
R9 Recover - Incinerate electric and electronic appliances with energy recovery
Plastics – food packaging (from Potting et al., 2015)
Circularity strategies Examples
R0 Refuse - Plastic bag ban- Packaging-free shops- Label vegetables using laser marking instead of plastic packaging- No drinks packaging, consumers make their own drinks at home from concentrate (e.g. natural
syrups or Cola from flavoured syrups and a CO2 cylinder)
R1 Rethink
R2 Reduce
R3 Reuse - Consumer cleans own bottle for refill at retailer- Consumer takes own packaging for dry products and vegetables
R4 Repair
R5 Refurbish
R6 Remanufacture
R7 Repurpose
R8 Recycle - Higher level plastic recycling by using fewer types of plastic
R9 Recover - Ferment bioplastic to produce biogas and substrate nutrients- Compost bioplastic to produce substrate nutrients- Incinerate fossil-based plastics and bioplastics with energy recovery

73Appendices |
Appendix 3: Examples of action indicators
This appendix gives examples of indicators for each action group. Four types of indicators are used: activity, achievement, core achievement and effect (see Chapter 3).
Group Indicators (relationship with action number) Indicator type
Biomass and food - Number of sustainability certificates issued - Amount of biomass consumed - Amount of reused phosphate exported as fertilizer
Achievement Core achievementCore achievement
Plastics - Packaging waste recycling objective - Amount of plastic in litter - Number of brand owners who participate in activities to close loops
Core achievementCore achievementAchievement
Manufacturing industry - Number of successful coalitions with serious business cases - Number of studies conducted for circular economy top sector policy
ActivityActivity
Construction sector - % recycled concrete granulate - Amount of secondary material used compared with construction volume- % new buildings for which an MPG (Milieu Prestatie Gebouwen; environmental
performance of buildings) score has been calculated (including the score)
Core achievementCore achievementAchievement
Consumer goods - Annual amount of household waste, per resident- Number of companies that take part in IRBC agreements - Recycling objectives achieved for packaging waste
Core achievementAchievement Core achievement
Stimulative legislation - Number of regulatory obstacles removed Achievement
Smart market incentives
- Amount of biomass that meets requirements of sustainability frameworks - Extent of socially responsible procurement by national government
Core achievementAchievement
Financing - Number of actions carried out in the Nederland Circulair! (The Netherlands Circular!) programme
Achievement
Knowledge and innovation
- Number of projects submitted/requested, e.g. for KIEM (Knowledge and Innovation Mapping)
- Number of companies that use the resources tool- Number of top sectors for which the circular economy is a clear criterion/focal
area
Achievement Achievement Activity
International cooperation
- Number of Platform Holland Circular Hotspot network events Activity
Cooperation between government and chain partners
- Number of companies involved in transition agendas Activity

74 | Circular economy: what we want to know and can measure
The second part of the table shows the figures from the MFM. The MFM contains figures for 380 goods, which can be categorised as raw resources, semi-manufactured goods and final products. Other categories are also possible, such as fuels or recyclate flows. Goods may be obtained from the Netherlands or from abroad.
The last part of the table shows the various effects that play a role in effect monitoring. The figures for resources, CO2 emissions and water use are taken from the MFM or other environmental accounts. Employment figures are taken from the labour accounts and the value added from the input-output table itself.
The advantage of this is that the effects are presented in a consolidated, consistent macroeconomic framework. The various resource indicators can also be derived from this table. In addition, because economic, resource, environmental and socio-economic effects are presented in a consistent framework, it is possible to quantify the relationships between the effects (such as climate and resources) and model the relationships between achievements and effects.
Appendix 4: National effect monitoring conceptional framework
The effect monitoring is based on the macroeconomic framework of the national accounts (NAs). These contain information such as economic transactions in the Netherlands. Important macroeconomic data, such as gross domestic product (GDP), is derived from the NAs. Various categories are applied to be able to analyse various aspects of the economy, such as consumption (by households and the government), investment and value added, and these categories cover about 130 sectors and almost 600 goods/services.
The structure of the Material Flow Monitor (MFM) is consistent with that of the NAs, except that the transactions are measured in unit weight. If a product is sold, for example, not the value but the weight of the product is recorded. An analysis is also made of the physical relationship between the economy and the environment. In other words, resources extracted, waste produced, recycling flows and emissions to soil/water/air are also registered.
The various accounts used for the effect monitoring are shown in Table A1. The first part is an input-output table of the accounting system of the NAs.1 An input-output table may be product-by-product or sector-by-sector. The resource indicators are calculated assuming a product-by-product input-output table.
The columns in the input-output table show the inputs required for production. The first column shows the production of agricultural produce in the Netherlands. This sector requires other products (both Dutch products and foreign import), uses labour (for which a wage is paid) and creates other value added (such as profit and taxes). Looking at the output (rows), the agricultural produce is supplied to other production processes (in the Netherlands and abroad) as well as final spending categories (household consumption, government consumption and investment).

75Appendices |
Table A1Variables for calculating resource and material indicators
Products Final Consumption
The Netherlands Rest of the World The Netherlands Rest of the World
Agr
icul
ture
Indu
stry
Serv
ices
Agr
icul
ture
Indu
stry
Serv
ices
Hou
seho
lds
Gov
ernm
ent
Inve
stm
ent
Hou
seho
lds
Gov
ernm
ent
Inve
stm
ent
Tota
l
Products
1 i 1 i
The Netherlands
1
Services i
Rest of the World
Agriculture 1
Services i
Value added
Products
The Netherlands
Products
1
…
i
Rest of the World
Products
1
…
i
Effects
Resources
CO2 emissions
Water use
Land use
Jobs
Value added

76 | Circular economy: what we want to know and can measure
Supply of products from the Netherlands for production country W (matrix i×i)
Supply of products from the Netherlands for household consumption country W (vector i×1)
Supply of products from the Netherlands for government consumption country W (vector i×1)
Supply of products from the Netherlands for investments country W (vector i×1)
Total output of products from the Netherlands (vector i×1)
Resource extraction for Dutch manufacturers (vector 1×i)
Resource extraction for Dutch households (scalar)
CO2 emissions by Dutch manufacturers (vector 1×i)
CO2 emissions by Dutch households (scalar)
Water use by Dutch manufacturers (vector 1×i)
Water use by Dutch households (scalar)
Land use by Dutch manufacturers (vector 1×i)
Land use by Dutch households (scalar)
Jobs at Dutch manufacturers (vector 1×i)
Value added by Dutch manufacturers (vector 1×i)
Coefficient for resource equivalents per product (vector 1×i)
Summation vector (vector 1×i)
Notation and symbols concerning notation: − A normal typeface is used for monetary figures. − Non-monetary variables are shown in bold. − In some cases, use is made of a ‘hybrid’ matrix or vector, which includes both monetary and non-monetary data.
These variables are shown using an asterisk (*). − The subscript ‘raw’ means that only raw resources are included, therefore not semi-manufactured goods and final
products. − An accent on the vector indicates diagonalisation. − There are two regions (the Netherlands (NL) and the rest of the world (W)) with i products.

77Appendices |
Intermediary supplies (matrix 2i×2i)
Output (vector 2i×1)
Resource input manufacturers (vector 1×2i)
CO2 emissions by manufacturers (vector 1×2i)
Water use by manufacturers (vector 1×2i)
Land use by manufacturers (vector 1×2i)
Jobs at manufacturers (vector 1×2i)
Value added by manufacturers (vector 1×2i)
Domestic final demand, the Netherlands (vector 2i×1)
Dutch supply to final demand (vector 2i×1)
Household consumption in the Netherlands (vector of 2i by 1)
Input the Netherlands (vector of i by 1)
Output the Netherlands (vector of i by 1)
Calculation of indicators
Technical coefficients (matrix of 2i×2i)
Leontief matrix (matrix of 2i×2i)
Resource use per unit output (vector of 1×2i)
CO2 emissions per unit output (vector of 1×2i)
Water use per unit output (vector of 1×2i)
Land use per unit output (vector of 1×2i)
Jobs per unit output (vector of 1×2i)
Value added per unit output (vector of 1×2i)
Compound matrices and vectorsThe following compound matrices can be derived:
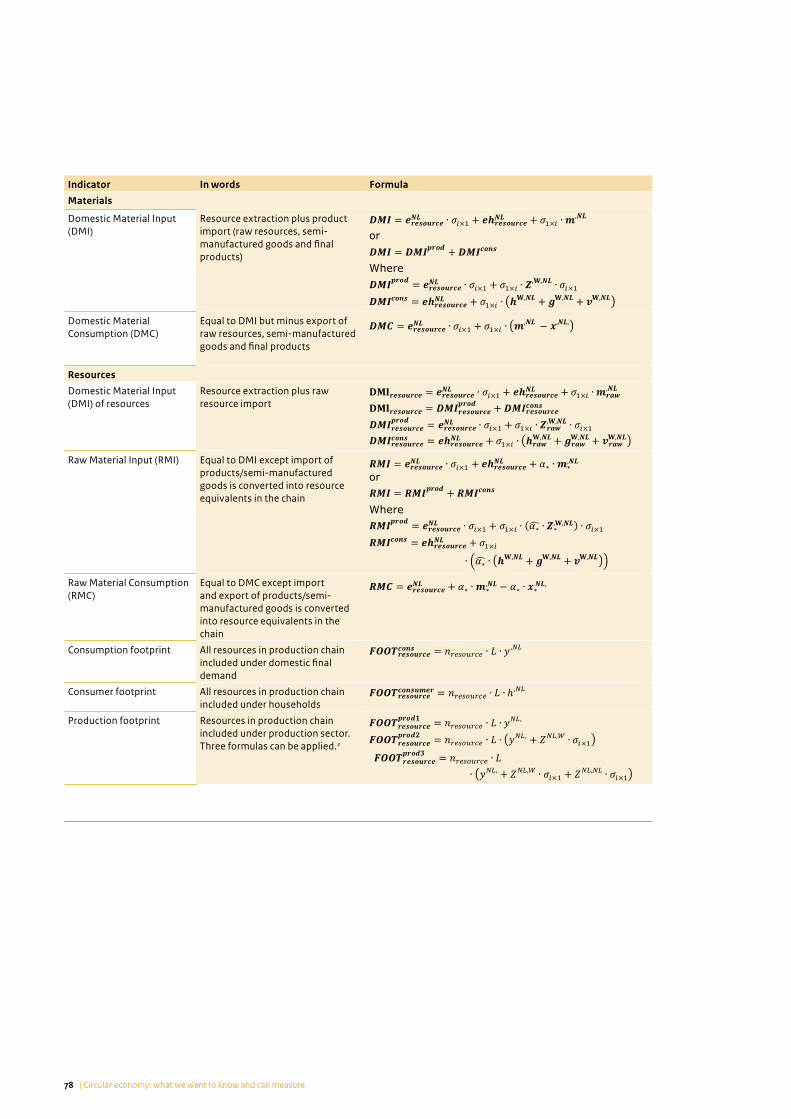
78 | Circular economy: what we want to know and can measure
Indicator In words Formula
Materials
Domestic Material Input (DMI)
Resource extraction plus product import (raw resources, semi-manufactured goods and final products)
Domestic Material Consumption (DMC)
Equal to DMI but minus export of raw resources, semi-manufactured goods and final products
Resources
Domestic Material Input (DMI) of resources
Resource extraction plus raw resource import
Raw Material Input (RMI) Equal to DMI except import of products/semi-manufactured goods is converted into resource equivalents in the chain
Raw Material Consumption (RMC)
Equal to DMC except import and export of products/semi-manufactured goods is converted into resource equivalents in the chain
Consumption footprint All resources in production chain included under domestic final demand
Consumer footprint All resources in production chain included under households
Production footprint Resources in production chain included under production sector. Three formulas can be applied.2

79Appendices |
Notes
1 This is a multiregional input-output table that provides
information on the relationships between the different
sectors in different countries. These differ from the input-
output tables published by CBS, which only include input
and output and not origin and destination.
2. The first formula for the production footprint is equal to the
worldwide consumption footprint. Each resource is only
assigned once, and the formula only considers worldwide
final spending. This means that, if a Dutch company exports
to a foreign company (intermediary supply), this is not
included. The second formula includes all export. This can
therefore be summed at the national level, but if each
country were to apply this formula it could not be summed
at the global level. The last formula is simply based on the
total output from the various sectors. However, this can no
longer be summed at the national level if it is calculated for
each sector. Given that there is some overlap between the
chains, the resources are then assigned more than once.
However, the indicator does say something about the span
of control of the chain and best reflects how companies
themselves define their chain. Formula 2 is applied in this
report because it can be summed at the national level.
Further research is required into the conceptual and
empirical aspects of these methods.
Relationship between factors/achievements and effects (decomposition) The formulas in the table above link effects (to the left of the ‘=’ sign) to autonomous factors and circular economy achievements (to the right of the ‘=’ sign). Take, for example, the following formula for the consumption footprint:
Three variables in this formula are explanatory factors for the effects. The first factor ( ) says something about the intensity with which resources are used (both in the Netherlands and abroad). The second factor ( ) represents intermediary supply, and many of the achievements in the circularity ladder (recycling, manufacturing) are included in this matrix. The last factor ( ) can be split into household consumption and government and investments. For all these variables, a distinction is made between domestic and foreign contributions, so that trends such as globalisation can be analysed. Changes in these variables can be examined using decomposition analysis, or used as a basis for a model such as the TNO ex-ante evaluation.

80 | Circular economy: what we want to know and can measure
Such a sectoral approach does however have its disadvantages:
− The plastics priority theme is overestimated because it includes the whole of the basic chemicals sector. It is therefore recommended to split this into ‘basic chemicals – plastics’ and ‘basic chemicals – other’.
− The ‘manufacturing industry’ transition team has also assigned some of the plastics sector to the manufacturing industry. However, this sector is relatively small, and it was not possible to split it any further in this study.
− The construction sector includes classic construction, building materials and several construction-related services (e.g. architecture). However, the transition team has also indicated that it will assign parts of the wood, base metals and metal product sectors to the construction sector (as suppliers of construction materials). These sectors are currently assigned entirely to the manufacturing industry. It was not possible to split these sectors any further (to estimate the share of construction materials) within the scope of this project.
− The ‘consumer goods’ priority theme only considers direct consumer inputs/emissions, and not the economic activities that produce these goods. Various transition teams also considered indicators from a product or material perspective rather than a purely sectoral perspective.
Appendix 5: The five priority themes, per sector
The five priority themes are organised by sector, as described below.
− The ‘biomass and food’ priority theme includes the following sectors: agriculture, the food and beverages industry and textile, wood and paper production industries.
− ‘Plastics’ includes the rubber and plastics industry and basic chemicals.
− The ‘manufacturing industry’ priority theme includes the following sectors: the base metal, metal products, electrical engineering, electrical equipment, machines and transport equipment industries, plus furniture and other goods and repairs.
− The ‘construction sector’ priority theme includes the following sectors: the construction materials industry, building activities, demolition and construction-related services such as estate agents and architects.
− The ‘consumer goods’ priority theme takes a purely consumer perspective, and does not include the economic activities that produce consumer goods. This is to prevent overlap with other priority themes.

81Appendices |
Appendix 6: Results per priority theme
This appendix contains dashboards with indicators for the five transition teams. These indicators are derived from the national set of indicators, and supplemented with a few specific indicators. The results presented in this appendix should be regarded as a starting point for the growth model, and the sets of indicators shown below will need to be developed further once the transition agendas have been published. Most of the data has been produced based on a sectoral perspective (see Section 5.1.3). However, it is also important to develop the product and material perspectives where relevant.
Table 6.1 Results: biomass and food
Domain Indicator Unit 2010 2014 Trend
Share within priority area (2014)
Agr
icul
ture
and
ho
rtic
ultu
re
Live
stoc
k fa
rmin
g
Oth
er a
gric
ultu
re
Food
pro
duct
s
Text
iles,
woo
d an
d pa
per
Effects
Natural resources
Resource use, direct billion kilograms 67 70 3% 5% 26% 3% 64% 2%
Environment & Nature
Land use, direct % of cultured land 56% 55% -2%
Water extraction, direct million m3 204 159 -22% 18% 30% 4% 26% 22%
CO2 emissions, direct billion kilograms 17 15 -15% 55% 4% 6% 26% 9%
CO2 production footprint billion kilograms 37 34 -8%
Autonomous factors
Employment 1000 FTEs 325 313 -4% 23% 19% 9% 35% 14%
Added value billion euros, 2010 price level 26 27 5% 25% 8% 8% 47% 12%
Performance
Natural resources
Material use, direct billion kilos 148 157 6% 19% 24% 5% 47% 6%
Reduce (R2): material productivity
euros added value/kg material use
0.29 0.28 0%
Crop yield agricultural land 1000 kg/ha 23.9 26.2 9%
Agricultural phosphorus supply
% of natural cycle 84% 91% 9%
Waste production billion kilograms 13 13 0% 12% 12% 11% 60% 5%
Food waste kilograms per citizen 130 133 2%
Reduce (R2): waste production per kilogram of product produced
kg waste/kg product 0.12 0.12 -5%
Recycling (R8): cyclical use rate*
secundary application as % of total
19% 18% -5%
Consumption biological food products
spending on food for consumption (in %)
2% 3% 57%
*Only secondary application of biomass for agriculture and the food product industry

82 | Circular economy: what we want to know and can measure
Table 6.2 Results: plastics
Domain Indicator Unit 2010 2014Trend
(%)
Priority area (2014)
Rub
ber a
nd p
last
ics
(%)
Chem
ical
s (%
)
Effects
Natural resources
Resource use, direct billion kilograms 1.2 1.0 -17% 14% 86%
Environment & Nature
Water extraction, direct million m3 34 25 -25% 3% 97%
CO2 emissions, direct billion kilograms 7.5 5.7 -25% 4% 96%
CO2 production footprint billion kilograms 37 36 -4%
Autonomous factors
Employment 1000 FTEs 40 39 -3% 72% 28%
Added value billion euros, 2010 price level
4.7 4.6 -2% 58% 42%
Performance
Natural resources
Material use, direct billion kilograms 15 14 -7% 23% 77%
Reduce (R2): material productivity
euros added value/kg material use
0.33 0.34 3%
Waste production* billion kilograms 0.4 0.3 -31% 43% 57%
Waste plastics** billion kilograms 0.9 1.0 15%
Reduce (R2): waste production per kilogram of product produced*
kg waste/ kg product 0.03 0.02 -27%
Recycling (R8): cyclical use rate***
secondary application as % of total
. . .
Plastics production**** billion kilograms 9.7 10.0 15%
*Total waste produced by the chemical, rubber and plastics industies
**Plastic waste from all economic activity
***Cannot yet be derived from source data
****Total supply of final products as well as unprocessed plastics (excl. imports and stocks)

83Appendices |
Table 6.3 Results: construction sector
Domain Indicator Unit 2010 2014 Trend
Share within priority area (2014)
Bui
ldin
g m
ater
ials
Com
mer
cial
and
indu
stri
al
build
ings
civi
l eng
inee
ring
wor
ks
(GW
W)
Inst
alla
tion
s
Dem
olit
ion
Cons
truc
tion
ser
vice
s
Effects
Natural resources
Resource use, direct billion kilograms 61 54 -12% 35% 21% 29% 6% 8% 0%
Environment & Nature
Water extraction, direct million m3 48 34 -29% 10% 52% 15% 1% 1% 21%
CO2 emissions, direct billion kilograms 7 7 -9% 25% 7% 17% 22% 22% 7%
CO2 production footprint billion kilograms 24 19 -19%
Socio-economic
Employment (CE share) % in construction 3.3% 4.5% 35%
Economic growth (CE share) % in construction 1.9% 2.5% 32%
Autonomous factors
Employment 1000 FTEs 698 631 -10% 3% 25% 9% 35% 2% 26%
Added value million euros, 2010 price level
72 73 2% 2% 13% 6% 18% 1% 60%
Performance
Natural resources
Material use, direct billion kilograms 122 115 -5% 22% 23% 33% 10% 11% 1%
Reduce (R2): Material productivity
euros added value/kg material use
0.79 0.92 17%
Waste production billion kilograms 25 24 -5% 3% 2% 85% 3% 7% 0%
Reduce (R2): Waste production per kilogram of product produced*
kg waste/ kg product
0.03 0.03 -3%
Recycling (R8): Cyclical use rate**
secundary application as % of total
30% 33% 10%
*Building material industry
**Secondary application of minerals in all construction sector

84 | Circular economy: what we want to know and can measure
Table 6.4 Results: manufacturing industry
Domain Indicator Unit 2010 2014 Trend
Share within priority area (2014)
Bas
e m
etal
Met
al p
rodu
cts
Elec
tron
ics
Elec
tric
app
lianc
es
Mac
hine
s
Tran
spor
t mod
es
Furn
itur
e an
d ot
her g
oods
Rep
airs
/mai
nten
ance
/ins
talla
tio
Effects
Natural resources
Resource use, direct billion kilograms 14 12 -14% 95% 1% 0% 1% 1% 0% 1% 0%
Environment & Nature
Water extraction, direct million m3 22 8 -66% 62% 10% 11% 0% 5% 8% 3% 0%
CO2 emissions, direct billion kilograms 9 8 -12% 78% 6% 0% 2% 3% 2% 7% 1%
CO2 production footprint billion kilograms 31 30 -5% - - - - - - - -
Socio-economic
Employment (CE share) % in the manufacturing industry
0.8% 1.0% 26% - - - - - - - -
Economic growth (CE share) % in the manufacturing industry
0.8% 1.2% 51% - - - - - - - -
Autonomous factors
Employment 1000 FTEs 428 417 -3% 5% 19% 6% 5% 18% 8% 30% 10%
Added value million euros, 2010 price level
34 36 5% 5% 17% 17% 5% 24% 10% 14% 8%
Prestaties
Natural resources
Material use, direct billion kilograms 36 34 -5% 52% 14% 2% 4% 13% 9% 4% 2%
Reduce (R2): Material productivity
euros added value/kg material use
1.0 1.2 13% - - - - - - - -
Waste production billion kilograms 2.8 2.7 -4% 64% 15% 1% 2% 6% 4% 8% 2%
Reduce (R2): Waste production per kilogram of product produced
kg waste/ kg product
0.11 0.10 -4% - - - - - - - -
Recycling (R8): Cyclical use rate*
secundary application as % of total
20% 29% 44% - - - - - - - -
*Only secondary application of metals in the base metal industry

85Appendices |
Table 6.5 Results: consumer goods
Domain Indicator Unit 2010 2014 Trend
Effects
Natural resources
Natural resource use, direct billion kilograms 12 10 -20%
Environment & Nature
Water extraction, direct** million m3 - - -
CO2 emissions, direct billion kilograms 44 35 -19%
CO2 production footprint billion kilograms 145 122 -16%
Performance
Natural resources
Material use, direct billion kilograms 33 30 -9%
Waste production billion kilograms 9.0 8.1 -10%
Residual waste % of total household waste 50% 48% -5%
Reduce (R2): waste production per unit of material use* kg/kg 0.51 0.46 -10%
Reuse (R3): shared cars x 1000 1.9 11.2 501%
Reuse (R3): added value of second-hand shops % of retail trade 0.34% 0.43% 28%
Repair (R4): household expenditure on repairs billion euros 4.8 4.7 -2%
Recycling (R8): value natural resources WEEE*** million euros . 57 .
Total consumption billion kilograms 33.2 30.1 -9%
Consumption: food, alcohol and tobacco billion kilograms 13.1 13.4 3%
Consumption: fossil energy carriers billion kilograms 9.4 6.9 -26%
Consumption: textiles and clothing billion kilograms 0.5 0.5 1%
Consumption: wood and timber products, paper and paper products, printed matter
billion kilograms 0.6 0.5 -7%
Consumption: cokes and petroleum products billion kilograms 6.2 5.6 -10%
Consumption: chemical and pharmaceutical products billion kilograms 0.6 0.7 9%
Consumption: rubber and plastic products billion kilograms 0.2 0.2 0%
Consumption: building materials billion kilograms 0.6 0.4 -25%
Consumption: machines and appliances billion kilograms 0.3 0.4 2%
Consumption: transport modes billion kilograms 0.4 0.3 -15%
Consumption: furniture and other products billion kilograms 1.0 0.9 -12%
Consumption: other billion kilograms 0.3 0.3 -5%
*Material use, excluding fossil fuels**Households do not extract water, but generally use only tap water*** WEEE = waste electrical and electronic equipment
Note
1 The first formula for the production footprint is equal to the
worldwide consumption footprint. Each resource is only
assigned once, and the formula only considers worldwide
final spending. This means that, if a Dutch company exports
to a foreign company (intermediary supply), this is not
included. The second formula includes all export. This can
therefore be summed at the national level, but if each
country were to apply this formula it could not be summed
at the global level. The last formula is simply based on the
total output from the various sectors. However, this can no
longer be summed at the national level if it is calculated for
each sector. Given that there is some overlap between the
chains, the resources are then assigned more than once.
However, the indicator does say something about the span
of control of the chain and best reflects how companies
themselves define their chain. Formula 2 is applied in this
report because it can be summed at the national level.
Further research is required into the conceptual and
empirical aspects of these methods.

86 | Circular economy: what we want to know and can measure
References
Bastein T and Rietveld E. (2015). Materialen in de Nederlandse economie – een kwetsbaarheidsanalyse (TNO 2015 R11613) [Materials in the Dutch economy – a vulnerability analysis (in Dutch)]. Netherlands Organisation for Applied Scientific Research (TNO), Delft.
Bastein T, Rietveld E and Keijzer E. (2017). Ex-ante evaluatie van het Rijksbrede Programma Circulaire Economie [Ex-ante evaluation of the government-wide programme for a Circular Economy : ‘A circular economy in the Netherlands by 2050’ (in Dutch)]. Netherlands Organisation for Applied Scientific Research (TNO), Delft.
Bastein T, Roelofs E, Rietveld E and Hoogendoorn A. (2013). Kansen voor de Circulaire Economie in Nederland [Opportunities for the circular economy in the Netherlands (in Dutch)]. Netherlands Organisation for Applied Scientific Research (TNO), Delft.
BBSA (2001). Beschikking van de Minister van Justitie van 23 oktober 2001, houdende plaatsing in het Staatsblad van de tekst van het Besluit stortplaatsen en stortverboden afvalstoffen, zoals dit laatstelijk is gewijzigd bij besluit van 5 juli 2001 [Disposition by the Minister of Justice, dated 23 October 2001, re. publishing the text of the Decree on waste disposal sites and prohibitions, as per the most recent adjustments to the decision of 5 July 2001 (in Dutch)]. Staatsblad van het koninkrijk der Nederlanden [‘officielebekendmakingen.nl’ (official government announcements)], 2001(336).
BSSA (2012). Besluit van 26 september 2012 tot wijziging van het Besluit stortplaatsen en stortverboden afvalstoffen [Decree, dated 26 September 2012, to amendment of the decree on dump sites and prohibitions for waste and waste products]. Staatsblad van het koninkrijk der Nederlanden, 2012(466) [‘officielebekendmakingen.nl’ (official government announcements].
Bento N and Wilson C. (2016). Measuring the duration of formative phases for energy technologies.
Environmental Innovation and Societal Transitions, 21: 95–112 (doi: 10.1016/j.eist.2016.04.004).
Blomsma F and Brennan G. (2017). The Emergence of Circular Economy: A New Framing Around Prolonging Resource Productivity. Journal of Industrial Ecology, 21(3): 603–614 (doi:10.1111/jiec.12603).
CBS (2013). Environmental accounts of the Netherlands 2013. Statistics Netherlands (CBS), The Hague.
CBS (2016a). Circulaire economie in Nederland. Statistics Netherlands (CBS), The Hague.
CBS (2016b). Nationale rekeningen 2016. Statistics Netherlands (CBS), The Hague.
CE and CSR Netherlands (2015). The potential for high value reuse in a circular economy. Online publication of Nederland Circulair! (site visited in August 2017: http://www.circulairondernemen.nl/uploads/27102a5465b3589c6b52f8e43ba9fd72.pdf).
Circular economy toolkit (2013). Online publication (site visited in October 2017: http://circulareconomytoolkit.org/Assessmenttool.html).
Circle economy/Ehero (2017). Circular jobs – Understanding employment in the Circular economy in the Netherlands.
Consumentenbond (2017). Automatische wasmiddeldosering [automatic detergent measuring (in Dutch)]. Website Dutch consumer organisation Consumentenbond, The Hague (site visited in August 2017: https://www.consumentenbond.nl/wasmachine/automatische-wasmiddeldosering).
Di Maio F and Rem PC. (2015). A Robust Indicator for Promoting Circular Economy through Recycling. Journal of Environmental Protection, 6, 1095–1104. http://dx.doi.org/10.4236/jep.2015.610096
EASAC (2016). Indicators for a circular economy. European Academies Science Advisory Council (EASAC). Leopoldina German National Academy of Sciences, Halle.
EC (2010b). Being wise with waste: the EU’s approach to waste management (doi 10.2779/93543). European Commission (EC), Brussels.

87References |
EC (2010a). Critical raw materials for the EU. Report of the Ad hoc Working group on defining raw materials (Ref. Ares(2014)2187691). European Commission (EC), Brussels.
EC (2014a). Communication from the commission to the European Parliament, the council, the European economic and social committee and the committee of the regions. On the review of the list of critical materials for the EU and the implementation of the Raw Material Initiative (COM(2014)297 final). European Commission (EC), Brussels.
EC (2014b). Report on critical raw materials for the EU. Report of the Ad hoc Working Group on defining critical materials (ref. Ares(2015)1819503). European Commission (EC), Brussels.
EC (2015). Communication from the Commission to the European Parliament, the council, the European economic and social committee and the committee of the regions. Closing the loop – An EU action plan for the Circular Economy (COM(2015)614 final). European Commission (EC), Brussels.
EC (2016a). EU Resource efficiency scoreboard. Publications Office for the European Union, Luxembourg.
EC (2016b). EU Raw materials scoreboard. Publications Office for the European Union, Luxembourg.
EC (2017a). Monitoring framework for the circular economy (ENV/ACC-MESA/WG/04.1 (2017), Point 4.1 of the agenda, 4 May). European Commission (EC), Brussels. Not published.
EC (2017c). EU Eco-innovation scoreboard. Online publication by the European Union (EU) (site visited in October 2017: https://ec.europa.eu/environment/ecoap/scoreboard).
EC (2018). Communication from the Commission to the European Parliament, the council, the European economic and social committee and the committee of the regions. On a monitoring framework for the circular economy. COM(2018) 29 final, EC, Strasbourg.
EEA (2017). About indicators. Online publication by the European Environment Agency (EEA), Copenhagen, Denmark (site visited in December 2017: https://www.eea.europa.eu/data-and-maps/indicators/about).
EEA (2016a). The European environment – State and outlook 2015 (SOER 2015). Online publication by the European Environment Agency (EEA), Copenhagen, Denmark (site visited December 2017: https://www.eea.europa.eu/soer SOER 2015).
EEA (2016b). More from less – Material resource efficiency in Europe. 2015 Overview of policies, instruments and targets in 32 countries. European Environment Agency (EEA), Copenhagen.
EEA (2016c). Circular Economy in Europe. Developing the knowledge base. European Environment Agency (EEA), Copenhagen.
Eisenmenger N, Wiedenhofer D, Schaffartzik A, Giljum S, Bruckner M, Schandl H, Wiedmann TO, Lenzen M, Tukker A and Koning A. (2016). Consumption-based material flow indicators – Comparing six waus of calculating the Austrian raw material consumption providing six results. Ecological economics, (128): 177–186.
EMF (2013). Towards the circular economy. Economic and business rationale for an accelerated transition. Ellen MacArthur Foundation (EMF), Cowes, Isle of Wight.
EMF (2015). Circularity indicators. An approach to measuring circularity. Ellen MacArthur Foundation (EMF), Cowes, Isle of Wight.
Eurostat (2016). Handbook for estimating raw material equivalents (RME) – of imports and exports and RME- based on indicators for countries based on Eurostat’s RME model. Eurostat. Luxembourg.
Eurostat (2017). Treatment of waste by waste category, hazardousness and waste operations in 2014. Oneline publication by Eurostat (site visited in October 2017: http://appsso.eurostat.ec.europa.eu/nui/show.do?dataset=env_wastrt&lang=en).
Ganzevles J, Potting J and Hanemaaijer A. (2016). Evaluatie Green Deals Circulaire Economie [evaluation green deals circular economy, background study]. PBL Netherlands Environmental Assessment Agency, The Hague.
Geng Y, Fu J, Sarkis J and Xue B. (2011). Towards a national circular economy indicator system in China: An evaluation and critical analysis. Journal of Cleaner Production, 23: 2016–224.
Giljum S, Lieber M and Doranova A. (2016a). EU Eco-Innovation Index: 2016 version. EIO letter. EcoInnovation Observatory, Vienna.
Giljum S, Lieber M and Doranova A. (2016b). EU Eco-Innovation Index: 2016 version. Technical note. EcoInnovation Observatory, Vienna.
Grondstoffenakkoord (2017). Grondstoffenakkoord. Intentieovereenkomst om te komen tot transitieagenda’s voor de circulaire economie [raw materials agreement; declaration of intention to achieve transition agendas for the circular economy (in Dutch)]. Ministry of Economic Affairs (EZ) and former Ministry of Infrastructure and the Environment (IenM), The Hague.
Haas W, Krausmann F, Wiedenhofer D and Heinz M. (2015). How circular is the global economy? An assessment of material flows, waste production, and recycling in the European union and the world in 2005. Journal of Industrial Ecology, (18)5: 765–777 (doi: 10.1111/jiec.12244).
Hekkert MP and Ossebaard M. (2010). De innovatiemotor. Het versnellen van baanbrekende innovaties [The innovation motor. Accellerating prioneering

88 | Circular economy: what we want to know and can measure
innovations (in Dutch)]. Uitgeverij koninklijke van Gorcum, Assen.
Hekkert MP, Suurs RAA, Negro SO, Kuhlmans S and Smits REHM. (2007). Functions of innovation systems: A new approach for analysing technologial change. Technological Forcasting and Social Change, 74(4): 413–432 (doi: 10.1016/j.techfore.2006.03.002).
Huysman S, De Schaepmeester J, Ragaert K, Dewulf J and De Meester S. (2017). Performance indicators for a circular economy: A case study on post industrial waste. Resources, Consevation and Recycling, 120(May): 46–54 (doi: 10.1016/j.resconrec.2017.013).
IenM and EZ (2016a). Nederland circulair in 2050. Rijksbreed programma Circulaire Economie [‘A circular economy in the Netherlands by 2050’. Government-wide programme for a Circular Economy]. Former Ministy of Infrastructure and the Environment (IenM) and Ministry of Economic Affairs (EZ), The Hague.
IenM and EZ (2016b). Letter by Minister Kamp of Economic Affairs and State Secretary Dijksma of Infrastructure and the Environment to the Speaker of the Dutch House of Representatives about the Government-wide programme for a Circular Economy (IenM/BSK-2016/175734). Former Ministy of Infrastructure and the Environment (IenM) and Ministry of Economic Affairs (EZ), The Hague.
Jacob K, Münch L and Werland S. (2014). Indikatoren der Ressourcenpolitik. Akteursanalyse von Interessen und Betroffenheit. Vrije Universiteit Berlijn (Freie Universität Berlin), Berlin, Germany.
Jonker J, Stegeman H, Faber N and Kothman I. (2017). Eén zwaluw voorspelt veel goeds. Resultaten van het landelijk onderzoek 2016-2017 naar business modellen voor de circulaire economie [Results from national study into business models for the circular economy (2016–2017) (in Dutch)]. Stichting OCF 2.0, Doetinchem.
Kovanda J. (2014). Incorporation of recycling flows into economy-wide flow accounting and analysis: A case study for the Czech Republic. Resources, Conservation and Recycling, (92): 78–84 (doi: 10.1016/j.resconrec.2014.08.006).
KIDV (2017). Rapportage kunststofketen. Interventies om de kunststofketen verder te sluiten qua grondstoffen en economisch [Report on the synthetics chain. Interventions to close the synthetics chain, with respect to raw materials and economically (in Dutch)]. Kennisinstituut Duurzaam Verpakken (KIDV), The Hague.
Krausmann F, Gingrich S, Eisenmenger N. Erb K-H, Haberl H and Fischer-Kowalski N. (2009). Growth in global materials use, GDP and populatiojn during the 20th century. Ecological Economics, 68(10): 2696–2705 (doi: 10.1016/j.ecolecon.2009.05.007).
Kwant K, Siemers W, Hamer A and Both D. (2017). Monitoring biobased economy in Nederland 2016, Netherlands Enterprise Agency (RVO.nl), Utrecht.
Kwant K, Hamer A, Siemers W and Both D. (2016). Monitoring biobased economy in Nederland 2015, Netherlands Enterprise Agency (RVO.nl), Utrecht.
Lof M, Schenau S, De Jong R, Remme R, Graveland C and Hein L. (2017). The SEEA EEA carbon account for the Netherlands. Statistics Netherlands (CBS) and Wageningen University and Research, The Hague.
Loorbach D, Rotmans J and Lijnis Huffenreuter R. (2014). Ondernemen in transities. Bedrijfstransities als innovatief model voor duurzaam ondernemen (SMO-2014/3) [Entrepreneurship in transitions. Corporate transitions as innovative model for corporate social responsibility (in Dutch)]. CSR Netherlands, The Hague.
M2i, TNO and TUD (2017). Kritische materialen en de Nederlandse technologische industrie [Critical materials and Dutch technological industry (in Dutch)]. Internet publication (site visited September 2017: https://nevi.ccreader.nl/files/nevi/Risicomanagement.pdf).
Magnier C, Auzanneau M, Calatayud P, Gauche M, Ghewy X, Granger M, Margontier S and Pautard E. (2017). Ten key indicators for monitoring the circular economy. Environmental Information Department, Ministry of the Environment, Energy and Marine Affairs, France.
Meijer-Cheung WK, Schoenaker N and Schenau S. (2016). Broeikasgasemissies door de Nederlandse economie [Greenhouse gas emissions due to the Dutch economy (in Dutch)]. Statistics Netherlands (CBS), The Hague.
Mekonnen MM and Hoekstra AY. (2011). National water footprint accounts: The green, blue and grey water footprint of production and consumption. (Value of water research report 50; No. 50). Unesco-IHE Delft Institute for Water Education, Delft.
Nederland Circulair! Circulair ondernemen – 50 best practices [Circular entrepreneurship – 50 best practices (in Dutch). Internetpublicatie van Nederland Circulair! (site visited in December 2017: https://www.circulair-ondernemen.nl/uploads/a4c93502340d4008299529 b2c984ab5d.pdf).
Netherlands Court of Audit (2005). Handleiding onderzoek naar doelmatigheid en doeltreffendheid. Netherlands Court of Audit, The Hague.
Nijland H, Van Meerkerk J and Hoen A. (2015). Effecten van autodelen op mobiliteit en CO2 –uitstoot [Impact of car ownership on mobility and CO2 emissions (in Dutch)]. PBL Netherlands Environmental Assessment Agency, The Hague.
PEW (2015). World Population by Income. How many live on how much, and where. Internet publication by PEW Research Center, Washington D.C. (site visited in August 2017: http://www.pewglobal.org/interactives/global-population-by-income/).

89References |
Plastics Europe (2015). Plastics. The facts 2015. An analysis of European latest plastics production, demand and waste data. Plastics Europe, Brussels.
Van de Pol-de Jongh L, Keller K and Delahaye R. (2016). Material flow monitor – time series 2008-2014. Statistics Netherlands (CBS), The Hague.
Potting J, Hekkert MP, Worrell E and Hanemaaijer A. (2016). Circulaire economie: Innovatie meten in de keten [Circular economy: measuring innovation along the chain (in Dutch)]. PBL Netherlands Environmental Assessment Agency, The Hague.
Potting J, Nierhoff N, Montevecchi F, Antikainen R, Colgan S, Hauser A, Günther J, Wuttke J, Jørgensen Kjær B and Hanemaaijer A. (2017). Input to the European Commission from European EPAs about monitoring progress of the transition towards a circular economy in the European Union. European Network of the Heads of Environment Protection Agencies (EPA Network).
Programmabureau Nederland Circulair (2017). Nederland Circulair in 2050. Wat betekent dat? [A circular economy in the Netherlands by 2050. What does that mean? (in Dutch)]. Website of Programmabureau Nederland Circulair in 2050 of the Dutch former Ministry of Infrastructure and the Environment (IenM) and the Ministry of Economic Affairs (EZ), The Hague (site visited in October 2017: https://www.circulaireeconomienederland.nl/home/default.aspx).
OECD (2017). Green growth indicators 2017 (doi: 10.1787/ 9789264268586-en). OECD publishers, Paris, France.
Coalition Agreement Rutte-III (2017). Vertrouwen in de toekomst. Regeerakkoord 2017-2012 [Coalition Agreement 2017–2012] (agreement between coalition parties VVD, CDA, D66 and ChristenUnie). Internet publication (site visited in December 2017: https://www.rijksoverheid.nl/documenten/publicaties/2017/10 /10/regeerakkoord-2017-vertrouwen-in-de-toekomst).
Remmerswaal S, Hanemaaijer A and Kishna M. (2017). Betalen voor gebruik. Verdienmodellen in de circulaire economie [Pay for use. Revenue models in the circular economy (in Dutch)]. PBL Netherlands Environmental Assessment Agency, The Hague.
RIVM (2016). Meten van Duurzaamheid.nl. Website about measuring sustainability, National Institute for Public Health and the Environment (RIVM), Bilthoven (site visited in October 2017: http://www.metenvanduurzaamheid.nl/).
Rli (2015). Circulaire economie. Van wens naar uitvoering [Circular economy. From desired concept to implementation (in Dutch)]. Council for the Environment and Infrastructure (Rli), The Hague.
Rood T, Muilwijk H and Westhoek H. (2016). Voedsel voor de circulaire economie. PBL Netherlands Environmental Assessment Agency, The Hague.
SAMR (2017). Report – impact verbod gratis plastic tassen onder retailers [impact of the ban on plastic carrier
bags for retailers], SAMR Smart Agent Market Response, Leusden, commissioned by the Dutch former Ministry of Infrastructure and the Environment.
Sandén BA, Hekkert MP and Negro SO. (2017). Improving the rigour of the technologial innovation systems framework: Towards a TIS model. Paper presented at the International Conference on Sustainability Transitions, June 2017, Götenborg.
Saidani M, Yannou B, Leroy Y and Cluzel F. (2017). How to assess product performance in the circular economy? Propos requirements for the design of a circularity measurement framework. Recycling, 2(6): 18 (doi: 10.3390/recycling2010006).
SER (2016). Werken aan een circulaire economie: Geen tijd te verliezen (Advies 16/05) [Working on a circular economy: no time to lose (Advice 16/05) (in Dutch)]. The Social and Economic Council of the Netherlands (SER), The Hague.
SBRCURnet (2015). Bepaling van de milieuprestatie van gebouwen en GWW-werken (MPG). Geactualiseerde versie 2015 [Determining the environmental performace of buildings and GWW works (MPG). Updated version 2015 (in Dutch)]. SBRCURnet, Delft.
Stichting Bouwkwaliteit (2017). Nationale milieudatabase. Website van Stichting Bouwkwaliteit. Website van Stichting Bouwkwaliteit [National environment database. Website of the foundation on the quality of construction] (site visited October 2017: https://www.milieudatabase.nl/).
Transitieteams (2018). Grondwerk voor het grondstoffen-akkoord. Strategisch actieplan circulaire economie 2018 – 2022 op basis van vijf transitieagenda’s [Groundwork for the raw materials agreement. Strategic plan circular economy 2018–2022, on the basis of five transition agendas (in Dutch)].
UN (2015). World Population Prospects. The 2015 Revision. Key findings and advanced tables (ESA/P/WP-241). Population Division, Department of Economic and Social Affairs (DESA), United Nations (UN), New York.
UNEP (2011). Decoupling natural resource use and environmental impact from economic growth (DTI/1388/PA). United Nations Environmental Programme (UNEP), Paris, France.
UNEP (2016). Global material flows and resource productivity. An assessment study of the UNEP International Resource Panel (DTI/1974/PA). United Nations Environmental Programme (UNEP), Paris, France.
Van der Esch S, Ten Brink B, Stehfest E, Bakkenes M, Sewell A, Bouwman A, Meijer J, Westhoek H and Van der Berg M. (2017). Exploring future changes in land use and land condition and the impacts on food, water, climate change and biodiversity. PBL Netherlands Environmental Assessment Agency, The Hague.
Vermeulen WJV, Witjes S and Reike D. (2014). Advies over een Raamwerk voor Impactmeting voor Circulair

90 | Circular economy: what we want to know and can measure
Inkopen [Advice on a framework for measuring impact of circular purchasing (in Dutch)]. Faculty of Earth Sciences, Utrecht University, Utrecht.
Verrips A, Hoogeboom S, Hoekstra K, Romijn G, Folmer K and Van Gemeren J. (2017). De circulaire economie van kunststof: van grondstoffen tot afval (CPB achtergronddocument) [The circular economy of synthetics/plastics: from raw materials to waste (in Dutch)]. CPB Bureau for Economic Policy Analysis, The Hague.
Vollebergh H, Van Dijk J, Drissen E, Eerens H and Vrijberg H. (2017). Belastingverschuiving van arbeid naar grondstoffen, materialen en afval. Verkenning van belastingen voor het stimuleren van de circulaire economie [Taxation shifts from labour to raw materials and waste. Exploration of taxation to stimulate the circular economy (in Dutch)]. PBL Netherlands Environmental Assessment Agency, The Hague.
World Bank (2016). Poverty and shared prosperity 2016: Taking on inequality (doi: 10.1596/978-1-4648-0958-3). World Bank, Washington D.C.
Wilting H, Hanemaaijer A, Van Oorschot M and Rood T. (2015). Trends in Nederlandse voetafdrukken 1995-2010 [Trends in Dutch footprints, 1995–2010 (in Dutch)]. PBL Netherlands Environmental Assessment Agency, The Hague.


PBL Netherlands Environmental Assessment Agency
Mailing addressPO Box 303142500 GH The Hague The Netherlands
Visiting addressBezuidenhoutseweg 302594 AV The HagueT +31 (0)70 328 8700
www.pbl.nl/en
July 2018


![Supersymmetry for systems with unitary disorder: circular … · 2011. 11. 22. · Haar measure dU, is called Dyson’s [10] circular unitary ensemble (CUE) in Ndimensions. The CUE](https://img.dokumen.tips/doc/110x75/60842d110e6ea4570a599883/supersymmetry-for-systems-with-unitary-disorder-circular-2011-11-22-haar-measure.jpg)