Embed Size (px)
Citation preview
China’s Economy Is Undergoing a Huge TransformationThat No One’s Talking About
August 28, 2015by Frank Holmes
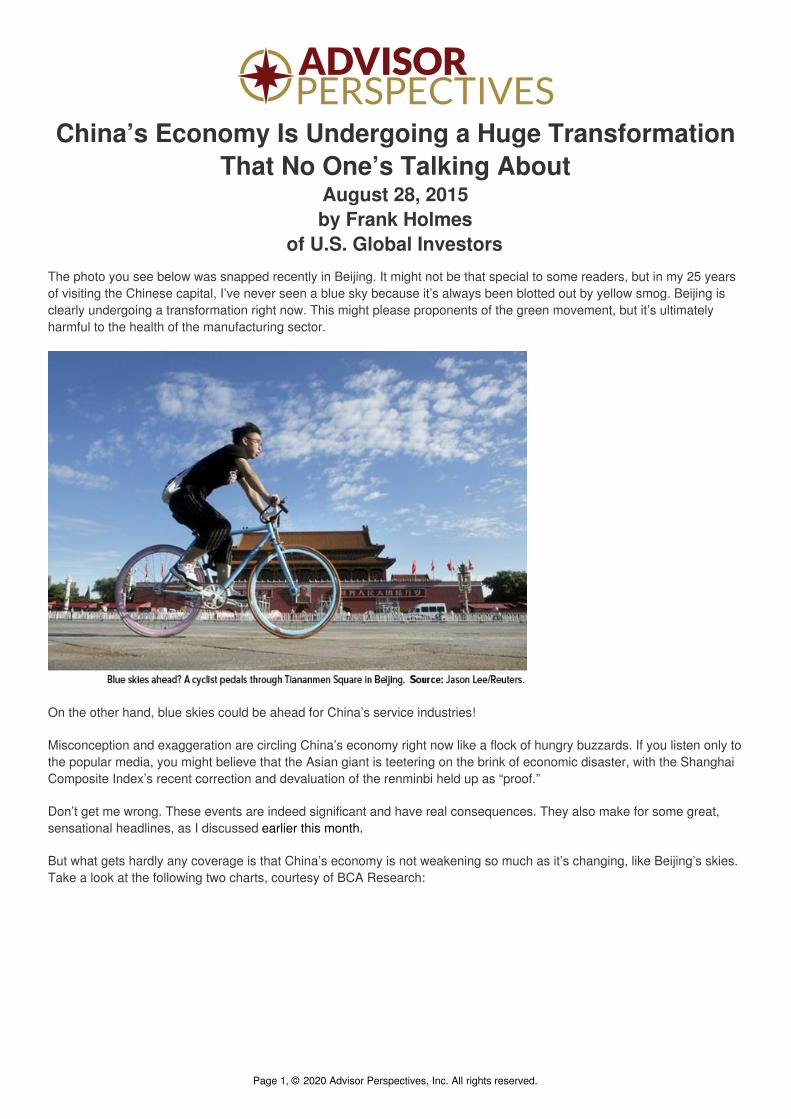
of U.S. Global InvestorsThe photo you see below was snapped recently in Beijing. It might not be that special to some readers, but in my 25 yearsof visiting the Chinese capital, I’ve never seen a blue sky because it’s always been blotted out by yellow smog. Beijing isclearly undergoing a transformation right now. This might please proponents of the green movement, but it’s ultimatelyharmful to the health of the manufacturing sector.
On the other hand, blue skies could be ahead for China’s service industries!
Misconception and exaggeration are circling China’s economy right now like a flock of hungry buzzards. If you listen only tothe popular media, you might believe that the Asian giant is teetering on the brink of economic disaster, with the ShanghaiComposite Index’s recent correction and devaluation of the renminbi held up as “proof.”
Don’t get me wrong. These events are indeed significant and have real consequences. They also make for some great,sensational headlines, as I discussed earlier this month.
But what gets hardly any coverage is that China’s economy is not weakening so much as it’s changing, like Beijing’s skies.Take a look at the following two charts, courtesy of BCA Research:
Page 1, © 2020 Advisor Perspectives, Inc. All rights reserved.

click to enlarge
You can see that the world’s second-largest economy has begun to shift away from manufacturing and more towardconsumption and the service industries. While the country’s purchasing managers’ index (PMI) reading has been incontraction mode since March of this year, the service industries—which include financial services, insurance,entertainment, tourism and more—are ever-expanding. The problem is that the transformation has not been fast enough tooffset the massive size of the manufacturing sector.
Just as a refresher, the PMI is forward-looking and resets every 30 days. It helps investors manage expectations. Considerthis: The best-performing country in our Emerging Europe Fund is the Czech Republic—which also happens to have oneof the highest PMI readings! Coincidence?
Page 2, © 2020 Advisor Perspectives, Inc. All rights reserved.

Overseas travel, cinema box office revenue and ecommerce in China are all seeing “explosive growth,” according to BCA.The country’s once-struggling real estate market is also robust. The government just relaxed rules to permit moreforeigners to purchase mainland property.
But you’d be hard-pressed to come across any of this constructive news because it’s not particularly good for ratings.
A recent Economist article makes this point very clear:
The property market matters far more for China’s economy than equities do. Housing and land account for the vast majority of collateral in the financial
system and play a much bigger role in spurring on growth. Yet the barrage of bearish headlines about share prices has obscured news of a propertyrebound. House prices have perked up nationwide for three straight months. Two months after the stock market first crashed, this upturn continues.
“Commodity Imports Have Actually Been Quite Strong”
Again, China’s transformation from a manufacturing-based economy to one that focuses on consumption has realconsequences, one of the most significant being the softening of global commodity prices. As I told Daniela Cambone onthis week’s Gold Game Film, gold’s Love Trade has become not a No Trade, but a Slow Trade. We’ve seen demand coolalong with a decline in GDP per capita, the PMI readings and China’s M2 money supply growth.
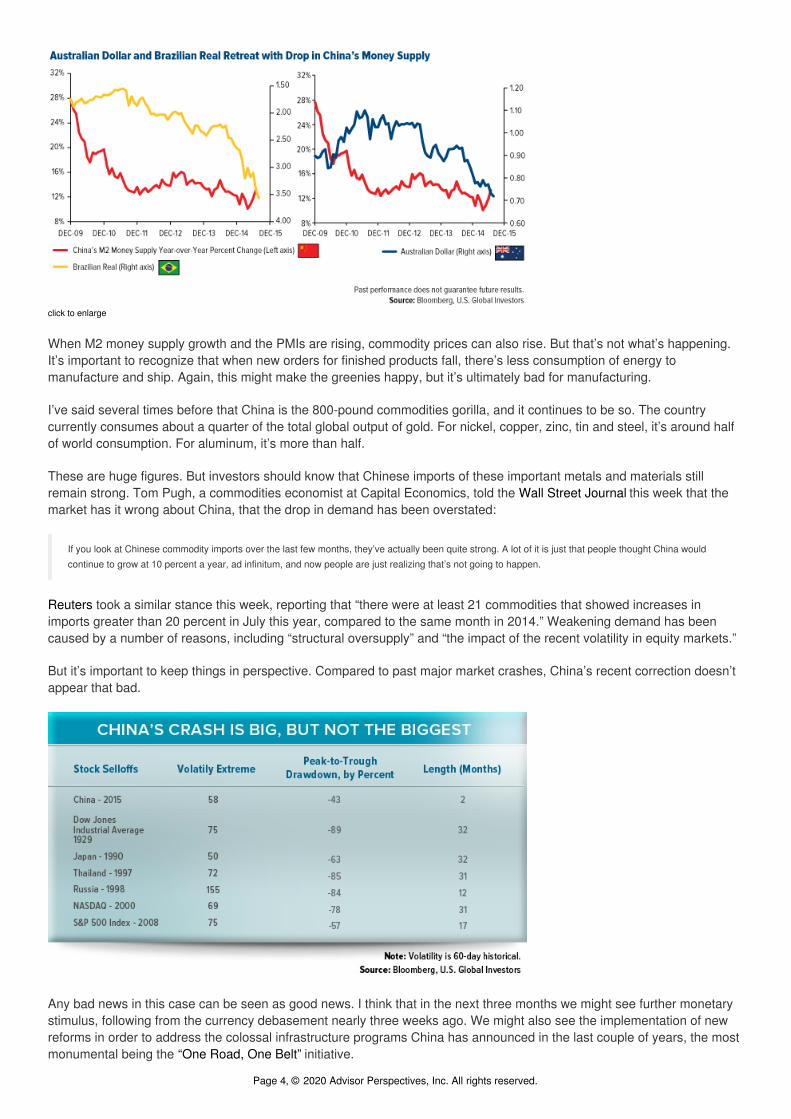
Below you can see the relationship between China’s M2 money supply growth and metal prices. Since its peak in late2009, money supply growth has been dropping year-over-year, driving down metal prices.
click to enlarge
Money supply growth tends to be a “first mover.” When it has contracted, the PMI has usually followed. Recently, this hashurt economies that depend on China as a net buyer of raw materials, including Brazil, which supplies the Asian countrywith iron ore, soybeans and many other commodities, and Austrailia.
Page 3, © 2020 Advisor Perspectives, Inc. All rights reserved.
click to enlarge
When M2 money supply growth and the PMIs are rising, commodity prices can also rise. But that’s not what’s happening.It’s important to recognize that when new orders for finished products fall, there’s less consumption of energy tomanufacture and ship. Again, this might make the greenies happy, but it’s ultimately bad for manufacturing.
I’ve said several times before that China is the 800-pound commodities gorilla, and it continues to be so. The countrycurrently consumes about a quarter of the total global output of gold. For nickel, copper, zinc, tin and steel, it’s around halfof world consumption. For aluminum, it’s more than half.
These are huge figures. But investors should know that Chinese imports of these important metals and materials stillremain strong. Tom Pugh, a commodities economist at Capital Economics, told the Wall Street Journal this week that themarket has it wrong about China, that the drop in demand has been overstated:
If you look at Chinese commodity imports over the last few months, they’ve actually been quite strong. A lot of it is just that people thought China would
continue to grow at 10 percent a year, ad infinitum, and now people are just realizing that’s not going to happen.
Reuters took a similar stance this week, reporting that “there were at least 21 commodities that showed increases inimports greater than 20 percent in July this year, compared to the same month in 2014.” Weakening demand has beencaused by a number of reasons, including “structural oversupply” and “the impact of the recent volatility in equity markets.”
But it’s important to keep things in perspective. Compared to past major market crashes, China’s recent correction doesn’tappear that bad.
Any bad news in this case can be seen as good news. I think that in the next three months we might see further monetarystimulus, following from the currency debasement nearly three weeks ago. We might also see the implementation of newreforms in order to address the colossal infrastructure programs China has announced in the last couple of years, the mostmonumental being the “One Road, One Belt” initiative.
Page 4, © 2020 Advisor Perspectives, Inc. All rights reserved.

Dividend-Paying Stocks Helped Stanch the Losses
As investors and money managers, it’s crucial that we be cognizant of the changes China is undergoing. With volatility highin the Chinese markets right now, we’ve raised the cash level, and after the dust settles somewhat and the rightopportunities arise, we’ll be prepared to deploy the cash. We’re also diversified outside of China.
We managed to slow the losses during the Shanghai correction by being invested in high-quality, dividend-paying stocks.
According to daily data collected since December 2004, the median trailing P/E ratio for the Shanghai Composite Indexconstituents currently sits at 48.6 times earnings. If it reverts to the mean, risk is 32 percent to the downside for the index.Currently, the P/E ratio of our China Region Fund constituents sits around 16 times. This suggests that USCOX has lessdownside risk and is cheaper than the Shanghai Composite.
click to enlarge
We seek to take advantage of the trend toward consumption by increasing our exposure to the growing service industries—technology, Internet and ecommerce companies (Tencent is one of our top 10 holdings); financial services (AIA and PingAn Insurance); and enviornmental services (wastewater treatment services provider CT Environmental).
Rising sports participation among white collar workers in China is very visibile these days. Xian Liang, portfolio manager ofUSCOX, says that his friends back in Shanghai share with him, via WeChat, how they track their daily runs using mappingapps on their phones.
With that said, an attractive company is Anta Sports, an emerging, innovative sportswear franchise. Fans of the GoldenState Warriors might recall that guard Klay Thompson endorsed its products earlier this year.
We believe the China region remains one of the most compelling growth stories in the world and continues to provideexciting investment opportunities.
Index SummaryPage 5, © 2020 Advisor Perspectives, Inc. All rights reserved.
The major market indices finished up this week. The Dow Jones Industrial Average rose 1.11 percent. The S&P 500Stock Index rose 0.91 percent, while the Nasdaq Composite rose 2.60 percent. The Russell 2000 small capitalizationindex was up 0.53 percent this week.The Hang Seng Composite fell 2.90 percent this week; while Taiwan rose 2.98 percent and the KOSPI rose 3.28percent.The 10-year Treasury bond yield rose 14 basis points to 7.12 percent.
Domestic Equity Market
click to enlarge
Strengths
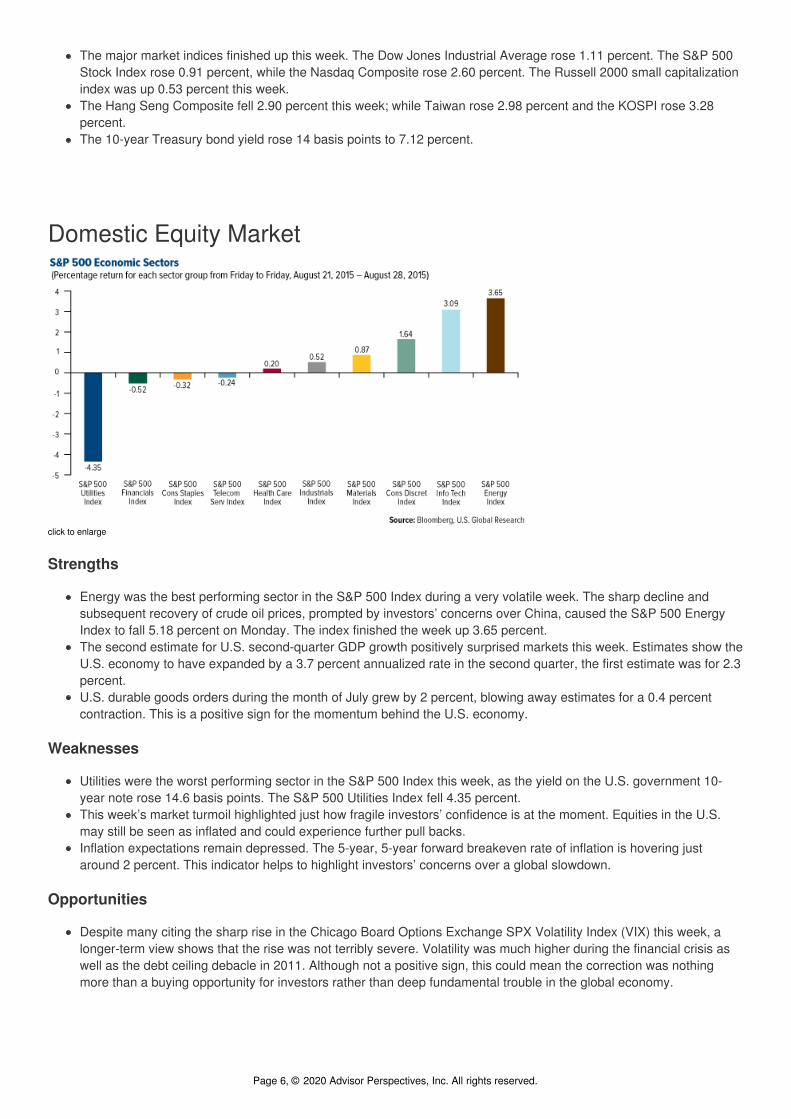
Energy was the best performing sector in the S&P 500 Index during a very volatile week. The sharp decline andsubsequent recovery of crude oil prices, prompted by investors’ concerns over China, caused the S&P 500 EnergyIndex to fall 5.18 percent on Monday. The index finished the week up 3.65 percent.The second estimate for U.S. second-quarter GDP growth positively surprised markets this week. Estimates show theU.S. economy to have expanded by a 3.7 percent annualized rate in the second quarter, the first estimate was for 2.3percent.U.S. durable goods orders during the month of July grew by 2 percent, blowing away estimates for a 0.4 percentcontraction. This is a positive sign for the momentum behind the U.S. economy.
Weaknesses
Utilities were the worst performing sector in the S&P 500 Index this week, as the yield on the U.S. government 10-year note rose 14.6 basis points. The S&P 500 Utilities Index fell 4.35 percent.This week’s market turmoil highlighted just how fragile investors’ confidence is at the moment. Equities in the U.S.may still be seen as inflated and could experience further pull backs.Inflation expectations remain depressed. The 5-year, 5-year forward breakeven rate of inflation is hovering justaround 2 percent. This indicator helps to highlight investors’ concerns over a global slowdown.
Opportunities
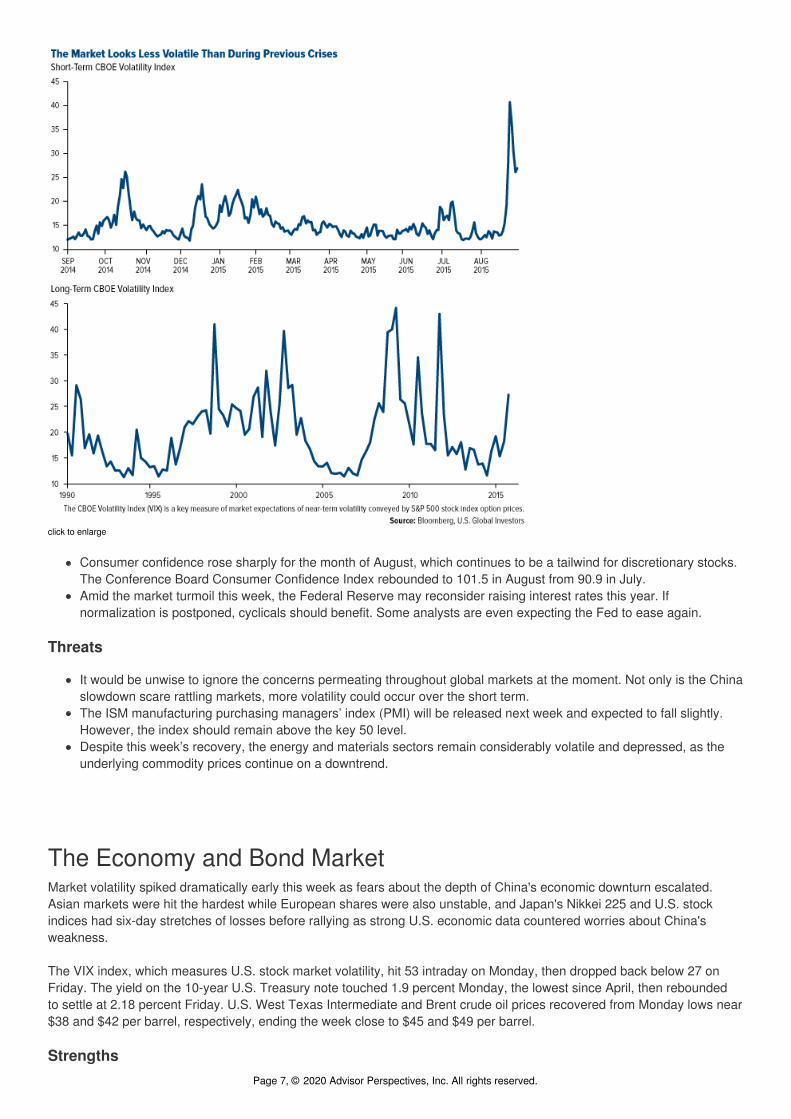
Despite many citing the sharp rise in the Chicago Board Options Exchange SPX Volatility Index (VIX) this week, alonger-term view shows that the rise was not terribly severe. Volatility was much higher during the financial crisis aswell as the debt ceiling debacle in 2011. Although not a positive sign, this could mean the correction was nothingmore than a buying opportunity for investors rather than deep fundamental trouble in the global economy.
Page 6, © 2020 Advisor Perspectives, Inc. All rights reserved.
click to enlarge
Consumer confidence rose sharply for the month of August, which continues to be a tailwind for discretionary stocks.The Conference Board Consumer Confidence Index rebounded to 101.5 in August from 90.9 in July.Amid the market turmoil this week, the Federal Reserve may reconsider raising interest rates this year. Ifnormalization is postponed, cyclicals should benefit. Some analysts are even expecting the Fed to ease again.
Threats
It would be unwise to ignore the concerns permeating throughout global markets at the moment. Not only is the Chinaslowdown scare rattling markets, more volatility could occur over the short term.The ISM manufacturing purchasing managers’ index (PMI) will be released next week and expected to fall slightly.However, the index should remain above the key 50 level.Despite this week’s recovery, the energy and materials sectors remain considerably volatile and depressed, as theunderlying commodity prices continue on a downtrend.
The Economy and Bond MarketMarket volatility spiked dramatically early this week as fears about the depth of China's economic downturn escalated.Asian markets were hit the hardest while European shares were also unstable, and Japan's Nikkei 225 and U.S. stockindices had six-day stretches of losses before rallying as strong U.S. economic data countered worries about China'sweakness.
The VIX index, which measures U.S. stock market volatility, hit 53 intraday on Monday, then dropped back below 27 onFriday. The yield on the 10-year U.S. Treasury note touched 1.9 percent Monday, the lowest since April, then reboundedto settle at 2.18 percent Friday. U.S. West Texas Intermediate and Brent crude oil prices recovered from Monday lows near$38 and $42 per barrel, respectively, ending the week close to $45 and $49 per barrel.
StrengthsPage 7, © 2020 Advisor Perspectives, Inc. All rights reserved.

Second-quarter real GDP growth was revised up to 3.7 percent quarter-over-quarter seasonally adjusted annual rate(QoQ saar) from 2.3 percent QoQ saar in the initial release. This was above the expected revision to 3.2 percentQoQ saar and shows above trend growth in the U.S.Durable goods orders reportedly gained 2.0 percent month-over-month (MoM) in July, significantly above theexpected 0.4 percent MoM decline. June was revised to 4.1 percent MoM from 3.4 percent MoM initially.U.S. new home sales rose 5.4 percent in July to a seasonally adjusted annual rate of 507,000 units. Sales were 25.8percent above on a year-over-year (YoY) basis. The S&P/Case Shiller composite index of 20 metropolitan areasincreased 5.0 percent in June from a year earlier. The Pending Home Sales Index increased 0.5 percent to 110.9,suggesting further housing market improvements.
Weaknesses
Core personal consumption expenditures (PCE) inched up 0.1 percent MoM in July, unchanged from growth in theprevious month and in-line with expectations. This translates to 1.2 percent YoY in July, down from 1.3 percent YoYin June and below market consensus at 1.3 percent YoY.Personal spending was reported at 0.3 percent MoM in July, unchanged from the upwardly revised 0.3 percent MoMin June (up from 0.2 percent MoM initially) and below expectations of 0.4 percent MoM.The University of Michigan Sentiment Index declined to 91.9 in the final report for August from 92.9 in the preliminaryreport and is still below 93.1 in July. This was below the expected 93.0. The current economic conditions indexdeclined to 105.1 in the final report from 107.1 initially, down from 107.2 in July. The consumer expectations indexwas roughly unchanged, at 83.4 in the final report, down from 83.8 in the preliminary report, and down from 84.1 inJuly.
Opportunities
With renewed global deflationary concerns, it will be key to see whether the European Central Bank (ECB) ramps upits quantitative easing program at next Thursday’s meeting.Market implied odds of a September rate hike have significantly diminished, but should markets calm, the debateabout the timing of the Fed lift-off will again focus more on macro data. The last labor market report before theSeptember Federal Open Market Committee (FOMC) meeting will be released on Friday. A continuation of thestrength seen in recent reports would favor a September rate hike.U.S. Manufacturers New Orders will be released Wednesday. Given the one-month trend is above the three-monthtrend, odds favor a positive report that would support optimism about the continuing pace of growth.
Threats
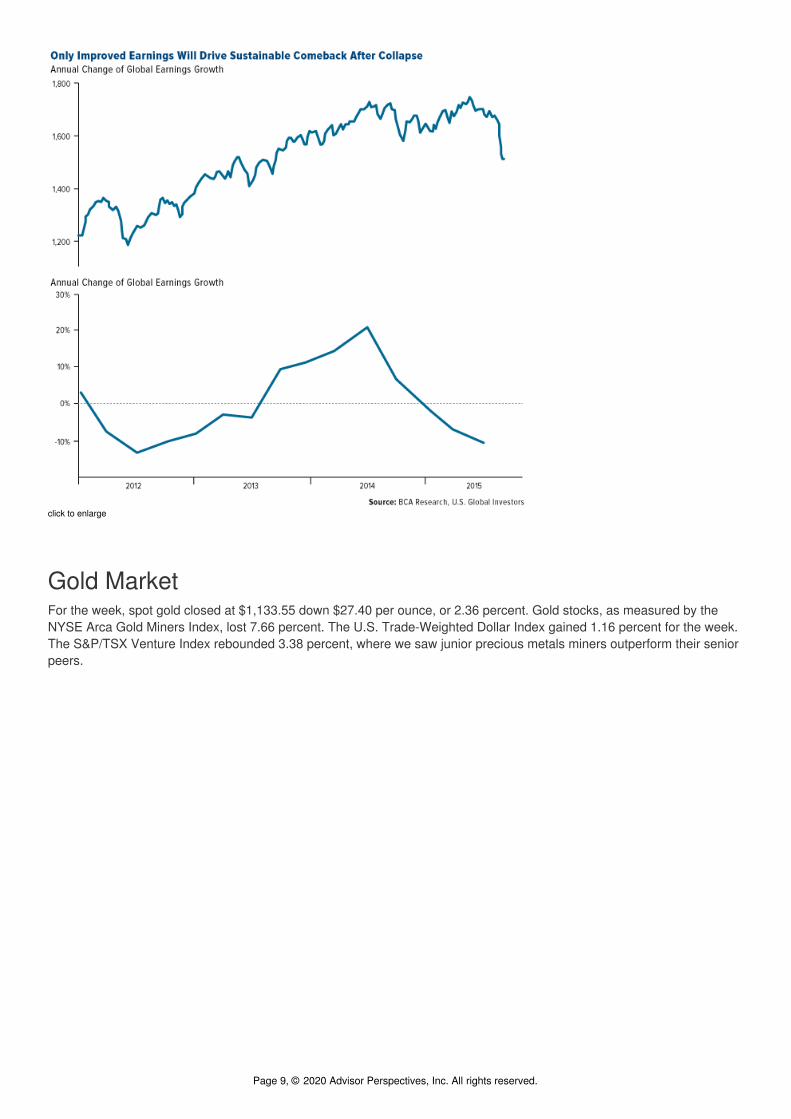
With China’s manufacturing PMI trending lower, the latest release on Monday could revive market turmoil. The U.S.ISM Manufacturing Index is released on Tuesday. Since the one-month trend is below the three-month trend, afurther decline would unsettle the markets.Given the increase in the trade deficit to $43.8 billion in June from $40.9 billion in May, a further increase in the Julyreport coming out on Thursday would heighten concerns about the detrimental effect of the strong dollar on the U.S.economy.Given the sharp decline in equities, it is tempting to buy into the recent rebound. However, the fundamentals remaindeficient. Some value may have been restored to valuations, but one of the main factors driving the recent selloff wasthe contraction in global earnings growth. Only improved growth and profits will produce a sustainable comeback.
Page 8, © 2020 Advisor Perspectives, Inc. All rights reserved.
click to enlarge
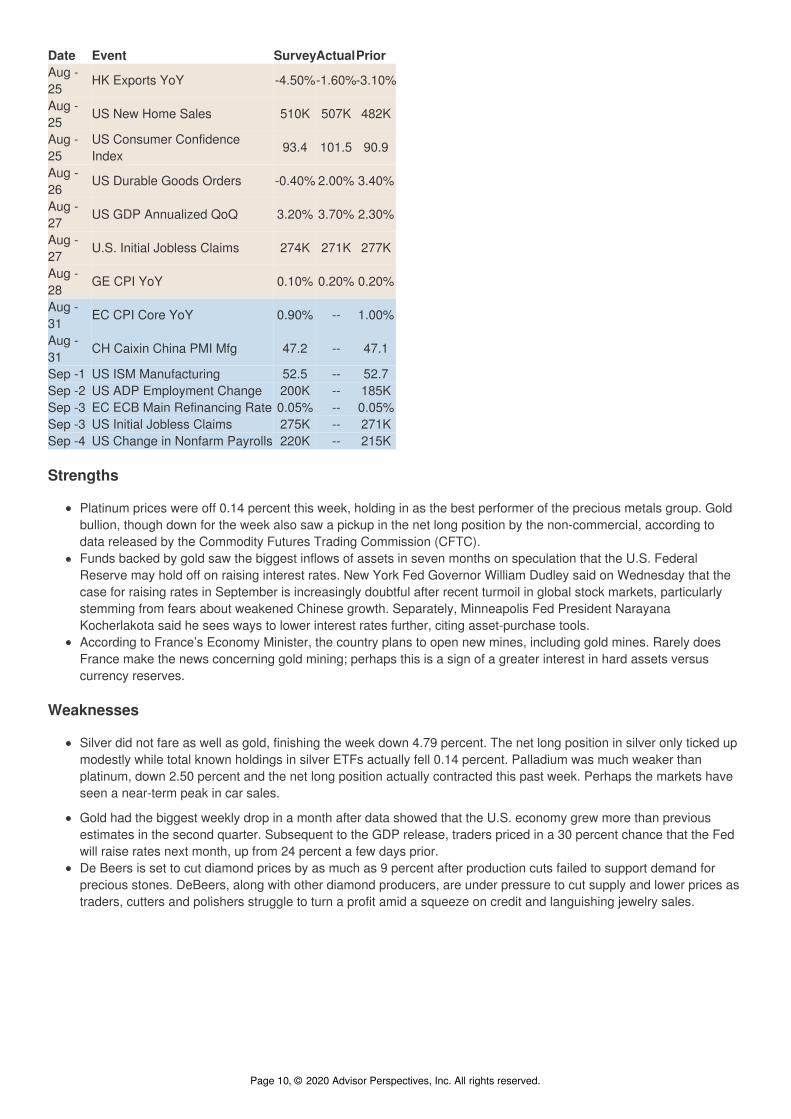
Gold MarketFor the week, spot gold closed at $1,133.55 down $27.40 per ounce, or 2.36 percent. Gold stocks, as measured by theNYSE Arca Gold Miners Index, lost 7.66 percent. The U.S. Trade-Weighted Dollar Index gained 1.16 percent for the week.The S&P/TSX Venture Index rebounded 3.38 percent, where we saw junior precious metals miners outperform their seniorpeers.
Page 9, © 2020 Advisor Perspectives, Inc. All rights reserved.
Date Event SurveyActualPriorAug -25
HK Exports YoY -4.50%-1.60%-3.10%
Aug -25
US New Home Sales 510K 507K 482K
Aug -25
US Consumer ConfidenceIndex
93.4 101.5 90.9
Aug -26
US Durable Goods Orders -0.40% 2.00% 3.40%
Aug -27
US GDP Annualized QoQ 3.20% 3.70% 2.30%
Aug -27
U.S. Initial Jobless Claims 274K 271K 277K
Aug -28
GE CPI YoY 0.10% 0.20% 0.20%
Aug -31
EC CPI Core YoY 0.90% -- 1.00%
Aug -31
CH Caixin China PMI Mfg 47.2 -- 47.1
Sep -1 US ISM Manufacturing 52.5 -- 52.7Sep -2 US ADP Employment Change 200K -- 185KSep -3 EC ECB Main Refinancing Rate 0.05% -- 0.05%Sep -3 US Initial Jobless Claims 275K -- 271KSep -4 US Change in Nonfarm Payrolls 220K -- 215K
Strengths
Platinum prices were off 0.14 percent this week, holding in as the best performer of the precious metals group. Goldbullion, though down for the week also saw a pickup in the net long position by the non-commercial, according todata released by the Commodity Futures Trading Commission (CFTC).Funds backed by gold saw the biggest inflows of assets in seven months on speculation that the U.S. FederalReserve may hold off on raising interest rates. New York Fed Governor William Dudley said on Wednesday that thecase for raising rates in September is increasingly doubtful after recent turmoil in global stock markets, particularlystemming from fears about weakened Chinese growth. Separately, Minneapolis Fed President NarayanaKocherlakota said he sees ways to lower interest rates further, citing asset-purchase tools.According to France’s Economy Minister, the country plans to open new mines, including gold mines. Rarely doesFrance make the news concerning gold mining; perhaps this is a sign of a greater interest in hard assets versuscurrency reserves.
Weaknesses
Silver did not fare as well as gold, finishing the week down 4.79 percent. The net long position in silver only ticked upmodestly while total known holdings in silver ETFs actually fell 0.14 percent. Palladium was much weaker thanplatinum, down 2.50 percent and the net long position actually contracted this past week. Perhaps the markets haveseen a near-term peak in car sales.
Gold had the biggest weekly drop in a month after data showed that the U.S. economy grew more than previousestimates in the second quarter. Subsequent to the GDP release, traders priced in a 30 percent chance that the Fedwill raise rates next month, up from 24 percent a few days prior.De Beers is set to cut diamond prices by as much as 9 percent after production cuts failed to support demand forprecious stones. DeBeers, along with other diamond producers, are under pressure to cut supply and lower prices astraders, cutters and polishers struggle to turn a profit amid a squeeze on credit and languishing jewelry sales.
Page 10, © 2020 Advisor Perspectives, Inc. All rights reserved.

click to enlarge
Opportunities
According to Metals Focus, gold output will start declining as soon as next year and production will plunge 18 percentby the end of the decade. Global mine output surged 24 percent in a decade to a record 3,114 metric tons in 2014, ascompanies dug more to exploit a 12-year bull market in prices.
click to enlarge
Expect more news next week that could impact gold as the annual retreat at Jackson Hole gets into full swing. Newsstories going into the meeting have had a more accommodative slant to them with the recent enhanced marketvolatility that investors have had to contend with.In a recent letter to clients, Ray Dalio, the head of Bridgewater, the world’s largest hedge fund, said that the likelypath for the Federal Reserve is to embark on another round of quantitative easing instead of the expected interestrate hikes.
Threats
Mohamed El-Erian has come out with a defense as to why QE4 is not in the cards. First, he said the Fed is now setto normalize monetary policy, not venture deeper into unchartered territory. Second, unconventional policies haven’tproved as effective as expected in stimulating high and sustainable growth. Third, the origin of the financial marketdislocation is outside the U.S. this time. Last, having exited the third round of easing in a relatively orderly fashion inOctober, the Fed would be hesitant to place itself in the same position again, not only for economic reasons but alsobecause of the political risks involved.RBC cut its gold forecast for the second half of 2015 to $1,125 per ounce from $1,288 per ounce, citing weaknessfrom the expected Fed rate hike and the Chinese yuan.Macquarie says the gains in gold are unlikely to be sustained and investors should remain cautious until the Fedacts. The company cut its 2016 gold forecast to $1,163 per ounce from $1,363 per ounce.
Energy and Natural Resources MarketPage 11, © 2020 Advisor Perspectives, Inc. All rights reserved.

click to enlarge
Strengths
Oil and gas royalty companies led natural resources sub-industries this week, as crude oil made an impressivecomeback after falling below $37 a barrel earlier in the week on global growth concerns. The Yorkville Royalty Oil &Gas Index gained 15 percent on the week.Oil service and equipment stocks also rebounded on the back of strong crude oil prices, after overshooting to thedownside the week prior. The S&P 500 Oil & Gas Equipment & Services Select Industry Index gained 5.4 percentover the prior five days.Canadian energy stocks finished the week off strong due in part to favorable news from the Alberta governmentconcerning the initiation of a panel to review royalty rates for oil and gas production. The S&P/TSX Capped EnergyIndex increased 9.4 percent.
Weaknesses
Gold stocks gave back some gains from last week’s rally following a rebound in the broader equity market later in theweek. The Philadelphia Gold & Silver Index declined 6.4 percent this week.Utilities underperformed this week as global equity markets responded positively to dovish commentary from theFederal Reserve. Fed officials indicated that the bank may not be ready to raise interest rates next month. The S&P500 Utility Index fell 4.35 percent during the week.Iron and steel equities continue to underperform as investors remain fearful of a slowdown in China’s growth. TheBloomberg World Iron & Steel Index fell 3.8 percent this week.
Opportunities
China’s manufacturing purchasing managers’ index (PMI) for the month of August is scheduled to be released nextweek. Signs of stabilization following the government’s initiation of stimulus policies could be bullish for commodities.The release of the U.S. ISM manufacturing figure for August could also positively impact commodities, particularlyfollowing this week’s stronger second-quarter GDP revision.On Monday oil fell nearly two-thirds from last year’s June high to a six-year low of $37.75 a barrel. However, three ofthe last five quarters have exceeded $160 billion in merger and acquisition activity in the space, the highest since thebottom for oil in the late 1990s.
Threats
Crude oil fell below $40 a barrel this week and could fall even further given high inventories and resilient U.S.production. Production remains elevated despite a lower rig count and softer prices.Concern over China’s slowing growth rate remains high. Commodities and related stocks could continue to be volatileover the short-term.The Federal Reserve has all but said for certain that it will raise rates this year. This threatens to boost the U.S. dollarhigher, thus pressuring commodity prices.
Page 12, © 2020 Advisor Perspectives, Inc. All rights reserved.

China RegionStrengths
South Korean equities rallied this week, bouncing sharply after Monday’s selloff. The Korea Stock Exchange KOSPIIndex rose 3.28 percent.Indonesian stocks outperformed this week, rallying after two sharp declines during the prior weeks. The Jakarta StockExchange Composite Index rose 2.54 percent this week.Taiwan stocks rallied this week, despite a larger-than-expected contraction in year-over-year industrial production.The Taiwan Stock Exchange Weighted Index rose 2.98 percent.
Weaknesses
Chinese markets, both mainland and Hong Kong, got hammered this week as the lack of government interventionover the weekend prompted a sharp selloff on Monday. Despite further easing later in the week, the Shanghai StockExchange Composite Index and the Hang Seng Composite Index fell 7.85 and 2.90 percent, respectively.Equities in Singapore fell this week as year-over-year industrial production for the month of July fell more thanexpected. The Straits Times Index fell 0.51 percent this week.Philippine stocks fell this week as second-quarter GDP growth fell slightly short of expectations and the trade balancecontracted sharply for the month of June. The Philippines Stock Exchange PSEi Index fell 2.48 percent this week.
Opportunities
While the Chinese central bank delivered twin cuts this week, in interest rate and reserve ratio for banks, volatility inthe Chinese A-Share market is still hovering around decade highs. Indeed, although the Shanghai Composite Indexfailed to surpass its October 2007 peak in the recent leverage-driven rally, its volatility has certainly surged to newhighs as today’s younger retail investors are more susceptible to rapid-fire decision making on their smartphones atthe same speed as sensational headlines go viral.
Given the near-term unsettled market sentiment and subdued industrial activity due to factory shutdowns inpreparation for next week’s military parade in Beijing, holding higher-than-normal cash should be the most prudentapproach.
click to enlarge
Following the Bank of Thailand’s decision to permit certain investors to invest in foreign assets, the Thai baht fell to asix-year low. The country’s weaker currency should benefit Thai exporters.Given the recent market turmoil, a stronger case can now be made for the Federal Reserve to delay rate hikes untilDecember or until next year. Doing so would be beneficial for emerging markets.
Threats
Malaysia’s foreign exchange reserve fell below $100 billion (USD) in July for the first time since August 2010. With aslumping local currency, accelerating capital outflow, growing fiscal pressure and above all, a real threat of crude oildeclining further, the net energy-exporting country is vulnerable for sustained underperformance within emerging
Page 13, © 2020 Advisor Perspectives, Inc. All rights reserved.

Asia.China’s manufacturing purchasing managers’ index (PMI) will be released next week and is expected to fall from 50to 49.7 percent. With a reading below 50 signaling a contraction, markets could take a dive if the forecasts prove tobe accurate.South Korean data for year-over-year growth in exports in August, as well as industrial production for the month ofJuly, will be released next week. Both sets of data are expected to decline.
Emerging EuropeStrengths
Russia was the best performer among the Emerging Europe countries this week, gaining 9 percent. The superiorperformance of Russian stocks was supported by a strong rebound in Brent oil along with a strengthening ruble.
click to enlarge
The Russian ruble was the strongest currency among the Emerging Europe countries this week, gaining 6.3 percent.The currency rallied after crude prices rose from Monday’s six-year low and concerns eased over a slowdown inChina.Energy was the best performing sector this week supported by crude oil appreciating 17.45 percent.
Weaknesses
Hungary was the weakest performing country this week. Second-quarter GDP came in at 2.7 percent versus the prior3.5 percent. Hungary’s central bank lefts its main interest rate unchanged at 1.35 percent. This low rate should helpto stimulate the economy’s growth.The Hungarian forint was the weakest currency this week, losing 1.8 percent.In a risk-on week, the healthcare sector was the worst performing sector.
Opportunities
A September rate hike by the Federal Reserve may not materialize anymore following the selloff in global stockmarkets. Emerging Europe will benefit if the Fed keeps interest rates at the current lower level as investors pile intomore risky assets.The Czech Republic, Hungary and Poland may be the best places to “hide,” assuming tough market conditionscontinue. Since April 28, when the MSCI Emerging Markets Index peaked, the Czech Republic has been the bestperforming market followed by Hungary and Poland. Central Europe is not dependent on commodities or China, andsince it’s a net importer of crude oil, this area benefits from cheap oil prices.
Page 14, © 2020 Advisor Perspectives, Inc. All rights reserved.

click to enlarge
Russia’s central bank pledged to help cover foreign debt this week. Central Bank Governor Elvira Nabiullina willrenew the 12-month loan program in order to help borrowers with $61 billion of external debt payments over the nextfour months.
Threats
According to the Russian Ministry of Economic Development, if oil trades at $40 per barrel and the dollar is tradingmore than RUB75, Russia will find itself in recession until 2017 and Russian residents will experience a collapse inreal income.Polish bonds outperformed all major emerging markets in the aftermath of China’s yuan devaluation; however,political risk still exists in Poland. Parliamentary elections will take place later this year. The opposition Law & Justiceparty, the party currently leading opinion polls, plans to tax bank assets and increase social spending, puttingpressure on economic growth.It seems there is still no political visibility in Turkey. A snap election is set to take place November 1, and the Turkishlira remains vulnerable to the possible worsening of global sentiment.
(c) US Global Investors
www.usfunds.com
Page 15, © 2020 Advisor Perspectives, Inc. All rights reserved.