Embed Size (px)
Citation preview

Shallow well log and VSP
CREWES Research Report — Volume 19 (2007) 1
Characterizing the near surface with VSP and well logs
Soo-Kyung Miong, Robert R. Stewart and Joe Wong
ABSTRACT Well logs and VSP data were acquired in the Rothney well (05-13-022-03W5), to a
depth of 130 m, near Priddis, Alberta to test their feasibility in characterizing subsurface features. According to qualitative and quantitative analysis of well logs, five porous zones were identified and their porosities range from 0.34 to 0.58. The processed VSP corridor stack resolved these porous zones and correlated reasonably with the 1-D synthetic seismogram and other well logs. The quality of various well logs and VSP data provide considerable promise for the technique’s use in near-surface characterization.
INTRODUCTION Shallow surface seismic surveys have been applied to map bedrock, detect abandoned
coal mine, shallow faults and water saturated zones (Steeples and Miller, 1998). However, these types of survey can have limitations because of lower vertical and horizontal seismic resolution compared to VSP survey: The surface seismic methods can characterize a 30m thick overburden to only one to two layers. Moreover, our test site is located at the Paskapoo formation which is the largest single source of groundwater in the Canadian Praries (Grasby, 2006) - over 100,000 wells out of 600,000 wells in Canadian Praries are located in Paskapoo formation. Therefore, the objective of this study was to test whether the shallow borehole concepts can be used as a tool for characterizing the groundwater resources of the Paskapoo formation as well as to better characterize the rock units that make up the aquifer system.
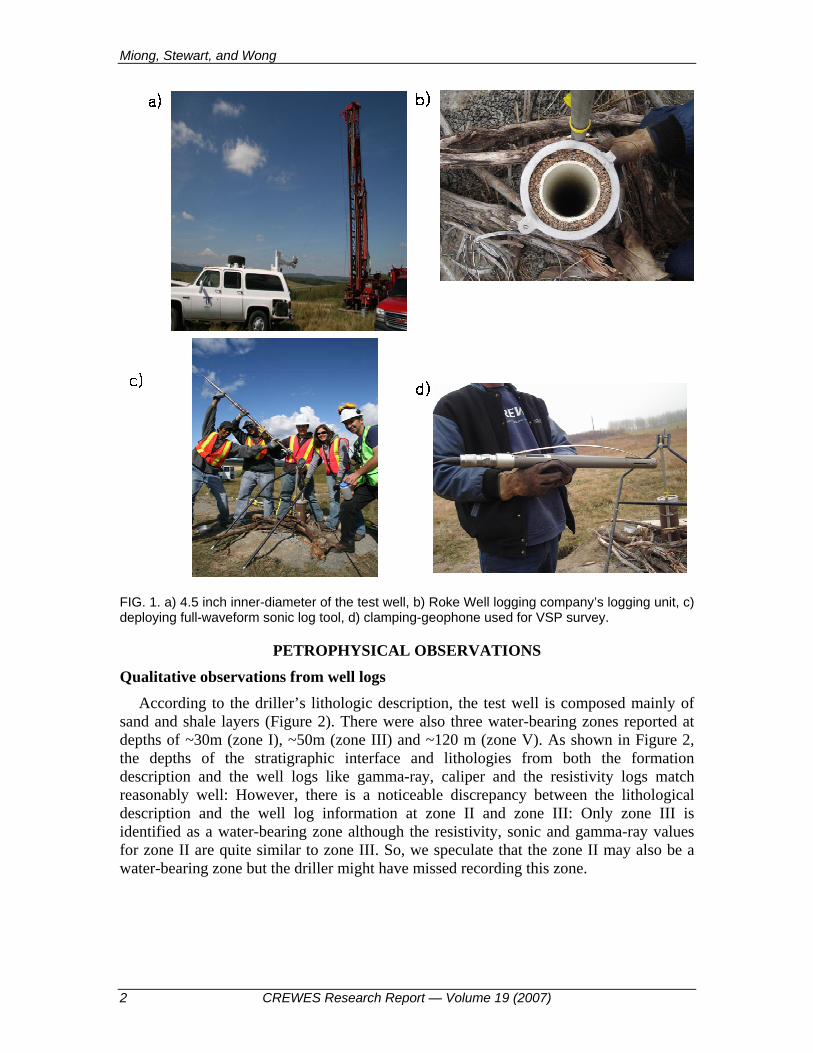
DATA ACQUISITION In the summer of 2007, a test well was drilled in Priddis for CREWES’ research
purposes. Various well log measurements were taken in the open hole (Figure 1a) before the 4.5 inch diameter well was cased (Figure 1b). Some of the major logs include spontaneous-potential, gamma-ray, resistivity, caliper, temperature, density and neutron porosity logs which was acquired by Roke Well Inc. The full-wave form sonic logging tool, which is a property of CREWES, was also deployed in the open hole (Figure 1c). The depth of the well is 130 m and at the time of when the logs were taken the static water level was 30 m. A set of near-zero offset VSP data was also acquired by using sledge hammer as a seismic source and a 3C downhole sonde (Figure 1d).
Miong, Stewart, and Wong
2 CREWES Research Report — Volume 19 (2007)
FIG. 1. a) 4.5 inch inner-diameter of the test well, b) Roke Well logging company’s logging unit, c) deploying full-waveform sonic log tool, d) clamping-geophone used for VSP survey.
PETROPHYSICAL OBSERVATIONS
Qualitative observations from well logs According to the driller’s lithologic description, the test well is composed mainly of
sand and shale layers (Figure 2). There were also three water-bearing zones reported at depths of ~30m (zone I), ~50m (zone III) and ~120 m (zone V). As shown in Figure 2, the depths of the stratigraphic interface and lithologies from both the formation description and the well logs like gamma-ray, caliper and the resistivity logs match reasonably well: However, there is a noticeable discrepancy between the lithological description and the well log information at zone II and zone III: Only zone III is identified as a water-bearing zone although the resistivity, sonic and gamma-ray values for zone II are quite similar to zone III. So, we speculate that the zone II may also be a water-bearing zone but the driller might have missed recording this zone.

Shallow well log and VSP
CREWES Research Report — Volume 19 (2007) 3
FIG. 2. Formation log description recorded insitu while drilling (far left) and well logs acquired from Priddis test well.
Quantitative well log analysis
Based on the sonic log, a total porosity ( scφ ) for five porous zones was calculated while correcting for volume of shale (Vsh) present within sandstone unit (Equation 1-4; also see Table 2). The typical slowness values for sandstone matrix ( matΔ ), shale ( shtΔ ), and water ( wtΔ ) were used for calculating the porosity (Asquith and Krygowski, 2004). The value, tΔ , was picked directly from the P-sonic log.
Although zone I is positioned in the shale to sandstone transition zone, it shows the highest porosity value. This is likely because there is a fracture occurring within this zone as indicated by the large value of caliper measurement.

Miong, Stewart, and Wong
4 CREWES Research Report — Volume 19 (2007)
(1)
maw
mashsh tt
ttΔ−ΔΔ−Δ=φ (2)
maw
ma
tttt
Δ−ΔΔ−Δ
=φ (3)
0100
0
GRGRGRGRVsh −
−= (4)
Table 1. Typical P-slowness values for sandstone matrix, water and shale.
matΔ (us/m) 182
wtΔ (us/m) 656
shtΔ (us/m) 280
Assuming that all porous zones are saturated with water, water saturation of each zone was estimated using Archie’s equation (Archie, 1942). Since the water resistivity varies with borehole temperature, the water resistivity was calibrated according to its formation temperature given resistivity of water (Rw) at 20°C (Rw@TRw=15.4 ohm-m at TRw=20°C; see Equation 5). Using the typical electric constants (i.e. tortuosity factor (a), cementation exponent (m) and saturation exponent (n)), the shale-corrected sonic porosity( scφ ), and the resistivity (Rt) from the log, the water saturation (Sw) is estimated (Equation 6; also see Table 2). The typical tortuosity factor (a) and saturation exponent (n) for clean sandstone units were used for all five zones and they are 0.62 and 2, respectively. The cementation factors (m) for fractured zone (zone I) and rest of the porous zones are 1.7 and 2.15, respectively.
)1(
)1(@@KTFT
KTTRWTRWRWFTRW+
+⋅= , KT1=21.5 C (5)
(6)

Shallow well log and VSP
CREWES Research Report — Volume 19 (2007) 5
Table 2. Porosities and saturation estimated for five porous zones.
As shown in Table 2, the saturation value ranges from 0.12 in zone I to 0.79 in zone V. We expected a water saturation value of ~1 from zones I, III and V as it was specified as the water-bearing zones by the driller. The inaccurate water saturation estimation maybe due to the following reasons: (1) The length of the fracture in zone I is greater than the maximum depth of electric current penetration; the resistivity value for this zone is extremely high and maybe measuring resistivity of air. (2) The electric constants used for the water saturation calculation may have been inappropriate as it is a typical value for sandstone unit at deeper depth (thousands of meters): Appropriate electrical constants for an overburden layer should be investigated. (3) Archie’s equation poses limitation as it tend to give unrealistically large values of water saturation in shaly formations (Asquith and Krygowski, 2004).
PROCESSING ZERO OFFSET VSP DATA The 1.5m offset VSP data was processed to observe whether the porous zones are
resolved in the final corridor stack. The standard processing flow for zero-offset VSP is used to process this data (Figure 4).
From the raw data, bad traces were removed prior to processing (Figure 3) and first arrival times were picked from the raw data. Trace equalization was applied to correct shot strength variation and near surface geology changes. Also spherical divergence was corrected. The down-going wavefields are separated from the pre-processed data using an 11-point-median velocity filter and these wavefields are subtracted from the pre-processed data to obtain up-going, any remains of down-going waves and tube waves. The extracted up-going wavefields were deconvolved to increase the frequency bandwidth and suppress noise, multiple and tube waves. The selection of a good deconvolution operator window size is based on its ability to collapse the down-going energy into a single, band-limited spike. The deconvolution design window was 150 ms with an operator length of 20 ms and 1% pre-whitening. Using the designed deconvolution operator, the up-going wavefields were deconvolved. As shown in Figure 5a and b, the frequency bandwidth in the up-going wavefields is improved after the deconvolution. The corridor, a short interval following the first arrival in an up-going VSP in the two-way-travel time, was defined and the inner corridor was muted (Figure 6a). Corridor stack, which is a summation of some of the traces in up-going VSP, is repeated five times (Figure 6b).

Miong, Stewart, and Wong
6 CREWES Research Report — Volume 19 (2007)
FIG. 3. Raw shot gather of 1.5m offset (pseudo-zero offset) VSP acquired from Priddis test well.
FIG. 4. Processing flow for zero-offset VSP data (Hinds and Kuzmiski, 2006).

Shallow well log and VSP
CREWES Research Report — Volume 19 (2007) 7
FIG. 5. a) Up-going wavefields before deconvolution, b) Up-going wavefields after deconvolution; the yellow box indicates the frequency bandwidth used to generate a zero-phase ormsby wavelet used for 1-D synthetic seismogram.
FIG. 6. a) Corridor mute, b) corridor stack repeated 5 times; both a) and b) are in their two-way-travel times.
SYNTHETIC MODELLING USING SYNGRAM
Based on the frequency bandwidth of the deconvolved up-going, wavefield a zero-phase wavelet was designed (Figure 7a). From the sonic and density log, impedance and reflectivity was estimated (Figure 7b). The reflectivity function and the designed wavelet were convolved to generate 1-D synthetic seismogram in two-way-travel time (Figure 7c). This synthetic seismogram is indexed in depths. Since the start depth of the sonic log was 3.9m, the overburden velocity of 520 m/s was assigned for depths less than 3.9 m. The overburden velocity was estimated from the VSP data using the top receiver-and-offset configuration and its recorded first arrival time. Since the sonic and density log were sampled at different rates and because the density function is quite variable compared to

Miong, Stewart, and Wong
8 CREWES Research Report — Volume 19 (2007)
the sonic log, 1-D synthetic seismogram was generated using the sonic log only where the density value was estimated using Gardner’s equation (Gardner, 1974).
FIG. 7. a) Zero-phase Ormsby wavelet using the frequency bandwidth of [5 15 450 500] Hz (see Figure 6a), b) Impedance and reflectivity were computed based on the density and sonic log, c) 1-D synthetic seismogram generated by convolving the wavelet (a) with the reflectivity (b), d) 1-D synthetic seismogram generated using the sonic log and estimated density function. Y-axis of all logs and seismograms are indexed in depth.

Shallow well log and VSP
CREWES Research Report — Volume 19 (2007) 9
FIG. 8. a) VSP corridor stack (left) and 1-D synthetic seismograms indexed in their two-way-travel time, b) Correlation of 1-D synthetic seismogram with the well logs in their depths.
CORRELATION OF SYNTHETIC, CORRIDOR-STACK AND WELL LOGS As indicated by the blue boxes in Figure 7, the three porous zones (zone I, II, and III)
at depths of 30 m, 40 m, and 55 m should be resolved with a negative trough which indicates significant decrease in velocity and/or density within the zone. These zones are also resolved in the processed VSP corridor stack (Figure 8a). The general wave shape of the corridor stack match reasonably well with the 1-D synthetic seismograms: There is a better match between the VSP seismogram and synthetic seismogram which was generated by using both the density and sonic logs.
There is a slight discrepancy in position of the porous zone in depth of 40 m (or 49 ms in two-way-travel time) between the corridor stack and the 1-D synthetic seismograms. The small discrepancy in travel-times in the synthetic seismogram and a VSP corridor stack can be anticipated because of differences in geometry, source frequencies, trace siginal-to-noise ratios and instrument timing errors. That is why VSP data are frequently used to recalibrate synthetic seismograms before they are correlated to CDP seismic sections (Gochioco, 1998). Moreover, the primary down-going waves and remnant tube wave noise may have not been removed effectively and they are interfering with the up-going primary field.

Miong, Stewart, and Wong
10 CREWES Research Report — Volume 19 (2007)
CONCLUDING REMARKS Well log and VSP surveys were conducted in the Rothney well (05-13-022-03W5) in
Priddis, Alberta to test their feasibility in characterizing subsurface features. According to qualitative and quantitative analysis of well logs, five porous zones were identified and their porosities range from 0.34 to 0.58. VSP corridor stack correlated reasonably well with the synthetic 1-D seismogram and other well logs: The porous zones are characterized in both the shallow VSP corridor stack and well logs. The quality of various well logs and VSP provide considerable promise for the technique’s use in near-surface characterization.
ACKNOWLEDGEMENTS The authors would like to thank Eric Gallant and University of Calgary undergraduate
student for their field support. We would also like to thank all CREWES sponsors, especially Gedco for the use of VISTA for VSP data processing.
REFERENCES Archie, G. E., 1942, The Electrical Resistivity Log as an Aid in Determining Some Reservoir
Characteristics, Petroleum Transactions of the AIME, pp. 144-146. Asquith, G. and Krygowski, D., 2004, Basic Well Log Analysis, second edition, AAPG Methods in
Exploration Series. No. 16. pp. 52-62. Gochioco, L.M., 1998, Shallow VSP worksin the U.S. Appalachian coal basin, Geophysics: 63, No. 3,
p.795-799. Hinds, R. and Kuzmiski, R., 2006, Borehole Geophysics: Theory and Practice, SEG Continuing education. Gardner, G.H.F., Gardner, L. W., and Gregory, A.R., 1974, Formation velocity and density –the diagnostic
basis for stratigraphic traps: Geophysics, 39, 770-780. Grasby, S., 2006,. Paskapoo Formation – Alberta’s most heavily used aquifer: The Fossil Water report, 1,
No. 4, pp.1-3. Steeples G.W. and Miller, R.D., 1998, Avoiding pitfalls in shallow seismic reflection surveys: Geophysics,
63, Issue 4, pp. 1213-1224.