Embed Size (px)
Citation preview

Characterization of the Role of Mcm10 in DNA Replication in
Drosophila melanogaster
by
Ritu Dalia
Director: Dr. Tim W. Christensen Replication of the genome and proper formation, and packaging, of chromatin are
processes essential to eukaryotic life. Maintenance of epigenetic chromatin states is essential
for faithfully reproducing the transcriptional state of the cell; likewise, replication of DNA with
high fidelity is crucial for accurate passage of genetic information from a cell to its progeny.
Defects in DNA replication and improper regulation of the chromatin states can result in
genome instability which can manifest as disease, or death of the organism. There are a
plethora of factors involved in the process of DNA replication in eukaryotes, and recent
studies have shed light on one of the factors called mini-chromosome maintenance 10
(Mcm10) as an essential DNA replication factor. First discovered in S. cerevisiae, Mcm10 is
an abundant nuclear protein that has been implicated in the activation of the Pre-RC,
interacts with members of the elongation machinery such as Polα, and has recently been
shown to be required in the formation of heterochromatin in both yeast and Drosophila.
Previous analysis of two Drosophila Mcm10 mutant alleles demonstrated that Mcm10 not
only plays a role in DNA replication, but also has a role in heterochromatic silencing and
chromosome condensation. With Drosophila melanogaster as a model we further
investigated the roles of Mcm10 by using a collection of over 20 missense mutations
generated via a Tilling approach. Mitotic index data generated using brain cells of these
mutant strains showed no delays in progression through M-phase of cell cycle. Interestingly
though, several aberrant chromosomal phenotypes such as condensation defects,
aneuploidy, anaphase bridge defects, separated sister chromatids and chromosome breaks,
were observed in varying frequencies suggesting that Mcm10 is involved in maintaining
genomic stability. Additionally, the Mcm10 mutant strains showed defects in endoreplication
and packaging of DNA within the nuclei of salivary glands. By understanding the various roles
of Mcm10 we can help elucidate the biological functions of this well conserved protein as well
as provide information on the domains of the protein required for its different biological
functions.


Characterization of the Role of Mcm10 in DNA
Replication in Drosophila melanogaster
A Thesis
Presented to
The Faculty of the Department of Biology
East Carolina University
in Partial Fulfillment
of the Requirements for the Degree
Master of Science in Biology
By
Ritu Dalia
25th November, 2013
Principal Investigator: Dr. Tim Christensen

© Copyright 2013
Ritu Dalia

Characterization of the Role of Mcm10 in DNA
Replication in Drosophila melanogaster
by
Ritu Dalia
APPROVED BY:
DIRECTOR OF THESIS: ________________________________
Tim W. Christensen, Ph.D
COMMITTEE MEMBER: ________________________________
Anthony Caperhart, Ph.D
COMMITTEE MEMBER: ________________________________
Edward Stellwag, Ph.D
COMMITTEE MEMBER: ________________________________
Eli G. Hvastkovs, Ph.D
CHAIR OF THE DEPARTMENT OF BIOLOGY: ______________
Jeff McKinnon, Ph.D
DEAN OF THE GRADUATE SCHOOL:_____________________
Paul J Gemperline, Ph.D

ACKNOWLEDGEMENTS
First and foremost I would like to thank my family for their continued support and
encouragement throughout my academic career, my parents, Rajnikant and Saroj Dalia, my
sister, Bhumi Dalia, and my husband, Ravi Barot. I would like to thank Dr. Tim W.
Christensen for giving me the opportunity to conduct research in his lab and for providing his
continued guidance and support throughout my time at East Carolina University. I would like
to thank my committee members, Dr. Anthony Capehart, Dr. Edward Stellwag and Dr. Eli G.
Hvastkovs for all their feedback and suggestions for my research project. I would like to thank
the members of the Christensen lab (past and present): Michael Reubens for providing all the
clean Mcm10 mutant fly lines for my project, Divya Devdasan for teaching me experiments,
Garrett Ransdell for maintaining my fly lines in my absence, and Jeff Chmielewski, Wayne
Rummings and Nicholas Faulkner for their help in lab activities. I would like to thank Dr.
Elizabeth Ables for her training and assistance in using the LSM 700 Microscope. I would like
to thank Dr. Tom Fink for his assistance with microscopy work as well. I would also like to
thank Dr. Jeff McKinnon, Dr. Terry West, the Department of Biology and the Biology
Graduate Student Association for their support during my time at ECU.
TABLE OF CONTENTS
LIST OF FIGURES……………………………………………………………………..i
LIST OF TABLES……………………………………………………………………...iii
LIST OF ABBREVIATIONS…………………………………………………………..iv
Characterization of the Role of Mcm10 in DNA Replication in
Drosophila melanogaster…………………………………………..……..1
I. INTRODUCTION………………………………………………………..…….…….1
I.1. Stages of a Cell Cycle…………………………………………………………1
I.2. DNA Replication………………………………………………………………..4
I.3. Roles of Mcm10 in Replication……………………………….………………8
I.4. Structure of Mcm10…………………………………………….…………….10
I.5. Endoreplication……………………………………………………………….18
I.6. Other Roles of Mcm10……………………………………………………….21
Objectives of the Research……………………………………………………….24
Preliminary Results…………………………………………………………………28
II. MATERIALS AND METHODS…………………………………………………..30
II.1. Fly husbandry/ stocks………………………………………………………..30
II.2. Prioritization of Mcm10 Mutations………………………………………….30
II.3. Larval Brain Squashes………………………………………………………31

II.4. Microscopy for Brain Squashes…………………………………………….32
II.5. Mitotic Indices………………………………………………………………...32
II.6. Mitotic Chromosome Phenotypes’ Quantitation…………..………………32
II.7. Larval Salivary Gland Acquisition……………………………………..……33
II.8. Fixing Tissue and DAPI Staining……..…………………………………….33
II.9. Preparation and Tissue Mounting……..……………………………………34
II.10. Microscopy for Salivary Glands…………………………...………………34
II.11. Imaging Salivary Gland Whole Mounts………………………….……….34
II.12. Salivary Gland Nuclei Size Analysis……………………………..……….35
II.13. Determining Average Volume of Salivary Gland Nuclei………..………35
II.14. Salivary Gland Nuclei Counts…………..…………………………………36
II.15. Salivary Gland Digestion and DNA Extraction………..…………………36
II.16. Salivary Gland DNA Quantitation…..……………………………………..37
III. RESULTS………………………………………………………………………….38
III.1. Mitotic Index Analysis………..……………………………………………...38
III.2. Phenotypes Associated with Mitotic Figures……………….…….………41
III.3. Quantitation of the Mitotic Chromosome Phenotypes…………...………43
III.4. Endoreplication……………..……………………………………….……….47
IV. DISCUSSION……………………………………………………………………..58
V. REFERENCES…………………………………………………………………….68

i
LIST OF FIGURES
1. Stages of eukaryotic cell cycle…………………………………………….…..2
2. Stages of mitotic phase of eukaryotic cell cycle…………………….…….....4
3. Stages during initiation of DNA replication…………………………………...7
4. Sequence alignment of Mcm10 from multiple species…………………….12
5. Model of DNA and protein interactions with Mcm10……………………….13
6. Structure of Mcm10……………………………………………………………15
7. Sequence alignment of CTD of Mcm10……………………………………..16
8. Model of Mcm10 recruitment to CMG on DNA……………………………..18
9. Schematic of different replication cycles……………………………………19
10. Layout of mutations screened in CTD of Mcm10 in Drosophila…………27
11. PEV analysis of some Mcm10 mutants…………………………………….29
12. Brain squash images from WT and mutant Mcm10………………………39
13. Mitotic index box plot graph…………………………………………………40
14. Mitotic chromosome phenotype images…………………………………...42
15. Bar graph of mitotic chromosome phenotypes……………………………45
16. Salivary gland images from WT and mutant Mcm10……………………..48
17. Bar graph of volume of nuclei relative to WT……………………………...52
18. Bar graph of # of nuclei relative to WT……………………………………..53

ii
19. Bar graph of DNA content/Nuclei relative to WT………………………….55
20. Bar graph of Packing Ratio Relative to WT………………………………..57
21. Summary of defects mapped on CTD of Mcm10…………………………65

iii
LIST OF TABLES
1. List of Mcm10 mutant alleles…………………………………………………26
2. Percentage data of mitotic chromosome phenotypes……………………..46
3. Average values of different components of DNA compaction analyses…49
4. Fold values of genotype averages compared to WT………………………50
5. Summary of data compiled from results of this study……………………..64

iv
LIST OF ABBREVIATIONS
aa…………………………………………………………………………….Amino acid
Cdc6……………………………………………………………….Cell division cycle 6
Cdc7……………………………………..Cell division cycle 7 related protein kinase
Cdc45…………………………………………………………….Cell division cycle 45
CDK……………………………………………………….…Cyclin dependent kinase
Cdt1…………………………………………………………cdc 10 dependent kinase
CMG…………………………………………………………...……Cdc45-Mcm-GINS
Ctf4……………………………………………..Chromosome transmission fidelity 4
CTD…………………………………………………………………C-terminal domain
DAPI……………………………………….…………..4’,6-diamidino-2-phenyllindole
Dbf4………………………………………………………….protein DBF4 homolog A
DDK………………………………………………….….Dbf4-dependant cdc7 kinase
D. melanogaster……………………………………………Drosophila melanogaster
DNA………………………………………………..……………Deoxyribonucleic acid
Dpb11………………………………………………………..…DNA polymerase B 11
dsDNA…………………………………………………………..double-stranded DNA
Dup………………………………………………………….….Double-parked protein
EdU……………………………………………………………….Ethynyl deoxyuridine
G0 phase……………………………………...…………………………..Gap 0 phase
G1 phase………………………………………………………………….Gap 1 phase
G2 phase………………………………………………………………….Gap 2 phase
GINS…………………………………………….……………………….Go-ichi-ni-san
HP1………………………………………………………...Heterochromatin protein 1
HS……………………………………………………………………….High sensitivity

v
ID………………………………………………………………………..Internal domain
KCl………………………………………………………………….Potassium chloride
KH2PO4……………………………………………Potassium dihydrogen phosphate
Mcm2-7………………………..………Minichromosome maintenance proteins 2-7
Mcm10…………………………………...Minichromosome maintenance protein 10
ml…………………………………………………………………………………Milliliter
mM…………………………………………………………………………….Millimolar
mm…………………………………………………………………………….Millimeter
M phase………………………………………………………………….Mitosis phase
μg…………………………………………………………………………….Microgram
μl………………………………………………………………………………..Microliter
μm………………………………………………………………………..….Micrometer
NaCl……………………………………………………………………Sodium chloride
Na2HPO4……………………………………………..Disodium hydrogen phosphate
ng……………………………………………………………………………..Nanogram
Nm………………………………………………………………..………Newton meter
NTD………………………………………………………………....N-terminal domain
ORC……………………………………………………..Origin Recognition Complex
PBS………………………………………………………..Phosphate Buffered Saline
PBX…………………………………….….Phosphate Buffered Saline with Triton-X
PCNA……………………………………………...Proliferating Cell Nuclear Antigen
PCR…………………………………………………...…Polymerase Chain Reaction
PEG…………………………………………………………….….Polyethylene glycol
pg……………………………………………………………………………...Picogram
PIP……………………………………………………..……PCNA interacting peptide
Pol-α………………………………………………..……..DNA polymerase alpha (α)
Pol-δ………………………………………………………..DNA polymerase delta (δ)

vi
Pol-ε……………………………………………..……….DNA polymerase epsilon (ε)
pre-RC…………………………………………………….…pre-Replicative Complex
RecQ4…………………………………………….ATP-dependent DNA helicase Q4
RNA…………………………………………………………………...Ribonucleic acid
RNAi………………………………………………………………….RNA interference
RPA……………………………………………………………...Replication Protein A
rpm…………………………………………………………….Revolutions per minute
S. cerevisiae……………………………….…………….Saccharomyces cerevisiae
Scim 19…………………..………Sensitized chromosome inheritance modifier 19
Sir2……………………………………………………...Silent information regulator 2
SIRT1……………………………………………………...Sir2 homolog in mammals
Sld2……………………………………………………..Synthetic lethal with dpb11 2
Sld3……………………………………………………..Synthetic lethal with dpb11 3
S phase…………………………………………………………….…Synthesis phase
S. pombe……………………………..……………….Schizosaccharomyces pombe
ssDNA…………………………………………………………....single-stranded DNA
WT…………………………………………………………………………….Wild Type
ZnF1……………………………………………………………………….Zinc Finger 1
ZNF2………………………………………………………………………Zinc Finger 2

1
Characterization of the Role of Mcm10 in DNA
Replication in Drosophila melanogaster
I – INTRODUCTION
DNA is one of the key elements required for the growth and survival of any living
organism, which makes replication of the DNA a very crucial process. DNA replication occurs
with very high fidelity to ensure that the genetic information can be passed to daughter cells
in identical copies. Similarly, DNA packaging in a highly condensed state called chromatin is
also very crucial since maintenance of the epigenetic chromatin states is key to maintaining
the transcriptional states of the cell. These transcriptional states then dictate the behavior of a
cell; whether it will be a cancer cell, or a stem cell or a differentiated cell. Thus both DNA
replication and its proper packaging form the foundation of the proper cell behavior.
I. 1. Stages of a Cell Cycle
In order to understand the mechanisms involved in DNA replication it is essential to
know when this event occurs during the cell cycle which is comprised of four phases: Gap1
(G1), Synthesis (S), Gap2 (G2) and Mitosis (M) (Figure 1). When a cell is dormant it remains
in the Gap 0 (G0) phase, also known as the extended G1 phase. In dividing cells the first
phase is the G1 phase where the cell accumulates nutrients to grow and prepare for the
second phase called the Synthesis (S) phase. It is during the S-phase that DNA replication
occurs. The S-phase is important in that mutation or other damage in DNA can have

2
unforeseen consequences on DNA replication. After the S phase, the cell enters the third
phase known as the Gap2 (G2) phase which is when the cell again builds up nutrients to
proceed to the fourth phase called the Mitotic phase. The G2 phase is hypothesized to be
essential in controlling the cell size that is found to be aberrant in certain cancers [Moseley
et al., 2009]. Finally, the cell undergoes division during mitosis, which is when the replicated
DNA is equally distributed and packaged into chromatin in the two daughter cells generated.
Five stages, namely, the prophase, prometaphase, metaphase, anaphase and
telophase comprise the continuous M-phase of the cell cycle (Figure 2). DNA begins to

3
condense at the end of G2 phase, a process that continues during prophase. Additionally,
prophase is marked by formation of spindle fibers that ultimately attach to the centromere of
the sister chromatids during prometaphase. Metaphase is marked by alignment of the
chromatids along the metaphase plate, an imaginary site located roughly in the middle of the
mitotic nucleus. Following this the cell enters anaphase which is when the sister chromatids
are partitioned by the formation of nuclear membrane that begins to divide the preexisting
nucleus into separate nuclei through a process referred to as karyokinesis. In the final stage
of mitosis the separated sister chromatids begin to decondense and become completely
partitioned into two nuclei during telophase stage. Ultimately, the original mother cell divides
by transverse fission through cytokinesis and the two newly formed daughter cells enter G1
phase commencing the cell cycle all over again.

4
I. 2. DNA Replication
Two of the most important events in a cell’s cycle are copying the chromosomal DNA
during S-phase and accurately partitioning the genetic material into daughter cells during
mitosis [Nurse, 2000]. The process of DNA replication can be divided into three crucial steps:
initiation, elongation and termination [Bell et al., 2002]. For the sake of this thesis, I will be
discussing the process of replication only in terms of recognition, licensing, and initiation.

5
In eukaryotic cells, assembly of a protein complex called the replisome commences in
the G1 phase in a highly controlled manner. This replisome machinery is responsible for the
unwinding and the semi-conservative bi-directional replication of DNA. The highly
coordinated process of replication initiates at multiple locations on the chromosomes called
replication origins. These origins get recognized and bound by origin recognition complexes
(ORCs 1- 6) (Figure 3). The ORCs act as binding sites where two clamp loaders, cell division
cycle 6 (cdc6) and cdc10 dependent transcript 1 (cdt1), then load the ring-shaped double
hexameric helicase, minichromosome maintenance (Mcm) proteins Mcm 2-7 onto the
chromatin in an ATP-dependent manner [Remus et al., 2009 and Machida Y et al., 2005].
Mcm 2-7 encircles the DNA duplex and remains inactive during the G1 phase. Once this pre-
replicative complex (pre-RC) has assembled on the ORCs the cell is considered “licensed”
for DNA replication [Sclafani et al., 2007]. This origin licensing ensures that DNA gets
replicated only once during the cell cycle allowing only one S-phase for each cell cycle.
The G1-to-S-phase transition of the cell is triggered by the activation (Figure 3) of
the pre-RC through phosphorylation of Mcm 2-7 helicase by cyclin-dependent kinase (CDK)
and Dbf4-dependent kinase Cdc7 (DDK). In yeast, CDK phosphorylates Sld2 and Sld3 and
facilitates their binding to Dpb11 [Tanaka et al. 2007; Zegerman and Diffley 2007] and DDK
phosphorylates Mcm2 and Mcm4 [Lei et al. 1997; Sheu and Stillman 2006]. One of the first
proteins to be loaded onto the chromatin during the onset of S-phase is Mcm10 which is
important for both activating Mcm 2-7 and recruiting other replisome proteins [Wohlschlegel
et al., 2002]. Mcm10 has been shown to stimulate phosphorylation of Mcm2-7 by DDK and
may play a role in recruiting DDK to the pre-RC [Lee et al. 2003]. Activation of the Mcm
complex leads to the recruitment of two helicase coactivators, Cdc45 and the GINS (go-inchi-
6
ni-san for 5-1-2-3 in Japanese) complex to form the pre-initiation complex (pre-IC). Together,
Cdc45 - Mcm2-7 - GINS form the CMG complex which is the functional helicase that unwinds
the DNA [Moyer S.E. et al., 2006]. The precise unwinding of DNA is carefully timed and
Mcm10 appears to be essential for this crucial step [Wohlschlegel, J.A. et al. 2002; Kanke
M. et al., 2012; van Deursen, F. et al., 2012; Watase G. et al., 2012]. Next, single-stranded
DNA (ssDNA) binding protein replication protein A (RPA) is recruited to the unwound origin
and the replication initiation phase is concluded. Elongation of the DNA requires the
synthesis machinery to begin fork firing. DNA polymerase α (Pol-α) – primase is needed to
begin DNA synthesis by generating RNA primers and short stretches of DNA on both the
leading and lagging strands. Mcm10 along with the cohesion protein And-1/Ctf4 have been
implicated in loading Pol-α onto the chromatin and also facilitating its interaction with Mcm2-7
[Gambus A. et al., 2009; Im J.S. et al., 2009; Lee et al., 2010; Ricke and Bielinsky 2004;
Zhu et al., 2007]. DNA polymerases δ and ε then processively synthesize DNA with the help
of the sliding clamp, proliferating cell nuclear antigen (PCNA).

7
Figure 3. Simplified view of the stages during initiation of DNA
replication. [Du W. et al., 2012].

8
I. 3. Roles of Mcm10 in Replication
There are a plethora of factors involved in the process of DNA replication in
eukaryotes. Recent studies have shed light on one of the essential DNA replication factors
called mini-chromosome maintenance 10 (MCM10). Initially identified as a protein needed for
the stable maintenance of mini-chromosomes in budding yeast Saccharomyces cerevisiae
[Homesley et al.,2000 and Merchant et al., 1997], MCM10 is known to interact with
members of the pre-initiation complex including MCM2-7, ORC, Cdc7 (Cell division cycle 7-
related protein kinase), Dbf4 (protein DBF4 homolog A) and the GINS complex (composed of
Sld5, Psf1, Psf2, and Psf3) [Chmielewski J.P. et al., 2012]. Human Mcm10 (hMcm10)
interacts with chromatin at the G1/S – phase transition and dissociates in G2 phase [Izumi et
al., 2000]. Studies in budding yeast indicate that Mcm10 stimulates phosphorylation of
Mcm2-7 to activate the pre-RC [Lee et al., 2003]. Similar interactions of other Mcm10
orthologues with Mcm2-7 have been reported in Drosophila [Apger et al.,2010], Xenopus
[Zhu et al., 2007], and human [Izumi et al., 2000]. Mcm10 has also been shown to directly
interact with the RecQ4 helicase and aids in its interaction with Mcm 2-7 [Xu et al., 2009].
Once the pre-RC has been activated in the S-phase, synthesis machinery is recruited
to the replication fork. Replication firing requires loading of DNA polymerase (Pol-α) to begin
elongation. Mcm10 along with And-1/Ct4 have been implicated in loading Pol-α on the
chromatin and regulating its stability during replication [Ricke RM et al., 2004, 2006 and
Wang et al.,2010]. Mcm10 also guide’s Pol-α’s physical interaction with Mcm2-7 [Zhu et al.,
2007].

9
Although studies have established that Mcm10 interacts with an array of other
replication proteins, there are several discrepancies about how and when it conducts these
interactions. For instance, initial studies in S. cerevisiae, Schizosaccharomyces pombe (S.
pombe) and Xenopus egg extracts suggested that Mcm10 was loaded on chromatin after
origin licensing but before initiation of replication [Wohlschlegel J.A. et al., 2002; Ricke and
Bielinsky 2004; Gregan J. et al., 2003]. Some studies suggest that Mcm10 plays a role in
the recruitment of the helicase coactivator Cdc45 [Wohlschlegel J.A. et al., 2002; Gregan
J. et al., 2003; Sawyer S.L. et al. 2004] while other in vitro experiments in budding yeast
whole cell extracts show that the CMG complex can be assembled in the absence of Mcm10
[Heller et al., 2011]. There is debate in the literature about when Mcm10 gets loaded onto
chromatin as well. Whether Mcm10 is loaded in late G1 – phase or early S-phase could
depend on whether Mcm10 loading requires DDK or CDK, respectively [Thu Y.M. and
Bielinsky 2013]. Since Mcm10 can bind both ssDNA and double-stranded DNA (dsDNA)
[Eisenberg S. et al., Fien K. et al. 2004; Robertson et al., 2008, 2010; Warren E.M. et al.,
2008], both these scenarios seem possible. However, it is clear that Mcm10 loads onto
chromatin at the G1/S transition and it is around the same time as Cdc45 and GINS are
recruited.
It is also established that Mcm10 is involved in unwinding of DNA replication origin
during replication initiation in Xenopus, S. cerevisiae, and S. pombe [Wohlschlegel J.A. et
al., 2002; Kanke M. et al., 2012; van Deursen, F. et al., 2012; Watase G. et al., 2012].
Mcm10’s role in activating the helicase is subject of considerable interest in the field. CMG
remodeling could be required to facilitate the transition of double hexamer Mcm2-7 on dsDNA
to translocating as mono – hexamer on ssDNA [Gambus A. et al., 2006; Fu Y.V. et al.,

10
2011]. A recent study has for the first time shown a direct physical interaction between
Mcm10 and Cdc45 which is part of the CMG complex [Perna R.D, et al, 2013]. This could
suggest a more direct role of Mcm10 in unwinding DNA. Additionally, in higher eukaryotes
Mcm10 interacts with RecQ4 helicase and regulates its function in an inhibitory manner [Xu
et al., 2009]. Another possibility could also be that Mcm10 helps unwind the DNA indirectly
by stabilizing ssDNA. However, the exact nature of Mcm10’s role in CMG remodeling
remains unclear.
Several studies suggest that Mcm10 migrates with the elongating replication fork by
associating with DNA and DNA polymerases. Recruitment of both Pol-α and Pol-δ in
S.cerevisiae is greatly reduced when Mcm10 is depleted [Heller et al., 2011]. Mcm10 has
also been shown to bind the catalytic subunit, p180, of Pol-α in human cells and is needed for
Pol-α’s association with chromatin [Chattopadhyay and Bielinsky 2007]. Mcm10 stabilizes
Pol-α throughout the cell cycle by preventing its degradation by proteasome [Chattopadhyay
and Bielinsky 2007; Ricke and Bielinsky 2004, 2006; Yang et al., 2005].
I. 4. Structure of Mcm10
More insight into the functionality of Mcm10 depends on an understanding of its
structure. Mcm10 was identified in the same genetic screens in yeast that yielded the first of
the Mcm 2-7 proteins [Merchant et al., 1997]. However, the primary DNA sequence of
Mcm10 is not homologous to that of Mcm2-7 [Liu et al., 2009] but Mcm10 is highly abundant
and evolutionarily conserved in most eukaryotes (Figure 4). The size of Mcm10 ranges from
571 amino acids in yeast to 874 in humans with regions of homology found in the central and
extreme N- and C- terminals [Du W. et al., 2012]. Figure 4 shows the functional homologs of

11
Mcm10 from various species where the central black region containing a zinc-finger is highly
conserved and the gray regions show some conservation. Proteolysis and mass
spectrometry studies show that the full length xMcm10 consists of three structured domains;
the N-terminal domain (NTD), internal domain (ID) and the C-terminal domain (CTD)
[Robertson et al, 2008]. The amino acid sequence alignment of Mcm10 from multiple
eukaryotic species shows that both the NTD and the ID are conserved in the metazoans
suggesting that these regions play a critical role. The CTD as shown in figure 4 is unique to
higher eukaryotes and this region of Mcm10 could have been acquired in metazoans after
their divergence from a common eukaryotic ancestor or lost in the yeast after their divergence
from their common ancestor with metazoans. This suggests that the CTD of Mcm10 could be
required to conduct additional roles in higher eukaryotes that undergo many developmental
changes throughout their life cycle as opposed to the simpler cell to cell growth of yeast.

12
Work from the Christensen laboratory reported a strong yeast one-hybrid interaction
from the first 100 residues of Drosophila Mcm10 [Apger et al., 2010], which suggests that
the N-terminal domain (NTD) might function as an oligomerization domain for the full length
protein. A recent study in Xenopus showed that Mcm10 self associates via a coiled-coil
domain in its N-terminal [Du W. et al., 2013]. The dimerization of NTD (Figure 5c.) could
orient MCM10 in a manner that could facilitate its interaction with both the leading and
lagging strands of DNA at the replication fork. There seems to be some controversy
regarding the potential of Mcm10 to adopt an oligomeric structure. S. cerevisiae Mcm10 has

13
been shown to form large, 800kDa homocomplexes, as many as 12 molecules [Cook C. R.
et al., 2003] while Mcm10 from S. pombe appears to be limited to only monomeric and
dimeric forms [Fien and Hurwitz 2006; Lee et. al., 2003]. Electron microscopy of human
Mcm10 reveals a homohexameric ring structure (Figure 6), the dimensions of which would
allow Mcm10 to physically surround DNA and act in a manner similar to the PCNA sliding
clamp and facilitate interactions with other proteins in the pre-RC [Okorokov et al., 2007].
The hexameric ring structure of Mcm10 resembles that of Mcm 2-7 proteins but lacks the
helicase activity of Mcm 2-7. This suggests that Mcm10 may act as a scaffold protein that
helps co-localize essential replication factors within the replisome during both the initiation
and elongation stages of DNA replication [Du W. et al., 2012].

14

15
The internal domain is the most conserved region of Mcm10 across species from
yeast to vertebrates (Figure 4) [Izumi et al. 2000]. The internal domain consists of a CCCH-
type zinc finger and an oligonucleotide/oligosaccharide binding (OB)-fold that are known to
facilitate Mcm10’s interactions with DNA and other proteins [DU W. et al., 2012]. This
domain has been specifically shown to interact with ssDNA and the N- terminal domain of
Pol-α [Robertson et al., 2008]. Additionally, mutations discovered from yeast genetic
screens and those identified to disrupt scMcm10 association with PCNA and Pol-α, are all
located in the ID [Das- Bradoo et al., 2006; Ricke and Bielinksy 2006]. PCNA interacts

16
with diubiquitinylated Mcm10 in budding yeast [Das-Bradoo et al., 2006] and this region has
been mapped to a PCNA interacting peptide (PIP) region in the ID of Mcm10 (Figure 4).
The CTD of Mcm10 is unique to higher eukaryotes (Figure 4) and consists of a highly
conserved CCCH-type zinc finger (ZF1) and a CCCC-type zinc finger (ZF2) (Figure 7). The
CTD in Xenopus Mcm10 has been shown to bind ssDNA, dsDNA, and Pol-α [Robertson et
al., 2010]. Recent work in Drosophila has shown that Mcm10 interacts directly with Mcm2 via
its CTD [Apger et al., 2010]. Since both the ID and CTD can bind DNA, there could be
multiple ways in which Mcm10 interacts with DNA and other binding proteins such as Pol-α.
Figures 5 a and b are a schematic that represent models that show how the ID could bind
DNA allowing the CTD to bind other proteins or how the CTD could bind DNA allowing the ID
to interact with other proteins. Xenopus Mcm10 ID and CTD together have been shown to
bind DNA with 10-fold greater affinity [Robertson et al., 2008; Warren E.M. et al., 2009]

17
and the catalytic subunit of Pol-α with 15-fold greater affinity, than each domain alone
[Warren E.M. et al., 2009]. The ZnF1 is shown to be the predominant DNA binding site in
the CTD while the ZnF2 does not bind DNA [Robertson et al., 2010]. Additionally, in a
recent study it was shown that the direct physical interaction of Mcm10 with the helicase
coactivator, Cdc45, occurs via its CTD [Perna R.D. et al., 2013]. Figure 8 shows a model
representing the possible mechanism by which Mcm10 could be interacting with DNA and
Cdc45. As shown in this model, Mcm10 binds to ssDNA via the ID and the ZnF1 of the CTD
while the remainder of the CTD binds to Cdc45. This model seems to be consistent with the
other Mcm10 interaction models presented in figure 5. There have been several genetic
studies focusing on the role of the ID of Mcm10 but little work has been conducted on the
CTD. Hence the CTD of Mcm10 is the focus of our research using Drosophila as the model
organism, which will help shed some more light on its functions.

18
I. 5. Endoreplication
Normal eukaryotic replication occurs in a highly controlled fashion only once per
cell cycle, during the S-phase (Figure 1). However, variation in the nature of the cell cycle
and its relationship to the DNA replication cycle exist in different cell types of different. In cells
like those of the ovarian, nurse, and follicle cells of larval tissues in flies and the placental
giant tropoblasts and megakaryocytes in mammals that are polyploidy. Cells accumulate
more than a diploid complement via endoreplication. Endoreplication is a cell cycle variation
that generates a polyploidy genome by repeating rounds of DNA replication in the absence of

19
cell division. There are two forms of endoreplication, namely – endomitosis and endocycling
(Figure 9). During endomitosis cells enter but do not complete mitosis (Figure 9B), while
endocycling cells lack M phase and consist of alternating S and G phases only. The research
in this thesis is directed toward mechanisms related exclusively to endocycling.
Endocycling is a widespread form of endoreplication, which is developmentally
controlled and consists of discrete periods of S-phase and G-phase resulting in cells with a
single polyploidy nucleus [Edger and Orr-Weaver, 2001; Lily and Duronio, 2005]. A key
feature of the endocycle is that DNA content increases by delineated genome doubling. This
is an important distinction from the aberrant process of rereplication which is uncontrolled
continuous reinitiation of DNA synthesis within a given S-phase that does not lead to distinct
genome doubling. Rereplication occurs when the molecular mechanisms controlling the once

20
and only once” firing of replication origins during S-phase are perturbed, leading to genomic
instability, and is a phenomenon observed in many cancers [Lee H.O. et al., 2009].
Many organisms use endoreplication as part of terminal differentiation to generate a
balanced increase in gene dosage above the diploid dose presumably to provide increased
levels of metabolic enzymes to facilitate the acquisition of nutrients and provide a sufficient
quantity of proteins to support the developing egg or embryo. For instance, in Drosophila
females, endoreplication is essential for egg production. Sterility has been seen in nurse and
follicle cells of Drosophila when endoreplication is reduced, suggesting that the endocycle
plays an essential role in oogenesis and development [Lily and Spradling, 1996; Maines et
al., 2004]. Organisms grow either by increasing cell number as in normal cell division cycle or
by increasing cell size as in endoreplication or both. Endoreplication provides a more efficient
mechanism for growth in certain tissues as increasing cell volume consumes less energy
than increasing cell surface area needed for cell division [Kondorosi et al., 2000].
Drosophila and Caenorhabditis elegans larvae growth is mainly driven by endoreplication
[Edgar and Orr-Weaver, 2001].
As discussed earlier, in order to maintain genomic integrity, proliferating cells have
to duplicate the entire genome once, and only once, per cell division cycle. And this is
ensured by the highly controlled and timed assembly of the pre-RC factors onto the origins in
G1 phase and initiation of synthesis during S-phase preventing any reinitiation leading to
aberrant rereplication. Studies in Drosophila have shown that ORC, and MCM4 are
dispensable for endoreplication [Feger G. et al.,1995; Lake C.M. et al. 2007; Park S.Y. and
Asano M., 2008]. By contrast, double-parked protein (Dup)/Cdt1 and minichromosome
maintenance proteins are essential for Endoreplication, which suggests that some

21
components of pre-RC involved in mitotic replication are also involved in initiation during
endoreplication. To investigate whether Mcm10 has a role in endoreplication, salivary glands
in Drosophila were used to see if any Mcm10 gene mutations resulted in chromosome
condensation or replication defects.
I. 6. Other Roles of Mcm10:
Mcm10 is exceptionally abundant in cells with about 40,000 molecules per haploid
yeast cell [Kawasaki et al., 2000]. And studies on Xenopus extracts show that two molecules
of Mcm10 are bound per active origin (i.e. one bound per 5000bp) [Wohlschlegel et al.,
2002], which suggests that Mcm10 is involved in processes other than DNA replication. DNA
replication, chromatin condensation and chromosome segregation are three processes that
require different chromatin states: the active euchromatin and the inactive heterochromatin.
DNA replication factors help regulate these different processes in the chromosome cycle and
defects in their proper coordination is implicated in genomic instability that can result in
cancer [Osborn., 2002]. Mcm10, like ORC, has been shown to interact with Drosophila
heterochromatin protein 1 (HP1) an essential component of the heterochromatin complex
[Shareef et al., 2001 and Pak et al., 1997]. Additionally, Drosophila tissue culture cells that
were depleted in Mcm10 by RNAi could continue to proliferate despite low Mcm10 levels and
this supports the idea that not all Mcm10 molecules are required for DNA replication alone
[Christensen T.W. and Tye, 2003]. Mcm10 has been shown to be important for
transcriptional gene silencing [Apger et al. 2010; Douglas N.L. et al., 2005; Liachko and
Tye 2005, 2009]. Studies in S. cerevisiae demonstrated that Mcm10 is involved in
transcriptional repression of the mating-type loci [Douglas N.L. et al., 2005]. It mediates

22
interactions between the silencing factor Sir2 and subunits of Mcm2-7 helicase via a ~100-
residue segment at its C-terminal Liachko and Tye, 2009].
In a recent study conducted by Apger et. al. using two Mcm10 mutant alleles namely
Mcm10Scim19 (Sensitized Chromosome Inheritance Modifier 19) and Mcm10d08029 multiple
functions of Mcm10 have also been shown in Drosophila. Polytene chromosome analysis of
the salivary glands from the two mutant alleles exibited underreplication in Mcm10d08029
compared to the wild type (WT) and Mcm10Scim19 [Apger et al., 2010]. Visualization of the
brains using ethynyl deoxyuridine (EdU) incorporation showed that the WT brains were larger
than the mutant brains indicating low cell proliferation in the mutants. Additionally, the higher
incorporation of EdU in the mutant brains compared to WT is indicative of an S-phase delay
in the mutants. Lastly, the mitotic index data for the different combinations of the Mcm10d08029
and Mcm10Scim19 with the WT show fewer cells in mitosis compared to the ratios in WT. The
results from this study show that Drosophila Mcm10 has multiple roles in S-phase as well as
roles in heterochromatin formation. Analysis of the two mutant alleles indicates that the S-
phase function of the C-terminal 85aa is separable from the S phase function of the rest of
the protein [Apger et al., 2010]. And additionally, Mcm10’s heterochromatic function does
not require the C-terminal 85aa. It is clear from this study and other literature presented that
Mcm10 is a key player in DNA replication but little is known about its involvement in the
establishment of different chromatin states. In order to better understand the role of Mcm10 in
establishment of different chromatin states during the endoreplication cycle of D.
melanogaster, we examined the effects of different mutant alleles of the D. melanogaster
Mcm10 gene on DNA replication and chromatin formation. Based on the fact that different
alleles of the Mcm10 gene in D. melanogaster appear to have distinct effects on S phase

23
DNA replication and chromatin condensation we hypothesized that “the Drosophila DNA
replication factor Mcm10 has separable functions in DNA replication and chromatin
dynamics.”
In order to study and characterize the role of Mcm10, in chromatin dynamics and
whether these roles are separable from those in DNA replication Drosophila melanogaster
was used as the model organism. Also commonly known as “fruit fly”, Drosophila has been
one of the most studied organisms in biological research, particularly in developmental
biology and genetics. What makes Drosophila an ideal lab study organism is that it has a
short generation (~10 – 14 days at room temperature) and has high fecundity of females. The
entire genome of Drosophila has been sequenced since 2000 and while 50% of fly protein
sequences have mammalian homologs, around 75% of known human disease genes have a
recognizable match in the Drosophila genome. And so using a panel of Mcm10 point mutant
(Table 1) strains I have investigated the effect of these mutants on chromosome morphology
and cell cycle using larval brain tissue and effects on endoreplication using salivary glands.

24
Objectives of the Research
The main goal of this project was to characterize the role of Mcm10 in chromatin
dynamics and DNA endoreplication.
Hypothesis: Drosophila DNA replication factor Mcm10 has
separable functions in DNA replication and chromatin dynamics
Objective # 1: Investigate the impact of MCM10 alleles on cell cycle
and chromosome morphology
Several Mcm10 mutants in Drosophila were identified and/or generated in our lab
and were tested for their impacts on cell cycle progression and chromosome morphology
(Table 1 & Figure 10). 20 non-lethal homozygous mutant alleles of Mcm10 (Table 1) were
used for this project. To investigate the role of Mcm10 in cell cycle progression mitotic index
analysis was conducted in the larval brain tissue. The mitotic index data can provide
information about any Synthesis phase or Mitosis phase delays. Brain squash protocol was
used to look at cell proliferation in the Drosophila larvae. The brain has plentiful amount of
cells that are undergoing a normal cell cycle progression and not endoreplication. If there are
any defects in the length of time to accomplish the cell cycle, such as a delay completing the
Synthesis phase or Mitosis phase, we could detect it. In addition, mitotic figures observed
during the Mitotic index calculation, can be investigated to look at potential defects in

25
segregation and condensation of the chromosomes, providing insight into the impact of
Mcm10 mutants on chromosome morphology.
Objective # 2: To investigate MCM10 alleles’ impact on endoreplication
and DNA compaction
In order to analyze the impact of these mutants on chromosome compaction, DNA
content of salivary glands in the Drosophila nuclei was investigated and the results were
compared with WT Mcm10. During the larval development in Drosophila, the salivary glands
exhibit formation of polytene chromosomes. Polytene cells undergo multiple rounds of DNA
replication, called endoreplication, producing several sister chromatids that stay synapsed
without undergoing any cell division. The nuclei complete 10 successive rounds of replication
by the time they are third instar larva reaching an average ploidy of 1024n [Edgar, 2001].
Endoreplication occurs in the salivary glands in order to produce excess glue required for
pupation. Since there is no mitotic phase, the endoreplication can give information about
replication defects in the S-phase. Mcm10 as discussed earlier is found to associate with
chromatin in S-phase and has an essential role in replication. Hence, an analysis of the DNA
compaction can give further insight into the role of Mcm10 during S-phase.

26
Homozygous allele Mutation
Mcm10 [E381K] Missense
Mcm10 [K406N] Missense
Mcm10 [R415H] Missense
Mcm10 [H431R] Missense
Mcm10 [P439S] Missense
Mcm10 [T441I] Missense
Mcm10 [E451K] Missense
Mcm10 [G461S] Missense
Mcm10 [D473N] Missense
Mcm10 [D473E] Missense
Mcm10 [T518I] Missense
Mcm10 [V520I] Missense
Mcm10 [S530F] Missense
Mcm10 [D532N] Missense
Mcm10 [V551I] Missense
Mcm10 [D608Y] Missense
Mcm10 [I620F] Missense
Mcm10 [deletion 626-628] Deletion
Mcm10 [S629L] Missense
Mcm10 [P692L] Missense
Table 1. List of Mcm10 mutant alleles
assayed for this study.

27

28
Preliminary Results
Initial work on Mcm10 conducted in our lab was to look at the impact of the panel of
Mcm10 point mutations on position effect variegation (PEV). Variegation effect of a
euchromatic gene is caused by the inactivation of a gene in some cells through its abnormal
juxtaposition with heterochromatin [Henikoff S., 1990]. Heterochromatin represses nearby
transcribable genes and this gives rise to different expression levels of the gene from cell to
cell and this is demonstrated by PEV. A classic example of this is the Drosophila white
mottled 4 (Wm4) mutation. Normally, the white gene is expressed in every cell of the adult
Drosophila eye resulting in the red eye phenotype. However in the mutation, an inversion on
the X-chromosome places the white gene next to the pericentric heterochromatin [Henikoff
S., 1990]. As a result expression of the white gene gets repressed and the eye color is
variegated giving a red-white mosaic color resulting in PEV. Heterochromatin protein (HP1)
suppresses this PEV effect allowing the white gene to be expressed to give the red eye
phenotype. PEV analysis was conducted on some of the Mcm10 mutants where the red
pigment in the eyes was measured. The data collected from this analysis showed that many
of the Mcm10 mutant strains (labeled in red) significantly suppressed PEV like HP1 (Figure
11). This suggests that Mcm10 has a role in maintaining heterochromatin formation and
different regions of Mcm10 seem to be responsible in doing so.

29
Figure 11. PEV analysis results of some Mcm10 point mutant alleles.
Majority of the Mcm10 mutants are dominant suppressors of
PEV. Mutants labeled in red significantly suppressed PEV like
HP1 when compared to wild type.

30
II. MATERIALS AND METHODS
II.1 Fly husbandry/stocks:
Our lab had identified several mutant alleles for Mcm10 in Drosophila using literature
search and tilling screens. Fly stocks with these mutant genotypes (Table 1) were obtained
from Zucker stock center and all fly stocks were maintained on Caltech media (U.S.
Biological no. D9600-07) at room temperature. Fly lines of 20 out of 30 of these alleles were
homozygous viable (Table 1) and had been backcrossed a minimum of 8X to a balanced
deficiency that spans the MCM10 region (Df(2L)/CyO, Bloomington stock#7529). Figure 10
represents a layout of all the 20 point mutants in the CTD that were assayed in this study.
These were all ethyl methanesulfonate induced mutations of which 19 were missense point
mutation while 1 was a three amino acid (aa.) deletion mutation. All techniques explained
below have been derived from Apger et al. (2010) and Chmielewski et al. (2011).
II.2 Prioritization of the Mcm10 Mutations
With the help of the software called SIFT (Sorting Tolerant From Intolerant) which
uses sequence homology to predict whether and amino acid substitution will affect protein
function and in turn alter its phenotype [Ng P.C. and Henikoff S., 2003], the 20 mutations in
Mcm10 gene were prioritized for the assays conducted. The software provides a score for the
amino acid substitution and any score below 0.05 is considered intolerant and the substitution
is predicted to affect protein function. 8 out of the 20 Mcm10 mutations used in this study had
a score less than 0.05 and were predicted to have an impact of the function of Mcm10

31
(Figure 10, red asterisks). The remaining mutations were considered tolerant changes by the
software.
MCM10 alleles’ impact on cell cycle and chromosome
morphology
II.3. Larval Brain Squashes:
Third instar wandering larvae were harvested and brains removed, using
DumoxelTM Tweezer #5, in 1% PEG 8000 in 1XPBS (140 mM NaCl, 2.7 mM KCl, 1.4 mM
Na2HPO4, 1.8 mM KH2PO4) pH 7.2 solution. The brains were then transferred to a hypotonic
solution (0.5% Sodium Citrate) for 10 minutes to allow the brain cells to swell. Next, the
brains were transferred to a 11:11:2 Acetic acid, Methanol, Water mixture for 20 seconds to
fix the cells. The brains were then transferred to a clean microscope slide and overlaid with a
siliconized coverslip. The microscope slide and coverslip were sandwiched between filter
paper and an additional microscope slide was then placed in machinist vise and 15 Nm of
force was applied using a digital torque for 2 minutes. After removing the brains from the vice
the slides were dipped in liquid nitrogen for a minute and the coverslip was removed via a
razor blade. The slides were then gently washed with 100% ethanol, allowed to air dry, and
were covered with 7μL of Vectashield containing DAPI (1µg/ml 4',6-diamidino-2-
phenylindole). A coverslip was placed over the slide and sealed with clear Sally Hansen
fingernail polish. Slides were stored at 4°C until imaging.

32
II.4. Microscopy for Brain Squashes:
Microscopy was performed using an Olympus IX81 Motorized Inverted Microscope
with Spinning Disk Confocal. Images were analyzed using Slidebook™ software.
II.5. Mitotic Indices:
For every Mcm10 mutant strain mitotic index determination was performed on 10
larval brain squash preparations by selecting 10 random well populated fields of view for
each using a 60X objective. Total mitotic figures and total number of nuclei for each field
were counted using the counter tool available in Photoshop®. The number of mitotic figures
were divided by the total number of nuclei in each field to generate the fraction of cells in
mitosis. Statistical analysis was performed using Minitab™ Statistical Software.
II.6. Mitotic Chromosome Phenotypes’ Quantitation:
Mitotic figures were counted from each of the 10 pictures from all 10 brain squash
slides per mutant strain and used to calculate the mitotic index described previously. These
mitotic figures were segregated into different phenotypes observed. In order to generate
statistical differences, odds ratio were calculated for mitotic figures representing a phenotype
versus the ones that did not present that phenotype for each category in every Mcm10 strain
using JMP® Pro Statistical DiscoveryTM Software.

33
MCM10 alleles’ impact on DNA Endoreplication and DNA
compaction
II.7. Larval Salivary Gland Acquisition:
Wandering third instar larva were collected from age and density matched bottles and
placed in a 16 well dissecting dish containing 100µl of 1x PBS. Salivary glands were isolated
using DumoxelTM #5 tweezers (Electron Microscopy Sciences, Hatfield, PA). Once salivary
glands were dissected, they were transferred to a separate holding well containing 100µl 1X
PBS.
II.8. Fixing tissue and DAPI Staining:
After acquiring the desired number of salivary glands, glands were transferred into a
new well containing 100µl of 4% formaldehyde in 1X PBX (1x PBS with 1% Triton X-100) and
allowed to incubate for 20 minutes at room temperature. After 20 minutes, the formaldehyde
was carefully removed using a 200μl pipette and 100μl of fresh 1µg/ml 4',6-diamidino-2-
phenylindole (DAPI) solution (diluted from 3µg/ml 100x DAPI stock with 1x PBS) was for 5
minutes in order to stain the DNA. After 5 minute incubation, the dapi solution was removed
from the well and washed twice by adding 100μl in 1X PBX for 5 minutes, followed by one 45
minute wash, and one 10 minute wash at room temperature. During the final 10 minute wash,
slides were prepared as discribed below:

34
II.9. Slide Preparation and Tissue Mounting:
Using a 20cc syringe equipped with a 22 gauge blunt fill needle filled with Vaseline®,
two lines of Vaseline® were dispensed along the width of the slide (Fisherbrand® 25 x 75 x
1.0mm, Cat. No. 22-034-486) about an inch and a half apart. In the space between the two
lines of Vaseline®, 30µl of Vectashield® Mounting Medium (Cat. No. H-1000, Vector
Laboratories, Burlingame, CA) was dispensed along the length of the slide. When the final 10
minute wash was complete, the salivary glands were transferred to the Vectashield®. A
coverslip (Fisherfinest®, 22x50-1, Cat. No. 12-548-5E) was gently placed on top of the slide
being careful to avoid air bubbles. With the coverslip on the slide, the two lines of Vaseline®
were tapped gently to lower the coverslip making sure the entire area between the two lines
of Vaseline® had taken up by Vectashield®.
II.10. Microscopy for Salivary Glands
Microscopy was performed using the Zeiss Laser Scanning Microscope (LSM) 700
along with the Zen imaging Software.
II.11. Imaging Salivary Gland Whole Mounts:
Salivary gland nuclei are three dimensional structures and because of this, it is
necessary to create a three dimensional image using the Z-stack feature of the microscope.
Slides were imaged using 20X magnification. The Z-stack images were created using 10-36
2.0µm steps depending on the thickness of the salivary gland. Salivary glands are also rather
large and take up multiple fields of view requiring a montage to accommodate the entire

35
gland in one image. Using the stitching feature of the Zen software a complete 3-D Maximum
Intensity projection image of salivary gland was created. Each image was acquired using epi-
fluorescence with a DAPI filter. Images were saved as .czi files which were then exported as
.tiff files for analysis using Adobe® Photoshop® elements CS4.
II.12. Salivary Gland Nuclei Size Analysis:
The first step to determining salivary gland nuclei volume was to set the appropriate
parameters in Photoshop®. To account for the difference in pixel length between SlidebookTM
and Photoshop®, the measurement scale in Photoshop® was adjusted. In the measurement
scale setting pixel length was set to 1 and the logical length will be set to 1.595. The wand
tool was used to select individual salivary gland nuclei. With the parameters set, individual
nuclei in a gland were selected and the measurements were recorded. These measurements
were exported as .txt files and transferred into Excel® spreadsheets.
II.13. Determining Average Volume of Salivary Gland Nuclei:
Statistical analysis was performed using Minitab® 14 Statistical Software. The area of
each salivary gland pair nuclei was averaged and data was recorded in an Excel® sheet. The
mean, standard deviation, and standard error of the data was calculated and used to
determine DNA volumes. Using the area of a circle equation ) the area of each data
point was converted into a radius. Next, using the volume of a sphere formula (
3)
values for each radius were converted into volumes. Volume measurements were then
transferred into Minitab® to get statistical analysis data.

36
II.14. Salivary Gland Nuclei Counts:
Using the counter tool available in Photoshop®, nuclei counts were taken from ten
individual salivary glands. The total number of nuclei for each gland pair were then averaged
and recorded in Excel®.
II.15. Salivary Gland Digestion and DNA Extraction:
The salivary glands of third instar wandering larva were dissected in 150µl of HyQ®
Graces’s Unsupplemented Insect Cell Culture Medium (Cat No. 30610.01, HyClone, Logan,
UT) and transferred to a holding well also containing 150µl of Grace’s. Once the desired
number of salivary glands were acquired in the holding well, glands were transferred to PCR
tubes (Fisherbrand®, Cat. No. 14230225) prefilled with 3-5x 1mm glass beads (BioSpec
Products, Inc., Cat. No. 11079110) along with 300 micron glass beads (Sigma®, 212-
300microns Unwashed, Lot. No. 033K1546) and 25µl of squishing buffer (20µg/ml proteinase
K, 10mM Tris-base, 25mM NaCl, and 1mM EDTA). Each tube received one pair of glands.
PCR tubes were then vortexed at max speed for 15 seconds and centrifuged to collect
liquids. PCR tubes were then placed in a thermocycler (C1000TM Thermo Cycler, Biorad®)
and incubated at 37°C for 30 minutes then heated to 85°C for 10 minutes. After incubation, the
PCR tubes were vortexed for 15 seconds and centrifuged at 12,000 rpm for 2 minutes.
Note: At this point extracts were frozen at -20°C until desired number of digestions had
been completed.

37
II.16. Salivary Gland DNA Quantitation:
DNA content values were determined using the Qubit® dsDNA HS Kit (Qubit® dsDNA
HS Assay Kit, InvitrogenTM, Cat. No. Q32854) along with the Qubit 2.0 FluorometerTM
(InvitrogenTM, Cat. No. Q32866). The Qubit® dsDNA HS Kit consists of a highly sensitive dye
that is specific to dsDNA over RNA and common contaminants, such as salts, free
nucleotides, solvents, detergents, or protein are well tolerated in the assay. The Qubit®
working solution was prepared by diluting the Qubit® reagent 1:200 in Qubit® buffer. 190µl of
Qubit® working solution was transferred to Qubit® assay tubes (InvitrogenTM, Cat. No.
Q32856) along with 10µl of salivary gland DNA extract. After Qubit® working solution and
salivary gland DNA extract were loaded, each tube was gently vortexed to mix and spun for
10 seconds to collect liquid at the bottom of each tube. DNA content values were determined
using the Qubit® 2.0 Fluorometer. The Qubit® 2.0 Fluorometer was standardized using two
standard solutions provided in the Quant-iTTM dsDNA HS Kit.

38
III. RESULTS
III.1. Mitotic Index Analysis:
3rd instar brain nuclei and mitotic figures from a collection of the 20 D. melanogaster
Mcm10 gene mutant strains were analyzed. Figure 12 shows images of brain squashes from
WT and a couple of Mcm10 mutant strains, namely, K406N and E451K. The images were
pseudo-colored from blue to green for better visualization. Mitotic indices for all the strains
were calculated based on the number of mitotic figures observed with respect to the total
number of mitotic and non-mitotic nuclei. An average mitotic index value was generated per
brain and the ten averages for each strain were converted into box plots (Figure 13). The
results show that none of the Mcm10 mutant strains had significantly different fraction of cells
in mitosis than in the WT as the p-values were all greater than 0.05.

39
Figure 12. Brain squash images from WT Mcm10 (A,B) and
Mcm10 mutant strains K406N (C), and E451K (D).

40
P692
L
S629
L
3aa de
letio
n
I620
F
D608
Y
V551
I
D532
N
S530
F
V520
I
T518
I
D473
E
D473
N
G461
S
E451
K
T441
I
P439
S
H431
R
R415
H
K406
N
E381
KW
T
0.016
0.014
0.012
0.010
0.008
0.006
0.004
0.002
0.000
Homozygous Mcm10 Mutants
Fra
cti
on
of
Ce
lls
in
Mit
os
is
Figure 13. Mitotic index analysis of the homozygous Mcm10 mutant alleles and their
comparison to wild type (WT) Mcm10. Box plots of the fraction of cells in
mitosis were generated using the Minitab® software and statistical analysis
using students paired t-test. The results show that there was no significant
delay in the progression of cell cycle through M-phase in any of the Mcm10
mutant strains when compared to WT (p values > 0.05). represents the
mean value.

41
III.2. Phenotypes Associated with Mitotic Figures:
In addition to conducting the mitotic index analysis we also examined the
phenotypes of the mitotic figures seen in all the 100 pictures taken per strain (10 images of
10 individual brain squashes). The normal mitotic figure of a somatic cell in Drosophila should
consist of four pairs of chromosomes as shown in Figure 14A. Although the Mcm10 mutant
strains showed no significant delay in progression through the M-phase, several different
mitotic figure defects were observed in the chromosomes. These include phenotypes such as
separated sister chromatids (Figure 14B), chromosome condensation defects (Figure 14C),
chromosome breaks (Figure 14D), anaphase bridge defects (Figure 14E), and aneuploidy
(Figure 14F).

42
Figure 14. Mitotic chromosome phenotypes associated with Mcm10 mutants. (A)
Normal mitotic figure in a somatic cell of Drosophila consists of four
pairs (2n) of chromosomes. (B-F) Mitotic figures observed in the brain
squash images (used for mitotic index calculations) of the Mcm10
mutants show a range of chromosome defects such as separated
sister chromatids, severe condensation defect, chromosome breaks,
defects in anaphase bridge, and aneuploidy.

43
III.3. Quantitation of the Mitotic Chromosome Phenotypes:
Aberrant mitotic figures were observed in each of the Mcm10 mutant strains but in
varying types and levels. And so to further investigate this phenomenon all the mitotic figures
were sorted, from each of the images used to calculate the mitotic index, into the different
defects and their percentages were calculated. Bar graphs were generated to represents the
percentage of normal and defective mitotic figures (Figure 15). Additionally, odds ratios test
was conducted on all phenotypes using the JMP® Pro Statistical DiscoveryTM Software which
generated p-values comparing the WT and mutant strains. However, due to the nature of the
data collected and limitation of statistical tests that could be done, any data with “zero” value
failed to generate statistical values (Table 2). For this reason, since the WT had a zero value
for aneuploidy, we were unable to compare the aneuploidy results from mutant strains and
WT in order to get statistical p-values.
The total number of mitotic figures counted in the different Mcm10 strains ranged
from 30 – 90 figures. The mitotic figures were grouped into six chromosome phenotypes and
their percentages per strain were calculated and arranged to generate a bar graph (Figure
15). These results show that all Mcm10 mutants display significant amounts of defective
mitotic chromosomes. Only values greater than 5% have been displayed on the graph. WT
Mcm10 had about 82% normal mitotic figures while all other mutants (except E381K, p =
0.0552) showed significantly lower levels of normal mitotic chromosomes (blue bars, Figure
15 and p values > 0.05, Table 2). The most common aberrant phenotype observed was a
defect in condensation of the chromosomes (Figure 14C). However, the severity of
condensation defect varied as the mutant strains displayed a range of 19% to 63% (red bar,

44
Figure 15) when compared to wild type. Strains E451K, D473E, V520I, S530F and D532N
do not show significant condensation defects compared to the 10% observed in WT (p-values
> 0.05, Table 2). However, all other mutants displayed high levels of condensation defect
ranging from 25% to 63% (p-values < 0.05, Table 2). It is important to note here that if the
chromatin was not organized into chromosomes as seen in figure 14A, then the defect was
characterized as condensation defect (Figure 14C).
It is interesting to see that apart from condensation defects, different mutations in
Mcm10 led to different levels of other chromosome aberration such as aneuploidy, anaphase
bridge defects, and separated sister chromatids. For instance, P439S and D532N show
highest percentage of aneuploidy (10%, and 24%, respectively), while strains V551I and
P692L along with the wild type display no aneuploidy. Many of the mutant strains showed a
slightly higher defect in anaphase bridges as well (purple bar, Figure 15) compared to other
phenotypes. Only strains E451K and P692L show about 12% anaphase bridge defect which
is significantly higher when compared to WT (p-values = 0.0318 and 0.0450, respectively).
Likewise, a significant proportion of separated sister chromatids was observed only in strain
I620F (11.4%, p-value = 0.0450). The top most bars in Figure 15 represent “other” defects
which were phenotypes that were difficult to assign to existing categories because either the
chromosomes itself were severely defective beyond recognition or it was hard to distinguish
the mitotic figures due to the nature of resolution of the images. However, in addition to all the
phenotypes observed, mutant K406N also showed chromosome with broken arm (Figure
14D) and this was grouped within the “other” defects since chromosome breaks were not
observed in any of the other Mcm10 strains. These results suggest that the Mcm10 mutants

45
examined progress through M-phase comparable to WT. However, they are more prone to
defects in chromatin condensation and chromosome segregation than in WT.
Mcm10 Mutants
Figure 15. Bar graph representing the percentages of normal and defective mitotic
chromosome phenotypes. Values less than 5% are not shown.

46
Mcm10 Strain
Normal Condensat
ion Defect
Aeuploidy Anaphase
Bridge Defect
Separated Sister
Chromatids
Other Defects
WT 82.1% 10.3% 0% 3.85% 2.56% 1.28%
E381K 67.3% (p = 0.0552)
25% (p = 0.0268)*
1.92% 1.92%
(p=0.5216)
1.92% (p = 0.8095)
1.92% (p = 0.7733)
K406N 22.1% (p < 0.0001)*
50.5% (p < 0.0001)*
3.9% 2.6%
(p=0.6587)
7.8% (p = 0.1330)
13% (p = 0.0024)*
R415H 17.6% (p < 0.0001)*
62.6% (p < 0.0001)*
1.09% 8.79%
(p = 0.1843)
4.4% (p = 0.5162)
5.5% (p = 0.1208)
H431R 50% (p = 0.0002)*
38.6% (p = 0.0002)*
0% 0% 4.55%
(p = 0.5628)
6.82% (p = 0.1065)
P439S 35.4%
(p < 0.0001)*
37.5% (p = 0.0001)*
10.4% 4.25
(p = 0.8722)
6.3% (p =0.2783)
6.3% (p = 0.1097)
T441I 43.8% (p < 0.0001)*
34.4% (p =0.0093)*
3.1% 6.3%
(p =0.5931)
3.1% (p = 0.8714)
9.4% (p = 0.0398)*
E451K 52.1% (p < 0.0001)*
19.2% (p = 0.0991)
2.1% 12.8%
(p = 0.0318)*
3.2% (p = 0.8066)
10.6% (p = 0.0067)*
G461S 57.8%
(p = 0.0038)*
33.3% (p = 0.0019)*
4.44% 4.44%
(p = 0.8722) 0% 0%
D473N 46.8% (p < 0.0001)*
36.7% (p < 0.0001)*
5.06% 10.1%
(p = 0.1166)
1.27% (p = 0.5483)
0%
D473E 50% (p < 0.0001)*
19.1% (p = 0.4835)
5.88% 8.82% (0.2102)
8.82% (p = 0.0925)
7.35% (p = 0.0555)
T518I 47.1% (p = 0.0002)*
41.2% (p = 0.0003)*
0% 0% 5.88%
(p = 0.4034)
5.88% (p = 0.1890)
V520I 64.7% (p =0.0059)*
19.1% (p = 0.1028)
0% 11.8%
(p = 0.0795) 0%
4.41% (p = 0.2585)
S530F 47.9% (p < 0.0001)*
19.7% (p = 0.1028)
1.4% 7.1%
(p = 0.3861)
7.1% (p = 0.1918)
17% (p = 0.0003)*
D532N 44.4% (p < 0.0001)*
20.6% (p = 0.0858)
23.8% 4.8%
(p = 0.7894)
1.6% (p = 0.6857)
4.8% (p = 0.2062)
V551I 50% (p = 0.0001)*
26% (p = 0.0204)*
0% 12%
(p = 0.0825)
4% (p = 0.6526)
8% (p = 0.0556)
D608Y 50% (p =0.0011)*
43.3% (p =0.0002)*
0% 3.33%
(p = 0.8984)
3.33% (p = 0.8306)
0%
I620F 50.6% (p < 0.0001)*
22.7% (p = 0.0327)*
2.5% 8.9%
(p = 0.1922)
11.4% (p = 0.0245)*
3.8% (p = 0.3063)
3aa. Del.
(626-228)
41.6% (p < 0.0001)*
44.9% (p < 0.0001)*
1.12% 8.99%
(p = 0.1722)
1.12% (p = 0.4823)
2.25% (p = 0.6354)
S629L 44.6%
(p < 0.0001)*
32.1% (p = 0.0016)*
5.4% 7.1%
(p = 0.4016)
1.8% (p = 0.7611)
9% (p = 0.0320)*
P692L 38.5% (p < 0.0001)*
36.3% (p < 0.0001)*
0% 12.1%
(p = 0.0450)*
7.69% (p = 0.1260)
5.49% (p = 0.1208)
Table 2. Number of mitotic figures converted into percentages within each strains and likelihood odds ratio tests
conducted using actual count of mitotic figures in respective phenotypes. P-values are representative of
phenotype comparisons of Mcm10 mutant strains to WT and were generated using the JMP Pro Statistical
Software. All significant p-values (p < 0.05) are shown in red and denoted with a *. The software was
unable to generate any statistical values for data that had zero mitotic figures in the respective field. Hence
no p-values are provided for aneuploidy since WT had 0%.

47
III.4. Endoreplicaton:
In order to analyze the impact of the Mcm10 mutants on endoreplication, DNA
compaction analyses were conducted on 18 out of the 20 Mcm10 mutants using whole mount
images and the DNA content measurements of the salivary glands. Whole mount images of
salivary glands from WT, H431R, E381K and I620F are shown in figure 16. Five salivary
gland whole mounts were conducted from each Mcm10 strain, and differences were
observed in the volume and the number of nuclei of these glands. Strain E381K showed
abnormal distribution of the nuclei throughout the gland (Figure 16C) compared to the normal
even spacing of nuclei observed in WT (Figure 16A). This kind of uneven spacing of nuclei
was also observed in some glands of strains H431R, T518I, V520I, and S530F (pictures not
shown). As shown in figure 16 the number and volume of nuclei in E381K also seemed less
than in WT. In order to make sense of these differences observed qualitatively, it was
necessary to determine these differences quantitatively as well. Hence, the average
packaging ratios for the DNA content per unit volume in the nuclei was calculated using a
novel method as described in the method and material [Chmielewski J.F. and Christensen
T.W. 2011]. Average values of the different components of the DNA compaction analysis
conducted on the Mcm10 strains have been shown in table 3. Paired t-test comparisons were
conducted on the volume of nuclei, number of nuclei and the DNA content in the gland pair
for each WT and Mcm10 mutant pair and the p-values are shown in table 4.

48
Figure 16. Salivary gland images from WT (A), and Mcm10 mutant strains [H431R]
(B), [E381K] (C) and [I620F] (D).
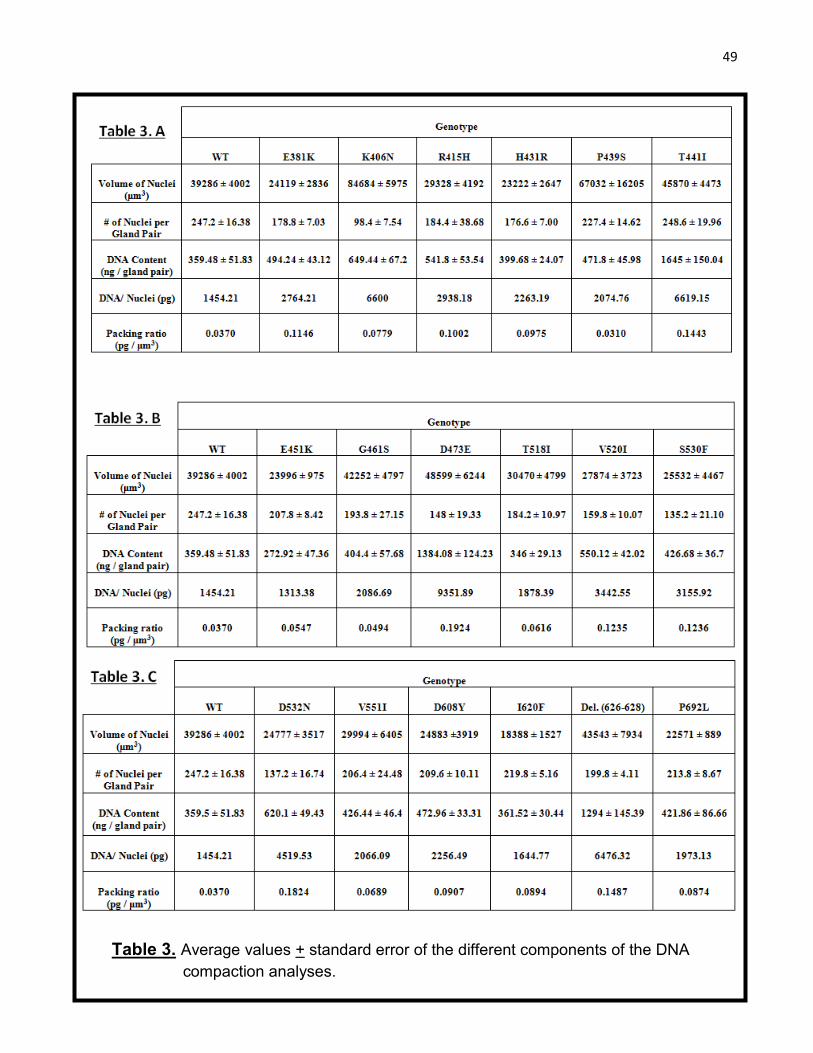
49
Table 3. Average values + standard error of the different components of the DNA
compaction analyses.

50
Fold Relative to WT
Mcm10 Mutant /
Relative to WT
Volume of Nuclei
(μm3)
# of Nuclei per
Gland Pair
DNA Content
(ng / gland pair)
DNA (pg) /
Nuclei
Packing Ratio
(pg / μm3)
E381K 0.61
(p = 0.064)
0.72
(p = 0.029)*
1.38
(p = 0.024)*
1.90 3.10
K406N 2.16
(p = 0.005)*
0.40
(p = 0.002)*
1.81
(p = 0.003)*
4.54 2.11
R415H 0.75
(p = 0.148)
0.75
(p = 0.187)
1.51
(p = 0.027)*
2.02 2.71
H431R 0.59
(p = 0.033)*
0.92
(p = 0.018)*
1.11
(p = 0.484)
1.56 2.63
P439S 1.71
(p = 0.230)
0.92
(p = 0.448)
1.31
(p = 0.127)
1.43 0.84
T441I 1.17
(p = 0.110)
1.01
(p = 0.962)
4.58
(p < 0.000)*
4.55 3.90
E451K 0.61
(p = 0.026)*
0.84
(p = 0.118)
0.76
(p = 0.261)
0.90 1.48
G461S 1.08
(p = 0.692)
0.78
(p = 0.076)
1.12
(p = 0.585)
1.44 1.33
D473E 1.24
(p = 0.086)
0.60
(p = 0.024)*
3.85
(p < 0.000)*
6.43 5.20
T518I 0.78
(p = 0.217)
0.75
(p = 0.060)
0.96
(p = 0.810)
1.29 1.67
V520I 0.71
(p = 0.035)*
0.65
(p = 0.021)*
1.53
(p = 0.017)*
2.37 3.33
S530F 0.65
(p = 0.158)
0.55
(p = 0.004)*
1.19
(p = 0.248)
2.17 3.33
D532N 0.63
(p = 0.075)
0.56
(p = 0.001)*
1.73
(p = 0.001)*
3.11 4.93
V551I 0.76
(p = 0.396)
0.84
(p = 0.252)
1.19
(p = 0.257)
1.42 1.86
D608Y 0.63
(p = 0.107)
0.85
(p = 0.123)
1.32
(p = 0.067)
1.55 2.45
I620F 0.47
(p = 0.005)*
0.89
(p = 0.236)
1.01
(p = 0.975)
1.13 2.41
3aa. Del. (626-
628)
1.11
(p = 0.573)
0.81
(p = 0.079)
3.60
(p < 0.000)*
4.45 4.02
P692L 0.57
(p = 0.025)*
0.87
(p = 0.195)
1.18
(p = 0.576)
1.36 2.36
IV. D
Table 4
Table 4. Fold values of genotypes’ averages relative to wild type averages. Paired t-test
performed to generate p-values using Minitab® software. Significant differences are
represented in red (p < 0.05)*.

51
Using images of the 5 salivary gland whole mounts the volume of nuclei was
calculated as discussed in the materials and methods section and an average volume per
gland pair + standard error is reported in table 3. Next the average values from the each
mutant strain were divided by the average volume from WT which gave a fold number relative
to WT shown in table 4 and figure 17A. The fold values relative to WT are presented as bar
graphs in figure 17A where “1” represents WT value. All significantly different volumes are
represented by dark blue bars with asterisks in figure 17A and the location of the mutations
are highlighted in red (Figure 17B). This graph along with values from table 4 shows that the
volume of nuclei in the Mcm10 mutant strains varied compared to WT such that majority of
the nuclei volumes were lower compared to WT. Strain K406N showed significantly greater
volume of nuclei, over 2 fold compared to WT while other strains like H431R, E451K, V520I
and P692L showed significantly lower volume of nuclei compared to WT.

52
Next the number of nuclei was counted in each of the salivary gland using the 5 whole
mount images. As discussed above the average values from Mcm10 mutant strains relative
to WT were generated (table 4) and the data is represented as bar graphs in figure 18A.
These results showed that the salivary glands from all Mcm10 mutant strains (except T441I)

53
had lower number of nuclei when compared to WT. Of these, strains E381K, K406N, H431R,
D473E, V520I, S530F and D532N showed significantly lower number of nuclei compared to
WT (Table 4 & Figure 18). Additionally, strains K406N, H431R and V520I also showed a
significantly different volume of the nuclei compared to WT.

54
After calculating the volume and the number of nuclei from the salivary glands, next
the average DNA content per nuclei was calculated using the DNA content measured from
the 25 pairs of salivary glands and the values were each divided by values from WT (Tables
3 & 4). The fold values of the DNA content per nuclei relative to WT (table 4) are represented
as bar graphs in figure 19. Interestingly, these results show that the salivary glands from
nearly all Mcm10 mutant strains contained higher levels of DNA content per nuclei compared
to WT. As shown in tables 3 and 4, it was found that the DNA content per nucleus was about
1.5 times to 6.4 times higher in all mutant strains (except strain E451K) than in WT. This
suggests that DNA was over-replicated in the salivary glands of the Mcm10 mutant strains.

55

56
The DNA content per nuclei was divided by the volume of nuclei of the salivary glands
to generate a DNA packing ratio. The results relative to WT are graphed in figure 20. If a
mutant strain showed significant difference in one or more of the three aspects of the DNA
compaction assay, i.e. volume of nuclei, number of nuclei, or DNA content per gland pair, the
packing ratio for that respective mutant strain was considered significantly different compared
to WT (Figure 20, dark blue bars). The results reveal that majority of the Mcm10 mutant
strains showed higher DNA packing ratios compared to WT. Interestingly, the number of
nuclei in most of the mutants was lower than in WT (except T441I), while the volume of these
nuclei varied compared to WT. The high amount of DNA in these strains seems to be packed
more tightly as shown by the high packing ratio values relative to WT. For instance, strain
D473E had a packing ratio nearly 5.2 times higher than WT and a DNA content per nucleus
over 6 times higher than WT. From the data presented in tables 3 and 4 it is evident that
Mcm10 mutant alleles in this study have a significant impact on the replication of DNA during
the S-phase causing over-replication of DNA.

57

58
IV. DISCUSSION
In this study we observed that the larval brain cells in Drosphila show no M-phase
delays but interestingly, all the Mcm10 mutant strains presented with highly defective
chromosomal phenotypes during mitosis. The type of defects which include chromosome
condensation defects, aneuploidy, anaphase bridge defects, separated sister chromatids and
chromosome breaks were all observed in different frequencies in all the mutant strains when
compared to WT. Additionally, analysis of the salivary gland tissues revealed that the DNA
was over-replicated in nearly all Mcm10 mutant strains and this DNA was also packaged
more tightly within each nuclei when compared to WT.
Despite its early discovery along with Mcm 2-7 proteins, Mcm10’s function still
remains unclear. As one of the first proteins to load after pre-RC assembly, Mcm10 is
required for loading downstream proteins and subsequent events in DNA replication initiation.
Work over the past decade has established Mcm10 as an essential DNA replication factor
that is highly conserved among eukaryotes, and that it is shown to interact with several
replication initiation and elongation factors such as ORC [Izumi et al., 2000], Mcm 2-7, Pol-α
[Chattopadhyay et al., 2007 and Ricke et al., 2004, 2006], RecQ4 helicase [Xu et al.,
2009], and And-1 [Zhu et al., 2007]. Three structural domains for Mcm10 have been
established as the NTD, ID and CTD. The coiled-coil helix within the NTD allows Mcm10 to
self-associate [Du W. et al., 2013] and this dimerization of Mcm10 could help facilitate its
interaction with both the leading and the lagging strands of DNA along with other DNA
replication proteins. Mcm10’s interactions with ssDNA and Pol-α have shown to be mediated
by the conserved ID and CTD [Robertson et al., 2008]. A recent study has shown that the

59
binding of Mcm10 to DNA is regulated by a nicotinamide adenine dinucleotide (NAD)-
dependent acetylase, SIRT1in human cells [Fatoba S.T. et al., 2013]. Both the ID and the
CTD of Mcm10 are acetylated in human cells at the lysine residues and some of these get
deacetylated by SIRT1 allowing Mcm10 to bind DNA [Fatoba S.T. et al., 2013]. In addition
to modulating Mcm10 for DNA-binding, deacetylation by SIRT1 could also unprotect lysine
residues that are otherwise ubiquitinated marking Mcm10 for degradation [Fatoba S.T. et al.,
2013]. This regulation of Mcm10’s binding to DNA by SIRT1 is interesting in that despite the
presence of many lysine residues within the NTD, the NTD is not acetylated and is not
involved in DNA binding [Fatoba S.T. et al., 2013]. This reinforces the notion that the CTD of
Mcm10 is crucial in performing additional functions in metazoans and is hence also the site
for Mcm10’s regulation.
Although the highly conserved ID of Mcm10 has been studied extensively, little is
known about the function of the CTD which is an added region unique to higher eukaryotes.
The CTD domain of Mcm10 in Drosophila was investigated in this study by examining the
defects in DNA replication, chromosome segregation and chromosome condensation of the
Mcm10 homozygous mutant strains. Previous work conducted by Apger et al. showed that a
collection of Mcm10 mutants different from those examined in this study, presented with
lower fraction of cells in mitosis compared to WT in the larval brain cells of Drosophila.
Interestingly, no such results were observed in any of the 20 Mcm10 mutant strains used in
our study (Figure 13). Of the 20 mutations in the CTD of Mcm10, strains E451K, D473E and
S530F showed a large variation in the fraction of cells in mitosis. However, none the Mcm10
mutants presented with any significant delays in progression through the M-phase. A reason

60
for this could be that Mcm10 is shown to be proteolysed during G2/M phase [Kaur M. et al.,
2010] and hence the CTD does not affect progression of the M-phase of the cell cycle.
However, the CTD of Mcm10 has been shown to be important in the cell-cycle
regulation of Mcm10. The CTD of human Mcm10 has been shown to contain signals for
Mcm10’s proteolysis during M-phase [Kaur et al., 2010]. M-phase proteolysis of Mcm10 is a
vital mechanism to prevent aberrant initiation of replication. Work by Kaur et al. showed that
cells in prophase, metaphase, anaphase, and telophase appeared to lack Mcm10, while cells
in interphase expressed the Mcm10 protein. And in this study we observed that the larval
brain cells in Drosphila do not show any delays in M-phase.
Based on the results in studies conducted by Xu et al. (2009) it has been shown that
Mcm10 plays an inhibitory role in regulating the helicase activity of RecQ4 in G1 and S
phases. Mcm10 is further required for RecQ4’s interaction with Mcm2-7 and GINS. Its
regulatory role may be controlled by phosphorylation of RecQ4-mediated unwinding of DNA
[Xu et al., 2009]. Hence, is appears that the sequestration of RecQ4 by Mcm10 can prevent
unlicensed initiation of DNA replication by preventing RecQ4-mediated unwinding of DNA.
The regulatory interactions of these two proteins may be reflected in the fact that mutations in
each protein results in at least some related chromosome function defects. Studies
conducted in recq4-deficient mice have shown phenotypes ranging from aneuploidy to slow
cell growth [Hoki et al, 2003; Mann et al, 2005]. Similarly, selected Mcm10 mutant strains in
our study characteristically also show aberrant chromosome phenotypes including
aneuploidy. Mutant strains P439S and D532N showed 10% and 24% aneuploidy
chromosomes, respectively (Figure 15). Based on the correlated phenotypes, one might

61
predict that the sites of these two mutations on Mcm10 could be the regions where RecQ4
may possibly be interacting with Mcm10.
Similarly, chromosome segregation defects such as anaphase bridge defects and
separated sister chromatids were also displayed in the Mcm10 mutants. Mcm10 interacts
with the cohesion protein And-1/Ctf4 and together have to shown to load DNA Pol-α onto the
chromatin [Zhu W. et al., 2007]. Ctf4 mutants in S. cerevisiae exhibit chromosome
missegregation and defects in sister-chromatid cohesion [Hanna et al. 2001; Mayer et al.
2004; Petronczki et al. 2004]. Mcm10 interacts with both RecQ4 and And-1/Ctf4 during the
process of replication in the S-phase and it is possible that these interactions are affected in
the Mcm10 mutants, which could have led to the defective chromosome morphology
observed during M-phase. However, validation of this plausible explanation would require
further investigation.
High levels of condensation defects were also observed in the Mcm10 mutant strains’
brain cells. Since about 10% of mitotic figures in WT were categorized as having
condensation defect (Table 2) it could be that these chromosomes may have been caught
during late G2 phase or early prophase when the chromatin is still in the process of
condensing into chromosomes. Hence, there could be two possibilities as to why we see
significantly higher frequency of condensation defect in all the Mcm10 mutant strains
compared to WT; either, the mitotic figures could have been captured during early prophase
suggesting that there could have been a prolonged prophase stage in the mutants, or Mcm10
could have a bona fide role in packaging of the chromatin during mitosis. In either case, the
high frequency of condensation defects in all of the Mcm10 mutants points to the idea that

62
the CTD of Mcm10 could potentially have roles in the segregation and packaging of
chromosome during M-phase.
In order to investigate the role of Mcm10 in endoreplication and DNA compaction we
conducted experiments using the large polytene salivary glands. We observed that the DNA
content per nucleus was significantly higher in several Mcm10 mutants when compared to
WT (Tables 3 and 4). The DNA content per nucleus in strains K406N, T441I, D473E and the
3aa. deletion was observed to be 4 to 6 times higher than in the nuclei from WT. This clearly
shows that DNA was over-replicated in the salivary glands of Mcm10 mutant strains and
suggests that Mcm10 plays a crucial role in regulating replication of DNA in endocycling cells
as well. Additionally, even though the number and volume of the nuclei varied in these
mutants, the high levels of DNA content resulted in a greater DNA packaging ratio of all
Mcm10 mutants compared to WT. These results are very interesting in that, even though the
DNA content was much higher in the Mcm10 mutant strains, the cells were able to package
all of it in the nuclei. This suggests that either the cells (or nuclei) have considerable excess
of all the constituents of chromatin or that increase in DNA content resulted in increased
production of all the components required for chromatin packaging. In addition to helping
understand some aspects of Mcm10’s role in replication these results could also aid in
understanding the regulatory interactions between DNA and genes required for synthesis of
chromatin constituents. These results suggest that Mcm10 is involved in replication of DNA
even in endocycling cells. Mutation in the CTD of Mcm10 resulted in over-replication of DNA
which in turn resulted in highly compacted packaging of DNA within the nuclei of the salivary
tissue. Studies over the last two decades have shown that while mitotic functions are
repressed in the endocycle, many of the proteins required for DNA replication and the

63
regulation of G1-S phase are shared between the mitotic cycle and the endocycle [Edgar
and Orr-Weaver, 2001; Lee and Orr-Weaver, 2003]. Although needed for replication in cells
undergoing normal cell cycle, orc1 is shown to be dispensable in endoreplication in
Drosophila. However, other essential components such as Dup/cdt1 and Mcm2-7 needed in
replication of normal cells are also required for endoreplication [Park & Asano, 2008]. And in
this study we show that in addition to being an essential DNA replication factor in normal
cells, Drosophila Mcm10 also plays a role in DNA replication in endocycling cells.
Mcm10 is a crucial player in orchestrating the licensing and activation of the pre-RC
during replication initiation. With studies revealing more and more information about the
structure of Mcm10 and its interactions with DNA and other proteins, it is slowly shedding
light on some aspects of the functionality of Mcm10. Mcm10 seems to be a scaffolding
protein that uses different regions of its structure to coordinate interactions with various
proteins and DNA during replication. The self-association through its NTD can allow Mcm10
to interact with both the leading and lagging strands of DNA via binding through its ID and
CTD.

64
Mcm10
Mutant
Strain
Mitotic Chromosome Phenotypes Compared to WT
Salivary Gland DNA Compaction Analysis
Compared to WT
Normal Mitotic Figure
Condensation Defect
Aneuploidy Anaphase Bridge Defect
Separated Sister
Chromatids
Other Defect
Volume of
Nuclei
# of Nuclei
Per Gland pair
DNA Content
Per Gland Pair
DNA Per
Nuclei
Packing Ratio (DNA
Compaction)
E381K - +* + - - + - -* +* + +
K406N -* +* + - + +* +* -* +* + +
R415H -* +* + + + + - - +* + +
H431R -* +* = - + + -* -* + + +
P439S -* +* + + + + + - + + -
T441I -* +* + + + +* + + +* + +
E451K -* + + +* + +* -* - + - +
G461S -* +* + + - - + - + + +
D473N -* +* + + - - n/a n/a n/a n/a n/a
D473E -* + + + + + + -* +* + +
T518I -* +* = - + + - - - + +
V520I -* + = + - + -* -* +* + +
S530F -* + + + + +* - -* + + +
D532N -* + + + - + - -* +* + +
V551I -* +* = + + + - - + + +
D608Y -* +* = - + - - - + + +
I620F -* +* + + +* + -* - + + +
3aa. Del.
(626-628) -* +* + + - + + - +* + +
S629L -* +* + + - +* n/a n/a n/a n/a n/a
P692L -* +* = +* + + -* - + + +
Table 5. Summary of the data compiled from assays performed on all Mcm10 mutants compared to
WT. (-) represents values lower than WT and (+) represents values greater than WT. Significant differences compared to WT are represented in red, (-*) denoted for lower and (+*) denoted for values greater than WT. (=) represents values equivalent to WT. DNA compaction analyses were not performed on strains D473N and S629L and so data values are represented as (n/a).

65
Based on the data from this study we have schematically mapped regions on
the CTD of Drosophila Mcm10 where the various defects in DNA replication and
chromosome morphology were observed during the S- and M-phases of the cell (Figure
21). As depicted in figure 21 and table 5, mutations in different regions of the CTD
manifested different levels and types of defects in chromosome morphology such as
condensation defects, aneuploidy, anaphase bridge defect, and separated sister

66
chromatids. It can be seen that defects in certain regions of the CTD also resulted in
significant over-replication of DNA in endocycling cells, which led to tightly packed DNA.
In addition, previously conducted work on PEV analysis shows that some of the Mcm10
mutant strains (Figure 21, highlighted in yellow) from the collection used in this study
suppress PEV and this suggests that certain regions of the CTD are also involved in
heterochromatin formation.
From the data presented in this study along with the PEV results we show that
the function of Mcm10 in DNA replication and its role in defining chromosome
morphology are separable. For instance, mutant strains E451K, G461S, V551I, D608Y
and I620F show defective chromosome phenotypes but do not show significantly higher
DNA content (Table 5 and Figure 21) showing that roles of Mcm10 are separable. In
addition, mutant strain P692L did not contain significantly over-replicated DNA
compared to WT during S-phase. However, the DNA was packaged more tightly and
severe chromosome condensation defects were observed in this mutant strain. Hence,
it can be inferred from this data that the high frequencies of condensation defects
observed in the mutant strains were a result of Mcm10’s bona fide role in chromatin
packaging and that this defect was not due a prolonged prophase during mitosis.
Furthermore, the result that defects in the CTD of Mcm10 led to over-
replication is quite interesting since endoreplication has been used as a default program
upon mitotic catastrophe in many cancer cells [Storchova and Pellman 2004]. Mcm10
has been found to be frequently over-expressed in many types of cancers and since
Mcm10 partners with RecQ4 and binds to Mcm2-7 complex activating its helicase
activity it suggests that Mcm10 plays a critical role in tumor progression as well [Das M

67
et al., 2013]. Owing to its role critical role in DNA replication along with its possible roles
in maintaining chromatin morphology as shown in this study, Mcm10 presents itself as a
prime target that gets destructed in order to disrupt the replication machinery in cancers.
In conclusion, a summary of our results provide evidence that Mcm10 has roles
in DNA endoreplication, mediation of chromosome morphology, and M-phase
chromosome segregation. Additionally, the involvement of different regions of Mcm10 in
performing these different functions points towards the structural importance of the
unique CTD which has evolved to take on added roles that may be required during the
complex developmental processes of metazoans. Data in this study have helped shed
some more light on additional roles of Mcm10 a protein which is so essential that
aberrant expression of this key replication factor has found its place as one of the top
ten cancer associated proteins [Wu et al., 2012]. Hence, continuing to understand
Mcm10’s role at the molecular level will not just appease the scientific curiosity of
unraveling how yet another protein is involved in carrying out replication and
maintaining other chromatin associated functions but it could also prove to be an
essential target in developing therapeutic drugs in cancer treatment.

68
V. REFERENCES
Apger, Jennifer, et al. "Multiple Functions for Drosophila Mcm10 Suggested through
Analysis of Two Mcm10 Mutant Alleles." Genetics 185.4 (2010): 1151-U44.
Bell, SP, and A. Dutta. "DNA Replication in Eukaryotic Cells." Annual Review of
Biochemistry 71 (2002): 333-74.
Campbell L, N. B. and J. A. Reece. 2002. Biology, 7th Ed. Benjamin Cummings, San
Fransico, CA.
Chang, CC, et al. "Nuclear and Microtubule Dynamics of G(2)/M Somatic Nuclei during
Haploidization in Germinal Vesicle-Stage Mouse Oocytes." Biology of reproduction
70.3 (2004): 752-8.
Chattopadhyay, Sharbani, and Anja-Katrin Bielinsky. "Human Mcm10 Regulates the
Catalytic Subunit of DNA Polymerase-Alpha and Prevents DNA Damage during
Replication." Molecular biology of the cell 18.10 (2007): 4085-95.
Chmielewski, J.P. Henderson L, Smith CM, Christensen TW. “Drosophila Psf2 has a
role in chromosome condensation.” Chromosoma. (2012);121(6):585-96
Chmielewski, J. P., and Tim W. Christensen. “Novel method for determining
chromosome compaction and DNA content of salivary gland nuclei in
Drosophila”. Dros. Inf. Serv. (2011): 94.

69
Christensen, TW, and BK Tye. "Drosophila Mcm10 Interacts with Members of the
Prereplication Complex and is Required for Proper Chromosome Condensation."
Molecular biology of the cell 14.6 (2003): 2206-15.
Cook, CR, et al. "A Novel Zinc Finger is Required for Mcm10 Homocomplex Assembly."
Journal of Biological Chemistry 278.38 (2003): 36051-8.
Das, Mitali, et al. "Over Expression of Minichromosome Maintenance Genes is Clinically
Correlated to Cervical Carcinogenesis." Plos One 8.7 (2013): e69607
Das-Bradoo, S., RM Ricke, and AK Bielinsky. "Interaction between PCNA and
Diubiquitinated Mcm10 is Essential for Cell Growth in Budding Yeast." Molecular
and cellular biology 26.13 (2006): 4806-17.
Di Perna, Roberta, et al. "The Physical Interaction of Mcm10 with Cdc45 Modulates
their DNA-Binding Properties." Biochemical Journal 454 (2013): 333-43.
Douglas, NL, SK Dozier, and JJ Donato. "Dual Roles for MCM10 in DNA Replication
Initiation and Silencing at the Mating-Type Loci." Molecular biology reports 32.4
(2005): 197-204.
Du W, Stauffer ME, Eichman BF. “Structural Biology of Replication Initiation Factor
Mcm10.” Subcell Biochem. (2012):62;197-216.
Du W, Josephrajan A, Adhikary S, Bowles T, Bielinsky AK, and Eichman BF. “Mcm10
self-association is mediated by an N-terminal coiled-coil domain.” Plos One (2013)
70
Edgar, BA, and TL Orr-Weaver. "Endoreplication Cell Cycles: More for Less." Cell 105.3
(2001): 297-306.
Eisenberg, Shlomo, et al. "Novel DNA Binding Properties of the Mcm10 Protein from
Saccharomyces Cerevisiae." Journal of Biological Chemistry 284.37 (2009): 25412-
20.
Fatoba, Samuel T., et al. "Human SIRT1 Regulates DNA Binding and Stability of the
Mcm10 DNA Replication Factor Via Deacetylation." Nucleic acids research 41.7
(2013): 4065-79.
Feger, G., et al. "Dpa, a Member of the Mcm Family, is Required for Mitotic Dna-
Replication but Not Endoreplication in Drosophila." Embo Journal 14.21 (1995):
5387-98.
Fien, K., et al. "Primer Utilization by DNA Polymerase Alpha-Primase is Influenced by its
Interaction with Mcm10p." Journal of Biological Chemistry 279.16 (2004): 16144-53.
Fien, Karen, and Jerard Hurwitz. "Fission Yeast Mcm10p Contains Primase Activity."
Journal of Biological Chemistry 281.31 (2006): 22248-60.
Fox, Donald T., and Robert J. Duronio. "Endoreplication and Polyploidy: Insights into
Development and Disease." Development 140.1 (2013): 3-12.
Fu, Yu V., et al. "Selective Bypass of a Lagging Strand Roadblock by the Eukaryotic
Replicative DNA Helicase." Cell 146.6 (2011): 930-40.

71
Gambus, A., et al. "GINS Maintains Association of Cdc45 with MCM in Replisome
Progression Complexes at Eukaryotic DNA Replication Forks." Nature cell biology
8.4 (2006): 358-U41.
Gillespie, PJ, and T. Hirano. "Scc2 Couples Replication Licensing to Sister Chromatid
Chromatid in Xenopus Egg Extracts." Current Biology 14.17 (2004): 1598-603.
Gregan, J., et al. "Fission Yeast Cdc23/Mcm10 Functions After Prereplicative Complex
Formation to Promote Cdc45 Chromatin Binding." Molecular biology of the cell 14.9
(2003): 3876-87.
Hanna, JS, et al. "Saccharomyces Cerevisiae CTF18 and CTF4 are Required for Sister
Chromatid Cohesion." Molecular and cellular biology 21.9 (2001): 3144-58.
Heller, Ryan C., et al. "Eukaryotic Origin-Dependent DNA Replication in Vitro Reveals
Sequential Action of DDK and S-CDK Kinases." Cell 146.1 (2011): 80-91.
Henikoff S. “Position-effect Variegation After 60 Years.” Trends in Genetics. 12
(1990):422-6.
Hoki, Y., et al. "Growth Retardation and Skin Abnormalities of the Recq/4-Deficient
Mouse." Human molecular genetics 12.18 (2003): 2293-9.
Homesley, L., et al. "Mcm10 and the MCM2-7 Complex Interact to Initiate DNA
Synthesis and to Release Replication Factors from Origins." Genes & development
14.8 (2000): 913-26.

72
Im, Jun-Sub, et al. "Assembly of the Cdc45-Mcm2-7-GINS Complex in Human Cells
Requires the Ctf4/And-1, RecQL4, and Mcm10 Proteins." Proceedings of the
National Academy of Sciences of the United States of America 106.37 (2009):
15628-32.
Izumi, M., et al. "The Human Homolog of Saccharomyces Cerevisiae Mcm10 Interacts
with Replication Factors and Dissociates from Nuclease-Resistant Nuclear
Structures in G(2) Phase." Nucleic acids research 28.23 (2000): 4769-77.
Kanke, Mai, et al. "Mcm10 Plays an Essential Role in Origin DNA Unwinding After
Loading of the CMG Components." Embo Journal 31.9 (2012): 2182-94.
Kaur, Manpreet, et al. "Mcm10 Proteolysis Initiates before the Onset of M-Phase." Bmc
Cell Biology 11 (2010): 84.
Kawasaki, Y., S. Hiraga, and A. Sugino. "Interactions between Mcm10p and Other
Replication Factors are Required for Proper Initiation and Elongation of
Chromosomal DNA Replication in Saccharomyces Cerevisiae." Genes to Cells 5.12
(2000): 975-89.
Kondorosi, E., F. Roudier, and E. Gendreau. "Plant Cell-Size Control: Growing by
Ploidy?" Current opinion in plant biology 3.6 (2000): 488-92.
Lake, Cathleen M., et al. "A Genetic Analysis of the Drosophila mcm5 Gene Defines a
Domain Specifically Required for Meiotic Recombination." Genetics 176.4 (2007):
2151-63.

73
Lee, Chanmi, et al. "Alternative Mechanisms for Coordinating Polymerase Alpha and
MCM Helicase." Molecular and cellular biology 30.2 (2010): 423-35.
Lee, Hyun O., Jean M. Davidson, and Robert J. Duronio. "Endoreplication: Polyploidy
with Purpose." Genes & development 23.21 (2009): 2461-77.
Lee, JK, YS Seo, and J. Hurwitz. "The Cdc23 (Mcm10) Protein is Required for the
Phosphorylation of Minichromosome Maintenance Complex by the Dfp1-Hsk1
Kinase." Proceedings of the National Academy of Sciences of the United States of
America 100.5 (2003): 2334-9.
Lee, LA, and TL Orr-Weaver. "Regulation of Cell Cycles in Drosophila Development:
Intrinsic and Extrinsic Cues." Annual Review of Genetics 37 (2003): 545-78.
Lei, M., et al. "Mcm2 is a Target of Regulation by Cdc7-Dbf4 during the Initiation of DNA
Synthesis." Genes & development 11.24 (1997): 3365-74.
Liachko, I., and BK Tye. "Mcm10 is Required for the Maintenance of Transcriptional
Silencing in Saccharomyces Cerevisiae." Genetics 171.2 (2005): 503-15.
Liachko, Ivan, and Bik K. Tye. "Mcm10 Mediates the Interaction between DNA
Replication and Silencing Machineries." Genetics 181.2 (2009): 379-91.
Lilly, MA, and RJ Duronio. "New Insights into Cell Cycle Control from the Drosophila
Endocycle." Oncogene 24.17 (2005): 2765-75.

74
Lilly, MA, and AC Spradling. "The Drosophila Endocycle is Controlled by Cyclin E and
Lacks a Checkpoint Ensuring S-Phase Completion." Genes & development 10.19
(1996): 2514-26.
Liu, Yuan, Thomas A. Richards, and Stephen J. Aves. "Ancient Diversification of
Eukaryotic MCM DNA Replication Proteins." Bmc Evolutionary Biology 9 (2009): 60.
Machida, YJ, JL Hamlin, and A. Dutta. "Right Place, Right Time, and Only Once:
Replication Initiation in Metazoans." Cell 123.1 (2005): 13-24.
Maines, JZ, et al. "Drosophila dMyc is Required for Ovary Cell Growth and
Endoreplication." Development 131.4 (2004): 775-86.
Mann, MB, et al. "Defective Sister-Chromatid Cohesion, Aneuploidy and Cancer
Predisposition in a Mouse Model of Type II Rothmund-Thomson Syndrome." Human
molecular genetics 14.6 (2005): 813-25.
Mayer, ML, et al. "Identification of Protein Complexes Required for Efficient Sister
Chromatid Cohesion." Molecular biology of the cell 15.4 (2004): 1736-45.
Merchant, AM, et al. "A Lesion in the DNA Replication Initiation Factor Mcm10 Induces
Pausing of Elongation Forks through Chromosomal Replication Origins in
Saccharomyces Cerevisiae." Molecular and cellular biology 17.6 (1997): 3261-71.
Moseley, James B., et al. "A Spatial Gradient Coordinates Cell Size and Mitotic Entry in
Fission Yeast." Nature 459.7248 (2009): 857-U8.

75
Moyer, Stephen E., Peter W. Lewis, and Michael R. Botchan. "Isolation of the
Cdc45/Mcm2-7/GINS (CMG) Complex, a Candidate for the Eukaryotic DNA
Replication Fork Helicase." Proceedings of the National Academy of Sciences of the
United States of America 103.27 (2006): 10236-41.
Nurse, P. "A Long Twentieth Century of the Cell Cycle and Beyond." Cell 100.1 (2000):
71-8.
Okorokov, Andrei L., et al. "Hexameric Ring Structure of Human MCM10 DNA
Replication Factor." EMBO reports 8.10 (2007): 925-30.
Osborn, A. J., S. J. Elledge, and L. Zou. "Checking on the Fork: The DNA-Replication
Stress-Response Pathway." Trends in cell biology 12.11 (2002)
Pauline C. Ng and Henikoff S. “SIFT: predicting amino acid changes that affect protein
function.” Nucleic Acids Research, 31.13 (2003): 3812-14.
Park, So Young, and Maki Asano. "The Origin Recognition Complex is Dispensable for
Endoreplication in Drosophila." Proceedings of the National Academy of Sciences of
the United States of America 105.34 (2008): 12343-8.
Petronczki, M., et al. "Sister-Chromatid Cohesion Mediated by the Alternative RF-C-
Ctf18/(Dcc1)/(Ctf8), the Helicase Chl1 and the Polymerase-Alpha-Associated
Protein Ctf4 is Essential for Chromatid Disjunction during Meiosis II." Journal of cell
science 117.16 (2004): 3547-59.

76
Remus, Dirk, et al. "Concerted Loading of Mcm2-7 Double Hexamers Around DNA
during DNA Replication Origin Licensing." Cell 139.4 (2009): 719-30.
Ricke, RM, and AK Bielinsky. "A Conserved Hsp10-Like Domain in Mcm10 is Required
to Stabilize the Catalytic Subunit of DNA Polymerase-Alpha in Budding Yeast."
Journal of Biological Chemistry 281.27 (2006): 18414-25.
Ricke, RM, and AK Bielinsky. "Mcm10 Regulates the Stability and Chromatin
Association of DNA Polymerase-Alpha." Molecular cell 16.2 (2004): 173-85.
Robertson, Patrick D., et al. "Solution NMR Structure of the C-Terminal DNA Binding
Domain of Mcm10 Reveals a Conserved MCM Motif." Journal of Biological
Chemistry 285.30 (2010).
Robertson, Patrick D., et al. "Domain Architecture and Biochemical Characterization of
Vertebrate Mcm10." Journal of Biological Chemistry 283.6 (2008)
Sawyer, S. L., et al. "Mcm10 and Cdc45 Cooperate in Origin Activation in
Saccharomyces Cerevisiae." Journal of Molecular Biology 340.2 (2004): 195-202.
Sclafani, R. A., and T. M. Holzen. "Cell Cycle Regulation of DNA Replication." Annual
Review of Genetics 41 (2007): 237-80.
Sheu, Yi-Jun, and Bruce Stillman. "Cdc7-Dbf4 Phosphorylates MCM Proteins Via a
Docking Site-Mediated Mechanism to Promote S Phase Progression." Molecular
cell 24.1 (2006): 101-13.

77
Storchova, Z., and D. Pellman. "From Polyploidy to Aneuploidy, Genome Instability and
Cancer." Nature Reviews Molecular Cell Biology 5.1 (2004): 45-54.
Takahashi, TS, et al. "Recruitment of Xenopus Scc2 and Cohesin to Chromatin
Requires the Pre-Replication Complex." Nature cell biology 6.10 (2004): 991
Tanaka, Seiji, et al. "CDK-Dependent Phosphorylation of Sld2 and Sld3 Initiates DNA
Replication in Budding Yeast." Nature 445.7125 (2007): 328-32.
Thu, Yee Mon, and Anja-Katrin Bielinsky. "Enigmatic Roles of Mcm10 in DNA
Replication." Trends in biochemical sciences 38.4 (2013): 184-94.
van Deursen, Frederick, et al. "Mcm10 Associates with the Loaded DNA Helicase at
Replication Origins and Defines a Novel Step in its Activation." Embo Journal 31.9
(2012): 2195-206.
Wang, Jiafeng, et al. "Ctf4p Facilitates Mcm10p to Promote DNA Replication in Budding
Yeast." Biochemical and biophysical research communications 395.3 (2010): 336-
41.
Warren, Eric M., et al. "Structural Basis for DNA Binding by Replication Initiator
Mcm10." Structure 16.12 (2008): 1892-901.
Warren, Eric M. y., et al. "Physical Interactions between Mcm10, DNA, and DNA
Polymerase Alpha." Journal of Biological Chemistry 284.36 (2009): 24662-72.

78
Watase, George, Haruhiko Takisawa, and Masato T. Kanemaki. "Mcm10 Plays a Role
in Functioning of the Eukaryotic Replicative DNA Helicase, Cdc45-Mcm-GINS."
Current Biology 22.4 (2012): 343-9.
Wohlschlegel, JA, et al. "Xenopus Mcm10 Binds to Origins of DNA Replication After
Mcm2-7 and Stimulates Origin Binding of Cdc45." Molecular cell 9.2 (2002): 233-40.
Wu C. et al., “Integrating gene expression and protein-protein interaction network to
prioritize cancer-associated genes.” BMC Bioinformatics.( 2012):13; 182.
Xu, Xiaohua, et al. "MCM10 Mediates RECQ4 Association with MCM2-7 Helicase
Complex during DNA Replication." Embo Journal 28.19 (2009): 3005-14.
Zegerman, Philip, and John F. X. Diffley. "Phosphorylation of Sld2 and Sld3 by Cyclin-
Dependent Kinases Promotes DNA Replication in Budding Yeast." Nature 445.7125
(2007): 281-5.
Zhu, Wenge, et al. "Mcm10 and and-1/CTF4 Recruit DNA Polymerase Alpha to
Chromatin for Initiation of DNA Replication." Genes & development 21.18 (2007):
2288-99.