Embed Size (px)
Citation preview
Characterisation of Small Electrode HPGeDetectors
Carl Unsworth, University of Liverpool
7 September 2017
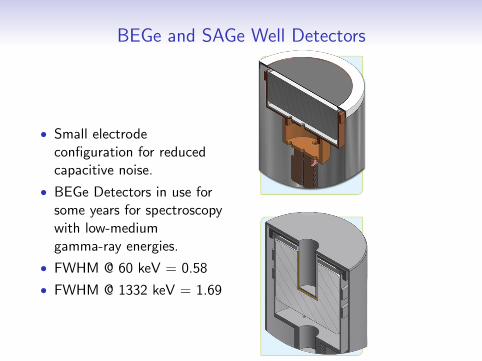
BEGe and SAGe Well Detectors
• Small electrodeconfiguration for reducedcapacitive noise.
• BEGe Detectors in use forsome years for spectroscopywith low-mediumgamma-ray energies.
• FWHM @ 60 keV = 0.58
• FWHM @ 1332 keV = 1.69
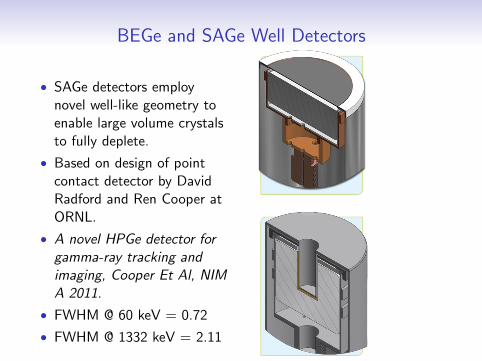
BEGe and SAGe Well Detectors
• SAGe detectors employnovel well-like geometry toenable large volume crystalsto fully deplete.
• Based on design of pointcontact detector by DavidRadford and Ren Cooper atORNL.
• A novel HPGe detector forgamma-ray tracking andimaging, Cooper Et Al, NIMA 2011.
• FWHM @ 60 keV = 0.72
• FWHM @ 1332 keV = 2.11
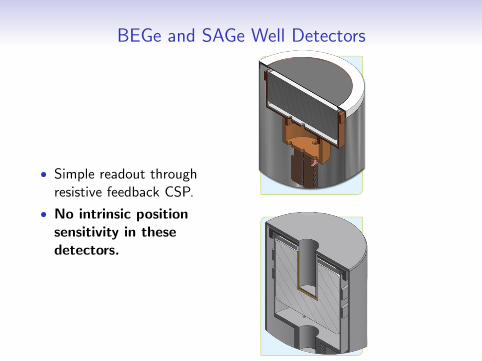
BEGe and SAGe Well Detectors
• Simple readout throughresistive feedback CSP.
• No intrinsic positionsensitivity in thesedetectors.
Goals of This Work
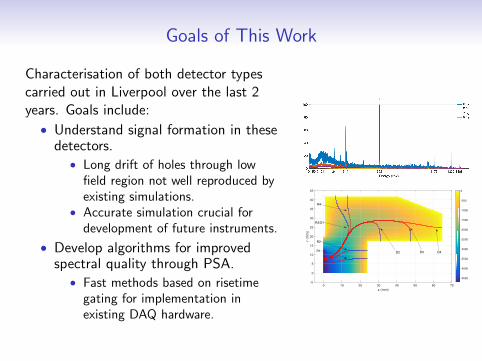
Characterisation of both detector typescarried out in Liverpool over the last 2years. Goals include:
• Understand signal formation in thesedetectors.
• Long drift of holes through lowfield region not well reproduced byexisting simulations.
• Accurate simulation crucial fordevelopment of future instruments.
• Develop algorithms for improvedspectral quality through PSA.
• Fast methods based on risetimegating for implementation inexisting DAQ hardware.
0 10 20 30 40 50 60 70
z (mm)
-5
0
5
10
15
20
25
30
35
40
45
r (m
m)
-4500
-4000
-3500
-3000
-2500
-2000
-1500
-1000
-500
0
R1
R2
R3/D1
R4
D2 D3 D4
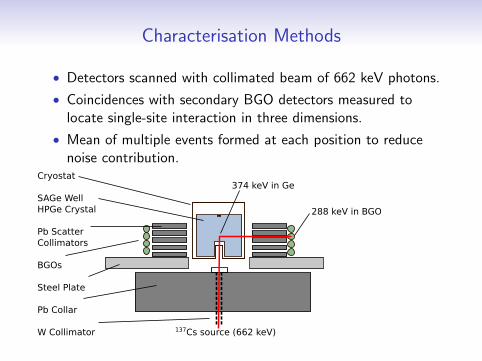
Characterisation Methods
• Detectors scanned with collimated beam of 662 keV photons.
• Coincidences with secondary BGO detectors measured tolocate single-site interaction in three dimensions.
• Mean of multiple events formed at each position to reducenoise contribution.
137Cs source (662 keV)
374 keV in Ge
288 keV in BGO
Cryostat
SAGe Well
HPGe Crystal
Pb Scatter
Collimators
BGOs
Steel Plate
Pb Collar
W Collimator
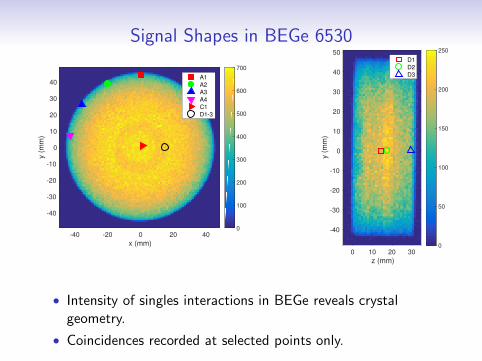
Signal Shapes in BEGe 6530
-40 -20 0 20 40
x (mm)
-40
-30
-20
-10
0
10
20
30
40
y (
mm
)
0
100
200
300
400
500
600
700
A1
A2
A3
A4
C1
D1-3
0 10 20 30
z (mm)
-40
-30
-20
-10
0
10
20
30
40
50
y (
mm
)
0
50
100
150
200
250
D1
D2
D3
• Intensity of singles interactions in BEGe reveals crystalgeometry.
• Coincidences recorded at selected points only.
Signal Shapes in BEGe 6530
-200 0 200 400 600 800 1000
Time (ns)
-200
0
200
400
600
800
1000
1200
Charg
e (
arb
)
A1
A2
A3
A4
C1
D1
D2
D3
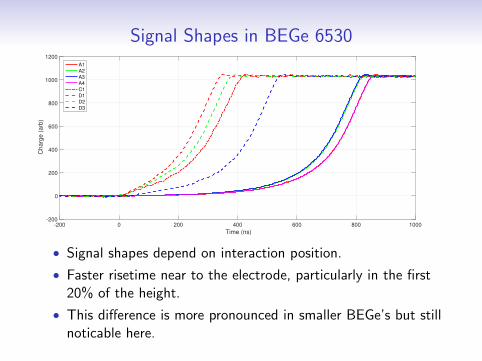
• Signal shapes depend on interaction position.
• Faster risetime near to the electrode, particularly in the first20% of the height.
• This difference is more pronounced in smaller BEGe’s but stillnoticable here.
Gamma-ray Interactions
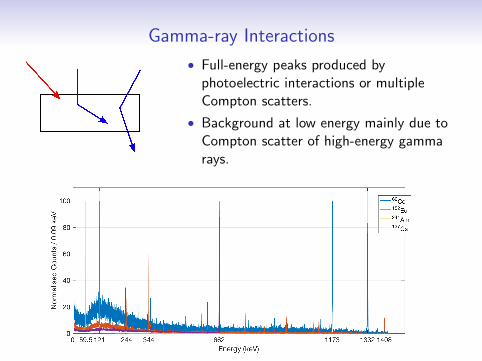
• Full-energy peaks produced byphotoelectric interactions or multipleCompton scatters.
• Background at low energy mainly due toCompton scatter of high-energy gammarays.
Gamma-ray Interactions
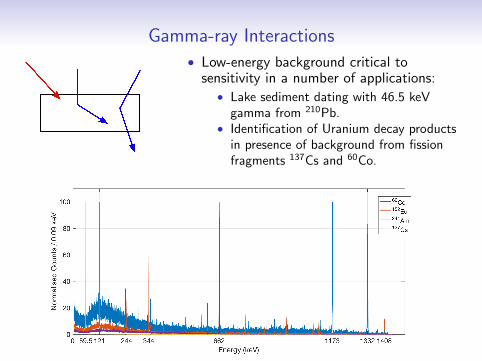
• Low-energy background critical tosensitivity in a number of applications:
• Lake sediment dating with 46.5 keVgamma from 210Pb.
• Identification of Uranium decay productsin presence of background from fissionfragments 137Cs and 60Co.
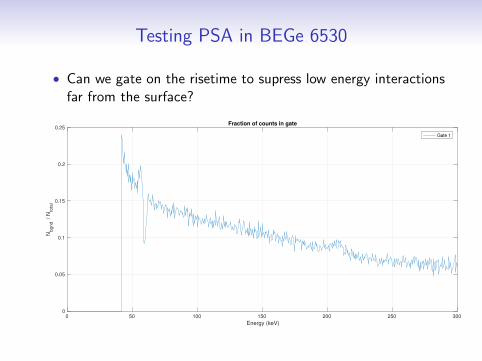
Testing PSA in BEGe 6530
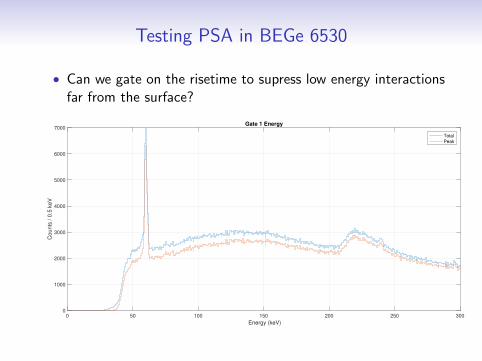
• Can we gate on the risetime to supress low energy interactionsfar from the surface?
0 50 100 150 200 250 300
Energy (keV)
0
1000
2000
3000
4000
5000
6000
7000
Counts
/ 0
.5 k
eV
Gate 1 Energy
Total
Peak
Testing PSA in BEGe 6530
• Can we gate on the risetime to supress low energy interactionsfar from the surface?
0 50 100 150 200 250 300
Energy (keV)
0
0.05
0.1
0.15
0.2
0.25
Nbgnd
/ N
tota
l
Fraction of counts in gate
Gate 1
Testing PSA in BEGe 6530
-5 0 5 10 15 20 25 30 35 40
z (mm)
-5
0
5
10
15
20
25
30
35
40
45
50
r (m
m)
0
500
1000
1500
2000
2500
3000
3500
4000
A1-4
D1
D2
D3
C1
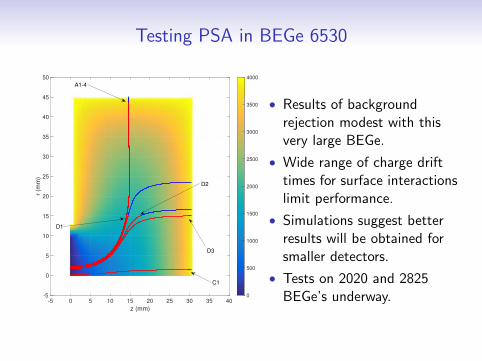
• Results of backgroundrejection modest with thisvery large BEGe.
• Wide range of charge drifttimes for surface interactionslimit performance.
• Simulations suggest betterresults will be obtained forsmaller detectors.
• Tests on 2020 and 2825BEGe’s underway.
SAGe Characterisation
-40 -20 0 20 40
x (mm)
-40
-30
-20
-10
0
10
20
30
40
y (
mm
)
0
50
100
150
200
250
300
350
400
450
500
R1
R2
R3/D1
R4
0 10 20 30 40 50 60
z (mm)
-40
-30
-20
-10
0
10
20
30
40
y (
mm
)
0
50
100
150
200
250
300
350
400
450
500
R3/D1
D2
D3
D4
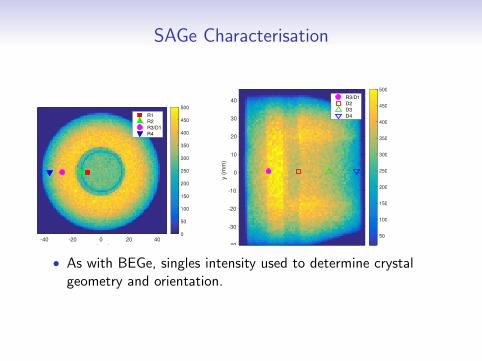
• As with BEGe, singles intensity used to determine crystalgeometry and orientation.
SAGe Characterisation
-1000 -500 0 500 1000 1500 2000
Time (ns)
0
200
400
600
800
1000
1200
1400
1600
Counts
/ 1
0ns
Ge - BGO Trigger Time
All Events
Accepted z = 13.5 mm
Accepted z = 14.5 mm
Accepted z = 30 mm
Accepted z = 46.5 mm
Accepted z = 58 mm
Accepted z = 62 mm
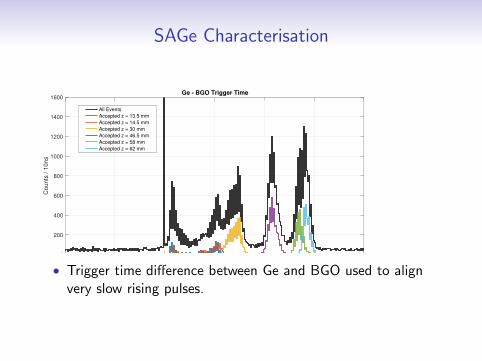
• Trigger time difference between Ge and BGO used to alignvery slow rising pulses.

SAGe Simulations
0 10 20 30 40 50 60 70
z (mm)
-5
0
5
10
15
20
25
30
35
40
45
r (m
m)
-4500
-4000
-3500
-3000
-2500
-2000
-1500
-1000
-500
0
R1
R2
R3/D1
R4
D2 D3 D4
• Field in detector calculated using finite difference approach.• Charge then tracked through field using mobility
parameterisation from Characterization of large volume HPGedetectors. Part I: Electron and hole mobility parameterization,Bruyneel Et Al, NIM A, 2006.
SAGe Simulations
-200 0 200 400 600 800 1000 1200 1400 1600 1800
Time (ns)
-200
0
200
400
600
800
1000
1200
Ch
arg
e (
arb
)
R1
R2
R3/D1
R4
D2
D3
D4
-200 0 200 400 600 800 1000 1200 1400 1600 1800
Time (ns)
0
0.1
0.2
0.3
0.4
0.5
0.6
0.7
0.8
0.9
1
Charg
e (
arb
)
R1
R2
R3/D1
R4
D2
D3
D4
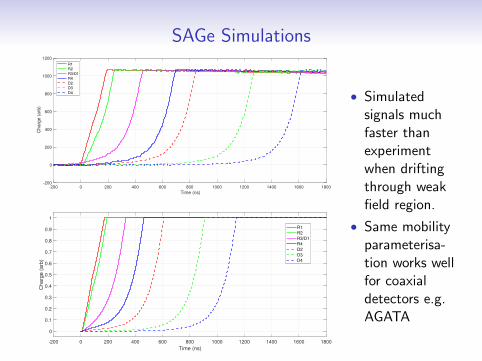
• Simulatedsignals muchfaster thanexperimentwhen driftingthrough weakfield region.
• Same mobilityparameterisa-tion works wellfor coaxialdetectors e.g.AGATA
SAGe Simulations
-200 0 200 400 600 800 1000 1200 1400 1600 1800
Time (ns)
-200
0
200
400
600
800
1000
1200
Ch
arg
e (
arb
)
R1
R2
R3/D1
R4
D2
D3
D4
-200 0 200 400 600 800 1000 1200 1400 1600 1800
Time (ns)
0
0.1
0.2
0.3
0.4
0.5
0.6
0.7
0.8
0.9
1
Charg
e (
arb
)
R1
R2
R3/D1
R4
D2
D3
D4
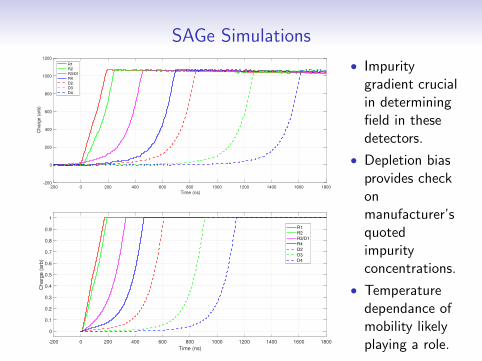
• Impuritygradient crucialin determiningfield in thesedetectors.
• Depletion biasprovides checkonmanufacturer’squotedimpurityconcentrations.
• Temperaturedependance ofmobility likelyplaying a role.
SAGe Simulations
-200 0 200 400 600 800 1000 1200 1400 1600 1800
Time (ns)
-200
0
200
400
600
800
1000
1200
Ch
arg
e (
arb
)
R1
R2
R3/D1
R4
D2
D3
D4
-200 0 200 400 600 800 1000 1200 1400 1600 1800
Time (ns)
0
0.1
0.2
0.3
0.4
0.5
0.6
0.7
0.8
0.9
1
Charg
e (
arb
)
R1
R2
R3/D1
R4
D2
D3
D4
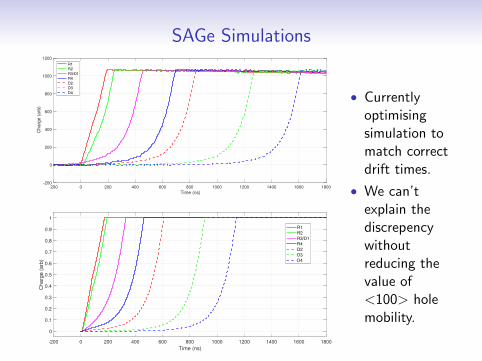
• Currentlyoptimisingsimulation tomatch correctdrift times.
• We can’texplain thediscrepencywithoutreducing thevalue of<100> holemobility.
Conclusions
• SAGe and BEGe detectors characterised at Liverpool.
• Data being used to inform simulation development forlong-drift-time HPGe detectors.
• Modest results performing fully digital Compton backgroundrejection on BEGe 6530.
• Measurements underway to exploit same techniques onsmaller BEGe’s.
Thank You
Thanks to collaborators and conference organisers.
A.J. Boston1, L.J. Harkness1, D.S. Judson1, P.J.Nolan1, O.S. Thomas1, A.S. Adekola2, J. Colaresi2,W.F. Mueller2
1 - Oliver Lodge Laboratory, University of Liverpool, Liverpool, L69 7ZE2 - CANBERRA Industries Inc., 800 Research Parkway, Meriden, CT, 06450, USA
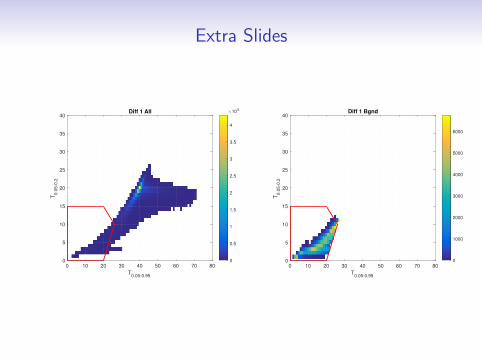
Extra Slides
Diff 1 All
0 10 20 30 40 50 60 70 80
T0.05-0.95
0
5
10
15
20
25
30
35
40
T0.0
5-0
.2
0
0.5
1
1.5
2
2.5
3
3.5
4
105 Diff 1 Bgnd
0 10 20 30 40 50 60 70 80
T0.05-0.95
0
5
10
15
20
25
30
35
40
T0.0
5-0
.2
0
1000
2000
3000
4000
5000
6000