Embed Size (px)
Citation preview

The University of Manchester Research
Characterisation of laser system power draws in materialsprocessingDOI:10.3390/jmmp4020048
Document VersionFinal published version
Link to publication record in Manchester Research Explorer
Citation for published version (APA):Goffin, N., Jones, L. C. R., Tyrer, J., Ouyang, J., Mativenga, P., & Woolley, E. (2020). Characterisation of lasersystem power draws in materials processing. Journal of Manufacturing and Materials Processing, 4(2),[jmmp4020048]. https://doi.org/10.3390/jmmp4020048
Published in:Journal of Manufacturing and Materials Processing
Citing this paperPlease note that where the full-text provided on Manchester Research Explorer is the Author Accepted Manuscriptor Proof version this may differ from the final Published version. If citing, it is advised that you check and use thepublisher's definitive version.
General rightsCopyright and moral rights for the publications made accessible in the Research Explorer are retained by theauthors and/or other copyright owners and it is a condition of accessing publications that users recognise andabide by the legal requirements associated with these rights.
Takedown policyIf you believe that this document breaches copyright please refer to the University of Manchester’s TakedownProcedures [http://man.ac.uk/04Y6Bo] or contact [email protected] providingrelevant details, so we can investigate your claim.
Download date:20. Jan. 2022
Manufacturing andMaterials Processing
Journal of
Article
Characterisation of Laser System Power Draws inMaterials Processing
Nicholas Goffin 1 , Lewis C. R. Jones 1 , John Tyrer 1, Jinglei Ouyang 2, Paul Mativenga 2 andElliot Woolley 1,*
1 Wolfson School of Mechanical and Manufacturing Engineering, Loughborough University,Leicestershire LE11 3TU, UK; [email protected] (N.G.); [email protected] (L.C.R.J.);[email protected] (J.T.)
2 School of Mechanical, Aerospace and Civil Engineering, The University of Manchester,Manchester M13 9PL, UK; [email protected] (J.O.); [email protected] (P.M.)
* Correspondence: [email protected]; Tel.: +44-01509-225410
Received: 31 March 2020; Accepted: 18 May 2020; Published: 19 May 2020�����������������
Abstract: Due to their high speed and versatility, laser processing systems are now commonplacein many industrial production lines. However, as the need to reduce the environmental impactfrom the manufacturing industry becomes more urgent, there is the opportunity to evaluate laserprocessing systems to identify opportunities to improve energy efficiencies and thus reduce theircarbon footprint. While other researchers have studied laser processing, the majority of previouswork on laser systems has focused on the beam–material interaction, overlooking the whole systemviewpoint and the significance of support equipment. In this work, a methodical approach is taken todesign a set of energy modelling terminologies and develop a structured power metering system forlaser systems. A 300 W fibre laser welding system is used to demonstrate the application of the powercharacterization system by utilizing a purpose-built power meter. The laser is broken down accordingto sub-system, with each part analysed separately to give a complete overall power analysis, includingall auxiliary units. The results show that the greatest opportunities for efficiency improvements liein the auxiliary units that support the laser devices as these were responsible for a majority of theelectrical draw; 63.1% when the laser was operated at 240 W, and increasing as the beam powerreduced. The remaining power draw was largely apportioned to electrical supply inefficiencies.In this work, the laser device delivered a maximum of 6% of the total system power. The implicationsof these results on laser processing system design are then discussed as is the suitability of thecharacterization process for use by industry on a range of specific laser processing systems.
Keywords: laser processing; energy consumption; sustainability; environmental impact;manufacturing process; emissions
1. Introduction
Within the manufacturing industry, there is a need to improve energy efficiency in order toreduce both process costs and carbon footprints. As of 2016, the UK industrial sector accounts for21% of the total delivered energy and 29% of CO2 emissions [1], and it is now a legal requirement toachieve net-zero carbon emissions by 2050 [2]. Similar environmental impacts of manufacturing arefound internationally, with industry consuming approximately 25% of the total available energy in theEuropean Union [3], and contributing 22% of all greenhouse gas emissions in the USA [4].
An improved assessment and the utilisation of new and more intensive industrial processes aresome of the strategies for achieving carbon reduction [5]. This target drives all sectors, and a significantbody of literature exists that enables the modelling of generic processes and suggests ways to process
J. Manuf. Mater. Process. 2020, 4, 48; doi:10.3390/jmmp4020048 www.mdpi.com/journal/jmmp

J. Manuf. Mater. Process. 2020, 4, 48 2 of 17
and interpret the results. Models are useful, but there can be some void between a generic approachand the ability to implement them for specific types of manufacturing technology. This paper addressesa disconnect between available models and the need to improve the energy efficiency of laser processingtechniques, demonstrates the concept and highlights how this indicates areas of improvement in energyefficiency. Laser processing systems encompass a number of specific energy consumers that need to beaddressed with respect to their individual characteristics.
1.1. Energy Modelling
Laser manufacturing processes are often chosen due to their high energy density [6], but whencomparing newer laser processes to older, more conventional processes, lasers are shown to be moreenergy-intensive [7]. An initial analysis of laser cutting has shown that there is significant potentialto increase energy efficiency in these types of processes [8]. This paper will characterise the systemenergy consumption specifically for laser-based manufacturing to identify where energy is consumed.The first step is to review which energy modelling frameworks can be applied to laser systems.
Kellens et al. [9] proposed a framework for a systematic life-cycle analysis of manufacturingemissions. The framework contains different types of studies in sequence, e.g., a time study toidentify machine production modes and their relative magnitudes, followed by a power study whichincorporates supplied power to calculate the energy draw of each production mode. The frameworkalso gives an overview of different production modes and the mathematical relationship betweenthem. What it does not do, however, is go into detail on the components of the system/sub-systembreakdown. This is done by Duflou et al. [10], by showing that, in addition to the time-based operatingmode breakdown, manufacturing systems could be also be sub-divided into various levels of interest,from individual components to a global scale: the device/unit level, the line/cell/multi-machine level,the facility level, the multi-factory level and the enterprise/global supply chain level. These levelscan effectively encompass the entire global manufacturing system, and efficiency improvements canbe made in any one of them. These two frameworks [9,10] provide useful methods for categorisingwhere energy consumption within a manufacturing system goes but do not give specific details onelectrical consumption.
An analysis of manufacturing processes and their electricity consumption was carried outby Rodrigues et al. [11], identifying areas where it could be reduced. While not specific tolaser processing, this allowed the identification of elements such as idle machines and possiblemodifications to operational routines which are generic to all manufacturing processes. In additionto this, Bajpai et al. [12] specifically investigated energy bottlenecks in the manufacturing process:power bottlenecks (PBN), where the replacement or upgrade of a machine would give the mostconsiderable improvement in manufacturing line energy efficiency for the smallest cost, and downtimebottlenecks (DBN), where the replacement or upgrade of a machine would give the greatest reductionin downtime for the smallest cost. These analyses not only identify which parts of a system consumethe most energy, but which are individually the most inefficient. This is an important distinction asalthough the overall process may be efficient compared with other means of manufacture, this doesnot conclude that all sub-systems are efficient. This is explored by Gutowski et al. [7], who used theexample of a computer numerical control (CNC) machine to split energy requirements by sub-system,e.g., centrifuge, coolant, oil pressure pump, etc. This provides granularity on which specific sub-systemsuse the most energy and gives guidance on where to look for potential savings.
Sub-systems can have their energy categorised, an additional and essential level of detail, using theembodied product energy (EPE) model [13]. The EPE model categorises energy into direct energy(DE), the energy used by the manufacturing process, and indirect energy (IE), the energy used by theenvironment in which the process takes place. Direct energy is then further sub-divided into theoreticalenergy (TE), the minimum theoretical energy required for the actual desired process, and auxiliaryenergy (AE), the energy required by all the supporting equipment for the process. Using this modelcan enable the identification of inefficiencies at a more detailed level. When the energy breakdown

J. Manuf. Mater. Process. 2020, 4, 48 3 of 17
of systems [7,14] are evaluated by this model, it becomes apparent that TE can often be a minorityproportion, with AE and IE exceeding the TE for manufacturing processes. Using this model can enablethe identification of inefficiencies at a more detailed level. The difference between the actual energyrequired for the process, TE, can be separated from all the supporting energy requirements. This canhave the most significant effect when applied to the design phase of a system, as this is when theefficiency of a system is effectively locked in [15].
1.2. Energy Modelling in Laser Systems
The initial general categorisation, encompassing the device/unit to the facility level, of lasersystems, was first carried out in the field of laser safety. The system itself could be broken down intothree primary sections, with an additional fourth section (“People and Environment”) covering itssurroundings [16]. This categorisation format is still used and has been generalised to a wide varietyof laser industries [17]. By using O’Hagan’s categories [16], all the separate equipment (sub-systems)required can be considered. Laser systems have a common set of energy and resource consumingsub-systems [18,19], which are shown in Table 1.
Table 1. Common laser sub-systems.
Category Energy/Resource Consuming Sub-System
Laser
Power supplyCooling system
Laser consumables (e.g., gas)Computers and control systems
Beam DeliveryPowered beam deflection systems
Optical componentsBeam inspection
Process
Motion systemsSafety systems
Fume extractionPower measurement
Computers and control systemsMaterial feed/delivery
Material processes (e.g., preheating)
People and Environment HeatingLighting
A similar sub-system breakdown approach has been taken in certain specific laser processes.Paul and Anand [20] separated the energy-consuming sub-systems in selective laser sintering:laser, moving platforms, powder spreading, bed heating and miscellaneous energy. It has also beenidentified that these variables are not independent between the various sub-systems. Schmidt et al. [21]noted that laser selection would impact the relative size effect of power and cooling sub-systems.
Many prior studies of energy analysis of laser processing have focussed on the laser–materialinteraction itself, with little attention paid outside of this. Significant work on laser beam optimisationhas already been carried out in a number of ways.
The use of ring-shaped beams was investigated by Wellburn et al. [22], who varied the relativeintensities of the outside and centres of the beam for laser hardening, and Shang et al., who investigateddifferent intensity profiles using a variable intensity modulator for laser cladding. Both of theseworks found a correlation between the beam profile and process zone uniformity. Wellburn et al.demonstrated the ability to control the uniformity of laser-hardened layers by modulating the outerand inner power ratios of a circular beam. Shang et al. found that biasing laser power to the outside ofthe ring gave a more uniform distribution of hard Cr and Fe dendritic phases through the volume ofthe clad track.

J. Manuf. Mater. Process. 2020, 4, 48 4 of 17
Other beam types investigated include rectangular “top hat” beams by Mok et al. [23] andRiveiro et al. [24], and wedge-shaped beams by Bachmann [25]. Riveiro et al. specifically identified thelaser source/chiller combination as a minority cost in the total cost of powder cladding (between 0%and 20% depending on the type of laser), with the main cost as the cost of the powder.
In addition to this, holographic optical elements, kinoforms which can be used to create customisedlaser beam profiles, have been studied by Kell et al. for laser welding [26], Higginson et al. for laserpowder bed fusion (L-PBF) [27] and Goffin et al. for wire-fed laser cladding [28] and thin-filmsurface annealing [29]. The majority of these studies focused on metallurgical improvements,however, Goffin et al. also found that alterations in the beam profile allowed the creation of wire cladtracks with beam power requirements reduced by 30% for an enlarged gaussian beam and 50% fora square uniform beam.
Energy breakdown analyses have been completed in some laser applications. In power-bed laseradditive manufacturing, Baumers et al. [30] defined a number of types of energy consumption analysis:where the energy can be measured according to the job, time, geometry or Z-height. Total energywas measured and then broken down into the build stages: warm up, build and cool-down time.Further work [31] ties this into cost model development for additive manufacturing (AM). A detailedenergy breakdown of laser AM during the build itself was carried out by Paul and Anand [20],dividing the energy consumption into five components: EL (energy for running the laser system),Ep (energy spent in moving the part and powder platforms), Er (energy spent to move the powerspreading roller), Eb (energy spent in heating the bed) and Em (miscellaneous energy). These featuresare common to all laser powder bed processes and this model can therefore be applied genericallywithin this area. Moving beyond energy alone, Kellens et al. [32] utilised the UPCLI methodology toevaluate AM from an environmental impact perspective, utilising 17 categories. Of these, the largestimpacts were to fossil depletion, climate change (both human health and ecosystem), particulateformation and human toxicity—with waste material and electricity being the primary contributors tothese. This work allowed power bed AM users to quantify the environmental footprint of their systems.
In addition to laser AM, Kellens et al. carried out an energy breakdown of laser cutting processes [8].This studied a number of different types of lasers, and broke the energy types down in a similarway to the EPE model. The laser cutting systems are broken down by sub-system, and energy useis traced through the cutting process. This is important for optimal energy savings to be made,as Duflou et al. [10] recognised.
There is a gap in the understanding of the detailed energy consumption of an entire laser system.Suitable frameworks and methodologies for categorising and analysing the energy of manufacturingprocesses have been identified, and so the specific aims of this paper are the following:
• To develop a categorisation strategy specific to the requirements of a laser system at each state inits operating cycle. This is to support the experimental analysis in this paper and to be used asa framework for future works;
• To conduct a power analysis on each element of the system architecture based on the EPE modelto identify direct and indirect power draws of laser systems;
• To present recommendations to address the most significant sources of energy inefficiency for thefuture development of laser systems.
2. Materials and Methods
2.1. The Categorisation of a Laser System
A review of the existing literature has identified the need for a device/unit and line/cell levelsanalysis of a laser system. In this work, definitions of the identified laser system components wereadapted from BSI 14955-1:2017, Annex C [33]. The standard focusses on the environmental evaluationof metal cutting machines; from this, a new set of definitions were developed to be laser-specific.
The system sub-components and associated terminology are defined as the following:
J. Manuf. Mater. Process. 2020, 4, 48 5 of 17
Laser device: The device that produces the photons to be used for material processing. This alsoincludes the device’s power supply and any supply for any pump sources that are required. Where used,particularly if it is part of an integrated system, the laser device energy should include any requirementsfor pulsing, modulating, frequency manipulation, etc. Where it is possible to measure the supply ofthese latter components individually, these could be reported as separate requirements, but in general,should all fall under the heading of the laser device.
The energy requirements of the laser device itself should exclude the following sub-systems,which should all be analysed individually where possible:
Cooling system: Where applicable, this should include both the chiller/cooling mechanism andany associated pumps. It may be possible to separate the energy requirements of the cooling mechanismand a pump, but in general these should be grouped;
Extraction unit: This is the system in place for the removal of gases or ejected material from theworkpiece. This should include any pumps, fans, scrubbing units (if active), etc. The energy used bythe extraction system can include the embodied energy of the air removed from the room. This is notmandatory however, and should be clearly defined by setting the system boundary to either include itor not in any particular analysis;
Motion system: Any active systems for the manipulation of the beam, workpiece or laserdelivery. Including actuators and drivers for these sub-systems. Also includes any sensors required formanipulation or process control (e.g., beam inspection system);
Control unit: Central power unit and computer control system;Safety/interlock systems: Powered interlock system, warning lights and environmental monitoring.The sub-systems listed so far are to be considered common to all laser processes. Each specific
manufacturing process is then likely to have unique energy consumers:Process-specific ancillaries which may be both auxiliary and theoretical consumers of energy.
Process-specific ancillaries include sub-systems that are not common to all processes, e.g., the embodiedenergy of argon shielding gas for laser welding, or the energy for a heated bed in laser powder bedfusion [20]. This column would therefore be different for every process, and may even be absent insome cases. This group of sub-components would also have to include regulator/control devices forthese processes.
Dependant on the level of analysis for a system, there are also consumers of energy beyond thecell level:
Indirect energies: Anything that is used to support the manufacturing environment, but that doesnot directly contribute to the manufacturing process. Examples might include, heating, ventilation,and air conditioning (HVAC), lighting and automated entry systems (e.g., security).
The standard (BSI 14955-1:2017) also requires the definition of operating modes, which can be usedto contain the production modes at different life-cycle time points as identified by Kellens et al. [9]:
Off: All processing systems that are inactive and drawing no power;Standby with peripheral units off: Control units and safety/interlocks are likely required to be
operational first before the laser device, auxiliary units and process specific ancillaries are operational.Indirect energies will also be consuming;
Standby with peripheral units on: All sub-systems are on but in an idle or low-power state;Warm-up: Request for all sub-systems to be active, but not warmed up. There may be a period
when first turned on for sub-systems to become operational;Ready for processing: All sub-systems active, with the system ready to operate but not yet
in operation;Processing: All sub-systems active, with the system in operation.As with the original BSI 14855-1:2017, these operating modes are examples. Depending on the
specific laser system, it is possible that some operating modes may not be relevant. It is also unclear inthe generic layout what the exact sequence of events would be. However, this sequence will likely besignificant to the overall energy consumption at non-processing modes.

J. Manuf. Mater. Process. 2020, 4, 48 6 of 17
2.2. Experimental Setup and Procedure
For this investigation, an industrial standard laser welding system was used. Although based ina laboratory environment, each sub-system is an example commonly found in industry, making theoverall system as close to the commercial standard as possible. The main deviation from a normalindustrial system is the reduced level of integration between the various sub-systems which, fortuitously,allowed them to be more easily isolated and measured. The selection of a laser welding system isjustified due to the commonality of laser welding to many high-value manufacturing industries, as wellas its potential as a gateway into other manufacturing processes, such as directed energy deposition(DED) and additive manufacturing (AM).
In this research, a JK300FL (1070 nm) fibre laser (JK Lasers, Rugby, UK) with a maximum ratedoutput of 300 W was used as the laser device around which a processing system was based. The fibrelaser was coupled to a standard welding head and mounted about a 2-axis CNC system. This setup isshown in Figure 1.
J. Manuf. Mater. Process. 2020, 4, x FOR PEER REVIEW 6 of 18
2.2. Experimental Setup and Procedure
For this investigation, an industrial standard laser welding system was used. Although based in
a laboratory environment, each sub-system is an example commonly found in industry, making the
overall system as close to the commercial standard as possible. The main deviation from a normal
industrial system is the reduced level of integration between the various sub-systems which,
fortuitously, allowed them to be more easily isolated and measured. The selection of a laser welding
system is justified due to the commonality of laser welding to many high-value manufacturing
industries, as well as its potential as a gateway into other manufacturing processes, such as directed
energy deposition (DED) and additive manufacturing (AM).
In this research, a JK300FL (1070 nm) fibre laser (JK Lasers, Rugby, UK) with a maximum rated
output of 300 W was used as the laser device around which a processing system was based. The fibre
laser was coupled to a standard welding head and mounted about a 2-axis CNC system. This setup
is shown in Figure 1.
Figure 1. Laser welding head.
A laboratory-wide spinal extraction unit was used, with a sub-pipe to the laser welding system.
The cooling system was an ICS Taeevo M03 chiller (Industrial Cooling Systems (ICS)), shared with
an adjacent 1 kW fibre laser cell. The lasers were not used simultaneously in this study. This setup
fulfilled two purposes. Firstly, the individual sub-systems used were as similar to industrial standard
as possible, to make the results as industry-applicable as possible. Secondly, the system did not
possess the level of integration that industrial laser systems typically possess. This made it easier to
isolate and measure the sub-systems individually.
The electrical power measurement was conducted using a Cube 350 Ethernet System meter,
packaged into a portable system and supplied by NewFound Energy. This is a 3-phase energy meter,
with adaptors allowing single-phase metering for these trials. The system has its own web server and
is controlled over a network by any connected computer via a web browser. It is capable of
measurement rates of up to 1 data point per second, calculated from 1200 individual sub-samples per
second, with a maximum current of 32 A and a maximum voltage of 230 V for single-phase/400 V for
3-phase.
The energy meter can measure and record several different parameters, but for this study, three
were of relevance. These are defined and summarised in Table 2.
Fibre
Back-reflection
detector
Down-nozzle
camera
Welding
nozzle
Figure 1. Laser welding head.
A laboratory-wide spinal extraction unit was used, with a sub-pipe to the laser welding system.The cooling system was an ICS Taeevo M03 chiller (Industrial Cooling Systems (ICS)), shared withan adjacent 1 kW fibre laser cell. The lasers were not used simultaneously in this study. This setupfulfilled two purposes. Firstly, the individual sub-systems used were as similar to industrial standardas possible, to make the results as industry-applicable as possible. Secondly, the system did not possessthe level of integration that industrial laser systems typically possess. This made it easier to isolate andmeasure the sub-systems individually.
The electrical power measurement was conducted using a Cube 350 Ethernet System meter,packaged into a portable system and supplied by NewFound Energy. This is a 3-phase energy meter,with adaptors allowing single-phase metering for these trials. The system has its own web serverand is controlled over a network by any connected computer via a web browser. It is capable ofmeasurement rates of up to 1 data point per second, calculated from 1200 individual sub-samples persecond, with a maximum current of 32 A and a maximum voltage of 230 V for single-phase/400 Vfor 3-phase.
The energy meter can measure and record several different parameters, but for this study, threewere of relevance. These are defined and summarised in Table 2.
J. Manuf. Mater. Process. 2020, 4, 48 7 of 17
Table 2. Definition of electrical energy variables.
Name Units Description
Apparent power kVA
Direct multiplication of voltage and current, defined as kVArather than kW in order to differentiate from the load, although
in direct current systems, the two are the same. This is theelectrical power drawn by the system.
Load kWThe result of multiplying the apparent power and power factor.This is the electrical power actually used by the system, allowing
for inefficiencies due to inductive or capacitive phase shifts.
Power factor Non-dimensional The ratio between apparent power and load. Analogous toefficiency in mechanical systems.
The device was specified as Class 0.25 for the kW and kVA measurements according to BS EN60688:2013, giving an accuracy of ±0.25% at the fiducial value (32 A). Multiple investigative stageswere required in order to capture sufficient information about individual energy consumers in the laserprocessing system. This was due to several pieces of equipment being powered by the same supplyand the need to understand consumption across various operational parameters.
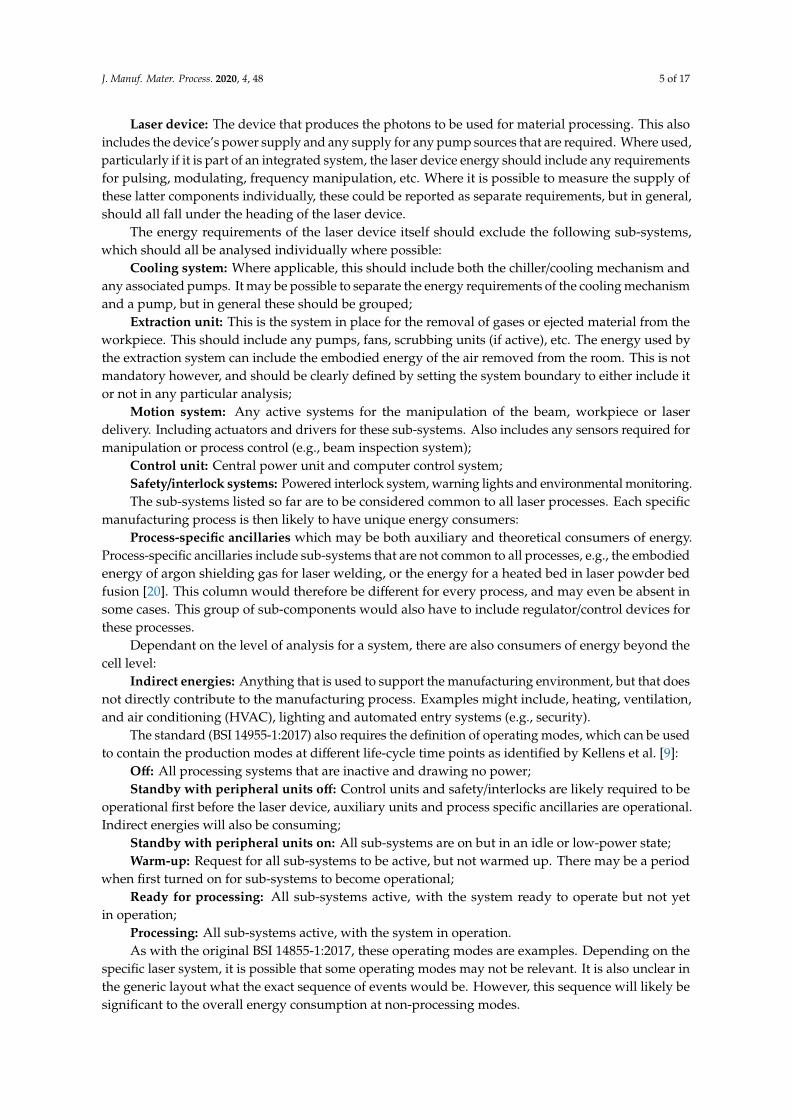
The laser beam output power was characterised by the use of a Coherent LM-200 air-cooledpower meter (Coherent, Ely, UK). This allowed a correlation to be created between the percentagepower setting defined in the control software and the laser beam emerging from the welding head.This accounted for all losses through the optics. The correlation is shown in Figure 2, giving a linearrelationship, based on three readings per data point with standard deviations less than 0.5 W—toosmall to be relevant. The trendline formula allowed the required power setting to be calculated for anyrequired output power. The maximum applied laser beam power was found to be 250 W at the 100%power setting, 50 W lower than the rated 300 W maximum.
J. Manuf. Mater. Process. 2020, 4, x FOR PEER REVIEW 7 of 18
Table 2. Definition of electrical energy variables.
Name Units Description
Apparent
power kVA
Direct multiplication of voltage and current, defined as kVA rather
than kW in order to differentiate from the load, although in direct
current systems, the two are the same. This is the electrical power
drawn by the system.
Load kW
The result of multiplying the apparent power and power factor. This
is the electrical power actually used by the system, allowing for
inefficiencies due to inductive or capacitive phase shifts.
Power
factor
Non-
dimensional
The ratio between apparent power and load. Analogous to efficiency
in mechanical systems
The device was specified as Class 0.25 for the kW and kVA measurements according to BS EN
60688:2013, giving an accuracy of ±0.25% at the fiducial value (32 A). Multiple investigative stages
were required in order to capture sufficient information about individual energy consumers in the
laser processing system. This was due to several pieces of equipment being powered by the same
supply and the need to understand consumption across various operational parameters.
The laser beam output power was characterised by the use of a Coherent LM-200 air-cooled
power meter (Coherent, Ely, UK). This allowed a correlation to be created between the percentage
power setting defined in the control software and the laser beam emerging from the welding head.
This accounted for all losses through the optics. The correlation is shown in Figure 2, giving a linear
relationship, based on three readings per data point with standard deviations less than 0.5 W—too
small to be relevant. The trendline formula allowed the required power setting to be calculated for
any required output power. The maximum applied laser beam power was found to be 250 W at the
100% power setting, 50 W lower than the rated 300 W maximum.
Figure 2. Correlation of laser power setting vs. beam power.
Energy monitoring was carried out at the device/unit and line/cell levels, according to Duflou’s
hierarchy, with the investigation covering both the laser cell as a whole and the sub-units within it.
As discussed above, definitions of the laser system components were adapted from BSI 14955-1:2017,
Annex C [33], representing a combined approach, utilising the system sub-components in
conjunction with Gutowski et al.’s method of energy monitoring.:
Operating states were defined as “Off”, “Standby with peripheral units off”, “Standby with
peripheral units on”, “Warm Up”, “Ready for processing” and “Processing”;
Sub-systems were defined as “Laser”, “Extraction”, “Cooling”, “Motion” and “Control”.
y = 2.51x + 1.78
0.0
50.0
100.0
150.0
200.0
250.0
300.0
0 20 40 60 80 100
Lase
r b
eam
po
we
r (W
)
Laser power setting (%)
Figure 2. Correlation of laser power setting vs. beam power.
Energy monitoring was carried out at the device/unit and line/cell levels, according to Duflou’shierarchy, with the investigation covering both the laser cell as a whole and the sub-units within it.As discussed above, definitions of the laser system components were adapted from BSI 14955-1:2017,Annex C [33], representing a combined approach, utilising the system sub-components in conjunctionwith Gutowski et al.’s method of energy monitoring.:
• Operating states were defined as “Off”, “Standby with peripheral units off”, “Standby withperipheral units on”, “Warm Up”, “Ready for processing” and “Processing”;
• Sub-systems were defined as “Laser”, “Extraction”, “Cooling”, “Motion” and “Control”.

J. Manuf. Mater. Process. 2020, 4, 48 8 of 17
At this stage in the energy investigation, the “Process-specific ancillaries” column was disregarded.This meant that the embodied energy from the compressed gas argon shield was ignored, as were theeffects from gas cooling on laser power for material processing. These are intended to be considered at alater research stage where a particular process is investigated. The control unit, safety interlock systemsand indirect energies were grouped together in the “Control” column. In addition, “Standby withperipheral units off” and “Warm up” were disregarded since they do not apply to this system, givingthe reduced number of operating states shown in Table 3. Each of the sub-systems in this table wasisolated and then measured in its relevant operating states.
Table 3. Specific operating states investigated.
Laser Extraction Cooling Motion Control
Off OFF OFF OFF OFF OFFStandby with peripheral units on OFF OFF ON OFF ON
Ready for processing ON ON ON OFF ONProcessing ON ON ON ON ON
3. Results
3.1. Characterisation of Laser Power
The laser energy draw was tested at power settings between 40% and 100% at 10% intervals.This corresponded to the beam output powers between 102 and 253 W, as shown in Figure 3. Eachreading is given as a mean of between 6 and 10 individual data points, with error bars displayed at onestandard deviation.
J. Manuf. Mater. Process. 2020, 4, x FOR PEER REVIEW 8 of 18
At this stage in the energy investigation, the “Process-specific ancillaries” column was
disregarded. This meant that the embodied energy from the compressed gas argon shield was
ignored, as were the effects from gas cooling on laser power for material processing. These are
intended to be considered at a later research stage where a particular process is investigated. The
control unit, safety interlock systems and indirect energies were grouped together in the “Control”
column. In addition, “Standby with peripheral units off” and “Warm up” were disregarded since
they do not apply to this system, giving the reduced number of operating states shown in Table 3.
Each of the sub-systems in this table was isolated and then measured in its relevant operating states.
Table 3. Specific operating states investigated.
Laser Extraction Cooling Motion Control
Off OFF OFF OFF OFF OFF
Standby with peripheral units on OFF OFF ON OFF ON
Ready for processing ON ON ON OFF ON
Processing ON ON ON ON ON
3. Results
3.1. Characterisation of Laser Power
The laser energy draw was tested at power settings between 40% and 100% at 10% intervals.
This corresponded to the beam output powers between 102 and 253 W, as shown in Figure 3. Each
reading is given as a mean of between 6 and 10 individual data points, with error bars displayed at
one standard deviation.
Figure 3. Laser beam power vs. Electrical power consumption.
The similar recordings of load and apparent power show that the laser has a very high power
factor (average 0.965, standard deviation 0.008) and thus very high electrical efficiency. This is as
expected since it is a solid-state system with no moving parts. A linear relationship is evident between
laser beam power and laser electrical power, with the narrow error bars showing the stability of the
laser output. Its beam generation (pump) efficiency is much lower, however, at an average of a 20.3%
0.000
0.200
0.400
0.600
0.800
1.000
1.200
1.400
102 127 153 177 203 228 253
Elec
tria
cl p
ow
er c
on
sum
pti
on
(kW
)
Laser beam power (W)
Load (kW)
Apparent power (kVA)
Figure 3. Laser beam power vs. Electrical power consumption.
The similar recordings of load and apparent power show that the laser has a very high powerfactor (average 0.965, standard deviation 0.008) and thus very high electrical efficiency. This is asexpected since it is a solid-state system with no moving parts. A linear relationship is evident betweenlaser beam power and laser electrical power, with the narrow error bars showing the stability of thelaser output. Its beam generation (pump) efficiency is much lower, however, at an average of a 20.3%

J. Manuf. Mater. Process. 2020, 4, 48 9 of 17
(standard deviation 0.2%) ratio between the beam output power and the electrical power consumption.This represents the typical performance for fibre lasers of this generation.
3.2. Characterisation of Extraction Unit Power
In this system, the extraction unit was exceptional in that it was simply either “ON” or “OFF”.A single system was also used to extract for the entire laboratory, which contained a diversity ofdifferent laser systems. It was therefore vastly larger and more powerful than would have beenrequired for the welding system only.
Since there was no capability to isolate the extraction for the welding system, an estimate wasmade by measuring the power draw of the overall extraction system and then using the cross-sectionalareas and flow rates of the pipes to estimate the percentage of overall flow allocated to the weldingsystem, given in Table 4. A direct relationship was assumed between the air flow ratio and the powerdraw, such that the same ratio was used to allocate a proportion of the overall energy use to the lasersystem. Direct current and voltage measurements are shown in Table 5.
Table 4. Flow rate ratio calculations.
Measured FlowRate (m/s)
Pipe Cross-SectionalArea (m2)
Volume Flow Rate(m3/s) Flow Rate Ratio
Main extraction pipe 9.6 0.049 0.471300 W fibre laser system 2.92 0.018 0.052 0.11
Table 5. Extraction current and voltage measurements.
Phase 1 Phase 2 Phase 3 Mean
Current (A) 3.28 3.64 3.22 3.38Phase 1–2 Phase 1–3 Phase 2–3 Mean
3-phase voltage (V) 416 416 414 415.33
These measurements were used to find the power levels in Table 6, with the flow rate ratio used tocalculate how much of the laboratory-wide extraction was being used by the laser specifically. This wasbecause in this specific laboratory, the extraction unit was a constant draw system; there was no abilityto scale the laboratory-wide extraction power proportionally with the demand when just this lasersystem was operating.
Table 6. Extraction power calculations.
Laboratory-Wide Extraction Power Cell-Specific Extraction Power
Power factor 0.85 0.85Apparent power (kVA) 2.43 0.267
Load (kW) 2.07 0.228
For the purposes of this investigation, the cell-specific power draws were used, since thelaboratory-wide figures are unique to a specific location and do not apply broadly. They still haverelevance, however. Modern extraction systems are fully capable of a scaled output, but many olderones, such as the one used here, are not. If older systems are still in use in a laboratory or workshop,it is worth investigating the benefits of upgrades; Table 6 shows that in this case, an approximately 89%power saving is possible.
3.3. Characterisation of Cooling System Power
In order to characterise the chiller system power draw, the laser system was run continuously for15 min, at varying power levels, with the CNC motion system on a continuous loop in order to avoidoverheating a single location.
J. Manuf. Mater. Process. 2020, 4, 48 10 of 17
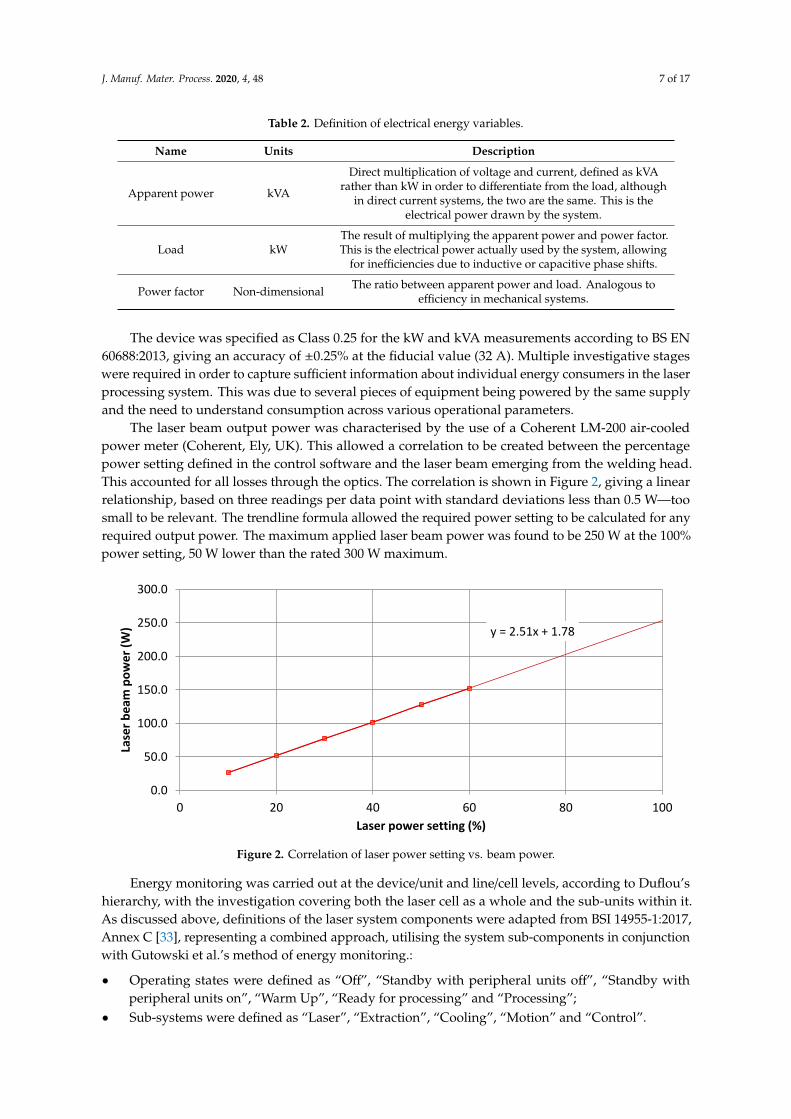
With the chiller off, it drew no power at all. With the chiller on, it would continuously circulate thecoolant through the system, with a noticeable power draw from the pump. When the laser temperaturebecame excessive, the chiller would then start cooling, until it reduced the temperature to an acceptablelevel. There were, therefore, two distinct power draw levels in the chiller performance: “pump only”and “pump + chiller”, shown in Figure 4.
J. Manuf. Mater. Process. 2020, 4, x FOR PEER REVIEW 10 of 18
In order to characterise the chiller system power draw, the laser system was run continuously
for 15 min, at varying power levels, with the CNC motion system on a continuous loop in order to
avoid overheating a single location.
With the chiller off, it drew no power at all. With the chiller on, it would continuously circulate
the coolant through the system, with a noticeable power draw from the pump. When the laser
temperature became excessive, the chiller would then start cooling, until it reduced the temperature
to an acceptable level. There were, therefore, two distinct power draw levels in the chiller
performance: “pump only” and “pump + chiller”, shown in Figure 4.
Figure 4. Total cooling system load levels for laser running at 120 W.
The power draw for the cooling system was predictable, with both the pumping only and active
cooling modes drawing the same amount of power regardless of the power of the laser. This is shown
in Table 7, for both the kVA and kW measurements. In all cases, the pumping accounted for just
under half (46%–48%) of the total power draw when the chiller was active, with the cooling
accounting for the remainder, but only when it was active.
Table 7. Chiller power measurements at different laser power levels.
Laser Power
Overall
Chiller
Power,
kVA
Chiller
Pumping,
kVA
Chiller
Cooling,
kVA
Overall
Chiller
Load, kW
Chiller
Pumping,
kW
Chiller
Cooling,
kW
80 W test 1.293125 0.601 0.693
1.163125 0.55 0.611
46% 54% 47% 53%
120 W test 1.279375 0.600 0.679
1.16 0.551 0.609
47% 53% 47% 53%
160 W test 1.266875 0.606 0.661
1.14875 0.553 0.596
48% 52% 48% 52%
200 W test 1.265 0.601 0.664
1.169375 0.558 0.611
47% 53% 48% 52%
240 W test 1.25125 0.595 0.656
1.169375 0.55 0.619
48% 52% 47% 53%
The chiller modulated its cooling effect by monitoring the coolant temperature and then
adjusting the amount of active cooling in order to extract the correct amount of heat. The power draw
0.000
0.200
0.400
0.600
0.800
1.000
1.200
1.400
1.600
1.800
0 100 200 300 400 500 600 700 800 900
Po
wer
(kW
)
Time (s)
Apparent power (kVA)
Load (kW)
Figure 4. Total cooling system load levels for laser running at 120 W.
The power draw for the cooling system was predictable, with both the pumping only and activecooling modes drawing the same amount of power regardless of the power of the laser. This is shownin Table 7, for both the kVA and kW measurements. In all cases, the pumping accounted for just underhalf (46–48%) of the total power draw when the chiller was active, with the cooling accounting for theremainder, but only when it was active.
Table 7. Chiller power measurements at different laser power levels.
Laser Power Overall ChillerPower, kVA
ChillerPumping, kVA
Chiller Cooling,kVA
Overall ChillerLoad, kW
ChillerPumping, kW
Chiller Cooling,kW
80 W test 1.2931250.601 0.693
1.1631250.55 0.611
46% 54% 47% 53%
120 W test 1.2793750.600 0.679
1.160.551 0.609
47% 53% 47% 53%
160 W test 1.2668750.606 0.661
1.148750.553 0.596
48% 52% 48% 52%
200 W test 1.2650.601 0.664
1.1693750.558 0.611
47% 53% 48% 52%
240 W test 1.251250.595 0.656
1.1693750.55 0.619
48% 52% 47% 53%
The chiller modulated its cooling effect by monitoring the coolant temperature and then adjustingthe amount of active cooling in order to extract the correct amount of heat. The power draw of thecooling system was controlled by increasing the proportion of the duty cycle devoted to active cooling,as opposed to its power level. As the laser power increased, the proportion of time that the coolingsystem was actively cooling also increased, up to a point where it was active continuously for theduration of the time measured.
3.4. Characterisation of Motion System Power
The CNC system was tested at a variety of speeds and payloads. These parameters are given inTable 8. The base load describes the CNC system with only the base mounted and loads of increasing

J. Manuf. Mater. Process. 2020, 4, 48 11 of 17
mass added. Five loads and eight different speeds were tested, with each load being tested at everyspeed, giving 40 tests in total.
Table 8. CNC testing parameters.
Payload Weights (kg) Motion Speeds (mm/s)
Base load 5Base load + 2 kg 10Base load + 4 kg 15Base load + 6 kg 20Base load + 8 kg 25
303540
Figure 5 shows the plots of power draw vs. time for all payloads. Power draws were all extremelysimilar, with a mean power factor of 0.743.
J. Manuf. Mater. Process. 2020, 4, x FOR PEER REVIEW 11 of 18
of the cooling system was controlled by increasing the proportion of the duty cycle devoted to active
cooling, as opposed to its power level. As the laser power increased, the proportion of time that the
cooling system was actively cooling also increased, up to a point where it was active continuously
for the duration of the time measured.
3.4. Characterisation of Motion System Power
The CNC system was tested at a variety of speeds and payloads. These parameters are given in
Table 8. The base load describes the CNC system with only the base mounted and loads of increasing
mass added. Five loads and eight different speeds were tested, with each load being tested at every
speed, giving 40 tests in total.
Table 8. CNC testing parameters.
Payload Weights (kg) Motion Speeds (mm/s)
Base load 5
Base load + 2 kg 10
Base load + 4 kg 15
Base load + 6 kg 20
Base load + 8 kg 25
30
35
40
Figure 5 shows the plots of power draw vs. time for all payloads. Power draws were all
extremely similar, with a mean power factor of 0.743.
Figure 5. Power draw vs. speed for all CNC payloads.
The CNC power draw stayed almost constant at all parameters. The reason for this is due to the
stepper motor-based drive system, which does adjust according to the load or speed. The system will
always draw the same amount of power until a maximum limit for the load or speed is reached, at
which point it will no longer function. The CNC system is relatively electrically inefficient, with
power factors around 0.75.
0.700
0.720
0.740
0.760
0.780
0.800
0.820
0 20 40 60 80 100 120 140
Po
wer
dra
w, k
VA
(kW
)
Time (s)
CNC at baseload
CNC baseload + 2 kg
CNC baseload + 4 kg
CNC baseload + 6 kg
CNC baseload + 8 kg
Figure 5. Power draw vs. speed for all CNC payloads.
The CNC power draw stayed almost constant at all parameters. The reason for this is due to thestepper motor-based drive system, which does adjust according to the load or speed. The system willalways draw the same amount of power until a maximum limit for the load or speed is reached, at whichpoint it will no longer function. The CNC system is relatively electrically inefficient, with power factorsaround 0.75.
3.5. Characterisation of Control Unit Power
Firstly, the power demand for each sub-system was characterised in their idle state. This is wherethey were active and switched on, but not actually processing, e.g., the laser was on but not emittinga laser beam. The power measurements for these are given in Table 9.
The support system power draws were universally very low, especially since the meter’s accuracywas specified at ±0.25%. Of these four measurements, the cabinet electrics and laser control were bothabove 1% of the fiduciary value, and so could be considered to be reasonably reliable. This gives 0.39 Aand 0.09 kW (kVA) as the reasonable minima for the power measurement.

J. Manuf. Mater. Process. 2020, 4, 48 12 of 17
Table 9. Power draws for active but idle systems.
System Sub-Component Current Draw (A) Power Draw (kW) Power Draw (kVA)
Cabinet electrics 0.39 0.04 0.09CNC control 0.005 0.024 0.000Laser control 1.18 0.256 0.280
PC −0.003 −0.003 0.001
The CNC control and personal computer (PC) readings were both below the accuracy range ofthe meter and were therefore assumed to be unreliable. On the basis of the other measurements, it wasestimated that the correct power draw for them is between 0 and 0.09 kW (kVA). For the purposes offurther analysis, they were treated as each drawing 0.09 kW (kVA), with the caveat that this representsan upper limit.
4. Analysis and Discussion
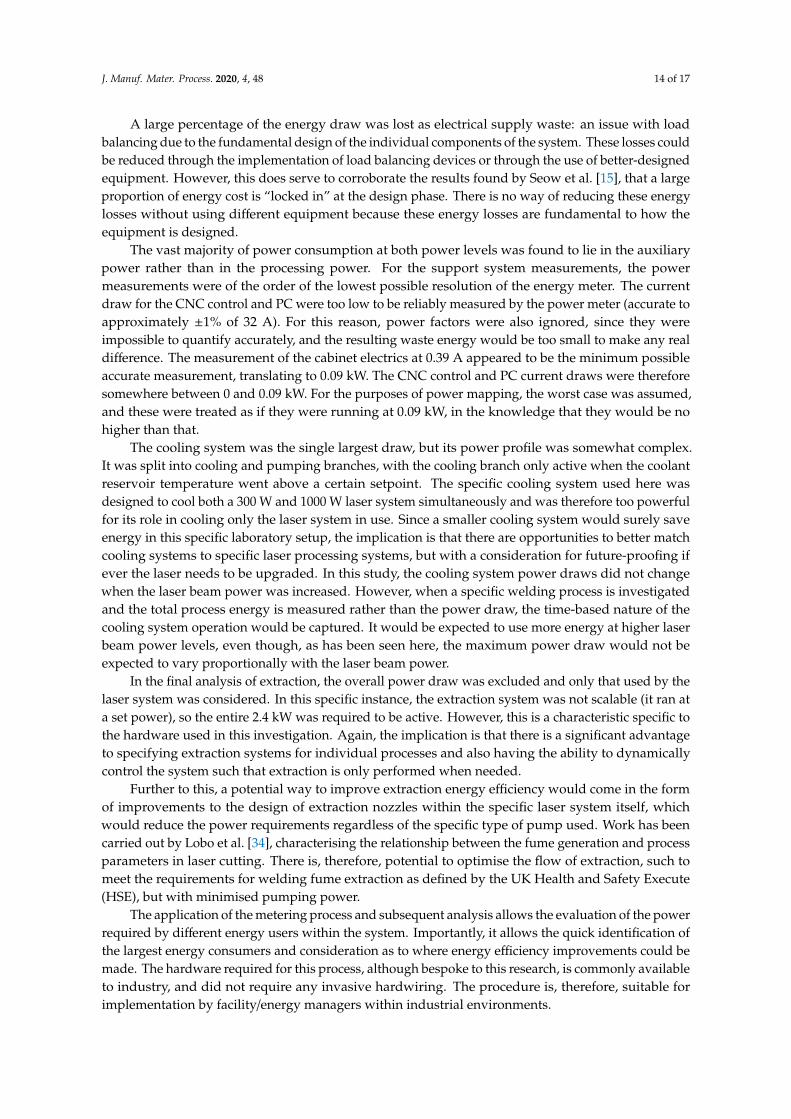
As a result of the power characterisation of the laser’s sub-systems, it is possible to create overallpower maps of the laser welding system, as shown in Figure 6. Two such maps are presented, with thelaser power at 120 W and 240 W, respectively.
The energy requirements of the various sub-systems for the laser processing system were assessedindividually, in a similar way to that described by Gutowski et al. [7]. In order to evaluate the usefulnessof the energy users, it is possible to apply a similar energy modelling approach to that described bySeow and Rahimifard [13]. However, in their approach, the model is designed specifically for discretemanufacturing in order to reduce the embodied product energy of products. In this current work,the focus is on the energy used by a “generic” laser processing system, in which case there is no specificproduct that energy can be attributed to. Instead it is more appropriate to consider the power drawnby a system and its sub-components which makes more sense if you are seeking to compare the energyefficiency of similar processes. In this analysis, the following definitions for power draw were used:
• Auxiliary power (AP): The sum of the all the power inputs which supported the process butdo not directly cause melting. This represents a category where energy savings are possiblewithin the bounds of the existing relevant sub-systems. The power categorised here consists ofthose elements considered necessary for the process to proceed (e.g., CNC motion, cooling, etc.),but which do not contribute directly to the laser–material interaction;
• Processing power (PP): A process-specific modification of the concept of direct energy (DE) [13],the sum of all power inputs that contributed directly to the beam–material interaction process.In this case, it was solely the laser beam, but it is possible to imagine a scenario that uses an electronbeam or plasma/arc torch instead, or some hybrid combination of the processes. PP includestheoretical power (TP), which is the minimum amount of laser beam energy required to actuallymelt/process a given volume of material at a given rate, and reflected power (RP), which representsthe energy that is emitted but lost to reflection (and other loses such as the proportion of beamemitted through the bottom of the Kerf in cutting, or the energy used to create a heat affected zone).RP is similar to AP, in that its presence is essentially required to allow processing to take place butit makes no direct contribution. It is categorised differently in order to distinguish between thistype of energy loss and the energy required to support the sub-systems;
• Electrical supply waste (ESW): This category incorporates the sum of all the electrical losses in thesystem, based on the power factor. This energy provides no benefit and efficiency improvementshere require the redesign or replacement of the relevant sub-systems to improve their powerfactors (work which was outside the scope of this investigation).
This combination of approaches and definitions of power components allowed the simultaneousmapping of energy draws by sub-systems and the categorisation of these draws by function,giving a complete analysis of laser processing energy flows at a system level. This showed that

J. Manuf. Mater. Process. 2020, 4, 48 13 of 17
at 120 W laser power, only a tiny proportion of the power required by the system (3.45%) is attributedto processing power, with the remainder being used by the auxiliary systems (72.2%) or lost as supplywaste (24.3%). When the laser is running close to the maximum at 240 W, these percentages change to6.00%, 63.1% and 30.9%, respectively. When running the laser at a high power, the system electricalefficiency is increased because all other system power draws remain constant. The higher power settingalso generates more waste heat, so the supply waste percentage is also increased, which explains whythe auxiliary system percentage reduces. In this study, the power requirements by indirect energyconsumers were not considered, although these will always lead to lower effective system efficiencies.The implication is that for energy efficiency improvements in laser processing systems, efforts shouldnot primarily be focused towards developing more efficient laser devices, but towards better designedauxiliary systems and an improved consideration for the matching of sub-components.
J. Manuf. Mater. Process. 2020, 4, x FOR PEER REVIEW 13 of 18
order to distinguish between this type of energy loss and the energy required to support the sub-
systems;
Electrical supply waste (ESW): This category incorporates the sum of all the electrical losses in
the system, based on the power factor. This energy provides no benefit and efficiency
improvements here require the redesign or replacement of the relevant sub-systems to improve
their power factors (work which was outside the scope of this investigation).
This combination of approaches and definitions of power components allowed the simultaneous
mapping of energy draws by sub-systems and the categorisation of these draws by function, giving
a complete analysis of laser processing energy flows at a system level. This showed that at 120 W
laser power, only a tiny proportion of the power required by the system (3.45%) is attributed to
processing power, with the remainder being used by the auxiliary systems (72.2%) or lost as supply
waste (24.3%). When the laser is running close to the maximum at 240 W, these percentages change
to 6.00%, 63.1% and 30.9%, respectively. When running the laser at a high power, the system electrical
efficiency is increased because all other system power draws remain constant. The higher power
setting also generates more waste heat, so the supply waste percentage is also increased, which
explains why the auxiliary system percentage reduces. In this study, the power requirements by
indirect energy consumers were not considered, although these will always lead to lower effective
system efficiencies. The implication is that for energy efficiency improvements in laser processing
systems, efforts should not primarily be focused towards developing more efficient laser devices, but
towards better designed auxiliary systems and an improved consideration for the matching of sub-
components.
(a)
J. Manuf. Mater. Process. 2020, 4, x FOR PEER REVIEW 14 of 18
Figure 6. Laser welding power flows (kVA), (a) with the laser beam power at 120 W and (b) with the
laser beam power at 240 W.
A large percentage of the energy draw was lost as electrical supply waste: an issue with load
balancing due to the fundamental design of the individual components of the system. These losses
could be reduced through the implementation of load balancing devices or through the use of better-
designed equipment. However, this does serve to corroborate the results found by Seow et al. [15],
that a large proportion of energy cost is “locked in” at the design phase. There is no way of reducing
these energy losses without using different equipment because these energy losses are fundamental
to how the equipment is designed.
The vast majority of power consumption at both power levels was found to lie in the auxiliary
power rather than in the processing power. For the support system measurements, the power
measurements were of the order of the lowest possible resolution of the energy meter. The current
draw for the CNC control and PC were too low to be reliably measured by the power meter (accurate
to approximately ±1% of 32 A). For this reason, power factors were also ignored, since they were
impossible to quantify accurately, and the resulting waste energy would be too small to make any
real difference. The measurement of the cabinet electrics at 0.39 A appeared to be the minimum
possible accurate measurement, translating to 0.09 kW. The CNC control and PC current draws were
therefore somewhere between 0 and 0.09 kW. For the purposes of power mapping, the worst case
was assumed, and these were treated as if they were running at 0.09 kW, in the knowledge that they
would be no higher than that.
The cooling system was the single largest draw, but its power profile was somewhat complex.
It was split into cooling and pumping branches, with the cooling branch only active when the coolant
reservoir temperature went above a certain setpoint. The specific cooling system used here was
designed to cool both a 300 W and 1000 W laser system simultaneously and was therefore too
powerful for its role in cooling only the laser system in use. Since a smaller cooling system would
surely save energy in this specific laboratory setup, the implication is that there are opportunities to
better match cooling systems to specific laser processing systems, but with a consideration for future-
proofing if ever the laser needs to be upgraded. In this study, the cooling system power draws did
not change when the laser beam power was increased. However, when a specific welding process is
investigated and the total process energy is measured rather than the power draw, the time-based
nature of the cooling system operation would be captured. It would be expected to use more energy
at higher laser beam power levels, even though, as has been seen here, the maximum power draw
would not be expected to vary proportionally with the laser beam power.
(b)
Figure 6. Laser welding power flows (kVA), (a) with the laser beam power at 120 W and (b) with thelaser beam power at 240 W.
J. Manuf. Mater. Process. 2020, 4, 48 14 of 17
A large percentage of the energy draw was lost as electrical supply waste: an issue with loadbalancing due to the fundamental design of the individual components of the system. These losses couldbe reduced through the implementation of load balancing devices or through the use of better-designedequipment. However, this does serve to corroborate the results found by Seow et al. [15], that a largeproportion of energy cost is “locked in” at the design phase. There is no way of reducing these energylosses without using different equipment because these energy losses are fundamental to how theequipment is designed.
The vast majority of power consumption at both power levels was found to lie in the auxiliarypower rather than in the processing power. For the support system measurements, the powermeasurements were of the order of the lowest possible resolution of the energy meter. The currentdraw for the CNC control and PC were too low to be reliably measured by the power meter (accurate toapproximately ±1% of 32 A). For this reason, power factors were also ignored, since they wereimpossible to quantify accurately, and the resulting waste energy would be too small to make any realdifference. The measurement of the cabinet electrics at 0.39 A appeared to be the minimum possibleaccurate measurement, translating to 0.09 kW. The CNC control and PC current draws were thereforesomewhere between 0 and 0.09 kW. For the purposes of power mapping, the worst case was assumed,and these were treated as if they were running at 0.09 kW, in the knowledge that they would be nohigher than that.
The cooling system was the single largest draw, but its power profile was somewhat complex.It was split into cooling and pumping branches, with the cooling branch only active when the coolantreservoir temperature went above a certain setpoint. The specific cooling system used here wasdesigned to cool both a 300 W and 1000 W laser system simultaneously and was therefore too powerfulfor its role in cooling only the laser system in use. Since a smaller cooling system would surely saveenergy in this specific laboratory setup, the implication is that there are opportunities to better matchcooling systems to specific laser processing systems, but with a consideration for future-proofing ifever the laser needs to be upgraded. In this study, the cooling system power draws did not changewhen the laser beam power was increased. However, when a specific welding process is investigatedand the total process energy is measured rather than the power draw, the time-based nature of thecooling system operation would be captured. It would be expected to use more energy at higher laserbeam power levels, even though, as has been seen here, the maximum power draw would not beexpected to vary proportionally with the laser beam power.
In the final analysis of extraction, the overall power draw was excluded and only that used by thelaser system was considered. In this specific instance, the extraction system was not scalable (it ran ata set power), so the entire 2.4 kW was required to be active. However, this is a characteristic specific tothe hardware used in this investigation. Again, the implication is that there is a significant advantageto specifying extraction systems for individual processes and also having the ability to dynamicallycontrol the system such that extraction is only performed when needed.
Further to this, a potential way to improve extraction energy efficiency would come in the formof improvements to the design of extraction nozzles within the specific laser system itself, whichwould reduce the power requirements regardless of the specific type of pump used. Work has beencarried out by Lobo et al. [34], characterising the relationship between the fume generation and processparameters in laser cutting. There is, therefore, potential to optimise the flow of extraction, such tomeet the requirements for welding fume extraction as defined by the UK Health and Safety Execute(HSE), but with minimised pumping power.
The application of the metering process and subsequent analysis allows the evaluation of the powerrequired by different energy users within the system. Importantly, it allows the quick identification ofthe largest energy consumers and consideration as to where energy efficiency improvements could bemade. The hardware required for this process, although bespoke to this research, is commonly availableto industry, and did not require any invasive hardwiring. The procedure is, therefore, suitable forimplementation by facility/energy managers within industrial environments.

J. Manuf. Mater. Process. 2020, 4, 48 15 of 17
These results allow energy-saving strategies to be effectively targeted at the most energy-intensivesub-systems, with the potential for significant reductions in carbon footprint.
5. Conclusions
The following outputs have been generated from this work:
• Laser systems can be energy modelled in the same way as other manufacturing systems.Existing manufacturing energy frameworks have been adapted for laser materials processing.In this study, the sub-components of the laser system were broken down in a similar way toGutowski et al. [7], with energy categorised according to a modified version of the manufacturingenergy model created by Seow and Rahimifard [13];
• The overall power draw of a laser welding system has been characterised and broken down bysub-system. Areas have been identified where energy savings can be made, and others have beendiscounted from further exploration;
• The power draw of the laser itself represents only a minority proportion of the overall systempower draw. At the power levels studied, the laser drew just 17.5% of the overall power, with only3.45% being the laser beam itself. This puts the improvements in the laser–material interaction,such as those found by Goffin et al. [28], in perspective. While energy savings in laser beam powercan be a large fraction of the beam power, this still only represents a very small percentage ofthe overall system power. Previously unexplored potential exists to make savings in auxiliarysystems, with greater impact on the overall system power;
• When the laser power is increased, the proportion of overall power drawn by the laser systemalso increases. At a 240 W beam power, the laser system drew 28.9% of the total system power, ofwhich 6% was the laser beam, representing a significant increase from a 120 W laser beam power.This is because many of the auxiliary system power requirements are not directly influenced bythe laser itself and do not alter with the changes in the laser power. This means that a higherpower setting is more electrically efficient, for a given set of sub-systems;
• A significant level of power is drawn by the cooling system. Although it has a very stable powerdraw in both the pumping and cooling modes, the large difference in power between these modesand the fact that it switches between them during the process makes the overall energy usagedifficult to evaluate. More investigation is required to better characterise this pattern and identifyif there are any opportunities for efficiency improvements.
As a result of this, some areas have been identified for further development with others discounted;
• While the extraction pumping system itself is out of bounds for an investigation opportunity,it has been identified for better optimisation in the design of the extraction nozzle to reduce theoverall volume of air that needs to be evacuated in order to meet HSE requirements. This wouldgive a more effective extraction system for the same power draw, or a smaller power draw forequal effectiveness, allowing energy savings regardless of the specific type of extraction system;
• Making the laser itself more efficient is out of scope, but it is possible that further investigationinto welding optimisation would allow a reduction in the laser beam power. Given that the lasersystem efficiency is a fixed ratio, a reduction in direct energy would yield a proportional reductionin indirect energy, regardless of the specific laser system in use. In a similar way to that noted bySchmidt et al. [21] for individual sub-components, there is cross-talk between different energycategories within the same sub-component as well;
• A more sophisticated analysis of the CNC power draw is required. Differences between axisloading in x and y have yet to be addressed;
• A time-based analysis of the cooling system, after the fashion of Kellens et al. [9], is required toenable the relative shares of pumping and cooling used for any particular process. At present,just the power draw was recorded, but this further analysis will allow the power readings to beconverted to energy readings;
J. Manuf. Mater. Process. 2020, 4, 48 16 of 17
• The work completed here was carried on a system designed to be as close to a normal industrialsystem as possible, such that the results are relevant to industry. However, since this work wascarried out in a laboratory environment, further work is needed in industrial environmentsto better verify the results obtained here. Such work would also allow the identification ofareas where the existing methodology needs to be refined to account for the differences betweena laboratory study and industrial processes.
Author Contributions: Conceptualization, E.W., N.G., L.C.R.J. and J.T.; methodology, N.G. and E.W.;formal analysis, N.G.; investigation, N.G.; data curation, N.G.; writing—original draft preparation, N.G. andE.W.; writing—review and editing, N.G., E.W., L.C.R.J., J.T., J.O. and P.M.; visualization, N.G.; supervision, E.W.;project administration, E.W. and P.M.; funding acquisition, P.M., E.W. L.C.R.J. and J.T. All authors have read andagreed to the published version of the manuscript.
Funding: This research was funded by the EPSRC, grant number EP/S018190/1.
Acknowledgments: The authors wish to thank Mark Capers and Dave Britton for their helpful technical support.
Conflicts of Interest: The authors declare no conflict of interest.
References
1. Griffin, P.W.; Hammond, G.P.; Norman, J.B. Industrial energy use and carbon emissions reduction: A UKperspective. Wiley Interdiscip. Rev. Energy Environ. 2016, 5, 684–714. [CrossRef]
2. UK Department for Business Energy and Industrial Strategy. The Climate Change Act. 2008 (2050 Target.Amendment) Order 2019; UK Government: London, UK, 2019.
3. Energy Balance Sheets 2009–2010. Available online: https://ec.europa.eu/eurostat/documents/3217494/5747681/
KS-EN-12-001-EN.PDF/4d084c96-c54a-4149-aed3-e24ae09401a2 (accessed on 19 May 2020).4. United States Environmental Protection Agency. Draft Inventory of U.S. Greenhouse Gas. Emissions and Sinks:
1990–2018; EPA: Washington, DC, USA, 2020.5. Dyer, C.H.; Hammond, G.P.; Jones, C.I.; McKenna, R.C. Enabling technologies for industrial energy demand
management. Energy Policy 2008, 36, 4434–4443. [CrossRef]6. Duley, W.W. Laser Welding; John Wiley & Sons Ltd: New York, NY, USA, 1999.7. Gutowski, T.; Dahmus, J.; Thiriez, A. Electrical Energy Requirements for Manufacturing Processes.
In Proceedings of the 13th CIRP International Conference of Life Cycle Engineering, Lueven, Belgium,31 May–2 June 2006; pp. 623–628.
8. Kellens, K.; Rodrigues, G.C.; Dewulf, W.; Duflou, J.R. Energy and resource efficiency of laser cutting processes.Phys. Procedia 2014, 56, 854–864. [CrossRef]
9. Kellens, K.; Dewulf, W.; Overcash, M.; Hauschild, M.Z.; Duflou, J.R. Methodology for systematic analysisand improvement of manufacturing unit process life-cycle inventory (UPLCI)-CO2PE! initiative (cooperativeeffort on process emissions in manufacturing). Part 1: Methodology description. Int. J. Life Cycle Assess.2012, 17, 69–78. [CrossRef]
10. Duflou, J.R.; Sutherland, J.W.; Dornfeld, D.; Herrmann, C.; Jeswiet, J.; Kara, S.; Hauschild, M.; Kellens, K.Towards energy and resource efficient manufacturing: A processes and systems approach. Cirp Ann.Manuf. Technol. 2012, 61, 587–609. [CrossRef]
11. Rodrigues, G.S.; Ferreira, J.C.E.; Rocha, C.R. A novel method for analysis and optimization of electric energyconsumption in manufacturing processes. Procedia Manuf. 2018, 17, 1073–1081. [CrossRef]
12. Bajpai, A.; Fernandes, K.J.; Tiwari, M.K. Modeling, analysis, and improvement of integrated productivityand energy consumption in a serial manufacturing system. J. Clean. Prod. 2018, 199, 296–304. [CrossRef]
13. Seow, Y.; Rahimifard, S. A framework for modelling energy consumption within manufacturing systems.Cirp J. Manuf. Sci. Technol. 2011, 4, 258–264. [CrossRef]
14. Rahimifard, S.; Seow, Y.; Childs, T. Minimising embodied product energy to support energy efficientmanufacturing. Cirp Ann. Manuf. Technol. 2010, 59, 25–28. [CrossRef]
15. Seow, Y.; Goffin, N.; Rahimifard, S.; Woolley, E. A ‘Design for Energy Minimization’ approach to reduceenergy consumption during the manufacturing phase. Energy 2016, 109, 894–905. [CrossRef]
16. O’Hagan, J.B. Safety Aspects of Laser Displays. Radiat. Prot. Dosim. 1997, 72, 241–248. [CrossRef]17. Barat, K. Laser Safety Management; Taylor & Francis: Boca Raton, FL, USA, 2017.

J. Manuf. Mater. Process. 2020, 4, 48 17 of 17
18. Penchev, P.; Dimov, S.; Bhaduri, D.; Soo, S.L. Generic integration tools for reconfigurable laser micromachiningsystems. J. Manuf. Syst. 2016, 38, 27–45. [CrossRef]
19. Ready, J.F.; Farson, D.F. (Eds.) LIA Handbook of Laser Materials Processing Contents; LIA & Magnolia Publishing:Orlando, FL, USA, 2001.
20. Paul, R.; Anand, S. Process energy analysis and optimization in selective laser sintering. J. Manuf. Syst. 2012,31, 429–437. [CrossRef]
21. Schmidt, M.; Zäh, M.; Li, L.; Duflou, J.; Overmeyer, L.; Vollertsen, F. Advances in macro-scale laser processing.Cirp Ann. 2018, 67, 719–742. [CrossRef]
22. Wellburn, D.; Shang, S.; Wang, S.Y.; Sun, Y.Z.; Cheng, J.; Liang, J.; Liu, C.S. Variable beam intensity profileshaping for layer uniformity control in laser hardening applications. Int. J. Heat Mass Transf. 2014, 79,189–200. [CrossRef]
23. Mok, S.H.; Bi, G.; Folkes, J.; Pashby, I. Deposition of Ti–6Al–4V using a high power diode laser and wire,Part I: Investigation on the process characteristics. Surf. Coat. Technol. 2008, 202, 3933–3939. [CrossRef]
24. Riveiro, A.; Mejías, A.; Lusquiños, F.; Del Val, J.; Comesaña, R.; Pardo, J.; Pou, J. Laser cladding of aluminiumon AISI 304 stainless steel with high-power diode lasers. Surf. Coat. Technol. 2014, 253, 214–220. [CrossRef]
25. Bachmann, F. Industrial applications of high power diode lasers in materials processing. Appl. Surf. Sci.2003, 208, 125–136. [CrossRef]
26. Kell, J.; Tyrer, J.R.; Higginson, R.L.; Jones, J.C.; Noden, S. Laser weld pool management through diffractiveholographic optics. Mater. Sci. Technol. 2011, 28. [CrossRef]
27. Higginson, R.L.; Blackmur, M.; Gibson, M.; Tyrer, J. Grain Size Control in the Weld Pool and Heat AffectedZone Using Holograms. Mater. Sci. Forum 2012, 715–716, 340–345. [CrossRef]
28. Goffin, N.J.; Higginson, R.L.; Tyrer, J.R. The use of Holographic Optical Elements (HOE’s) to investigatethe use of a flat irradiance profile in the control of heat absorption in wire-fed laser cladding. J. Mater.Process. Technol. 2015. [CrossRef]
29. Goffin, N.; Tyrer, J.; Woolley, E. Complex beam profiles for laser annealing of thin-film CdTe photovoltaics.J. Laser Appl. 2018, 30, 042006. [CrossRef]
30. Baumers, M.; Tuck, C.; Bourell, D.L.; Sreenivasan, R.; Hague, R. Sustainability of additive manufacturing:Measuring the energy consumption of the laser sintering process. Proc. Inst. Mech. Eng. Part. B J. Eng. Manuf.2011, 225, 2228–2239. [CrossRef]
31. Baumers, M.; Dickens, P.; Tuck, C.; Hague, R. The cost of additive manufacturing: Machine productivity,economies of scale and technology-push. Technol. Soc. Chang. 2016, 102, 193–201. [CrossRef]
32. Kellens, K.; Renaldi, R.; Dewulf, W.; Kruth, J.P.; Duflou, J.R. Environmental impact modeling of selectivelaser sintering processes. Rapid Prototyp. J. 2014, 20, 459–470. [CrossRef]
33. BSI. BS ISO 14955-1:2017 Machine Tools—Environmental Evaluation of Machine Tools; BSI: London, UK, 2017.34. Lobo, L.; Williams, K.; Tyrer, J.R. The use of laser induced processing fume as a process measurand in the
feedback control of laser cutting. J. Laser Appl. 2003. [CrossRef]
© 2020 by the authors. Licensee MDPI, Basel, Switzerland. This article is an open accessarticle distributed under the terms and conditions of the Creative Commons Attribution(CC BY) license (http://creativecommons.org/licenses/by/4.0/).


![538 Laser Metrology and Machine Performance · 538 Laser Metrology and Machine Performance presented by Dong et al, [3-6], together with a number of suggested Parameters for characterisation](https://img.dokumen.tips/doc/110x75/5e873bf202d8e971887f3ba0/538-laser-metrology-and-machine-performance-538-laser-metrology-and-machine-performance.jpg)