Embed Size (px)
Citation preview

§1

Chapter 11
Long-‐Term Liabilities Notes, Bonds, and Leases
§2
Long-‐Term Liabilities� Many companies finance their operations and growth opportunities through the use of long term debt instruments:� Notes Payable – Formal borrowing agreement
� Bonds Payable – Issued to bondholders, smaller dollar amounts and larger amount of notes
� Leasehold Obligations – future cash payments for use of an asset
§3

The Relative Size of Long-‐Term Liabilities
§4
Figure 11-1 Long-term liabilities as a percentage of total assets, total liabilities, and shareholders’ equity

Economic Consequences of Reporting Long-‐Term Liabilities
§5
�Improved credit ratings can lead to lower borrowing costs
�Management has strong incentive to manage the balance sheet by using “off-balance-sheet financing”
Basic Definitions and Different Contractual Forms
§6
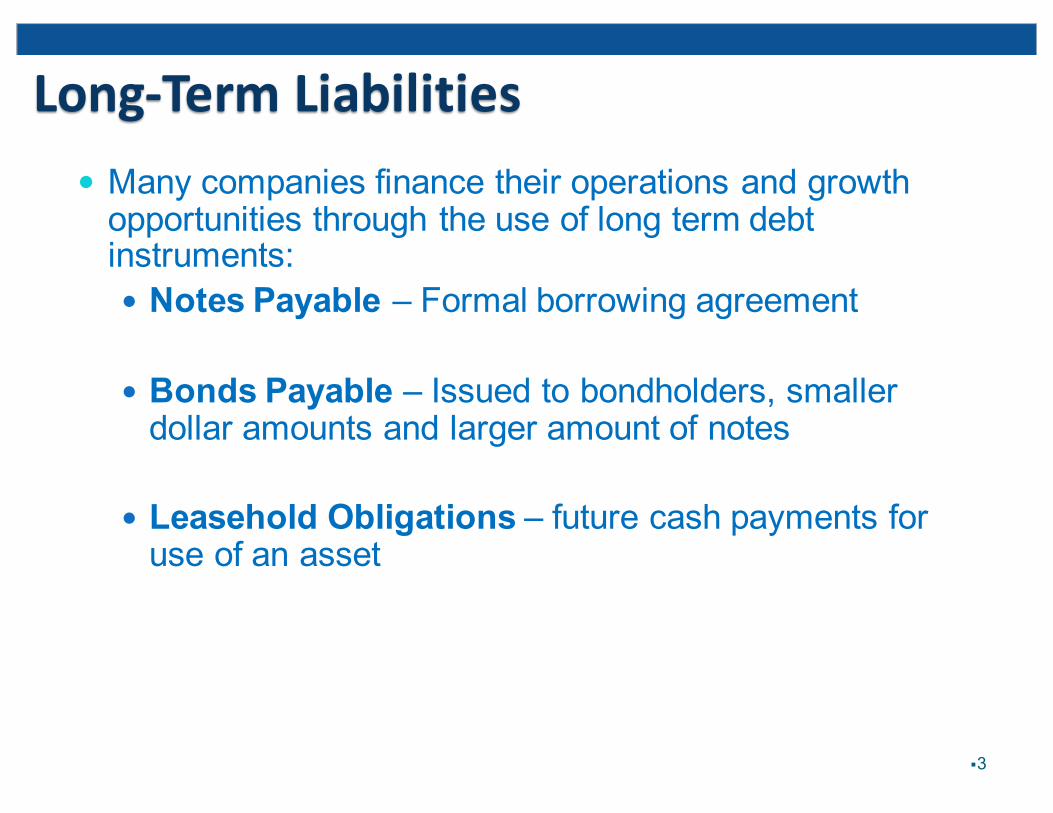
• Some contracts, called interest-bearing obligations, require periodic (annual or semiannual) cash payments (called interest) that are determined as a percentage of the face, principal, or maturity value, which must be paid at the end of the contract period.
• Non-interest-bearing obligations, on the other hand, require no periodic payments, but only a single cash payment at the end of the contract period.
• These contractual forms may contain additional terms that specify assets pledged as security or collateral in case the required cash payments are not met (default), as well as additional provisions (restrictive covenants).

Basic Definitions and Different Contractual Forms
§7
Figure 11-2 Six possible kinds of notes

� Long-term liabilities are recorded at the present value of the future cash flows.
� Two components determine the “time value” of money:� interest (discount) rate� number of periods of discounting
� Types of activities that require PV calculations:� notes payable� bonds payable and bond investments� capital leases
§8
Long-Term Liabilities Notes, Bonds, and Leases
Accounting for Long-‐Term Notes Payable
§9
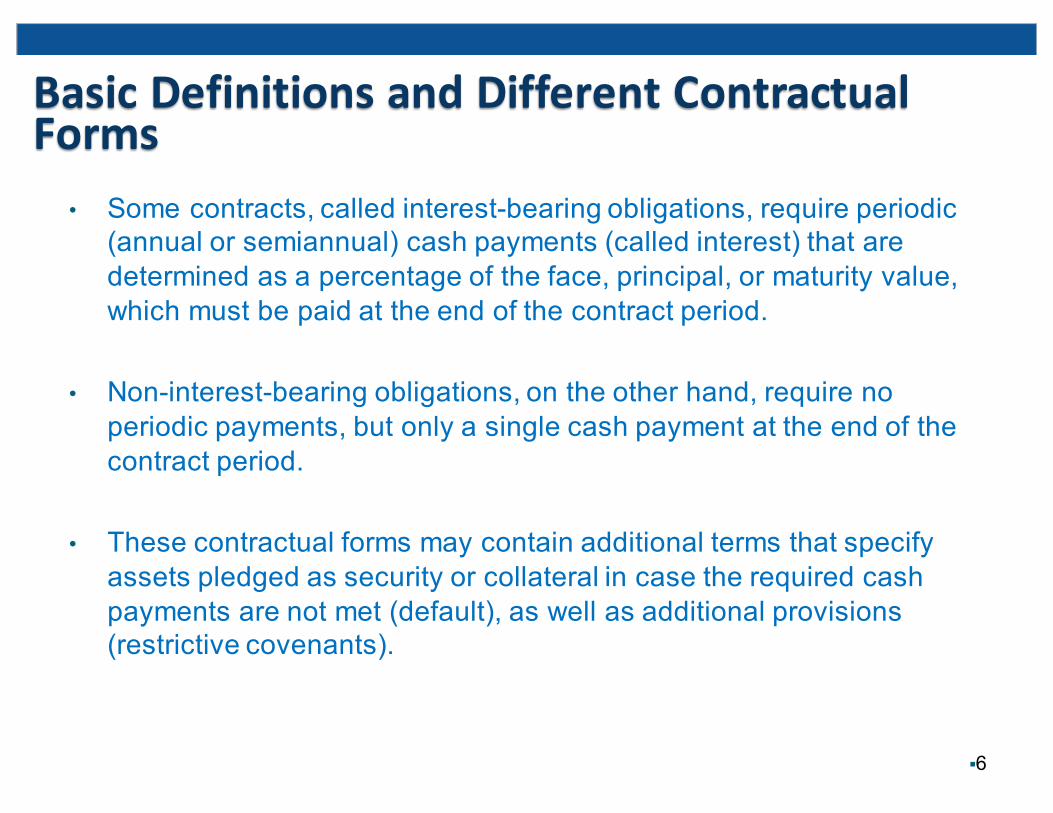
Figure 11-3 Accounting for non-interest-bearing note in exchange for equipment

Present Value of a Single SumAll present value calculations presume a discount rate (i) and a number of periods of discounting (n). There are 3 different ways you can calculate the PV1:
1. Formula: PV1 = FV1 [1/(1+i)n]
2. Tables – near the back of your book
3. Financial Calculator (time value of money).
§10

Long-‐term Notes PayableExample Problem 1: On January 2, 2014, Pearson Company purchases a section of land for its new plant site. Pearson issues a 5 year non-interest bearing note, and promises to pay $50,000 at the end of the 5 year period. What is the cash equivalent price of the land, if a 6 percent discount rate is assumed?
PV1 = 50,000 x ( 0.74726) = $37,363 [ i=6%, n=5] (0.74726 from PV Table)
Journal entry Jan. 2, 2008:
Dr. Land 37,363Dr. Discount on N/P 12,637
Cr. Notes Payable 50,000 §11

Long-‐term Notes Payable – Ex. Prob 1 cont’dThe Effective Interest Method:Interest Expense =
Carrying value x Interest rate x Time period(CV) (Per year) (Portion of year)
Where carrying value = face - discount.
For Example 1, CV= 50,000 - 12,637 = 37,363Interest expense = 37,363 x 6% per year x 1year
= $2,242
§12

Long-‐term Notes Payable – Ex. Prob 1 cont’d
§13
Journal entry, December 31, 2014:
Carrying value on B/S at 12/31/2014:
(Discount = $12,637 - 2,242 = $10,395)
Interest expense 2,242Discount on N/P 2,242
Notes Payable $50,000Discount on N/P (10,395) $39,605

Long-‐term Notes Payable – Ex. Prob 1 cont’d
§14
$50,000
Interest expense at Dec. 31, 2015:39,605 x 6% x 1 = $2,376
Journal entry, December 31, 2015:
Carrying value on B/S at 12/31/2015:
(Discount = 10,395 - 2,376)
Carrying value on 12/31/2018 (before retirement)?
Interest expense 2,376Discount on N/P 2,376
Notes Payable $50,000Discount on N/P (8,019) $41,981

Bonds Payable
§15
Figure 11-4 (partial) Bond Terminology
Bonds Payable Example
§16
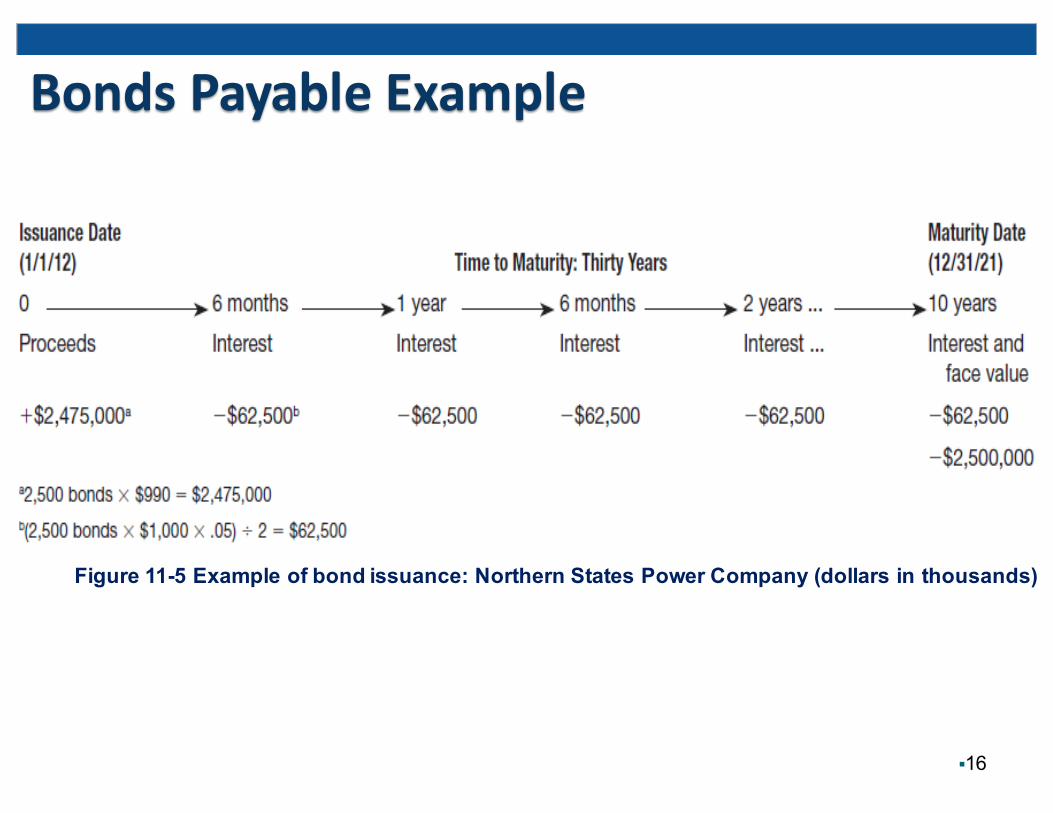
Figure 11-5 Example of bond issuance: Northern States Power Company (dollars in thousands)

The Price of a Bond
§17
Figure 11-6 Bond prices and the relationship between the effective rate and the stated rate (bond terms: $1,000 face value, a 6 percent stated rate, and
a five-year life)

Case 1: Bonds at ParCase 2: Bonds at a DiscountCash Flows for Bonds Payable
§18
Figure 11-7 Cash flows for bonds payable: Two cases compared

Case 1: Bonds Issued at Par
§19
Figure 11-8 Bonds issuedat face value: Case 1
Bonds Payable at a Discount� If bonds are issued at a discount, the carrying value will be below face value at the date of issue.
� The Discount on B/P account has a normal debit balance and is a contra to B/P (similar to the Discount on N/P).
� The Discount account is amortized with a credit. Note that the difference between Cash Paid and Interest Expense is still the amount of amortization.
� Interest expense for bonds issued at a discount will be greater than cash paid.
� The amortization table will show the bonds amortized up to face value.
§20

Case 2: Bonds Issued at a Discount
§21
Figure 11-9 Bonds issued at a discount: Case 2

Issuing Bonds at Par and at a Discount: A ComparisonAmortization Tables
§22
Figure 11-10 Bonds amortization tables

Present Value of an Ordinary Annuity (PVOA)PVOA calculations presume a discount rate (i), where (A) = the amount of each annuity, and (n) = the number of annuities (or rents), which is the same as the number of periods of discounting. There are 3 different ways you can calculate PVOA:
1. Formula: PVOA = A [1-(1/(1+i)n)] / i
2. Tables: near the back of you book
3. Financial Calculator (time value of money).§23
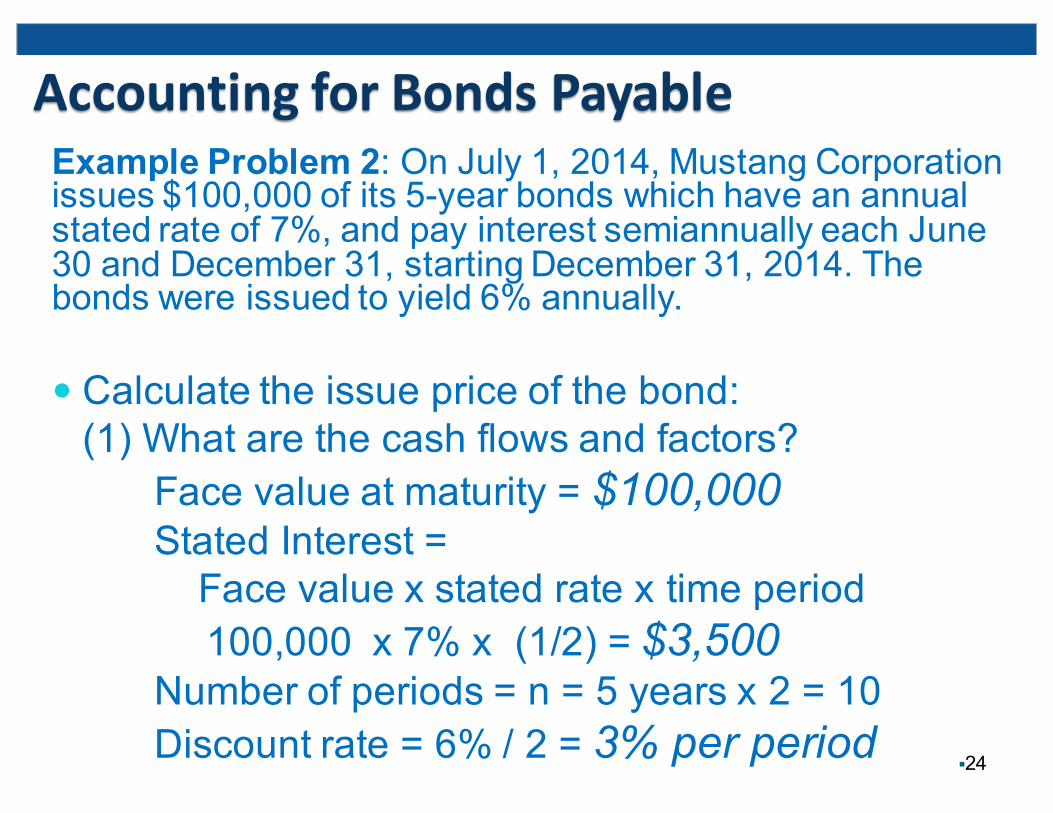
Accounting for Bonds PayableExample Problem 2: On July 1, 2014, Mustang Corporation issues $100,000 of its 5-year bonds which have an annual stated rate of 7%, and pay interest semiannually each June 30 and December 31, starting December 31, 2014. The bonds were issued to yield 6% annually.
� Calculate the issue price of the bond:(1) What are the cash flows and factors?
Face value at maturity = $100,000Stated Interest =Face value x stated rate x time period100,000 x 7% x (1/2) = $3,500
Number of periods = n = 5 years x 2 = 10Discount rate = 6% / 2 = 3% per period
§24
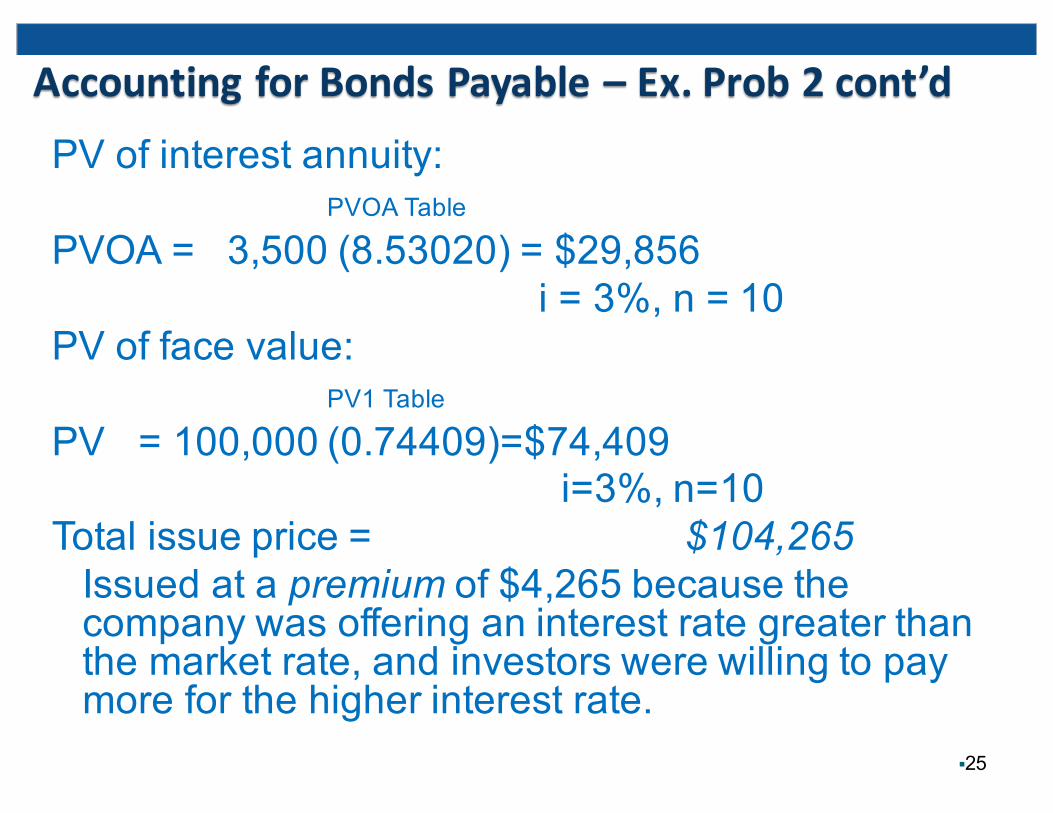
Accounting for Bonds Payable – Ex. Prob 2 cont’dPV of interest annuity:
PVOA Table
PVOA = 3,500 (8.53020) = $29,856 i = 3%, n = 10
PV of face value: PV1 Table
PV = 100,000 (0.74409)=$74,409 i=3%, n=10
Total issue price = $104,265Issued at a premium of $4,265 because the company was offering an interest rate greater than the market rate, and investors were willing to pay more for the higher interest rate.
§25
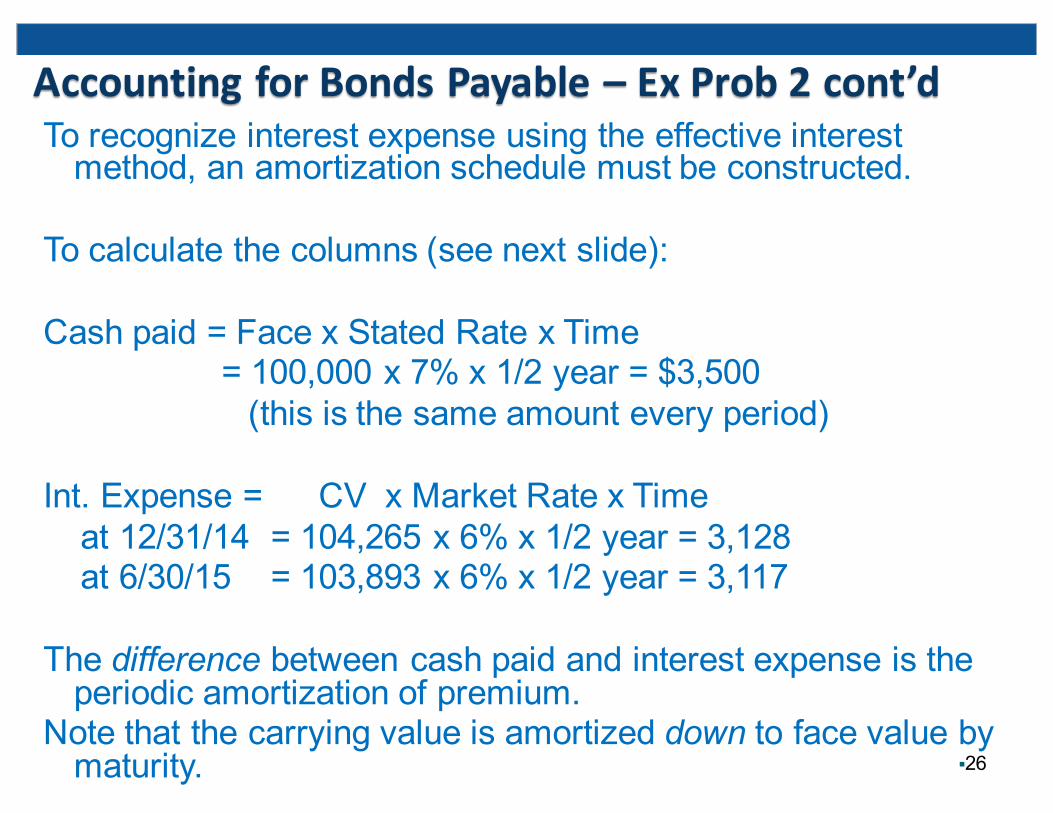
Accounting for Bonds Payable – Ex Prob 2 cont’dTo recognize interest expense using the effective interest method, an amortization schedule must be constructed.
To calculate the columns (see next slide):
Cash paid = Face x Stated Rate x Time= 100,000 x 7% x 1/2 year = $3,500(this is the same amount every period)
Int. Expense = CV x Market Rate x Timeat 12/31/14 = 104,265 x 6% x 1/2 year = 3,128at 6/30/15 = 103,893 x 6% x 1/2 year = 3,117
The difference between cash paid and interest expense is the periodic amortization of premium.
Note that the carrying value is amortized down to face value by maturity. §26
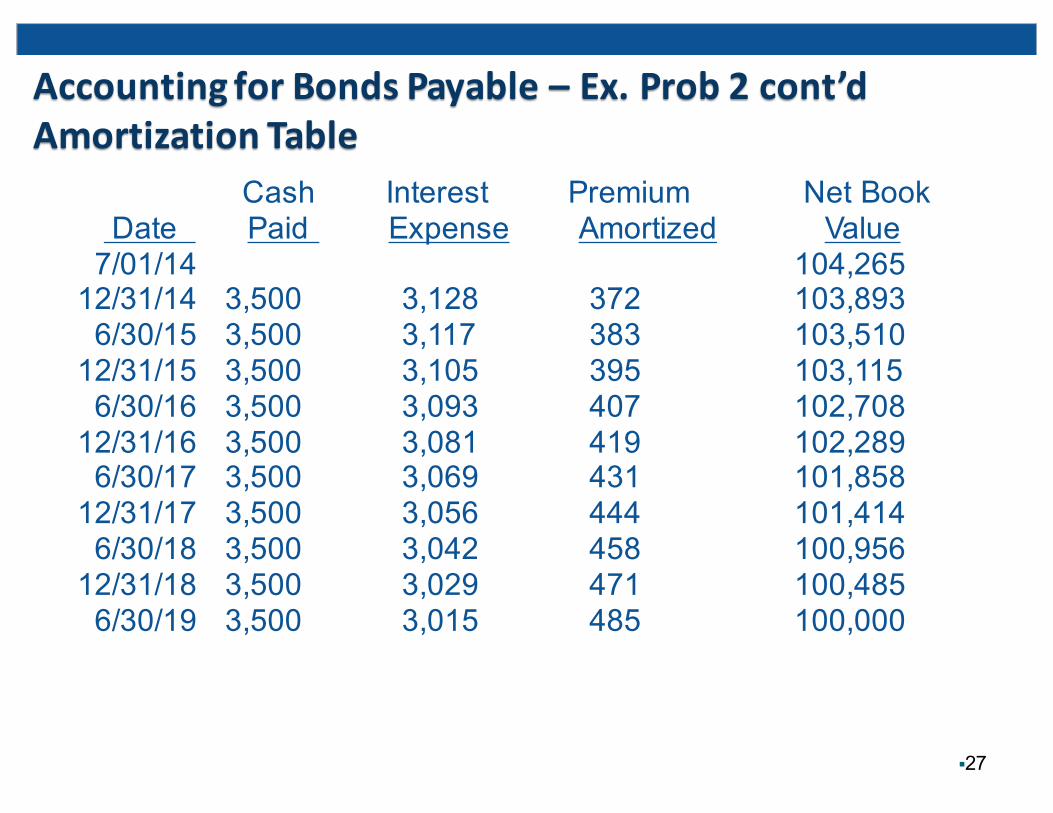
Accounting for Bonds Payable – Ex. Prob 2 cont’dAmortization Table
Cash Interest Premium Net BookDate Paid Expense Amortized Value7/01/14 104,26512/31/14 3,500 3,128 372 103,8936/30/15 3,500 3,117 383 103,51012/31/15 3,500 3,105 395 103,1156/30/16 3,500 3,093 407 102,70812/31/16 3,500 3,081 419 102,2896/30/17 3,500 3,069 431 101,85812/31/17 3,500 3,056 444 101,4146/30/18 3,500 3,042 458 100,95612/31/18 3,500 3,029 471 100,4856/30/19 3,500 3,015 485 100,000
§27
Accounting for Bonds Payable – Ex. Prob 2 cont’dJournal Entries
§28
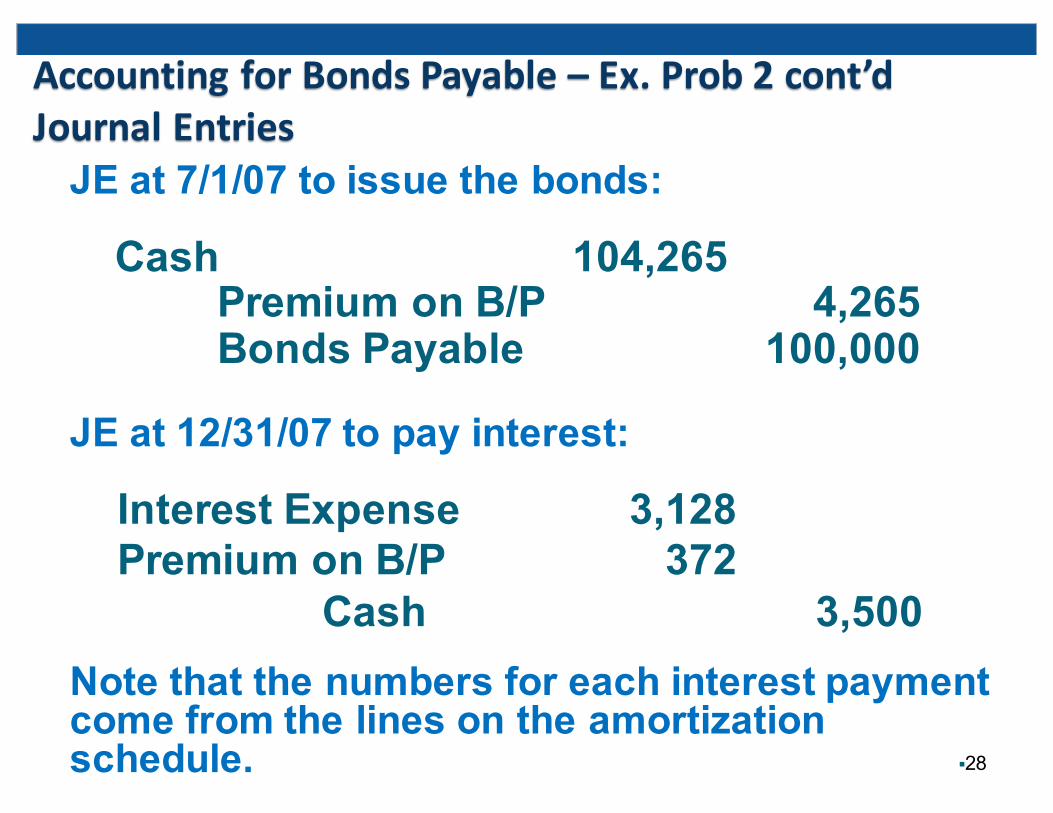
JE at 7/1/07 to issue the bonds:
JE at 12/31/07 to pay interest:
Note that the numbers for each interest payment come from the lines on the amortization schedule.
Cash 104,265Premium on B/P 4,265Bonds Payable 100,000
Interest Expense 3,128Premium on B/P 372
Cash 3,500

Bond Redemptions
§29
• When bonds are redeemed at the maturity date, the issuing company simply pays cash to the bondholders in the amount of the face value and removes the bond payable from the balance sheet.
• To illustrate the redemption of a bond issuance prior to maturity at a loss, assume that bonds with a $100,000 face value and a $5,000 unamortized discount are redeemed for $102,000. The $7,000 loss on redemption would decrease net income.

Leases• A contract granting use of occupation of property during a specified period of time in exchange for rent payments. • Land• Buildings• Machinery• Equipment
• Avoid risks and associated costs of ownership
Operating Leases – pure rental agreement where the lessor maintains all ownership responsibilities
Off-Balance-Sheet Financing
Capital Leases – Risks and benefits of ownership have effectively transferred to the lessee
§30

Leases (cont’d)• FASB issued SFAS No. 13, requires certain leases to be recorded as capital leases.
• Capital leases record the leased asset as a capital asset, and reflect the present value of the related payment contract as a liability.
• Requirements of SFAS No. 13 - record as capital lease for the lessee if any one of the following is present in the lease:• Title transfers at the end of the lease period,• The lease contains a bargain purchase option,• The lease life is at least 75% of the useful life of the asset, or
• The lessee pays for at least 90% of the fair market value of the lease. §31

Capital Lease
§32
Figure 11-11 Accounting for a capital lease: Hitzelberger Supply

International Perspective � The accounting disclosure requirements in non-U.S. countries and IFRS are not as comprehensive as those in the United States, partially because the information needs of the major capital providers (i.e., banks) are satisfied in a relatively straightforward way—through personal contact and direct visits.
� A second way in which the heavy reliance on debt affects non-U.S. accounting systems is that the required disclosures and regulations tend to be designed either to protect the creditor or to help in the assessment of solvency.
§33

Appendix 11A – The Determination of Bond Prices� Determine the Effective (Actual) Rate of Return
� Determine the Required Rate of Return
� Determine the Risk-Free Return
� Determine the Risk Premium
� Compare the Effective Rate to the Required Rate
§34

Appendix 11B – Investing in Bonds
§35
Figure 11B-1 Accounting for held-to-maturitybond investments

Appendix 11C – Interest Rate Swaps and Hedging
§36
• A common method used by companies to reduce such risks is called hedging, where a company enters into a contract that creates risks that counteract or balance the risks attempted to be hedged (reduced). The most common method of hedging market interest rate risk is called an interest rate swap.

Copyright © 2014 John Wiley & Sons, Inc. All rights reserved. Reproduction or translation of this work beyond that permitted in Section 117 of the 1976 United States Copyright Act without the express written permission of the
copyright owner is unlawful. Request for further information should be addressed to the Permissions Department, John Wiley & Sons, Inc. The purchaser may make back-up copies for his/her own use only and not for distribution or resale. The Publisher assumes no responsibility for errors, omissions, or damages, caused by the use of these programs or from the
use of the information contained herein.
§37