Embed Size (px)
Citation preview

23
Wulannita Andika, 2013 Pengaruh Dari Implementasi Tipe Pengelompokan Untuk Meningkatkan Hasil Belajar Dan Interaksi Siswa Pada Topik Pencemaran Lingkungan Pada Siswa Sekolah Menengah Pertama Universitas Pendidikan Indonesia | repository.upi.edu| perpustakaan.upi.edu
CHAPTER III
METHODOLOGY
A. Population and Sample
Population of this study comprises of 7th
grade in one of public junior high school
located in Bandung, Indonesia. One class was chosen as sample of this study, it
consisted of 28 students enrolled in even semester which is chosen by purposive
sampling.
B. Time and Location
1. Time
Research was conducted from February 2013 until June 2013. Preparation stage was
conducted from February 2013 until April 2013, implementation stage was
conducted in May 2013 and final stage was conducted in June 2013.
2. Location
Research was conducted in one of public junior high school located in Bandung,
Indonesia.
C. Research Method
Quantitative method was used n this research. Quantitative research method is
explaining phenomena by collecting numerical data that are analysed using
mathematically based methods (Aliaga and Gunderson, 2000). Research method used
in this research is pre experiment method as the purpose of the reserach is appropiate
with this method.
D. Research Design
One group pretest-posttest group design is research design that is used in this
research. Design determination is considered based on purpose of research to investigate
the implementation of grouping type. Hence, the characteristic of design is eventually

24
Wulannita Andika, 2013 Pengaruh Dari Implementasi Tipe Pengelompokan Untuk Meningkatkan Hasil Belajar Dan Interaksi Siswa Pada Topik Pencemaran Lingkungan Pada Siswa Sekolah Menengah Pertama Universitas Pendidikan Indonesia | repository.upi.edu| perpustakaan.upi.edu
compatible with the purpose of research. In this design, one experimental group is
arranged to be investigated by given pre-test before the implementation of treatment.
The purpose of this step is to investigate student prior skills. Further, the group is given
some treatment of grouping type, as the effort to improve student’ achievement. Finally,
the step is ended by giving posttest in a way to analyze the result of implementation. For
further description, research design is illustrated in the following table.
Experimental Group
Figure 3.1 Design Illustration of one group Pretest-Posttest
Note :
T1 = Pre test
T2 = Post test
X = Treatment by using Grouping type
This research took one class that treated by using two grouping type in the same
chapter about pollution and environmental damage concept. The one sub-topic about
water pollution has treated by using a homogeneous group and the next sub-chapter
about air pollution has treated by using heterogeneous group. Every group in
homogeneous and heterogeneous is consisted of 4-5 students. During the learning
activity, each group investigated patterns of interaction by an observer using
observation sheet that has been judgment. Besides observation sheets, there is also a
questionnaire given to the students to find out students' responses to the grouping type.
1. Determine the level of student’ ability
This research used results of pre-test to determine student ability level and
categorized them into low, medium and high. According Arikunto (2006), to determine
the position of a group of students at a high, medium or low, can be done by using the
standard deviation.
T1 T2 X
25
Wulannita Andika, 2013 Pengaruh Dari Implementasi Tipe Pengelompokan Untuk Meningkatkan Hasil Belajar Dan Interaksi Siswa Pada Topik Pencemaran Lingkungan Pada Siswa Sekolah Menengah Pertama Universitas Pendidikan Indonesia | repository.upi.edu| perpustakaan.upi.edu
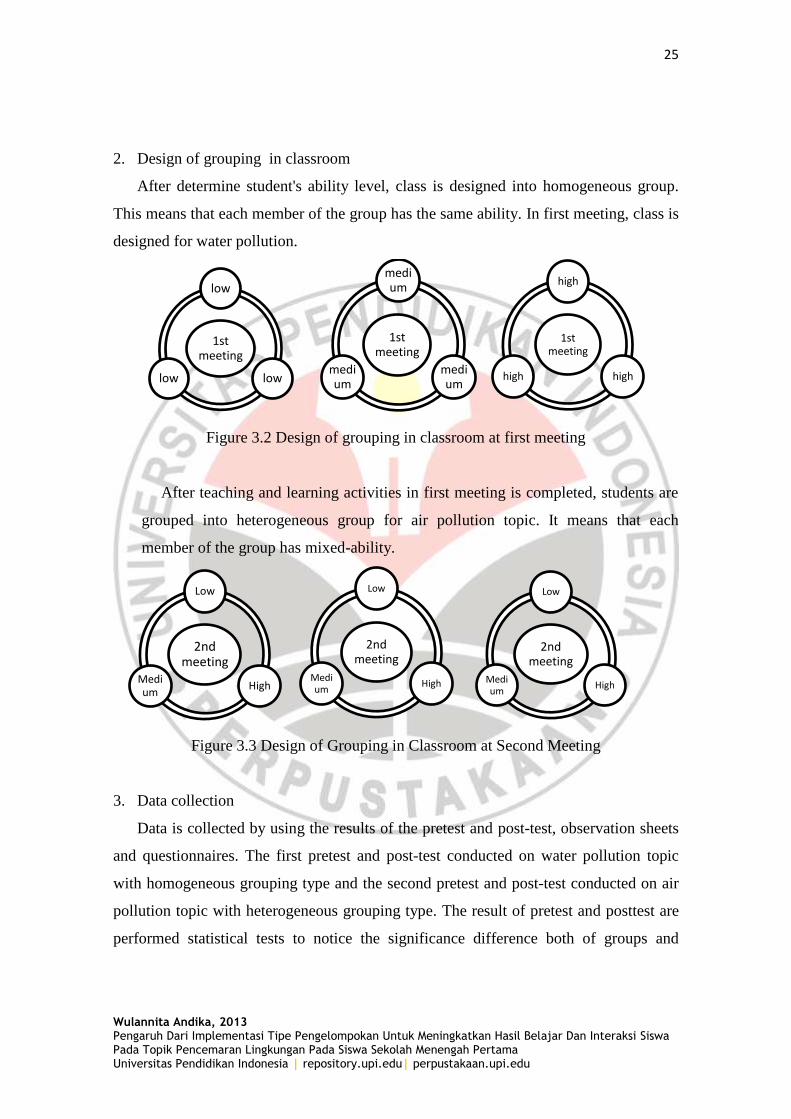
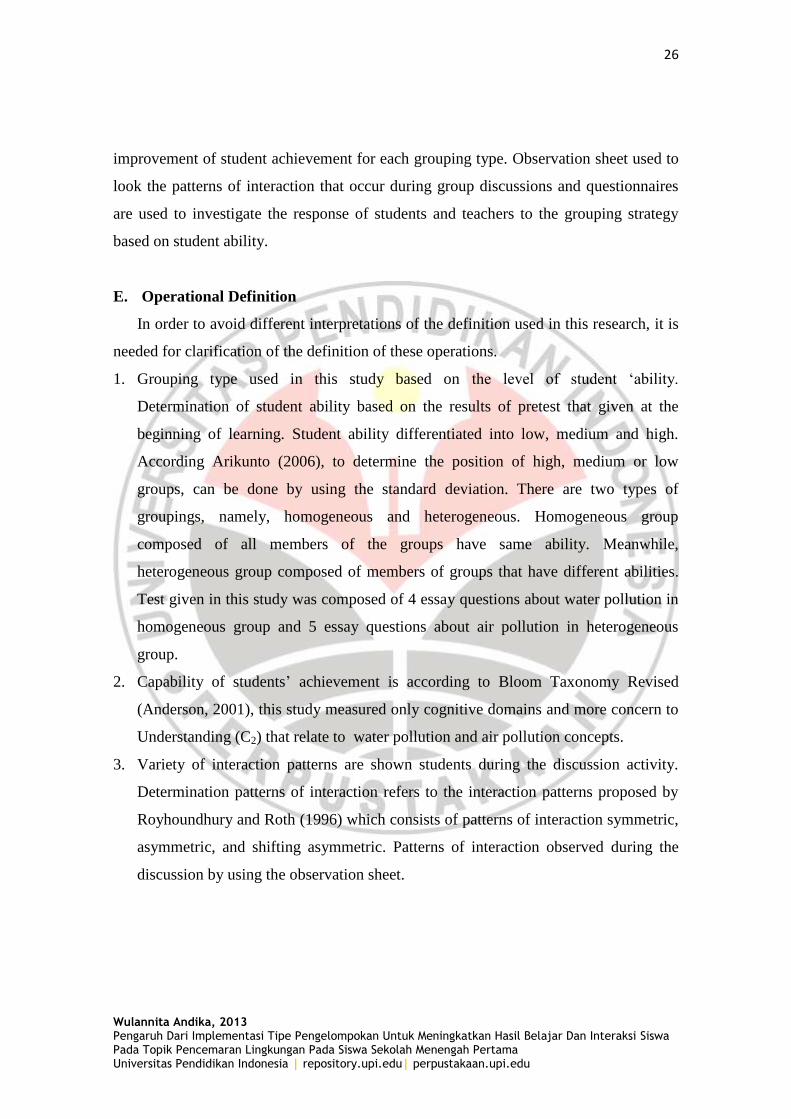
2. Design of grouping in classroom
After determine student's ability level, class is designed into homogeneous group.
This means that each member of the group has the same ability. In first meeting, class is
designed for water pollution.
Figure 3.2 Design of grouping in classroom at first meeting
After teaching and learning activities in first meeting is completed, students are
grouped into heterogeneous group for air pollution topic. It means that each
member of the group has mixed-ability.
Figure 3.3 Design of Grouping in Classroom at Second Meeting
3. Data collection
Data is collected by using the results of the pretest and post-test, observation sheets
and questionnaires. The first pretest and post-test conducted on water pollution topic
with homogeneous grouping type and the second pretest and post-test conducted on air
pollution topic with heterogeneous grouping type. The result of pretest and posttest are
performed statistical tests to notice the significance difference both of groups and
1st meeting
low
low low
1st meeting
medium
medium
medium
1st meeting
high
high high
2nd meeting
Low
High Medium
2nd meeting
Low
High Medium
2nd meeting
Low
High Medium
26
Wulannita Andika, 2013 Pengaruh Dari Implementasi Tipe Pengelompokan Untuk Meningkatkan Hasil Belajar Dan Interaksi Siswa Pada Topik Pencemaran Lingkungan Pada Siswa Sekolah Menengah Pertama Universitas Pendidikan Indonesia | repository.upi.edu| perpustakaan.upi.edu
improvement of student achievement for each grouping type. Observation sheet used to
look the patterns of interaction that occur during group discussions and questionnaires
are used to investigate the response of students and teachers to the grouping strategy
based on student ability.
E. Operational Definition
In order to avoid different interpretations of the definition used in this research, it is
needed for clarification of the definition of these operations.
1. Grouping type used in this study based on the level of student ‘ability.
Determination of student ability based on the results of pretest that given at the
beginning of learning. Student ability differentiated into low, medium and high.
According Arikunto (2006), to determine the position of high, medium or low
groups, can be done by using the standard deviation. There are two types of
groupings, namely, homogeneous and heterogeneous. Homogeneous group
composed of all members of the groups have same ability. Meanwhile,
heterogeneous group composed of members of groups that have different abilities.
Test given in this study was composed of 4 essay questions about water pollution in
homogeneous group and 5 essay questions about air pollution in heterogeneous
group.
2. Capability of students’ achievement is according to Bloom Taxonomy Revised
(Anderson, 2001), this study measured only cognitive domains and more concern to
Understanding (C2) that relate to water pollution and air pollution concepts.
3. Variety of interaction patterns are shown students during the discussion activity.
Determination patterns of interaction refers to the interaction patterns proposed by
Royhoundhury and Roth (1996) which consists of patterns of interaction symmetric,
asymmetric, and shifting asymmetric. Patterns of interaction observed during the
discussion by using the observation sheet.

27
Wulannita Andika, 2013 Pengaruh Dari Implementasi Tipe Pengelompokan Untuk Meningkatkan Hasil Belajar Dan Interaksi Siswa Pada Topik Pencemaran Lingkungan Pada Siswa Sekolah Menengah Pertama Universitas Pendidikan Indonesia | repository.upi.edu| perpustakaan.upi.edu
F. Research Instrument
This research observed through test and non test instruments. Test instrument
consist of pre-test and post test, meanwhile another non test instrument is arranged in
the form of observation sheet, student and teacher questionnaires. The instruments will
be elaborated as the following explanation.
1. Test
Test consists of pretest and posttest. Pretest is given at the beginning of the meeting
before the learning activity. Pretest is used to determine the level of student
understanding, and structure of the group formed by the students' ability levels, low,
medium and high. Post-test is given at the end of the discussion; post test is used to
measure students' achievement of the concept after learning activity. The type of
question used is essay question about water and air pollutions. Blueprint of pretest and
posttest of water pollution in homogeneous group in the following Table 3.1.
Table 3.1 Blueprint of pretest and post-test of water pollution (homogenous group)
Indicator Question Test item
number
Identify characteristic of
contaminated water
Besides the above quoted article,
how do you know the
characteristics that Cisadane river
polluted?
1
Explain impact of water
pollution
According to you, what is the
impact of pollution in the river
Cisadane on living things and the
surrounding environment?
2
Make the design of experiments to
prove that the pollution in the river
Cisadane affect living thing which
is live in that river?
3
Explain efforts to prevent
and solve the problem of
water pollution in
environment
What efforts should be made to
prevent and reduce the impact of
water pollution? At least 3 efforts 4

28
Wulannita Andika, 2013 Pengaruh Dari Implementasi Tipe Pengelompokan Untuk Meningkatkan Hasil Belajar Dan Interaksi Siswa Pada Topik Pencemaran Lingkungan Pada Siswa Sekolah Menengah Pertama Universitas Pendidikan Indonesia | repository.upi.edu| perpustakaan.upi.edu
Meanwhile, blueprint of pretest and posttest of air pollution in heterogeneous group
in the following Table 3.2.
Table 3.2 Blueprint of pretest and post-test of air pollution (heterogeneous group)
Indicator Question Test item
number
Mention cause of air
pollution
Based on article above, what causes
air quality in the city of Bandung
decreased?
1
Mention cause of air
pollution
Mention substances (pollutants)
that can cause air pollution? 2
Explain impact of air
pollution
Make the design of experiments to
prove that air pollution in your
community.
3
What is the impact caused by the
air quality in the city decreased? 4
Explain efforts to
prevent and solve the
problem of air pollution
in environment
What efforts should be made to
prevent and reduce the impact of air
pollution? Minimum of 3 efforts. 5
Before the instrument used in the research, the instrument must be tested first for
validity, and then analyzed whether the instrument is valid to be used as an
instrument to take the data.
a. Analysis of test instruments
Test is tested on class VII-F which already learned materials about water
pollution and air pollution at the same school with the number of students 30. The
following test instrument test analysis included:
1) Reliability
Reliability is the degree of consistency and stability of the instrument .Thus, the
concept of reliability has the meaning where the research tools is consistence and
stable, and hence predictable and accurate (Kumar ,2005). In other words, reliable

29
Wulannita Andika, 2013 Pengaruh Dari Implementasi Tipe Pengelompokan Untuk Meningkatkan Hasil Belajar Dan Interaksi Siswa Pada Topik Pencemaran Lingkungan Pada Siswa Sekolah Menengah Pertama Universitas Pendidikan Indonesia | repository.upi.edu| perpustakaan.upi.edu
instrument is decipherable ad the tool that gives same result when the measurement
is given into the same subject whenever, wherever, and whoever it is implemented
(Suherman, 2003). Not affected by the behavior, circumstances, and conditions.
High reliability measurement tool called a reliable gauge. Reliability was
determined from the value of the reliability coefficient.
Then, the reliability coefficient obtained interpreted in classification reliability
coefficient according to Suherman (2003) are presented on the Table 3.3 below:
Table 3.3 Classification of reliability coefficient
Correlation coefficient Interpretation
0,81 - 1,00 Very high
0,61 - 0,80 High
0,41 - 0,60 Medium
0,21 - 0,40 Low
0,00 - 0,20 Very low
According to result’s test trial obtained the correlation coefficient of instrument
of water pollution topic is shown on the Table 3.4 below:
Table 3.4 Result of reliability of water pollution topic
Correlation coefficient Interpretation
0.65 High
From the Table 3.12 above, it is seen clearly that result’s test trial obtained the
correlation coefficient of instrument as much as 0.65. It means that reliability of
instrument is high. Meanwhile, according to result’s test trial obtained the
correlation coefficient of instrument of air pollution topic is shown on the Table 3.5
below:

30
Wulannita Andika, 2013 Pengaruh Dari Implementasi Tipe Pengelompokan Untuk Meningkatkan Hasil Belajar Dan Interaksi Siswa Pada Topik Pencemaran Lingkungan Pada Siswa Sekolah Menengah Pertama Universitas Pendidikan Indonesia | repository.upi.edu| perpustakaan.upi.edu
Table 3.5 Result of reliability of air pollution topic
Correlation coefficient Interpretation
0.51 Medium
From the Table 3.13 above, it is seen clearly that result’s test trial obtained the
correlation coefficient of instrument as much as 0.51. It means that reliability of
instrument is medium.
2) Validity
In the term of measurement procedure, validity is the ability of an instrument to
measure what is measured (Kumar, 2005). The validity of the instrument itself is
depended on the effectiveness of its function in measuring data that is supposed to
be collected for the needs of research.
There is various type of validity measurement. In this research, constructive
validity is used in evaluating instrument. Meanwhile, to calculate the validity of test
item, it is proposed to use the formula of correlation of Pearson Product-Moment
Correlation. Moreover, the interpretation of rxy is classified into some categories.
The categories are arranged based on Guilford (Suherman, 2003) and described as
the following Table.
Table 3.6 Validity coefficient classifications
Value Interpretation
0,90 ≤ ≤ 1,00 Very high
0,70 ≤ <0,90 High
0,40 ≤ < 0,70 Average
0,20 ≤ < 0,40 Low
0,00 ≤ < 0,20 Very low
< 0,00 Invalid

31
Wulannita Andika, 2013 Pengaruh Dari Implementasi Tipe Pengelompokan Untuk Meningkatkan Hasil Belajar Dan Interaksi Siswa Pada Topik Pencemaran Lingkungan Pada Siswa Sekolah Menengah Pertama Universitas Pendidikan Indonesia | repository.upi.edu| perpustakaan.upi.edu
3) Difficulty index
A good test item is neither too easy nor too difficult. A scale that shows the
difficulty level of test item is difficulty index (Arikunto, 2008). The equation which
is used to calculate the difficulty level is:
With:
P = difficulty level
B = amount of student who answer question with the right answer
JS = total amount of students who undertakes the test
Then, Classification of difficulty level according to (Suherman, 2003) is
presented on the Table 3.7 below:
Tabel 3.7 Classification of difficulty index
4) Discrimination Power
Discrimination Power of item test represent how strong the test item in
differentiating between the sample that able to proposed right answer and wrong
answer/ blank answer (Suherman,2003). If the test and an item measure the same
ability or competence, we would expect that those having a high overall test score
would have a high probability of being able to answer the item. We would also
expect the opposite, which is to say that those having low test scores would have a
low probability of answering the item correctly. Thus, a good item should
discriminate between those who score high on the test and those who score low.
Di Value Level of difficulty
Di=0,00 Very hard
0,00 < Di 0,30 Hard
0,30< Di 0,70 Average
0,70< Di <1,00 Easy
Di= 1,00 Very Easy
P =

32
Wulannita Andika, 2013 Pengaruh Dari Implementasi Tipe Pengelompokan Untuk Meningkatkan Hasil Belajar Dan Interaksi Siswa Pada Topik Pencemaran Lingkungan Pada Siswa Sekolah Menengah Pertama Universitas Pendidikan Indonesia | repository.upi.edu| perpustakaan.upi.edu
Indeed, discrimination power is supposed to give verification that the test item
can be used to differentiate between high achiever and low achiever. The formula to
determine discrimination power is formulated as :
MS
laXhaXDP
Note :
DP : discrimination Power
haX : Average score of high achiever group
laX
: Average score of high achiever group
SMI : Maximum Score
Likewise, the classification of DP coefficient is described as the following Table
3.8 (Suherman , 2003)
Table 3.8 Classification of Discrimination Power Coefficient
Recapitulations of validity test item about uniformly accelerated motion concept
inform of multiple choice question that shown on the Table 3.9 below:
Table 3.9 Recapitulation of validity test item of water pollution topic
Question
number
Discriminating
power
Interpretation Difficulty
level
Validity Conclusion
Value Interpretat
ion
1 0.32 Average Easy 0.600 Average Valid
2 0.21 Average Medium 0.627 Average Valid
3 0.38 Average Easy 0.794 High Valid
4 0.42 Good Easy 0.726 High Valid
DP score Interpretation
Very low
Low
Average
Good
Very good

33
Wulannita Andika, 2013 Pengaruh Dari Implementasi Tipe Pengelompokan Untuk Meningkatkan Hasil Belajar Dan Interaksi Siswa Pada Topik Pencemaran Lingkungan Pada Siswa Sekolah Menengah Pertama Universitas Pendidikan Indonesia | repository.upi.edu| perpustakaan.upi.edu
According to the Table 3.9, it can be seen that from 4 questions is taken all of
questions to be instrument for determine students’ achievement.
Table 3.10 Recapitulation of validity test item of air pollution topic
Question
number
Discriminating
power
Interpretation Difficulty
level
Validity Conclusion
Value Interpretat
ion
1 0.1 Low Very Easy 0.23 Low Valid
2 0.15 Low Very easy 0.27 Low Valid
3 0.54 Good Easy 0.86 High Valid
4 0.25 Average Very easy 0.64 Average Valid
5 0.31 Average Easy 0.57 Average Valid
According to the Table 3.10, it can be seen that from 5 questions is taken all of
questions to be instrument for determine students’ achievement.
2. Observation Sheet
Observation sheet aims to observe patterns of interaction that occur in students
during the learning takes place, the instrument used is the observation sheet based on
criteria that have been set. Determination of interaction patterns refers to Roychondhury
research and Roth (1996). Every statement made on the observation sheet representing
interaction patterns that occur in groups of students.
Every question on the observation sheets is representing interaction patterns that
occur in groups of students. Observation sheets made into two, they are observation
sheet for homogeneous groups at the first meeting and observation sheet for
heterogeneous groups in the second meeting. Blueprint of interaction pattern can be
seen in Table 3.11 and Table of observation sheet for homogeneous group has been
appended to C.10

34
Wulannita Andika, 2013 Pengaruh Dari Implementasi Tipe Pengelompokan Untuk Meningkatkan Hasil Belajar Dan Interaksi Siswa Pada Topik Pencemaran Lingkungan Pada Siswa Sekolah Menengah Pertama Universitas Pendidikan Indonesia | repository.upi.edu| perpustakaan.upi.edu
Table 3.11 Patterns of interaction on observation sheet for homogeneous group
No. Patterns of interaction Number of statement
1. Symmetric 1a, 1b, 2a, 3a, 4a, 5a, 6a
2. Shifting Asymmetric 1a, 1b, 2b, 3b, 4a, 5b, 6b
3. Asymmetric 1c, 1d, 2c, 3c, 4b, 5c, 6c, 6d
In Table 3.11 above characteristics of student group interaction patterns obtained
through observation sheet. Any statement describing the observation sheet group
interaction patterns that occur during the learning takes place. Statement on 1a, 1b, 2a,
3a, 4a, 5a, 6a illustrates symmetrical pattern of interaction. Statement on 1a, 1b, 2b, 3b,
4a, 5b, 6b illustrates Asymmetric Shifting patterns. Statement on 1c, 1d, 2c, 3c, 4b, 5c,
6c, 6d illustrates the pattern Asymmetric.
Meanwhile, blueprint of interaction pattern for heterogeneous group can be seen in
Table 3.12 and Table of observation sheet for heterogeneous group has been appended
to C.11
Table 3.12 Patterns of Interaction on observation sheet for heterogeneous group
No. Patterns of interaction Number of statement
1. Symmetric 1a, 2a, 3a, 4a, 5a, 6a
2. Shifting Asymmetric 1b, 1c, 1d, 2b, 3b, 4a, 5b, 6b
3. Asymmetric 1e, 2c, 3c, 4b, 5c, 6c ,6d
In Table 3.12 above characteristics of student group interaction patterns obtained
through observation sheet. Any statement describing the observation sheet group
interaction patterns that occur during the learning takes place. Statement on 1a, 1b, 1c,
1d, 2a, 3a, 4a, 5a, 6a illustrates a symmetrical pattern of interaction. Statement on 1a,
1b, 1c, 1d, 2b, 3b, 4a, 5b, 6b illustrates Asymmetric Shifting patterns. Statement on 1e,
2c, 3c, 4b, 5c, 6c, and 6d illustrates the pattern Asymmetric.

35
Wulannita Andika, 2013 Pengaruh Dari Implementasi Tipe Pengelompokan Untuk Meningkatkan Hasil Belajar Dan Interaksi Siswa Pada Topik Pencemaran Lingkungan Pada Siswa Sekolah Menengah Pertama Universitas Pendidikan Indonesia | repository.upi.edu| perpustakaan.upi.edu
3. Questionnaire
A questionnaire is written test of questions, the answer to which are recorded
(Kumar, R. 2005). In questionnaire respondents read the questions, interpret what is
expected and the write down the answer. Questionnaires are used to determine the
response of students and teacher towards methods of grouping type. Questionnaire is
given to the students after the completion of learning activities. Blue print of student
questionnaire can be seen in Table 3.13.
Table 3.13 Blue print of questionnaire for student
No. Aspect will be observe Objective Item test
1. Experience of student to
grouping type based on
student ability
To find out of student
experience to group which is
formed by teacher
3 item
tests
2. Interest of student in the
division of the grouping type
To find out of student interest in
the division of grouping type.
4 item
tests
3. Effect of heterogenous to
discussion
To find out of difficulties and
interaction of student in
grouping type.
14 item
tests
4. Improved learning outcomes To find out of student
improvement in learning
outcomes.
4 item
tests
Meanwhile, blueprint of teacher questionnaire can be seen in Table 3.14
Table 3.14 Blue print of questionnaire for teacher
No. Aspect will be observe Objective Item test
1. Experience of teacher about
type of grouping based on
student ability
To find out of teacher’
experience about grouping type
based on student ability
2 item
tests
2. Satisfaction of using grouping
type based on student ability
To find out of teacher’
satisfaction of grouping type
based on student ability
1 item
tests
3. Improvement of student
achievement by using
grouping type based on
student ability
To find out of teacher’ opinion
about improvement of student
achievement by using grouping
type
2 item
tests
4. Student interaction using
grouping type based on
student ability
To find out of teacher opinion
about interaction using grouping
type based on student ability.
8 item
tests

36
Wulannita Andika, 2013 Pengaruh Dari Implementasi Tipe Pengelompokan Untuk Meningkatkan Hasil Belajar Dan Interaksi Siswa Pada Topik Pencemaran Lingkungan Pada Siswa Sekolah Menengah Pertama Universitas Pendidikan Indonesia | repository.upi.edu| perpustakaan.upi.edu
G. Research Procedures
In general, the research to be conducted has three stages, namely:
1. Preparation
a. Analyze problems, conduct literature by reading a few journals about grouping
type (homogeneous and heterogeneous group) or other sources such as book
regarding grouping type by Slavin (2005), patterns of interaction, student’
achievement and pollution concept for secondary student.
b. Doing observation to get information about class condition, grouping commonly
used by teachers, students characteristic, experiment equipment in laboratory and
prepare a research permit.
c. Prepare instructional tools, such as design lesson plan about water and air
pollution and module for experiment activity about water and air pollution.
d. Instruments designing, the instrument is divided into two; they are test and non
test. Test used in this study are 4 essay questions of water pollution and 5 essay
questions of air pollution to measure student 'achievement, meanwhile non test is
observation sheet to observe interaction among group members that occur during
discussions and questionnaires to know response of students and teacher towards
methods of methods of distribution groups conducted by the teacher based
student 'ability.
e. Conduct judgment instrument such as test, observation sheet and questionnaire
by 3 lectures and make revision. After getting a judgment instrument, whether
the instrument will be used decent or not.
f. After the judgment from lecturers, the instrument is tested to students who
already learned material about environmental pollution especially water and air
pollution to determine the validity, reliability, level of difficulty and
discrimination power of each question and conduct revision. Meanwhile
observation sheet and questionnaire are only from lecturer’ judgment.
Observation sheet that will be use to observe student interaction pattern has been
calibrated by six observers.

37
Wulannita Andika, 2013 Pengaruh Dari Implementasi Tipe Pengelompokan Untuk Meningkatkan Hasil Belajar Dan Interaksi Siswa Pada Topik Pencemaran Lingkungan Pada Siswa Sekolah Menengah Pertama Universitas Pendidikan Indonesia | repository.upi.edu| perpustakaan.upi.edu
g. Determine class VII-F as the subject of research with number of students 28.
h. Distributing first pretest to determine students' ability by using an essay that
consists of 4 questions of water pollution topic before learning activity.
i. Formation the groups are designed to homogeneous group which is each member
of group has same ability.
2. Implementation
a. Learning process at the first meeting conducted by a simple experiment to
identify the effects of water pollution to living thing in each group. There are 6
observers who conducted observation for each group.
b. The end of learning activity in first meeting, student given posttest of water
pollution and in next meeting teacher distributed second pretest to determine
students' ability by using an essay test that consists of 5 questions for air
pollution for second meeting.
c. Formation of the group at the second meeting is designed to heterogeneous group
which is each member of the group has mixed-ability.
d. Learning process at the second meeting conducted by a simple experiment to
investigate air pollution by dust in the classroom. There are 6 observers who
conducted observation for each group and has been informed about procedure
how to use observation sheet.
e. The end of learning activity in second meeting, student given second posttest of
air pollution to measure student 'achievement and also given questionnaire to
know the response of students and response from professional teacher towards
methods of distribution groups conducted by the teacher based student 'ability.
3. Data analyzing
a. Test
Processing data was conducted from tests which is given to students. Test consists
of pretest and post-test. The test results matched to scoring rubrics for pretest and
posttest, then obtained a total score of student’s pretest and post-test. Then, data is

38
Wulannita Andika, 2013 Pengaruh Dari Implementasi Tipe Pengelompokan Untuk Meningkatkan Hasil Belajar Dan Interaksi Siswa Pada Topik Pencemaran Lingkungan Pada Siswa Sekolah Menengah Pertama Universitas Pendidikan Indonesia | repository.upi.edu| perpustakaan.upi.edu
processed with statistical test to find descriptive statistic analysis, the significant
differences with t-test using SPSS 17 software and calculate increasing student’
achievement using the normalized gain manually.
b. Observation Sheet
Observation sheet used to investigates the interaction among group members in
homogeneous and heterogeneous groups. The data obtained in the observation
sheet prepared by using checklist () sign on the available column accordance to
aspects that were observed during the discussion activity. Every cheklist in interval
coloum equals to 10 score, then every aspect is calculated and processed by
following the occurrence relatively formula, number of aspects that obtained
divided by the total expected time interval and then multiplied by 100% and
percentages. (Arikunto, 2001).
c. Questionnaire
Questionnaire is aimed to find out students 'and teachers' responses to learning that
has been implemented using two different types of grouping, there are
homogeneous group for water pollution topics and heterogeneous group for air
pollution topic, which is contains twenty-five questions. Each question in
questionnaire has two options, there are "yes "and" no ". Processing is done by
scoring questionnaire to all of options in question on the questionnaire. Each
option was given score 1 for "yes" and 0 for "no", then summed for each question
and calculated its percentage and interpreted in reference Table values
interpretation questionnaire. For more details, research plot which conducted can
be used in the following Figure 3.3:

39
Wulannita Andika, 2013 Pengaruh Dari Implementasi Tipe Pengelompokan Untuk Meningkatkan Hasil Belajar Dan Interaksi Siswa Pada Topik Pencemaran Lingkungan Pada Siswa Sekolah Menengah Pertama Universitas Pendidikan Indonesia | repository.upi.edu| perpustakaan.upi.edu
H. Research Plot
Literature study
Doing observation : Teacher, Student and Method
Lesson plan designing based on grouping
Instrument designing
Instrument revision
1st Pretest
Learning process at 1st
meeting
use homogeneous group on
water pollution topic
nhhz
Learning process at 2nd
meeting
use Heterogeneous group on air
pollution topic
nhhz
Data analyze
Conclusion
2nd Pretest
1st Post-test 2nd Post-test
Figure 3. 4 Research Plot
Test (Pre and Post) Observation Sheet Questionnaire

40
Wulannita Andika, 2013 Pengaruh Dari Implementasi Tipe Pengelompokan Untuk Meningkatkan Hasil Belajar Dan Interaksi Siswa Pada Topik Pencemaran Lingkungan Pada Siswa Sekolah Menengah Pertama Universitas Pendidikan Indonesia | repository.upi.edu| perpustakaan.upi.edu
I. Data Collection Technique
Techniques of data collection in this study are:
1. Test
Test consists of pretest and posttest. Pre test is conducted twice, in homogeneous
and heterogeneous groups. Pretest is given at the beginning of meeting before the
lesson. Pre test is used to determine the level of student understanding, and structure of
the group formed by the students’ ability levels, low, medium and high and classifies
students into homogeneous and heterogeneous groups. There are 28 students as research
subjects to be grouped in three categories namely the high, medium or low. According
Arikunto (2006), to determine the position of high, medium or low groups, can be done
by using the standard deviation. The first pretest in this research is four essay questions
of water pollution. The high group consists of students with scores equal to or greater
than the average score of students plus the overall standard deviation. The low group is
determined by students who have an average score of students minus standard
deviation. While for medium group consists of students with scores between high and
low groups.
In the first learning activity, the group was made homogeneous group or each
member of the group has the same ability level. Based on the statement Arikunto
(2006), the high group with pretest score ≥ 72.10 (4 students or only 1 group), the
medium group with pretest score between 43.10 and 72.10 (20 students or 4 groups) and
low group with pretest score ≤ 43.10 (4 students or 1 group).
The second pretest in this research is five essay questions of air pollution. In the
second learning activity, the group was made a heterogeneous group or each member of
the group was made mixed-ability. The data used for grouping students is pretest that
given before conduct learning activity. Based on the statement Arikunto (2008), the
high group with pretest score ≥ 64.50 (6 students), the medium level with pretest score
between 46.90 and 64.50 (16 students) and low level with pretest score ≤ 46.90 (6
students). Students are divided into six groups with each group of 4-5 students. Each
group consisting of 1 student with a low level, 2 – 3 students with medium and 1
student with a high level.

41
Wulannita Andika, 2013 Pengaruh Dari Implementasi Tipe Pengelompokan Untuk Meningkatkan Hasil Belajar Dan Interaksi Siswa Pada Topik Pencemaran Lingkungan Pada Siswa Sekolah Menengah Pertama Universitas Pendidikan Indonesia | repository.upi.edu| perpustakaan.upi.edu
Post-test is conducted twice in homogeneous and heterogeneous groups. Posttest is
given at the end of the lesson. Post-test used to measure students' achievement of the
concept after discussion. The type of question is 4 essay questions about water pollution
in homogeneous group and five essay questions of air pollution in heterogeneous group.
2. Observation sheet
Observation sheet aims to observe patterns of interaction that occur in students
during the learning takes place, the instrument used is the observation sheet based on
criteria that have been set. Every question on the observation sheets made representing
interaction patterns that occur in groups of students, there are symmetric, shifting
asymmetric and asymmetric. Observation sheets made into two, they are observation
sheet for homogeneous groups at the first meeting and observation sheet for
heterogeneous groups in the second meeting. The data obtained in the observation sheet
prepared by using checklist () sign on the available column accordance to aspects that
were observed during the discussion activity. Observation conducted by the observer
during the discussion activity. Every one observer observed one group of students.
Observation is conducted about 40 minutes divided into 5-minute intervals as much as 8
times.
3. Questionnaire
Questionnaires are used to determine the response students and teacher towards
methods of distribution grouping type, homogeneous and heterogeneous. Questionnaire
is done by students after the completion of learning activities. Questionnaire is given in
form of a sheet and students have to fill it by a fixing a check mark (√) in the space
provided.
42
Wulannita Andika, 2013 Pengaruh Dari Implementasi Tipe Pengelompokan Untuk Meningkatkan Hasil Belajar Dan Interaksi Siswa Pada Topik Pencemaran Lingkungan Pada Siswa Sekolah Menengah Pertama Universitas Pendidikan Indonesia | repository.upi.edu| perpustakaan.upi.edu
J. Data analyzing techniques
Data obtained from the study such as quantitative data and qualitative data.
Quantitative data obtained from pretest and post-test and data increase students'
achievement, while the qualitative data obtained from the observation sheet of
interaction among group members in homogeneous and heterogeneous group and
questionnaire for student and teacher to know their respond towards methods of
grouping type based student ‘ability. Data processing techniques described below are
based on the purpose of this research.
1. Test
Test consists of pretest and posttest. Pre test is conducted twice, in homogeneous
and heterogeneous groups. In this research, pretest has two functions. First function is
used to determine the initial conditions of water pollution and air pollution topics. The
results of pretest were determined students' prior knowledge about material that will be
taught. Second, the result of the pretest is used to determine the grouping of students
based on student 'ability. The result of pretest is used to determine high, medium and
low levels. The pretest is given at the beginning of lesson and the ends of the lesson
students were given the posttest to determine the increase of student’ achievement after
learning activity using homogeneous and heterogeneous grouping. The process of data
analysis is enlisted in the following explanation.
a. Scoring process
Scoring process is performed on both of pretest and posttest in homogeneous and
heterogeneous groups. Scoring process is initiated by analyzing right answer based on
scoring rubrics stated in blue print. Each of questions is given score from the interval
between 0-100. After all of the question analyzed, and then obtained total score. After
the data is obtained, the next step is to analyze and process the data by using statistical
test. It is done by using software SPSS (Statistical Product and Service Solution) 17.0
for windows which is operated by using a laptop.
b. Descriptive statistic analyze
From data obtained, the further step is descriptive statistic analyze. Data processing
is performed on the pretest and posttest scores. This is done to determine the maximum

43
Wulannita Andika, 2013 Pengaruh Dari Implementasi Tipe Pengelompokan Untuk Meningkatkan Hasil Belajar Dan Interaksi Siswa Pada Topik Pencemaran Lingkungan Pada Siswa Sekolah Menengah Pertama Universitas Pendidikan Indonesia | repository.upi.edu| perpustakaan.upi.edu
value, minimum value, mean, standard deviation, and variance of the data that has been
obtained.
c. Normality test
Normality test conducted to determine whether data obtained normally distribute or
not. Kolmogorov-smirnov statistic test with 5% signification level in SPSS 17 software
were used to determined normality. Normality test conducted to pretest and post test
score from two different group (homogeneous and heterogeneous). If both data
distribute normally, we can continue the data processing to homogeneity test. If the data
show that the distribution from one or all the data not normally distribute, the data
processing can continue using non parametric statistic it is using Wilcoxson test.
d. Homogeneity test
If the data normally distributed, then further testing is testing homogeneity of
variance. Homogeneity test is used to determine whether both groups have homogenous
variances or not. To count homogeneity we can use Leven’s test with 5% signification
level.
e. Compare mean test
Compare mean test uses to notice any significant difference or not between the
pretest and post-test of homogeneous and heterogeneous groups. If the data obtained
normally distribute and has homogenous variances, the next test will be t-test (less than
30 students). If the data normally distribute and did not have homogenous variances will
be tested by using t’-test. Meanwhile if the data obtained did not distribute normally, the
test will be used is non-parametric test.
For more detail, steps of test processing data shown in Figure 3.4 below:

44
Wulannita Andika, 2013 Pengaruh Dari Implementasi Tipe Pengelompokan Untuk Meningkatkan Hasil Belajar Dan Interaksi Siswa Pada Topik Pencemaran Lingkungan Pada Siswa Sekolah Menengah Pertama Universitas Pendidikan Indonesia | repository.upi.edu| perpustakaan.upi.edu
Figure 3.5 Steps of processing data
Normality Test
Not homogeneous Wilcoxson test
T test < 30
Z test > 30
Normal Not normal
T’ test
Homogeneous
Homogeneity Test
Parametric Test Non Parametric
Test (Pre and Post)
Descriptive Analysis
Scoring and Total score

45
Wulannita Andika, 2013 Pengaruh Dari Implementasi Tipe Pengelompokan Untuk Meningkatkan Hasil Belajar Dan Interaksi Siswa Pada Topik Pencemaran Lingkungan Pada Siswa Sekolah Menengah Pertama Universitas Pendidikan Indonesia | repository.upi.edu| perpustakaan.upi.edu
The further data analysis is measure normalized gain. It was use to determine
increase of student’ achievement of homogeneous and heterogeneous groups. The
pretest and post-test data from each student in homogeneous and heterogeneous group
will be calculated to find normalized gain value. Normalized gain is calculated by
formula from Meltzer (2003):
To determine the quality increase students' achievement of concepts does normalize
gain data interpretation. The criteria used by Hake (1999) are presented in Table 3.15
below:
Table 3.15 Gain Criteria
<g> Interprets
G > 0,7 High
0,3 < g < 0,7 Medium
G < 0,3 Low
2. Observation sheet
Observation sheet used to investigate the interaction among group members in
homogeneous class and heterogeneous class used observation sheet. The data obtained
in the observation sheet prepared by using check () sign on the available column
accordance to aspects that were observed during the discussion activity. Every cheklist
in interval coloum equals to 10 score, then every aspect is calculated and processed by
following the occurrence relatively formula by Arikunto (2002).
3. Questionnaire
Questionnaire was conducted to find out students and teachers' responses to learning
that has been implemented using two different types of grouping, namely homogeneous

46
Wulannita Andika, 2013 Pengaruh Dari Implementasi Tipe Pengelompokan Untuk Meningkatkan Hasil Belajar Dan Interaksi Siswa Pada Topik Pencemaran Lingkungan Pada Siswa Sekolah Menengah Pertama Universitas Pendidikan Indonesia | repository.upi.edu| perpustakaan.upi.edu
groups for water pollution topics and heterogeneous group for air pollution topic, which
is contained twenty five questions with two options "yes "and" no ". Processing is done
by scoring all of options on the questionnaire. Each option was given score 1 for "yes"
and 0 for "no", then data is interpreted in reference Table values interpretation
questionnaire. The data processed by using a Likert scale with the formula below
(Arikunto, 2001):
Description:
P = percentage of responses
R = response observed
Rmax = maximal response observed
Classification calculation of the percentage of each category of interpretation
(Koentjaraningrat, 1990) is as follows:
Table 3.16 Percentages of questionnaire classification
Percentage of answer (%) Criteria
0% None
1 %- 25% Small
26%- 49% Almost half
50% Half
51% - 75% Majority
76% - 99% Generally
100% Overall