Embed Size (px)
Citation preview

278
CHAPTER
9Does the Test Matter?
Evaluating Teachers When Tests Differ in Their Sensitivity to Instruction
MORGAN S. POLIKOFF
ABSTRACTImplicit in the main MET project reports is the assumption that the policy rec-ommendations offered apply equally across states. However, there is evidence from previous work that state tests differ in the extent to which they reflect the content or quality of teachers’ instruction (their instructional sensitivity). This chapter applies the methods of the main MET reports to data disaggregated by state to explore whether state tests vary in their sensitivity and whether variation in sensitivity affects the recommendations for weighting components in multiple-measures teacher evaluation systems. The chapter shows that state tests indeed vary considerably in their correlations with observational and stu-dent survey measures of effective teaching. Furthermore, some state tests cor-relate weakly or not at all with these measures, suggesting weak sensitivity to instructional quality. These state-to-state differences in correlations produce weighting recommendations that also differ across states. However, an equally weighted composite of measures may work well in most cases. The chapter concludes by recommending that states explore their own data to ensure their tests are adequately sensitive to high-quality instruction.
c09.indd 278 3/17/2014 12:58:04 PM

Does the Test Matter? 279
INTRODUCTION
As states and districts design new teacher evaluation systems, they must decide how to weight the various measures of teacher performance (e.g., value-added scores, observations, student surveys) in constructing an overall measure of effectiveness. How to weight the multiple measures has been a focal point of the larger MET project, and various chapters in this volume discuss relevant factors in the decision. To this point, however, the MET project has assumed that the techniques for making decisions about weights for multiple measure evaluation systems should be the same across settings. For instance, rather than calculating optimal weights for evaluation systems separately by state, the reports are aggregated across states and grades. This assumption may be prob-lematic, however; as I will show in this chapter, the state tests used to construct value-added measures differ considerably in the extent to which they reflect the quality of teachers’ instruction. This property of assessments—their instruc-tional sensitivity—is the focus of the present discussion.
In this chapter, I briefly discuss instructional sensitivity as a property of assessments and its relevance to the MET project's central aims. Next, I rean-alyze the MET data separately by state and show that the state tests indeed differ in their sensitivity. Third, I use the methods of the main MET reports to show how the variation in sensitivity across states results in different optimal weighting schemes that produce different levels of stability in teacher effec-tiveness ratings. Finally, I discuss practical implications of the findings and make policy suggestions for teacher and school accountability policies. The four questions guiding this chapter are
1. To what extent are state tests of student achievement in mathematics and English language arts (ELA) sensitive to observational ratings and stu-dent surveys of teachers’ pedagogical quality?
2. To what extent do state tests significantly differ in their sensitivity to obser-vational measures of pedagogical quality and student survey evaluations?
3. How do the optimal weights in composite measures of teacher perfor-mance differ across states?
4. How does the year-to-year stability of composite teacher performance rat-ings differ across states and across approaches to creating those composites?
c09.indd 279 3/17/2014 12:58:04 PM

280 Designing Teacher Evaluation Systems
The answers to these questions have important implications for poli-cymakers designing multiple measures systems to evaluate teachers and improve instruction. One implication is technical: if state tests differ in their sensitivity to instruction, should different states use different weights in constructing composite measures of effectiveness? A second implication is practical: for states where the sensitivity of tests to instruction is weak, how can results from these tests be effectively used to guide teacher professional development or improvement plans?
BACKGROUND
What Is Instructional Sensitivity?The origins of instructional sensitivity are with the initial development of criterion-referenced assessments in the 1960s (Cox & Vargas, 1966). The dominant mode of assessment prior to that point was the norm- referenced assessment; these tests were intended to rank individuals. In contrast, criterion-referenced assessments, such as those required under the No Child Left Behind Act, were intended to measure student mastery of a content domain (Glaser, 1963). Given these differing intended uses, the architects of criterion-referenced assessment argued that the traditional test construction techniques for building norm-referenced assessments were not appropriate for criterion-referenced assessments.
In particular, these test developers argued that the item statistics used to select and evaluate the quality of norm-referenced test items (e.g., discrimi-nation, difficulty) were not appropriate for criterion-referenced assessments (Cox & Vargas, 1966; Popham, 1971). For example, in norm-referenced assess-ments, items with very low difficulty are generally thrown out—in the extreme case in which every respondent correctly answered the question, the item would not provide any information about relative performance of test-takers. In criterion-referenced assessments, however, such an item might merely indicate that all test-takers have learned the material being tested, and the item might not be thrown out. In other words, the creators of criterion-referenced assess-ment argued that criterion-referenced tests and items should, first and foremost, accurately differentiate students who had and had not been instructed effec-tively in the content targeted by the assessment. They called this item property “instructional sensitivity.” For a full review of the history of instructional sen-sitivity and the multitude of approaches to investigating it, see Polikoff (2010).
c09.indd 280 3/17/2014 12:58:04 PM

Does the Test Matter? 281
There are three primary methods of instructional sensitivity analysis (Polikoff, 2010): item statistic, judgmental, and instruction-focused. The ear-liest techniques involved item statistics (e.g., Cox & Vargas, 1966; Haladyna & Roid, 1981). For instance, one promising approach (Cox & Vargas, 1966) was a simple difference in item difficulty between students who had and had not been instructed in the target content (or between the same students, taken before and after receipt of instruction). These item statistics did not catch on widely. They were primarily criticized for not including measures of teach-ers’ instruction (Airasian & Madaus, 1983). As an example, consider an item where the same set of students in a class answered the item correctly before and after instruction; in other words, no students learned the content of the item during the instructional period. In this case, is the item insensitive to the instruction provided by the teacher? Or was instruction just of poor quality (or not focused on the content measured by the item)? Without evidence of what and how the teacher taught, there is no way to distinguish which of these two explanations is correct.
A second class of sensitivity analysis is judgmental in nature. A recently proposed judgmental technique would create “sensitivity panels,” much like the panels currently used to set performance standards for state and national assessments (Popham, 2007). These panels would have teams of experts examine the items to rate them on several dimensions seemingly related to their sensitivity, arriving at an overall evaluation of the sensitivity of indi-vidual items or whole assessments. While judgmental methods have been proposed since the late 1970s, recent work suggests these methods do not generally agree with item statistic approaches in identifying items that appear to be sensitive to instruction (Chen, 2012). More research is needed on these methods before they can be widely used in the field.
The third method, which is used in this chapter, is instruction-focused and employs measures of instruction in concert with student achievement data to investigate sensitivity (e.g., D'Agostino, Welsh, & Corson, 2007; Gamoran, Porter, Smithson, & White, 1997; Greer, 1995; Muthen, Huang, Jo, Khoo, Goff, Novak et al., 1995; Ruiz-Primo, Shavelson, Hamilton, & Klein, 2002; Wiley & Yoon, 1995). The most promising of these are methods based on detailed observations and ratings of instructional practices (Polikoff, 2010). The premise of the analysis is quite straightforward. The first step is to iden-tify the features of quality instruction that are to be measured—these should be features of instruction that research suggests are important indicators of
c09.indd 281 3/17/2014 12:58:04 PM

282 Designing Teacher Evaluation Systems
effective teaching in the content area. The second step is to observe a number of teachers to evaluate them against these features. The third step is to create value-added or other measures of student achievement growth on tests specifi-cally designed to measure what the teachers are supposed to have taught (i.e., the content in state subject-area standards). The fourth and final step is to pre-dict student achievement gains with the measures of instructional quality.
The basic approach of this kind of sensitivity analysis is identical to the approach taken in measuring the predictive validity of the instructional mea-sure for predicting the outcome (student achievement gains). In essence, the concept of instructional sensitivity flips the interpretive focus from the predic-tor to the outcome, arguing that assessments themselves vary considerably in their ability to detect differences in the predictor (instruction) and that this variation is worthy of investigation and reporting.
If all state tests were sensitive to high-quality instruction (and equally so), we would expect that (1) well-conceptualized and measured indicators of instructional quality would be positively associated with student achieve-ment gains and (2) the associations would be roughly constant across differ-ent tests. In contrast, if state tests were weakly and/or variably sensitive to instruction, we would expect that (1) there would be no or little association of instructional practice with student achievement gains and (2) these associa-tions would differ from test to test. Given this intended focus, it is important to emphasize that the work presented in this chapter is not intended to be used to compare the predictive validity of various measures of pedagogical qual-ity (i.e., to say one measure of teachers’ pedagogical quality is “better” than another one). Rather, it is assumed that each of the measures of pedagogical quality captures some important indicators of teacher performance. The ques-tion, then, is to what extent the assessments can detect that which is measured by the instruments.
The main MET research analyses appear to have anticipated strong and uniform sensitivity, given that the study reports have (1) taken the measures of pedagogical quality to be worthy measures that should be associated with achievement gains and (2) not reported on differences in associations across the study's six districts/states. The present chapter retains the assumption that the pedagogical quality measures indeed capture important dimensions of instructional quality, but probes the possibility that the relationship of achievement gains with instructional quality (as measured through observa-tions and student surveys) varies across states.
c09.indd 282 3/17/2014 12:58:04 PM

Does the Test Matter? 283
Why Is Sensitivity Important?The results from state and district assessments are used for an array of pur-poses. Among these are (1) making promotion or retention decisions for indi-vidual students, (2) informing instructional improvement efforts for teachers, and (3) evaluating the performance of districts, schools, or teachers for feed-back or accountability. For the latter two purposes, the inferences made from the assessment results rely on the assumption that those results accurately reflect the instruction received by the students taking the test. This assumption is at the heart of the investigation of instructional sensitivity.
To illustrate the importance of assessments that are sensitive to instruc-tion, consider the following example. Teachers in Westlake Elementary adopt the Connected Math Program as their new elementary mathematics model. The teachers, supported by extensive, high-quality professional development, implement dramatic instructional changes to align with the new model, and students seem to be responding. These instructional changes improve the quality of their instruction as judged by high-quality observational tools, such as the Framework for Teaching. Benchmark assessments taken through-out the year show considerable improvement in student performance, sug-gesting the reforms are working as planned. At the end of the year, students complete the annual state assessment. Two months later, teachers receive results of the state assessments, which show that achievement gains for the past year were no higher (in fact, they were lower) than in previous years. Teachers are confused about the results and unsure of how to make instruc-tional changes to respond.
This example highlights several facts about instructionally sensitive assessments. First, sensitive assessments are essential for helping teachers use assessment data to improve their instruction. In this case, teachers were unable to understand how to improve their instruction because they received conflicting messages from different assessments. Second, sensitive assess-ments should positively reflect instruction that is “high quality,” as judged by research-based instructional observation protocols, and that is well aligned with the content covered on the assessment. Third, inferences made about teacher performance based on the insensitive state assessments will, by definition, not accurately reflect the actual quality of instruction that teach-ers provided to students. Thus, without sensitive assessments, the validity of virtually all the inferences made about teachers and schools on the basis of assessment data alone are questionable. Clearly, given the MET project's
c09.indd 283 3/17/2014 12:58:04 PM

284 Designing Teacher Evaluation Systems
stated goal of improving the measurement of effective teaching, it is essential that the sensitivity of the assessments be taken into account.
STUDYING INSTRUCTIONAL SENSITIVITY OF MULTIPLE STATE TESTS
The present analysis uses section-level value-added scores, observational scores, and student survey results from the MET study's first year. First, I illustrate variation in sensitivity across states by comparing correlations of the value-added model (VAM) scores with composite scores and subscores from the Tripod surveys, Framework for Teaching (FFT), Classroom Assessment Scoring System (CLASS), Protocol for Language Arts Teaching Observations (PLATO), and Mathematical Quality of Instruction (MQI). I calculate the cor-relations by state and subject and conduct two sets of tests for statistical sig-nificance. First, I test whether each correlation is significantly different from 0. To simplify reporting, I indicate the correlation of VAM with each of the five survey/observational measures of instructional quality, and whether each of the correlations is significantly different from 0. Next, I test whether there are significant differences in correlations among states and summarize the results in the text. I exclude State 3 from all state-level analyses because of the small sample of MET teachers from that state, but the data from State 3 are used in calculating overall averages and correlations.
Once I have established the presence of differential sensitivity across states, the question is how states should use this information in combining multiple measures. To investigate this issue, I present a series of examples that illustrate how multiple alternatives for weighting the components would play out in terms of prediction and stability. Following the project reports, I calculate optimal weightings for predicting different criteria and show how these weightings differ across the states in the MET sample. The two out-come criteria I attempt to predict are (1) value-added only and (2) an equally weighted composite of value added, observation results from the Framework for Teaching, and Tripod surveys. Here, I use results from one section or year of a teacher's class to predict results from another section or year. I follow the procedures outlined in the main MET reports to calculate these optimal weights (Mihaly, McCaffrey, Staiger, & Lockwood, 2013). The weights can be interpreted as the weights that should be assigned to each component of the index in order to maximize its correlation with the outcome.
c09.indd 284 3/17/2014 12:58:04 PM
Does the Test Matter? 285
TO WHAT EXTENT ARE STATE TESTS SENSITIVE TO PEDAGOGICAL QUALITY?
This section explores the sensitivity of state mathematics and ELA tests by presenting correlations of state test VAM scores with each of the obser-vational rubric total scores and the Tripod survey composite score. Before discussing these correlations, one important issue is deciding what level of correlation is evidence of sensitivity. This is a difficult issue, because there is not an established threshold in the literature. One approach might be to say that each assessment's VAM scores should be positively correlated with each of the measures taken as indicators of high-quality instruction. This approach is liberal, as correlations of even minute magnitudes will be statistically sig-nificant in large enough samples. A more conservative approach would be to determine an a priori threshold for indicating sensitivity, such as a correlation of .2 or higher. Because the literature does not offer such a threshold, I take the more liberal approach here. In the future it may be a useful exercise to establish levels of sensitivity signified by correlations of increasing magnitude (e.g., a correlation of .2 signifies “moderate sensitivity” and a correlation of .4 signifies “strong sensitivity”).
MathematicsA first way to analyze the correlations for mathematics, shown in Table 9.1, is to consider the correlations at the aggregate level (i.e., the correlations using data from all partner states together). The total score correlations are the first values in each cell in the table, and the aggregate correlations are in the left-most column. These correlations show a consistent pattern of positive rela-tionships between state test VAM and total scores on the Tripod, FFT, and CLASS, with correlations ranging from .15 to .19. That is, for each of these three instruments, teachers who score higher on the instrument tend to score higher on value added (although only modestly so). In contrast, there is no correlation between VAM and scores on the MQI; the correlation is a statisti-cally insignificant .03. Based on these results, we might conclude that state tests are sensitive to instructional quality as measured on the Tripod, FFT, and CLASS, but not as measured by the MQI.
Another way to look for sensitivity is to consider correlations at the sub-scale level. These are the second entries in each cell in the table, where I sim-ply report the number of subscales that have positive, significant associations
c09.indd 285 3/17/2014 12:58:04 PM

286 Designing Teacher Evaluation Systems
TABLE 9.1. Raw Correlations of State Test VAM Scores with Instructional Quality Measures by State, Mathematics
Districts
Overall State VAM 1 2 4 5 6
Tripod composite 0.19* 0.33* 0.21* 0.09 0.20* 0.16*
Tripod subscales (7) 7 7 5 1 5 5
n 1135 144 236 262 238 255
FFT composite 0.18* 0.31* 0.03 0.13 0.26* 0.23*
FFT subscales (8) 8 4 0 1 7 6
n 805 85 173 184 180 183
CLASS composite 0.15* 0.18 0.04 0.08 0.19* 0.28*
CLASS subscales (12) 9 2 1 1 5 11
n 804 85 173 183 180 183
MQI composite 0.03 −0.04 0.01 0.07 −0.03 0.18*
MQI subscales (5) 3 0 0 0 0 3
n 794 84 166 183 178 166
Note. *significantly different from 0, p <.05.
with the state test VAM. For the aggregate sample, there are significant cor-relations on the large majority of subscales. On the Tripod and FFT, there are significant correlations on each subscale; the strongest correlation across all subscales is the correlation of state test VAM with the FFT subscale for man-aging student behavior (r = .20). In contrast, there are five subscales spread across the CLASS and MQI that do not show significant correlations. These subscales are (1) CLASS–Regard for Student Perspectives (r = .03), (2) CLASS–Analysis and Problem Solving (r = .03), (3) CLASS–Instructional Dialogue (r = .06), (4) MQI–Errors and Imprecision (r = .03), and (5) MQI–Working with Students and Mathematics (r = .04). In short, with the excep-tion of the behaviors represented by these five subscales, the state assessments
c09.indd 286 3/17/2014 12:58:04 PM

Does the Test Matter? 287
in our partner districts are (on average) sensitive to all of the behaviors rep-resented by the rubrics and surveys. The correlations are generally small, however.
The next five columns in the table show the same correlations, but at the state level. States are not identified due to privacy. These five columns illus-trate several interesting findings about the sensitivity of each state's assess-ments to total score measures of pedagogical quality. First, state tests differ in their patterns of sensitivity. The most sensitive state assessments seem to be in State 6, where there are significant correlations of state test VAM with total scores on all four rubrics. In contrast, in State 4, there are no significant corre-lations of VAM with rubric or survey total scores. The other three states have some significant and some non-significant correlations between VAM and the various rubrics. Second, some of the correlations are much larger at the indi-vidual state level than for the aggregate sample—for instance, the correlation of VAM with the Tripod composite in State 1 is r = .33, considerably larger than the correlation in the other districts (r = .18). At the total score level, there is a good deal of variation in the magnitude and statistical significance of the correlations, indicating varying degrees of sensitivity.
To illustrate these correlations in another way, Figures 9.1 and 9.2 illus-trate “high” and “low” correlations of Tripod scores with VAM scores in mathematics. The two scatterplots are for States 2 and 4, respectively, and each includes a smoothed curve of best fit (a lowess line) plotted on identical axes. In State 2 (r = .29) the relationship appears positive and almost linear, with each unit of increase in Tripod associated with increasing VAM scores. In State 4 (r = –.05), the relationship appears nonexistent; the curve of best fit is almost completely flat, except for small shifts near the extremes. In short, in State 2, the test is sensitive to differences in teachers’ Tripod ratings; in State 4, differences in teachers’ VAM scores are in no way reflective of differences in the quality of their instruction, as rated by the Tripod.
There are also notable patterns at the subscale level across states. In gen-eral, the patterns at the subscale level support those at the total score level. For instance, there is little evidence of sensitivity for State 4 at the subscale level, with just three significant correlations across the thirty-three sub-scales. Also, the five subscales mentioned above that did not have significant aggregate correlations with VAM scores show relatively little evidence of correlation at the state level either. Three of the five subscales have one sig-nificant correlation each, all with VAM for State 6. The other two subscales
c09.indd 287 3/17/2014 12:58:04 PM

288 Designing Teacher Evaluation Systems
Standardized TRIPOD Total Score
Stat
e Te
st V
AM
–4
–.6
–.4
–.2
0
.2
.4
.6
.8
1
–3 –2 –1 0 1 2 3 4
FIGURE 9.1. Scatterplot of State Test VAM with Tripod Total Score for State 2
Standardized TRIPOD Total Score
Stat
e Te
st V
AM
–4
–.6
–.4
–.2
0
.2
.4
.6
.8
–3 –2 –1 0 1 2 3 4
FIGURE 9.2. Scatterplot of State Test VAM with Tripod Total Score for State 4
c09.indd 288 3/17/2014 12:58:05 PM
Does the Test Matter? 289
(CLASS–Regard for Student Perspectives, MQI–Errors and Imprecision) have no significant correlations with VAM from any state test. Taken together, these results suggest that there is some sensitivity of state tests to pedagogical quality measures in all cases except State 4. However, not all states’ tests are sensitive to all of the pedagogical quality measures—in particular, only one state's tests are sensitive to MQI scores.
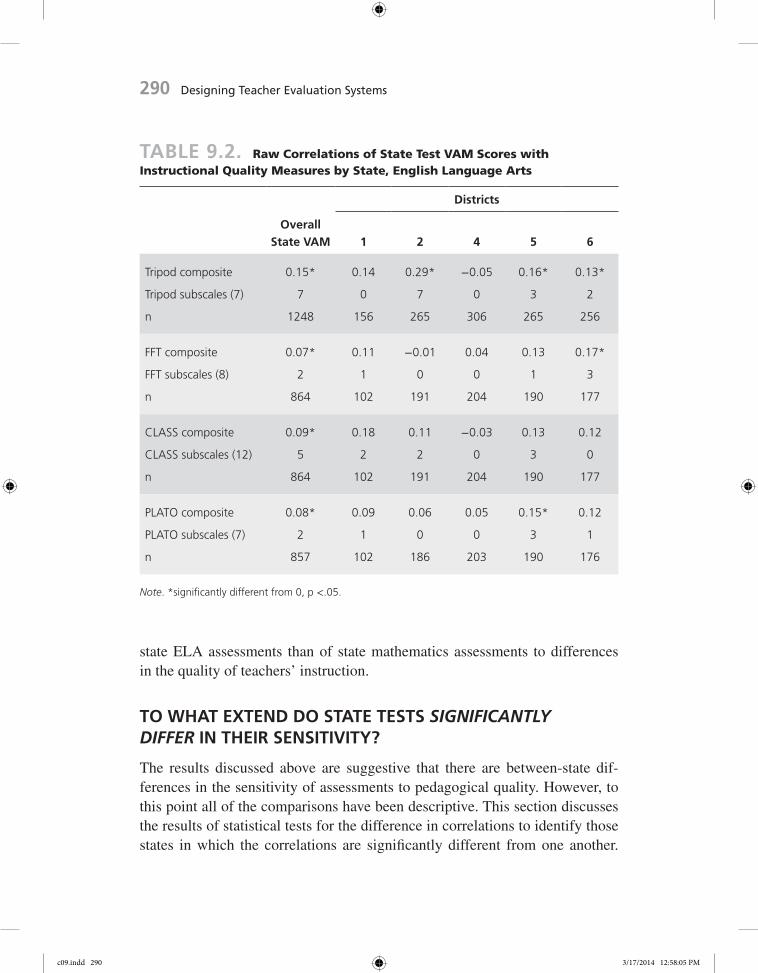
English Language ArtsThe results for parallel analyses in ELA are shown in Table 9.2. Unlike in mathematics, there is significant sensitivity of state tests to pedagogical qual-ity as measured by total scores on all four of the instruments. The largest cor-relation is for the Tripod (r = .15), while the other three tools have roughly equal correlations of .07 to .09. While all of these correlations are signifi-cant, they are as small as or smaller than the correlations for Tripod, FFT, and CLASS in mathematics, perhaps indicating somewhat less overall sensitivity than was found in mathematics.
This interpretation also appears to hold when looking at correlations with the instrument subscales. While all seven Tripod subscales are significantly correlated at the aggregate level with state test VAM, there is less sensitivity on the other three instruments. Indeed, just nine of twenty-seven subscales on the other three instruments show sensitivity at the aggregate level to state test VAM. In short, the average state ELA test across the partner states showed sensitivity to Tripod and its subscales, but only modest sensitivity to the other measures of pedagogical quality.
The state-level correlations are shown in the right-most five columns of Table 9.2. Again, correlations appear weaker in some states than in others. For instance, the assessments in State 4 show no sensitivity to any of the peda-gogical quality scales at either the total score or subscale levels. Indeed, some of the correlations for that district are negative, and one of these negative cor-relations is statistically significant (Tripod care subscale, r = –.12). There is also weak evidence of sensitivity of the assessments in State 1, with just four significant subscale correlations, but this is partially attributable to the smaller sample size for the district in that state. In contrast, there is mixed evidence of sensitivity of the assessments in States 2, 5, and 6. Across all states and instruments, there is only one case in which the state assessments are sensi-tive to more than half of the subscales for a particular instrument—State 2 for the Tripod. Overall, the conclusion must be that there is weaker sensitivity of
c09.indd 289 3/17/2014 12:58:05 PM
290 Designing Teacher Evaluation Systems
TABLE 9.2. Raw Correlations of State Test VAM Scores with Instructional Quality Measures by State, English Language Arts
Districts
Overall State VAM 1 2 4 5 6
Tripod composite 0.15* 0.14 0.29* −0.05 0.16* 0.13*
Tripod subscales (7) 7 0 7 0 3 2
n 1248 156 265 306 265 256
FFT composite 0.07* 0.11 −0.01 0.04 0.13 0.17*
FFT subscales (8) 2 1 0 0 1 3
n 864 102 191 204 190 177
CLASS composite 0.09* 0.18 0.11 −0.03 0.13 0.12
CLASS subscales (12) 5 2 2 0 3 0
n 864 102 191 204 190 177
PLATO composite 0.08* 0.09 0.06 0.05 0.15* 0.12
PLATO subscales (7) 2 1 0 0 3 1
n 857 102 186 203 190 176
Note. *significantly different from 0, p <.05.
state ELA assessments than of state mathematics assessments to differences in the quality of teachers’ instruction.
TO WHAT EXTEND DO STATE TESTS SIGNIFICANTLY DIFFER IN THEIR SENSITIVITY?
The results discussed above are suggestive that there are between-state dif-ferences in the sensitivity of assessments to pedagogical quality. However, to this point all of the comparisons have been descriptive. This section discusses the results of statistical tests for the difference in correlations to identify those states in which the correlations are significantly different from one another.
c09.indd 290 3/17/2014 12:58:05 PM
Does the Test Matter? 291
The results are summarized here; tables displaying the results in detail are available from the author.
The results of these comparisons illustrate several important findings about the variation in sensitivity across states. First, many of the differences discussed in the previous section are indeed statistically significant, indicat-ing that state assessments vary in their sensitivity in ways highly unlikely to be due to chance. Second, there are significant differences in sensitivity at the total score level on all four measures of mathematics instruction, as compared to just one measure of ELA instruction. Third, there are significant differ-ences in sensitivity at the subscale level on all measures of instruction, save for the PLATO in ELA.
At the total score level in mathematics, States 1 and 6 have the most sen-sitive assessments, while States 2 and 4 have the least. In contrast, the assess-ments in State 5 are more sensitive than those in State 2 to FFT ratings and less sensitive than those in State 6 to the MQI. At the total score level in ELA, State 4’s assessments are significantly less sensitive than those in States 1, 2, 5, and 6 to the Tripod. These differences in sensitivity at the total score level are the ones most likely to influence the multiple measures composites, which is a focus of the next section.
At the subscale level, there are many significant differences in sensitivity. For example, there are fourteen subscales on the Tripod, FFT, and CLASS in mathematics for which State 2’s assessments are less sensitive than one or more other states’ assessments. The other state with all negative results is State 4 in both mathematics and ELA. In each of these states, the state assess-ments are not more sensitive than any other state's assessments to either sub-scales or total scores on any measure of instructional quality. Overall, these results show that the correlations found and described in the main MET reports glossed over the sometimes substantial differences in correlations found across study states.
COMBINING MULTIPLE MEASURES WHEN TESTS DIFFER IN THEIR SENSITIVITY
This section is devoted to exploring how states or districts might think about combining multiple measures of instruction when assessments differ in their sensitivity to instruction. To be sure, there are many critiques of the approach of combining multiple measures into a single composite index (e.g., Baker,
c09.indd 291 3/17/2014 12:58:05 PM

292 Designing Teacher Evaluation Systems
Oluvole, & Green, 2013). Indeed, it may make more sense to consider each measure of teacher performance as a separate indicator of teacher perfor-mance that provides imperfect but useful information. Nevertheless, many states and districts, in part responding to incentives from the federal govern-ment, have begun designing and implementing such systems, so providing practical advice is paramount.
I begin by using the techniques of the main MET project analyses to determine optimal weights for predicting various outcomes and exploring how these optimal weights differ across states. I use two outcomes for my examples. The first is simply value added on the state assessment in a dif-ferent section or year. The second outcome is an equally weighted composite of state test VAM scores, Framework for Teaching scores, and Tripod survey scores, again calculated in a different section or year. To create the composite, each measure was standardized and the scores were averaged. I use only FFT scores here, both as an example and because the FFT is the most widely used of the MET study protocols in new teacher evaluation systems. In general, the main conclusions and recommendations discussed in the conclusion section hold, no matter what tool is used, with the possible exception of the MQI.
Optimal Weights for Predicting State Test VAMThe first and third panels in Table 9.3 show the optimal weights for predict-ing value added on the state assessments in mathematics and ELA. I show the weights both overall and for the five states with large samples (exclud-ing State 3). Overall, in mathematics, state test VAM is the largest component of the optimally weighted composite for predicting state test VAM in another section. The optimal weight for VAM is calculated as approximately .75. Less weight is given to observational scores from the FFT (.11) and the Tripod sur-veys (.14). These results are consistent with the project's main reports.
Looking across states, there is some variation in the magnitude of the weights in the optimal composites. State test VAM is always the largest com-ponent of the composite, but the weight varies from .60 in State 1 to .81 in State 2. Another difference across states is in the magnitude and rank ordering of the weights on the FFT and Tripod. In States 1, 5, and 6 (as is true in the aggregate), the Tripod receives a larger optimal weight than the FFT. In con-trast, in States 2 and 4, the FFT receives the larger weight.
Overall, in ELA, the optimal weights for predicting state test VAM again favor the state test VAM. This component receives exactly half of the weight
c09.indd 292 3/17/2014 12:58:05 PM

Does the Test Matter? 293
TABLE 9.3. Optimal Weights by State for Predicting State Value Added
Overall State 1 State 2 State 4 State 5 State 6
State value added in mathematics (A)
VAM 0.75 0.75 0.77 0.64 0.60 0.81
FFT 0.11 0.05 0.22 0.32 0.05 0.02
Tripod 0.14 0.20 0.01 0.05 0.35 0.17
Equally weighted composite in mathematics (B)
VAM 0.31 0.27 0.41 0.19 0.29 0.43
FFT 0.32 0.32 0.28 0.36 0.28 0.32
Tripod 0.37 0.41 0.31 0.44 0.43 0.25
State value added in ELA (A)
VAM 0.50 0.75 0.42 0.55 0.17 0.46
FFT 0.13 0.07 0.38 0.01 0.04 0.24
Tripod 0.37 0.18 0.20 0.44 0.79 0.29
Equally weighted composite in ELA (B)
VAM 0.11 0.25 0.09 0.01 0.16 0.04
FFT 0.43 0.34 0.30 0.42 0.42 0.64
Tripod 0.46 0.41 0.61 0.58 0.42 0.32
Note. Values may not add to 1 due to rounding.
in the composite at the aggregate level. The Tripod survey receives the next highest weight at .37, while the FFT receives the smallest weight at .13. Again, this rank ordering is consistent with that presented in the project's main reports. Looking across states in ELA, there is a wider range in the
c09.indd 293 3/17/2014 12:58:05 PM

294 Designing Teacher Evaluation Systems
weights than is true in mathematics. In State 5, for example, the assessment does not receive the largest weight in the composite. In two other states—States 2 and 6—the state test receives a plurality of the weight, but not a majority. These three states showed significant sensitivity to either Tripod or FFT. In States 1 and 4, the state test VAM does receive the largest weight in the composite. Again, the rank ordering of the other two components’ weights varies across states, with FFT receiving a larger weight than Tripod in State 2.
Taken together with the sensitivity results presented earlier, these results suggest several conclusions about the variation in optimal weights across states when state tests differ in their sensitivity to instruction. First, the opti-mal weights for predicting state test VAM differ considerably from state to state, including differences in both the magnitude and rank order of the weights. States adopting the overall optimal weights calculated in the MET reports by pooling data across states might, in fact, be implementing weights that are not optimal for their particular data.
Second, the variation across states in optimal weights appears larger in English than in mathematics, corresponding to the greater variation in sensi-tivity in ELA described above. Thus, states might consider different weighting schemes for different subjects. Third, for the two state assessments in ELA that show no significant sensitivity to either FFT or Tripod, the optimal weights in the composite predicting state test VAM favor state test VAM over other measures. Conceptually, this makes sense. If the state test VAM is not highly correlated with the other measures in the composite, then the state test will comprise the largest portion of the composite for predicting future VAM. What limits the mag-nitude of these weights from being higher is the generally low reliability of state test VAM estimates in ELA (roughly half as large as in mathematics). In short, the weights on state VAM in the optimal composites are larger when (1) the state test VAM is more reliable and (2) the state test is less sensitive to instruction.
Optimal Weights for Predicting an Equally Weighted CompositeRather than viewing test scores as the essential measure of teacher qual-ity, we might view each of the three measures (VAM, observations, and student surveys) as being important. Thus, instead of creating an optimal composite to predict VAM, we might create an optimal composite to pre-dict some aggregate measure that combines VAM, observations, and sur-veys. The most straightforward aggregate is simply the average of the three
c09.indd 294 3/17/2014 12:58:05 PM

Does the Test Matter? 295
standardized measures. Predicting an equally weighted composite has sev-eral advantages over predicting VAM alone. For instance, equal compos-ites reflect the complex nature of teaching, and they are less likely to create negative incentives (e.g., teaching to the test) than outcomes based only on test scores.
In the second and fourth panels of Table 9.3, I show the optimal weights for predicting an equally weighted composite of state test VAM, FFT, and Tripod. In mathematics, the weights for the overall composite (i.e., including all states) are quite close to equal—0.31 for state test VAM, 0.32 for FFT, and 0.37 for Tripod. However, there is a good deal of variation across states in the optimal weights for predicting the equally weighted composite. State test VAM receives the largest weights in the composites for States 2 and 6, while Tripod receives the largest weights in States 1, 4, and 5. However, in all five states the three components are roughly equally weighted, with no weights below .19 or above .44. Thus, if the goal is predicting an equally weighted composite, the optimal weights are likely to be roughly equal.
In English language arts, the optimal weights for predicting the equally weighted composite are greater for observation scores and Tripod scores than for state test VAM. Across the states, the overall weight for the state test VAM is just .11, as compared to .43 for FFT and .46 for Tripod. Again, there is a good deal of variation across states in weights, but the optimal weight on state test VAM is always .25 or lower. The largest weight generally goes to Tripod, but this too varies from .32 to .61. In neither mathematics nor ELA is there a clear pattern between the sensitivity results presented earlier and the compos-ite weights derived here.
HOW DOES THE STABILITY OF TEACHER PERFORMANCE RATINGS DIFFER ACROSS STATES?
A key purpose of new multiple-measure evaluation systems is to make judg-ments about the performance of individual teachers. Sometimes, these judgments are to be used for high-stakes decisions (e.g., employment), and sometimes they are to be used for lower-stakes decisions (e.g., professional development). Regardless of the intended uses of these results, it is important that results from evaluation systems reflect real, persistent differences in teacher performance, rather than idiosyncratic variations from one year to the next. Thus, the year-to-year stability of these ratings is important, and this section investigates whether
c09.indd 295 3/17/2014 12:58:05 PM

296 Designing Teacher Evaluation Systems
the stability of ratings based on the various composites estimated above differ within and across states.
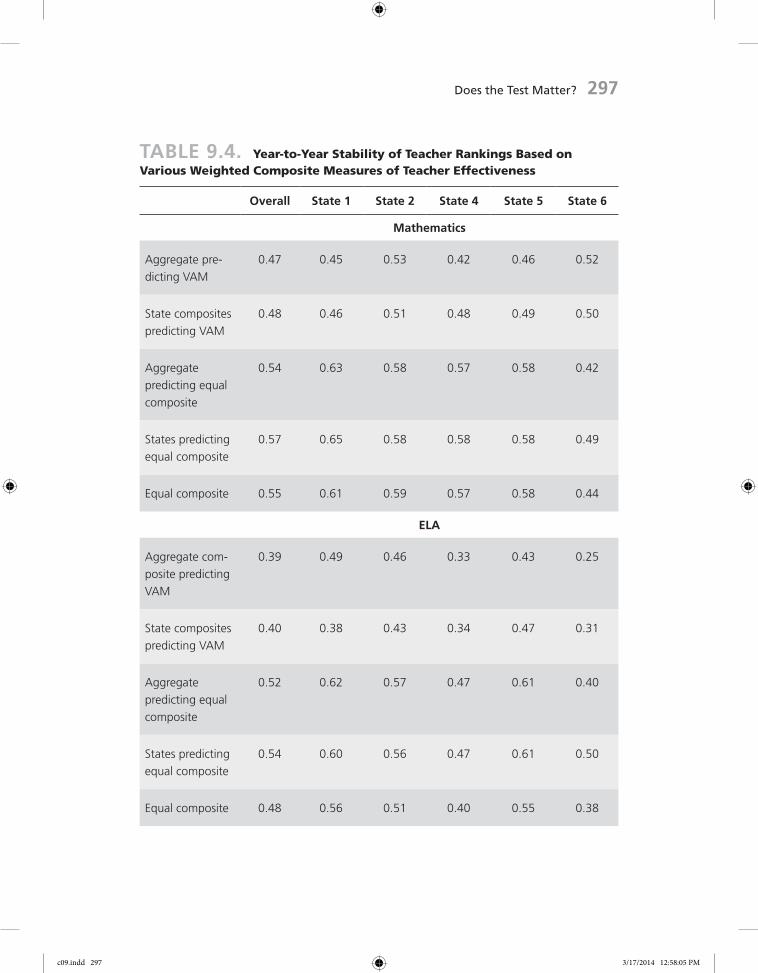
Table 9.4 shows the year-to-year correlation of five different compos-ites in each subject. The top four rows are drawn from the composites pre-sented above—optimal weights for predicting state test VAM and an equally weighted composite. I present both the aggregate weights (i.e., assigning the same weights to each state based on the optimal weight calculated using data from all districts [left-most column of Table 9.3]) and the state-specific weights. The last row of each section is merely an equally weighted compos-ite of the three measures.
Based on these stability indices, several conclusions are possible. First, the stability of teacher ratings is generally higher in mathematics than in ELA. On average, the difference is relatively small (.03 to .08 difference in correlations). This is likely due to the higher reliability of the individual com-posites of the index in mathematics. Second, the stability of the ratings tends to be only slightly higher when using the state-specific weights as compared to the aggregate sample weights. Thus, there is not much gained in terms of stability by using state-specific weights. Third, the stability tends to be lowest for weights based on predicting VAM. Fourth, the stability of ratings varies considerably across states. Even using the same equally weighted composite, the stability varies from .61 to .44 in mathematics and from .56 to .38 in ELA. In both cases, the highest stability is in State 1 and the lowest is in State 6.
Another way to consider stability is to think of it in other metrics that may be more intrinsically meaningful. One such metric is the misclassifica-tion rate. Consider the stability of .39 for the aggregate composite for predict-ing only the state VAM in ELA. This was the lowest overall stability in ELA. Given a stability of .39, of the teachers rated as below the median in one year/section, approximately 64 percent were rated below the median in another year/section. Of the teachers rated in the bottom 25 percent, approximately 48 percent were rated in the bottom 25 percent in another year/section. And of the teachers rated in the bottom 10 percent, approximately 26 percent were rated in the bottom 10 percent in another year/section.
Now consider the stability of .54, which we would have obtained had we used each state's optimal weights for predicting the evenly weighted composite of VAM, Tripod, and FFT (fourth entry in the first column). With this level of stability, 70 percent of the bottom-half teachers are in the bottom
c09.indd 296 3/17/2014 12:58:05 PM
Does the Test Matter? 297
TABLE 9.4. Year-to-Year Stability of Teacher Rankings Based on Various Weighted Composite Measures of Teacher Effectiveness
Overall State 1 State 2 State 4 State 5 State 6
Mathematics
Aggregate pre-dicting VAM
0.47 0.45 0.53 0.42 0.46 0.52
State composites predicting VAM
0.48 0.46 0.51 0.48 0.49 0.50
Aggregate predicting equal composite
0.54 0.63 0.58 0.57 0.58 0.42
States predicting equal composite
0.57 0.65 0.58 0.58 0.58 0.49
Equal composite 0.55 0.61 0.59 0.57 0.58 0.44
ELA
Aggregate com-posite predicting VAM
0.39 0.49 0.46 0.33 0.43 0.25
State composites predicting VAM
0.40 0.38 0.43 0.34 0.47 0.31
Aggregate predicting equal composite
0.52 0.62 0.57 0.47 0.61 0.40
States predicting equal composite
0.54 0.60 0.56 0.47 0.61 0.50
Equal composite 0.48 0.56 0.51 0.40 0.55 0.38
c09.indd 297 3/17/2014 12:58:05 PM

298 Designing Teacher Evaluation Systems
half in another section/year; 55 percent of the bottom 25 percent of teachers are in the bottom 25 percent in another section/year; and 46 percent of the bottom 10 percent of teachers are in the bottom 10 percent in another sec-tion/year. In short, the stability increase from .39 to .54 results in meaning-ful increases in the stability of relative rankings of teachers, especially at the extremes of the distribution (where policy is most often focused). The overall conclusion is, therefore, that a weighting system that is optimal for predicting next year's VAM will result in more teachers being incorrectly classified as high- or low-performing than one that is optimal for predicting a composite of multiple measures of teacher performance will.
SUMMARY OF FINDINGS
The purpose of this chapter was to investigate the extent to which some of the main results of the MET reports masked meaningful variation across states. In particular, the work focused on exploring the extent to which the state assess-ments used in the study were sensitive to observational and student survey mea-sures of teacher quality. A second focus was on exploring the extent to which differences across states in correlations among instruments were reflected in dif-ferences in the optimal weights for multiple-measure teacher evaluation systems.
Returning to the research questions, several clear conclusions result from this work. First, the raw correlations of VAM scores with pedagogical qual-ity ratings are generally low, with typical correlations falling in the range of .10 to .20; thus, we might conclude that the tests used in the partner states are only weakly sensitive to pedagogical quality, as judged by the MET study instruments. Given that there is no rule against which to evaluate these cor-relations, we cannot say whether the tests are “sensitive enough” to peda-gogical quality. Rather, what we can say is that there are several high-quality, research-based measures of teachers’ instruction that show small-to-no rela-tionship with student learning gains. The sensitivity appears to be somewhat weaker in English language arts than in mathematics. Again, one important explanation for these findings is that the reliability of all study instruments, with the possible exception of Tripod, was merely moderate.
A second conclusion is that state tests indeed differ, sometimes substan-tially, in their sensitivity to the measures of pedagogical quality at both the total score and subscale levels. Some states’ assessments appear to be sensi-tive to all of the measured indicators of pedagogical quality, whereas other
c09.indd 298 3/17/2014 12:58:05 PM

Does the Test Matter? 299
states’ assessments are insensitive to all indicators. Perhaps the most trou-bling case is State 4, where the assessments show limited to no sensitivity to student surveys or observational ratings in either subject. Of course, the tests in this state may be sensitive to some other measure of teacher quality that was not used in the MET study, just as the results described here with regard to particular instruments may not hold across all states in the United States.
A third conclusion is that the estimated optimal weights differ from state to state, again sometimes substantially. When the goal is predicting future value added, the weights in all states and both subjects favor prior value added, although to varying degrees (more so in mathematics and in states in which sensitivity is low). When the goal is predicting an evenly weighted composite of value added, Tripod surveys, and FFT scores, the optimal weights sometimes favor value added and sometimes favor the other measures. The weights also appear to vary somewhat more in ELA than in mathematics.
A fourth and final conclusion is that the year-to-year stability in estimates of teacher performance using the weighted composites varies across states; however, it is generally higher in several cases. First, the stability of teacher performance ratings is higher when the composite includes a greater weight on FFT and Tripod scores, since those individual components have higher reli-ability than VAM scores do. Second, the stability is only marginally higher when using state-specific optimal weights, as compared to the average opti-mal weights from across the partner states. Third, the stability of an evenly weighted composite is greater than that of a composite based primarily on VAM and not much lower than that of an optimally weighted composite. Even when the same weights are applied to all states, however, the stability of the resulting composites differs across states in sometimes meaningful ways.
IMPLICATIONS FOR POLICY
Several important policy recommendations flow from this chapter. First, states should consider weighting schemes that place substantial weight on each of the components of effective teaching. Should policymakers decide that effective teaching is defined by teachers who produce large achievement gains, are rated highly by students, and score well on observational proto-cols, then each of these measures should receive meaningful weights in the evaluation system. Perhaps the most sensible and straightforward approach
c09.indd 299 3/17/2014 12:58:06 PM

300 Designing Teacher Evaluation Systems
is to simply weight each of the measures of effective teaching equally. This matches the recommendations in the main MET project reports. As this chapter shows, an equal weighting approach performs well from a stability standpoint. At the same time, this approach does not appear to be meaning-fully affected by variation in the sensitivity of assessments. This approach also reduces some of the potential gaming issues that might come with a system that is more heavily weighted to one component or another (e.g., teachers focusing on teaching to the test in a system where substantial weight is placed on the test). Finally, this approach recognizes that teaching is a complex, multi-faceted set of skills that probably should not be reduced to just one type of measure. This approach will, however, diminish the abil-ity of the composite to predict future student test performance, particularly so in states in which the assessments are weakly sensitive to instruction.
A second recommendation is that states and districts should carefully study the sensitivity of their assessments to measures of pedagogical qual-ity. This is perhaps even more important in ELA, where sensitivity appears to be relatively lower than in mathematics. The first step in such a process is establishing a clear understanding of the type of instruction that is desired. Policymakers, researchers, and educators should work together to develop a clear definition of “high-quality” instruction. This means establishing a con-ception of effective teaching and ensuring that appropriate measures are constructed to capture each component reliably. Many states have already done this through their adoption of evaluation tools such as the Framework for Teaching in the No Child Left Behind waivers or Race to the Top applications.
This vision of effective instruction should also be made clear to teach-ers, so that they can work to align their instruction with the vision. Next, the goal should be to ensure that all state assessments, especially those used for decisions about teachers and schools, are sensitive to that kind of instruction. While there is some evidence as to how to evaluate the sensitivity of assess-ments (Polikoff, 2010), there is not a strong literature on building sensitive assessments. Building such assessments will require iterative test develop-ment and an explicit focus on sensitivity. Without sensitive assessments, many of the inferences made about teacher and school effectiveness on the basis of test scores only may be of questionable validity. Furthermore, it will be difficult for teachers to sustain instructional improvement if the tests used to gauge performance are not sensitive to improvements in instruction through professional development.
c09.indd 300 3/17/2014 12:58:06 PM

Does the Test Matter? 301
A third and final policy suggestion is that policymakers must work to provide teachers with clear interpretations of results from multiple measures evaluation systems. This means helping teachers understand how the scores on the multiple measures are each calculated, how they are related to one another, and what can be learned from combining information from multiple measures. These are challenging and complex issues that teachers cannot solve on their own, so policymakers must work to ensure that results are pre-sented to teachers in ways that are well understood and that decisions made on the basis of those results—both by teachers and by district personnel—are justifiable. The MET project reports offer a set of clear suggestions for states and districts undertaking these endeavors. If these conditions are not met, there is little hope that the results from multiple measures evaluation systems will be used in ways that are desired by policymakers.
The results presented here clearly demonstrate that some states’ tests are bet-ter than others when it comes to correlating with other desired outcomes. The reasons for these differences are not well known, but they should be an intense focus of study in the coming years. Several hypotheses seem particularly proba-ble. One hypothesis is that the tests that are less sensitive are more poorly aligned to the state content standards (Polikoff, Porter, & Smithson, 2011). Another hypothesis is that the less sensitive assessments are more poorly aligned to the content teachers are teaching (since teachers’ instruction is poorly aligned with standards and assessments on average (Polikoff, 2012)). A third hypothe-sis is that the variation in sensitivity is attributable to features of the test items or content (e.g., multiple choice versus constructed response, procedural versus more advanced cognitive demand). There are surely other hypotheses, as well, that each merit investigation. Regardless of the reasons for the insensitivity, as we move toward increased use of assessments for both formative and summative purposes, it is essential that these tests accurately reflect the quality and content of instruction being provided in the classroom. If not, the test results will send conflicting information that will prevent teachers from learning to improve.
REFERENCES AND ADDITIONAL RESOURCESAirasian, P. W., & Madaus, G. F. (1983). Linking testing and instruction: Policy issues. Journal of
Educational Measurement, 20(2), 103–118.Baker, B., Oluwole, J., & Green, P., III. (2013). The legal consequences of mandating high stakes
decisions based on low quality information: Teacher evaluation in the Race-to-the-Top era. Education Policy Analysis Archives, 21, 5.
c09.indd 301 3/17/2014 12:58:06 PM

302 Designing Teacher Evaluation Systems
Chen, J. (2012). Impact of instructional sensitivity on high-stakes achievement test items: A com-parison of methods. (Unpublished doctoral dissertation). Lawrence, KS: University of Kansas.
Cox, R. C., & Vargas, J. S. (1966). A comparison of item-selection techniques for norm refer-enced and criterion referenced tests. Paper presented at the Annual Conference of the National Council on Measurement in Education, Chicago, IL.
D’Agostino, J. V., Welsh, M. E., & Corson, N. M. (2007). Instructional sensitivity of a state stan-dards-based assessment. Educational Measurement, 12(1), 1–22.
Gamoran, A., Porter, A. C., Smithson, J., & White, P. A. (1997). Upgrading high school mathe-matics instruction: Improving learning opportunities for low-achieving, low-income youth. Educational Evaluation and Policy Analysis, 19(4), 325–338.
Glaser, R. (1963). Instructional technology and the measurement of learning outcomes: Some ques-tions. American Psychologist, 18, 519–521.
Greer, E. A. (1995). Examining the validity of a new large-scale reading assessment instrument from two perspectives. Urbana, IL: Center for the Study of Reading.
Haladyna, T. M., & Roid, G. H. (1981). The role of instructional sensitivity in the empirical review of criterion-referenced test items. Journal of Educational Measurement, 18(1), 39–53.
Mihaly, K., McCaffrey, D. F., Staiger, D. O., & Lockwood, J. R. (2013). A composite estimator of effective teaching. Seattle, WA: Bill & Melinda Gates Foundation.
Muthen, B. O., Huang, L., Jo, B., Khoo, S., Goff, G. N., Novak, J. R., et al. (1995). Opportunity-to-learn effects on achievement: Analytical aspects. Educational Evaluation and Policy Analysis, 17(3), 371–403.
Polikoff, M. S. (2010). Instructional sensitivity as a psychometric property of assessments. Educational Measurement: Issues and Practice, 29(4), 3–14.
Polikoff, M. S. (2012). Instructional alignment under No Child Left Behind. American Journal of Education, 118(3), 341–368.
Polikoff, M. S., Porter, A. C., & Smithson, J. (2011). How well aligned are state assessments of student achievement with state content standards? American Educational Research Journal, 48(4), 965–995.
Popham, J. W. (1971). Indices of adequacy for criterion-reference test items. In J. W. Popham (Ed.), Criterion-referenced measurement (an introduction) (pp. 79–98). Englewood Cliffs, NJ: Educational Technology Publications.
Popham, J. W. (2007). Instructional insensitivity of tests: Accountability’s dire drawback. Phi Delta Kappan, 89(2), 146–155.
Rovinelli, R. J., & Hambleton, R. K. (1977). On the use of content specialists in the assessment of criterion-referenced test item validity. Dutch Journal of Educational Research, 2(1), 49–60.
Ruiz-Primo, M. A., Shavelson, R. J., Hamilton, L., & Klein, S. P. (2002). On the evaluation of sys-tematic science education reform: Search for instructional sensitivity. Journal of Research in Science Teaching, 39(5), 369–393.
Wiley, D. E., & Yoon, B. (1995). Teacher reports on opportunity to learn: Analyses of the 1993 California Learning Assessment System (CLAS). Educational Evaluation and Policy Analysis, 17(3), 355–370.
c09.indd 302 3/17/2014 12:58:06 PM


![Index [pharmrev.aspetjournals.org]pharmrev.aspetjournals.org/content/pharmrev/43/4/local/back-matter.pdf · primary structure, kidney (fig.), 497 ... pathophysiology, ... schematic](https://img.dokumen.tips/doc/110x75/5b82cde67f8b9a315b8bcf1a/index-primary-structure-kidney-fig-497-pathophysiology-schematic.jpg)