Embed Size (px)
Citation preview
Chapter 9 Bankruptcy: Simulation Exercise
Staff Paper
Observations By: Eric Scorsone, Ph.D.
Nicolette Bateson, CPA Amanda Wright
Department of Agricultural, Food and Resource EconomicsMichigan State University
East Lansing, Michigan 48824
Notice/Disclaimer This document is provided for research and educational purposes only. It is not intended to provide legal or financial advice or counsel and should not be construed as such to any of its readers. If legal or financial advice is needed, the appropriate licensed professional should be contacted. The content of this paper is introductory and written to familiarize the reader with issues surrounding municipal bankruptcy. Where clarification is needed, it may be useful to consult the original sources cited in the text. The case source data has been altered for the purpose of exploring Chapter 9 planning considerations. Accordingly, the data does not represent the actual financial condition or projections of any one particular city.
2
Table of ContentsExecutive Summary ..........................................................................................................................3Introduction .....................................................................................................................................4PART 1: What Is Chapter 9? What Are the Legal Considerations? ..........................................4
Examining Chapter 9 ........................................................................................................................ 4How Chapter 9 Differs from the Powers Granted by State-Appointed Authorities .......... 4Why Preparatory Work is Needed Before Filing a Chapter 9 Petition ..................................5Policy Considerations ....................................................................................................................... 6Secured Versus Unsecured Creditors ........................................................................................... 6Managing a Municipality Throughout a Chapter 9 Proceeding ...............................................7
PART 2: Financial Considerations .................................................................................................7Quantifying the Scope of the Problem .........................................................................................7
Evaluating Cash Solvency ...........................................................................................................................................................7
Identifying the Options ............................................................................................................................................................... 8
Understanding Labor Costs ...................................................................................................................................................... 8
Providing Services ........................................................................................................................................................................ 8
Managing the Fiscal Problem ................................................................................................................................................... 9
Developing Metrics ........................................................................................................................... 9Conclusion ........................................................................................................................................9APPENDIX A – Chapter 9 Educational HandoutAPPENDIX B – Process for Analyzing Solvency
Exhibit B1: Five-Year Financial Plan
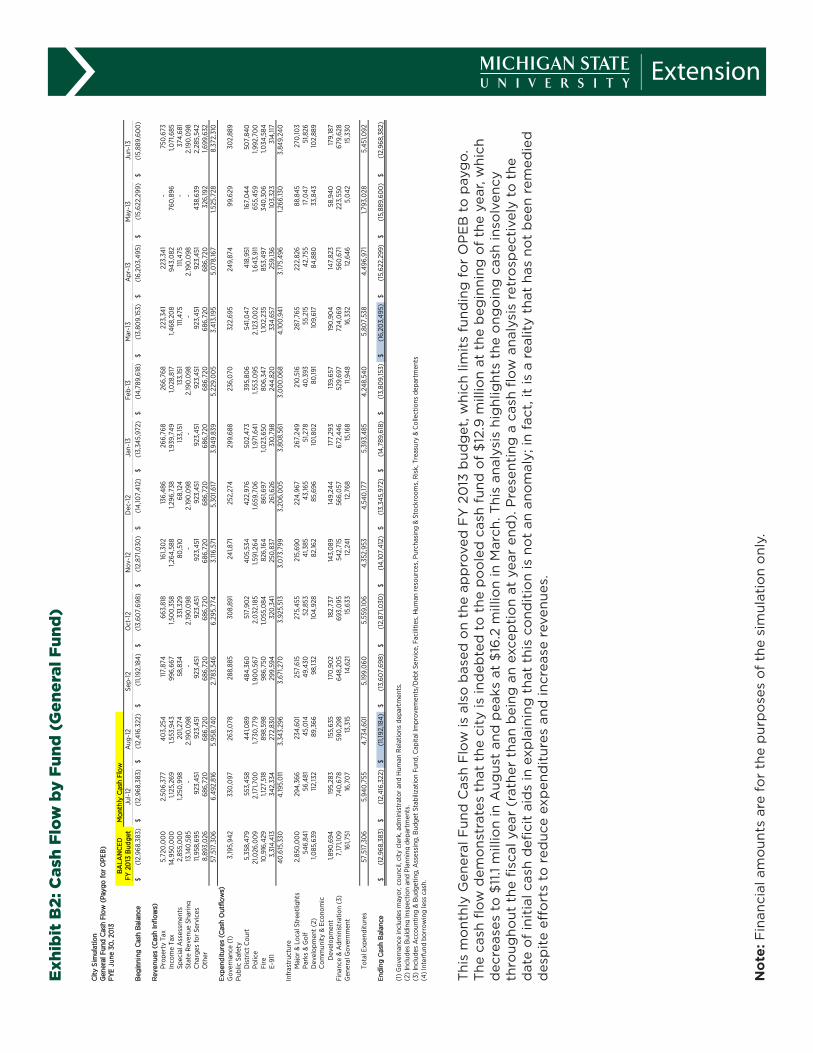
Exhibit B2: Cash Flow by Fund (General Fund)
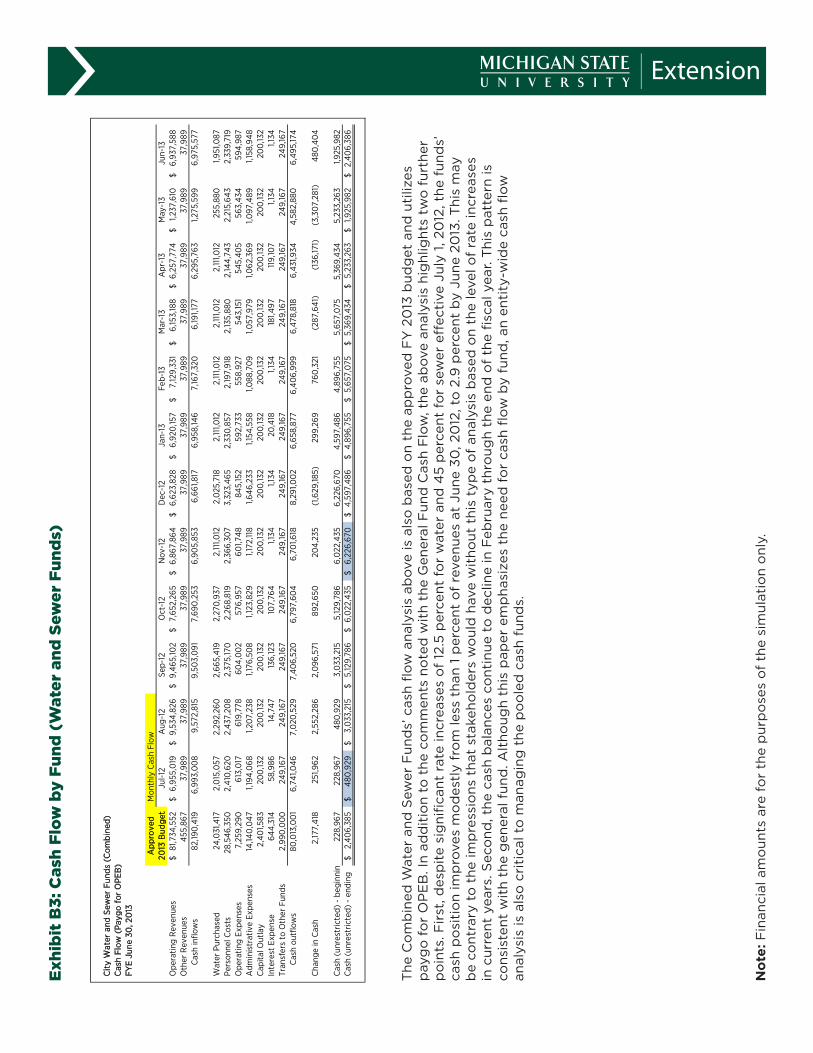
Exhibit B3: Cash Flow by Fund (Water and Sewer Funds)
Exhibit B4: Creditors List
Exhibit B5: What-If Analysis (Plan of Adjustment)
Exhibit B6: Summary of Pension Plan Funding Data
Exhibit B7: Summary of Pension Plan Annual Cost Data
Exhibit B8: OPEB by Category
Exhibit B9: OPEB by Group
Exhibit B10: Comparison of OPEB for Previously Proposed External Comparables
Exhibit B11: Enterprise Fund Unrestricted Net Assets (Deficit) vs. OPEB Trend
Exhibit B12: Key Data for Unrestricted Net Assets (Deficit) vs. OPEB Data
Exhibit B13: Staffing Levels
Exhibit B14: Per Employee Cost
3
Author NoteAmanda Wright is a J.D. candidate at Michigan State University (MSU) College of Law. She is a graduate assistant in the MSU Department of Agricultural, Food, and Resource Economics.
Nicolette Bateson is a certified public accountant in Michigan with more than 20 years of municipal finance and management experience. She serves as a visiting specialist at MSU researching municipal fiscal stress as well as providing educational programs for local government officials and their constituencies.
Eric Scorsone is a faculty member in the MSU Department of Agricultural, Food and Resource Economics and is an MSU Extension Specialist. Eric’s experience as an economist includes planning, budget and policy analysis for both state and local government. He is a nationally recognized expert on municipal distress policies and strategies.
Direct correspondence regarding this publication to:
Dr. Eric Scorsone, MSU Extension State and Local Government Program,
Department of Agricultural, Food and Resource Economics 90 Agriculture Hall 446 W. Circle Drive
Michigan State University East Lansing, MI 48824-1039 USA
email: [email protected]
Executive Summary Cities facing a financial emergency from chronic fiscal stress need to understand Chapter 9 municipal bankruptcy. While not a cure for fiscal stress, Chapter 9 is a tool that a municipality may use to reset its financial course when all other methods fail. Several lessons learned through a simulation exercise using live case data prove beneficial to those charged with municipal fiscal health. From a legal perspective, the exercise re-vealed a need to address common misconceptions about Chapter 9. From a financial perspective, strategically planning to avoid a bankruptcy increases transparency while working through a checklist of alternatives. If those alternatives fail, the city is in a reasoned position to seek Chapter 9 relief.
MSU is an affirmative-action, equal-opportunity employer, committed to achieving excellence through a diverse workforce and inclusive culture that encourages all people to reach their full potential. Michigan State University Extension programs and materials are open to all without regard to race, color, national origin, gender, gender identity, religion, age, height, weight, disability, political beliefs, sexual orientation, marital status, family status or veteran status. Issued in furtherance of MSU Extension work, acts of May 8 and June 30, 1914, in cooperation with the U.S. Department of Agriculture. Thomas G. Coon, Director, MSU Extension, East Lansing, MI 48824. This informa-tion is for educational purposes only. Reference to commercial products or trade names does not imply endorsement by MSU Extension or bias against those not mentioned.
Produced by ANR Communications. 12/6/2012.
4
IntroductionTo better understand Chapter 9 municipal bankruptcy, Michigan State University conducted a simulation exercise based on historical data from a U.S. city. We present the lessons learned in this paper. In Part 1, we discuss legal considerations garnered from the simulation. That discussion presumes some basic understanding of Chapter 9. In Part 2, we identify financial analysis and planning strategies for the financially distressed city. In preparing the simulation
exercise, it became evident that planning for, or preferably attempting to avert, Chapter 9 should begin without delay. The related financial analysis brings clarity to the magnitude of the fiscal hurdles and prepares stakeholders who bear the greatest risk. Appendix A to this paper presents a user-friendly explanation of Chapter 9. Appendix B provides example financial analysis and commentary for cities facing chronic fiscal stress.
Part 1: What Is Chapter 9? What Are the Legal Considerations?
Chapter 9 is basically a structured negotiation process in which a municipality proposes a plan of adjust-ment that its creditors vote on. If the plan meets the requirements of the bankruptcy code, the bankruptcy judge approves it. The plan of adjustment is essen-tially nothing more than a new contract between the debtor and its creditors.
Examining Chapter 9Cash is Crucial: The pivotal factor in identifying Chapter 9 eligibility is a persistent cash flow shortage. Symptoms include lack of sufficient cash inflows, lim-ited or nonexistent access to borrowing, and imple-mentation of significant cost and service reductions.
Reducing and Planning for the Costs of Filing a Chapter 9: Since Chapter 9 can be a costly proce-dure, understanding how to reduce the costs associ-ated with a Chapter 9 filing is critical.
Planning and Preparing for a Chapter 9: A mu-nicipality needs to plan properly to successfully file for a Chapter 9 bankruptcy. This involves examining the entire process to gain an understanding of it.
Managing a Municipality Throughout a Chapter 9 Proceeding: Municipalities should consider de-veloping an advanced plan of financial management in case they need to file Chapter 9. A municipality should understand how to manage its finances during the Chapter 9 proceeding.
How Chapter 9 Differs From the Powers Granted by State-Appointed Authorities Distinguishing Chapter 9 From Powers Granted to State-Appointed Authorities: Many states have enacted legislation that provides for state-appointed authorities to guide cities toward fiscal stability. Ex-amples include the emergency financial control board in the New York State Financial Emergency Act, Penn-sylvania’s Intergovernmental Cooperation Authority, and the emergency financial manager in Michigan’s Local Government Fiscal Responsibility Act. While the powers granted in these statutes vary, in general, they fall short of the financial restructuring tools available in Chapter 9. Understanding the differences between Chapter 9 and each state’s laws is critical to planning purposes.
The Automatic Stay: Chapter 9 allows a municipal-ity to utilize the automatic stay, protecting it from creditor claims or litigation, and giving it a “breath-ing spell” while it adjusts its debt. In contrast, while adjusting debt under a state authority, a municipality will need to pay its bills, and may face litigation if it is unable to pay its creditors in a timely manner.
The Advantages of One Forum for All Claims: Chapter 9 offers the advantage of having all parties and all claims in one forum before a single judge.
5
The procedure brings all parties to the negotiation stage and prevents certain parties from “holding out for more.” When municipalities negotiate with their creditors outside of a Chapter 9, they face the risk that multiple groups of creditors will continue to demand or hold out for a better deal.
The Aid of an Expert in Bankruptcy and Fiscal Reorganization: Chapter 9 offers the advantage of utilizing a bankruptcy judge. The bankruptcy judge who presides over a Chapter 9 proceeding, while not necessarily experienced in Chapter 9, will be expe-rienced in fiscal issues and debt reorganization. The judge can often act as a mediator and exert pressure on creditors to make concessions.
The Elimination of Constitutional and Other Challenges to Rejection of Contracts: Debt adjustment under a state-appointed authority will likely subject the municipality to litigation as credi-tors contest the state appointee’s authority to take certain actions. Negotiations outside of a Chapter 9 proceeding often lead to creditors filing lawsuits, which diverts time, money and energy away from the real issues while the municipality continues to try to provide services to its citizens. Under Chapter 9, a municipality has the clear authority to modify, assume or reject executory contracts, and these actions will not be subject to constitutional challenges outside of the bankruptcy proceeding while adjustment takes place.
Why Preparatory Work Is Needed Before Filing a Chapter 9 PetitionEligibility Requirements a. Be a Municipality.b. Be Authorized by State Law. c. Be Insolvent.
(We describe a municipality as “insolvent” when it has a cash flow shortage or will run out of cash within the next fiscal year. The municipality is generally not paying its debts as they become due or will be unable to pay its debts as they become due.)
d. Desire to Effect a Plan of Adjustment, AND either
(i) Obtained an agreement with the majority of creditors, or
(ii) Negotiated in good faith, but failed to obtain an agreement, or
(iii) Found negotiations impracticable.
These eligibility requirements make it critical for a municipality to engage in certain preparation actions before filing a Chapter 9 petition as the eligibility requirements are a critical threshold issue of a Chapter 9 case.
In light of these eligibility requirements, we recom-mend a municipality that may be forced to file for bankruptcy engage in a meticulous review of certain pre-filing requirements before filing, which include, but are not limited to, the following:
• Do we have state authorization?
• Do we have a draft plan of adjustment that we believe will allow us to continue to provide services to our citizens, and return us to and sustain financial solvency?
• Is our draft plan of adjustment supported by at least one class of our creditors and will the state support this plan?
• Have we attempted to negotiate with creditors about a meaningful plan of adjustment, or are negotiations impracticable?
• Have we kept meaningful records of our negotiations with creditors to prove we have negotiated in good faith?
• Do we have a financial management plan to put to use while our Chapter 9 case is pending?
• Have we budgeted for the administrative costs of a Chapter 9 bankruptcy?
Because the eligibility requirements are so important to the filing of a successful case, and careful pre-planning can reduce the cost and time spent on litigating these requirements, ideally, a municipal official or representative would be responsible for documenting and keeping accurate and complete records of these considerations.
A municipality that may be forced to file Chapter 9 bankruptcy must begin to draft a plan of adjustment. Key to the success of the plan of adjustment is the fo-cus on at least five-year planning. The plan is usually implemented over a period of about five years, and it must maintain – not merely attain – financial solvency.

6
Important Note: While tax increases and asset sales are viable fiscal strategies, these actions are not required as a prerequisite to obtaining access to a Chapter 9 proceeding.
Policy ConsiderationsTransparency & Honesty: An important policy consideration – and perhaps a point of contention – is the extent of a municipality’s transparency with its creditors and with its residents about the reality of filing a Chapter 9. Experts generally agree that a municipality should provide accurate financial infor-mation to its creditors.1 Additionally, recall that one of the requirements to enter bankruptcy is good faith negotiations surrounding a plan of adjustment that could be executed under a Chapter 9. Without trans-parency as to the fact that Chapter 9 is the alternative to unsuccessful negotiations, a municipality could potentially fail the good faith negotiations test and be denied access to a Chapter 9. Lastly, many municipali-ties have successfully utilized the “threat” of a Chap-ter 9 proceeding to bring creditors to the negotiation table and force them to make concessions. Ultimately, the extent of a municipality’s transparency about a potential filing is a key point of consideration. Ideally, all municipal officials and representatives should be aware of the reality of filing a Chapter 9 as it applies to their municipality and should agree on the level of transparency to the public and to creditors alike.
Public Relations & Press: A municipality that files a Chapter 9 will receive a lot of attention from the media. The municipality’s representatives and of-ficials must be knowledgeable about the proceeding and prepared to answer challenging questions from the public and the media. Lastly, because the public is very familiar with a Chapter 11 proceeding, municipal representatives and officials should be well versed on the key distinctions between these two proceedings to answer frequently asked questions knowledgably. For example, municipalities should be prepared to formu-late accurate and consistent answers for questions, which include, but are not limited to:
• Why did the municipality file for Chapter 9 protection? And how is bankruptcy going to help?
1 Knox, John and Levinson, Mark, Avoiding and Using Chapter 9 in Times of Fiscal Stress. 2009.
• How are vendors impacted by the bankruptcy filing?
• How will the bankruptcy case affect my municipality’s ability to provide services to me as a taxpayer and resident?
• What has the municipality done to increase revenues or to avoid bankruptcy?
• Will the municipality be forced to liquidate all its assets?
• Was the municipality forced to file for bankruptcy by its creditors?
• Who does our municipality owe money to?
• What will happen post-bankruptcy? How will this affect our municipality’s ability to attract new businesses?
• I am a retiree, why am I a creditor of the municipality? How will I receive notice of how my rights are affected?
• How will pensions be affected?
• How long will the municipality be in bankruptcy?
• Who can I contact for more information?
Loss of Power: A disadvantage of a Chapter 9 pro-ceeding is the lack of control of the outcome from a political standpoint. For example, outside of a Chap-ter 9, some states retain control over the appointed authority. However, once in bankruptcy, some politi-cal power to control at least the outcome is ceded to the bankruptcy judge.
Secured Versus Unsecured CreditorsSpecial Revenue Versus General Obligations: Generally, a municipality has two types of bonds un-der a Chapter 9 bankruptcy: general obligation bonds and special revenue bonds. The municipality issues general obligation bonds secured by its full faith and credit. Special revenue bonds are treated differently because these obligations are secured by some specific pledge of revenue, usually the profit retained from the operation of a special project such as a toll road. Un-der Chapter 9, this kind of debt is not subject to the automatic stay and is not able to be impaired. How-ever, nothing in the bankruptcy code compels a mu-nicipality to continue running a special project, and

7
creditors (i.e., special revenue bondholders) are only entitled to payments from profit less the operating expenses of the special project. Therefore, sometimes this secured debt becomes unsecured, and special revenue bondholders have an incentive to compromise and voluntarily agree to adjustment of their debts.
Managing a Municipality Throughout a Chapter 9 ProceedingDecide Which Vendors and Which Bills Need to Be Paid: A municipality that enters bankruptcy manages its funds much like any other business that declares bankruptcy. The municipality must decide which vendors to pay and which not to pay. A munici-pality must plan and adopt a budget under a Chapter 9 proceeding because the bankruptcy judge will not instruct vendors to continue to provide services, will not give the municipality money and will not take control over the municipality’s day-to-day operations.
A municipality must decide which services it can live with and which services it cannot live without. Ven-dors and suppliers might also require some proof the municipality will pay any missed payments during the Chapter 9 proceeding if the entity continues to provide services or supplies to the municipality. A mu-nicipality should consider that its payroll expenses are likely one of its largest expenses. It can immediately stop paying retiree health care due to the automatic stay, which will free up some cash as the municipal-ity budgets to provide services throughout a pending Chapter 9 case.
Budgeting for Litigation Expenses: Filing a Chapter 9 bankruptcy is costly. Professional fees and other services from two recent bankruptcy cases in other states accumulated to amounts exceeding $3.5 and $10 million dollars. A municipality considering bankruptcy must budget for the administrative costs of the procedure. For the bankruptcy judge to approve the plan, the municipality must show it will pay all administrative costs of the proceeding.
Part 2: Financial ConsiderationsA long-term financial strategy remains important for any municipality for numerous reasons. Municipali-ties must weather changes in the economy, provide desirable services, invest in infrastructure and operate within revenue constraints. For the local government in financial distress, the need for a long-term financial strategy becomes a pivotal process. Municipalities should design such a strategy to avert the need for a Chapter 9 bankruptcy. When other efforts cannot overcome unsustainable commitments, then Chapter 9 becomes a tool to reset the municipality’s financial course.
Quantifying the Scope of the ProblemUnderstanding the depth of unsustainable commit-ments is essential to determining a corresponding financial strategy. This section of the report provides a road map to quantify the scope of the problem through a series of analyses to evaluate cash solvency. The data are based on a case study city where the analyses were subjected to a bankruptcy simulation exercise. We present key concepts below with refer-
ence to explanatory exhibits in Appendix B. Depend-ing on the city and its fiscal stressors, additional types of analyses will be necessary. This section identifies proposed metrics that go beyond the information found in audited financial statements. Use the metrics as a starting point to identify the existence of a severe cash and service-level solvency problem.
Evaluating Cash SolvencyFive-Year Financial Plan: No meaningful discus-sion of solvency can begin without a long-term view of the entity’s cash flow (Exhibit B1). This should be the first step in identifying the scope of the potential insolvency.
Cash Flow by Fund: Most municipalities utilize a pooled cash fund, which is an effective cash manage-ment tool. However, the individual fund cash balances may be overlooked, even when a cash deficit exists. Municipalities need cash flow analyses by fund (Ex-hibits B2 and B3) to monitor solvency conditions to a) avoid masking insolvency, b) avoid placing an over-reliance on internal fund borrowing, and c) assure that municipalities use financial resources for their intended purposes.
8
Managing Risk: Municipalities should prepare a cash flow analysis for each fund. While the emphasis on the general fund is obvious, municipalities must also analyze other funds essential to the public’s health, safety and welfare, such as enterprise utility funds.
Identifying the OptionsList of Creditors: Even though the city leaders know who the creditors are, the management team should assemble a list of creditors in a format used in a bank-ruptcy proceeding to identify the parties at risk and quantify their exposure (Exhibit B4). This information shapes strategy in addressing chronic fiscal stress as well as educating stakeholders.
What-If Analysis (Plan of Adjustment): After the municipality develops the initial five-year plan (Ex-hibit B1), it should adjust the plan for realistic revenue enhancements and cost reductions. As the municipal-ity explores additional alternatives, it updates the plan and various versions become what-if scenarios. If a structural cash deficit is projected to continue, and other reasonable options are unlikely, the city reviews the creditors list (Exhibit B4) to identify potential creditor adjustments to work into the plan. This step in the analysis moves the five-year plan into the devel-opment of a proposed plan of adjustment (Exhibit B5). Municipalities in financial emergencies should begin this process as part of developing a strategic plan to address the crisis. This process provides an important reality check on the depth of the structural budget problem.
Developing Objectives: Whether it is a five-year plan for restructuring or a proposed bankruptcy plan of adjustment, the municipality (and its stakehold-ers and residents) should identify feasible objectives. In developing this case study, the authors offered the following objectives for this process: 1) restructure liabilities to provide an acceptable level of services within the available resources; 2) exit the bankruptcy process with a financial plan and controls to mitigate overextending the municipality’s financial obligations again in the future; and 3) seek a plan that is responsi-bly committed to funding the adjusted obligations.
Understanding Labor CostsPension Warning Signs: The actuarial report can reveal concerns about a municipality’s fiscal condition
and solvency that go beyond the footnote disclosures in the audited financial statements. Exhibit B6 shows key data related to pension funding; Exhibit B7 shows annual cost data. Warning signs include a) low fund-ed percentages, b) “reserve” for employee contribu-tions and current retiree obligations exceeding avail-able assets, c) market value of assets being materially less than actuarial value of assets, d) rapidly increas-ing contribution rates, e) negative net cash flow on an annual basis (i.e., retiree payouts exceed employer contributions), f) number of retirees significantly exceeding actives indicating maturity of plan, and g) rapid decrease in active payroll (signaling changes that will affect the funding assumptions). While indi-vidually these conditions may have reasonable ex-planations, in total, these factors depict a vulnerable pension system that will further strain resources to be sustainable.
OPEB Sustainability: State and local governments increasingly target the OPEB (other postemployment benefits) liability for retiree healthcare as a source of cost restructuring. Developing a strategy to address these costs means understanding a) the amount of li-ability related to current employees versus retirees, b) the extent to which the group is pre-Medicare versus Medicare eligible, c) which employee groups are lead-ers and/or carry critical mass to negotiate a change, d) the number of actives to retirees, e) how to commu-nicate the scope of the problem to stakeholders and f) the financial impact of OPEB on governmental versus enterprise funds. Exhibits B8 through B12 provide sample analysis for each of these issues.
Staff Reductions Versus Budget Reductions: Decreased staffing levels often do not equate to a cor-responding decrease in personnel expenditures. The combined effect of vested legacy benefits and direct reimbursement for unemployment negates some of the budgetary impact of workforce reductions. While decreasing staffing levels reduces the budget, the number of eliminated positions needed to bring about significant budgetary change becomes more unreal-istic to continue providing services. Exhibits B13 and B14 explain this relationship.
Providing ServicesService Providers: Often fiscally troubled cities that encounter a decrease in population and resulting workforce reductions do not experience a decrease in
9
workload. For example, the city in fiscal crisis is often nationally noted for having a higher violent crime rate in the United States for cities within its popula-tion category. Police response times, case closure and crime prevention are a source of frustration for city residents and property owners. Other city services, even if funded by federal grants, have suffered due to personnel reductions.
Infrastructure and Capital Reinvestment: A real-istic financial plan should quantify and address capital needs. The simulation city does not have an inventory of infrastructure needs.
Service Level Solvency: Simply focusing on the num-bers will not address the long-term health of the municipality, dependent on attracting and retaining residents and businesses. Chapter 9 is only a tool to address a one-time financial restructuring. The chal-lenge is crafting a comprehensive plan for true long-term sustainability. That task goes beyond the admin-istration to include constituents, intergovernmental players and the private sector.
Managing the Fiscal ProblemEarlier recommendations to address the financial crisis include identifying stakeholders, developing a communications plan, documenting negotiation ef-forts, and budgeting resources to evaluate and poten-tially pursue Chapter 9. Other recommendations from the simulation event include the following:
Seek alternative revenues sources and cost reductions to demonstrate effort to avert bankruptcy (i.e., income tax, Headlee override and benefit changes).
Use an actuary to cost out OPEB and pension benefit
changes in advance to gauge effectiveness of cost con-trol efforts.
Understand the potentially severe implications of ig-noring the problem. Public officials may face sanctions if a municipality is forced to pursue bankruptcy to avoid breaching contracts, missing debt service pay-ments or failing to provide required levels of service as a result of cash deficits.2
Developing MetricsIn preparing the simulation case study, the authors identified some metrics that appeared to be effective in conveying the severity of the case study city’s po-tential insolvency. They include:
Percent of General Fund Budgeted for Actual Current Retiree Premiums: The simulation city needs $9M out of the $57M general fund budget to pay that fund’s share of current retiree premiums (equiva-lent to 16 percent).
Market Value of Assets as a Percent of Reserve Needed for Current Retirees Benefits and Employee Contributions: In the simulation city, this approximates 54 percent ($850M reserves needed divided by $460M assets) identifying the pension un-derfunding for existing retirees.
Number of Months that the Fund is in a Cash Deficit: In the simulation case, the city’s general fund is estimated to have been in a cash deficit position for at least 24 to 30 months or longer. Proving this issue is pivotal to acceptance of the Chapter 9 filing.
2
Id.
ConclusionMunicipalities can learn two overriding lessons from this simulation. First, many common misconceptions exist about Chapter 9’s role in municipal financial restructuring. Second, strategic financial planning efforts are essential to addressing financial stress to avert, or alternatively be prepared for, Chapter 9.
Preventing a structural fiscal crisis hinges on quantify-ing fiscal realities on a multiple-year basis in advance. Further education on the legal and financial consid-erations would benefit public officials charged with managing fiscally stressed municipalities.

APPENDIX A:Educational Handout
Chapter 9: Municipal Bankruptcy 1
Chapter 9: Municipal Bankruptcy
ContentsChapter 11 Versus Chapter 9: The Basic Distinctions .......................................................................................................1The Gatekeeper Requirements: Chapter 9 Eligibility .....................................................................................................2The Four Gatekeeper Requirements ...................................................................................................................................2Creditor Negotiation Tests ....................................................................................................................................................4What is the Plan of Adjustments? ........................................................................................................................................6Compliance With the Applicable Provisions of the Code..............................................................................................6The “Cram Down” Provision ..................................................................................................................................................7Court Approval .........................................................................................................................................................................7Commonly Cited Advantages and Disadvantages of a Chapter 9 Proceeding ........................................................8
Use this handout only for educational and research purposes to aid in a bankruptcy simulation. It is not meant to be legal advice. If you need legal advice, contact a licensed attorney.
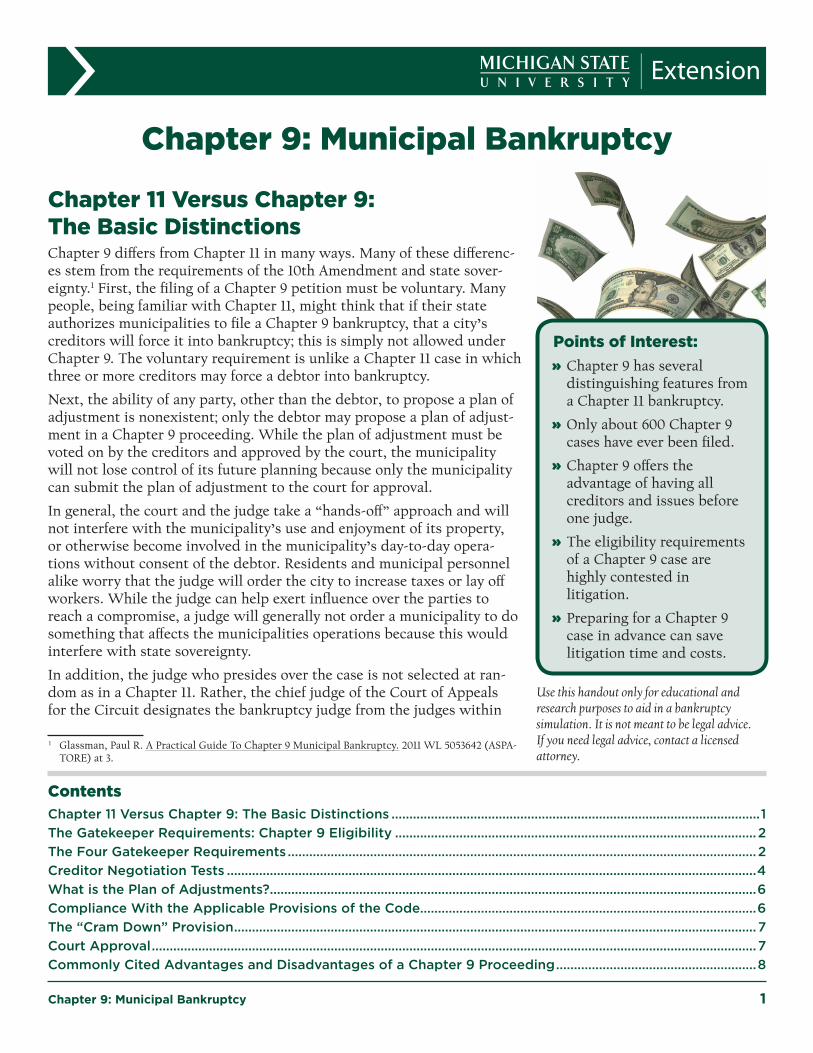
Chapter 11 Versus Chapter 9: The Basic Distinctions Chapter 9 differs from Chapter 11 in many ways. Many of these differenc-es stem from the requirements of the 10th Amendment and state sover-eignty.1 First, the filing of a Chapter 9 petition must be voluntary. Many people, being familiar with Chapter 11, might think that if their state authorizes municipalities to file a Chapter 9 bankruptcy, that a city’s creditors will force it into bankruptcy; this is simply not allowed under Chapter 9. The voluntary requirement is unlike a Chapter 11 case in which three or more creditors may force a debtor into bankruptcy.
Next, the ability of any party, other than the debtor, to propose a plan of adjustment is nonexistent; only the debtor may propose a plan of adjust-ment in a Chapter 9 proceeding. While the plan of adjustment must be voted on by the creditors and approved by the court, the municipality will not lose control of its future planning because only the municipality can submit the plan of adjustment to the court for approval.
In general, the court and the judge take a “hands-off” approach and will not interfere with the municipality’s use and enjoyment of its property, or otherwise become involved in the municipality’s day-to-day opera-tions without consent of the debtor. Residents and municipal personnel alike worry that the judge will order the city to increase taxes or lay off workers. While the judge can help exert influence over the parties to reach a compromise, a judge will generally not order a municipality to do something that affects the municipalities operations because this would interfere with state sovereignty.
In addition, the judge who presides over the case is not selected at ran-dom as in a Chapter 11. Rather, the chief judge of the Court of Appeals for the Circuit designates the bankruptcy judge from the judges within
1 Glassman, Paul R. A Practical Guide To Chapter 9 Municipal Bankruptcy. 2011 WL 5053642 (ASPA-TORE) at 3.
Points of Interest: » Chapter 9 has several distinguishing features from a Chapter 11 bankruptcy.
» Only about 600 Chapter 9 cases have ever been filed.
» Chapter 9 offers the advantage of having all creditors and issues before one judge.
» The eligibility requirements of a Chapter 9 case are highly contested in litigation.
» Preparing for a Chapter 9 case in advance can save litigation time and costs.

2 Chapter 9: Municipal Bankruptcy
the circuit. A Chapter 9 bankruptcy offers the opportunity for an appoint-ment of a qualified judge with enough time to handle the complex issues that will arise in a Chapter 9 filing.
Finally, a Chapter 9 case has no liquidation provision. A municipality cannot be forced to sell its assets and distribute the profit to its credi-tors. However, a municipality may choose to sell assets if it wants to. Most people are familiar with a Chapter 11 bankruptcy in which there is a liquidation provision that forces the company or business to sell off all of its assets. Residents worry that if a city or town goes bankrupt, it will be forced to sell the library, city hall or the hospital, if the municipality owns such assets. While selling assets or at least researching their value may be a fiscal strategy the municipality uses, it will not be forced to sell any of its assets.
The Gatekeeper Requirements: Chapter 9 EligibilityIn order to commence a case under Chapter 9, a municipality files a petition with the court. Usually, creditors file objections to the petition, claiming that the municipality does not meet the eligibility requirements. Creditors want to keep a municipality out of bankruptcy because after a municipality gains access to a bankruptcy proceeding, the creditors lose significant control over their claims. The municipality bears the burden of proving that it meets each of the four eligibility requirements listed under 11 USC 109(c)(1)-(4) and at least one of the four requirements listed under 11 USC 109(c)(5). Therefore, eligibility becomes a critical threshold issue in bankruptcy and is essential to a successful filing.
Since often creditors will vehemently contest eligibility, knowledge of the eligibility requirements and careful pre-planning can minimize litigation time and costs. Additionally, the court leans toward allowing a munici-pality access to bankruptcy because it gives the municipality a chance to successfully readjust its debts.
For simplicity, we’ll categorize the first four requirements as the “Gate-keeper Requirements” because creditors who are trying to keep the municipality out of bankruptcy vehemently contest these requirements. We’ll categorize the second four requirements as the “Creditor Nego-tiation Tests” because nearly all of these requirements have to do with negotiation and only one of them must be met.
The Four Gatekeeper RequirementsAs previous stated, the municipality must meet each of the four eligibil-ity, or Gatekeeper Requirements. The four Gatekeeper Requirements are listed under 11 USC 109(c)(1)-(4) of the bankruptcy code. Under these requirements an entity must (1) be a municipality to be eligible for relief under Chapter 9, (2) be authorized by state law to file for Chapter 9 bankruptcy relief, (3) be insolvent, and (4) desire to effect a plan of adjustment. The following section further explains each of these require-ments.
The City of Vallejo, California, filed for a Chapter 9 bankruptcy in 2008 and spent two years litigating eligibility requirements.
Chapter 9: Municipal Bankruptcy 3
Must Be a Municipality and Must Be Specifically Authorized by State LawAn entity must be a municipality to be eligible for relief under Chapter 9. The bankruptcy code defines a “municipality” as a “political subdivision or public agency or instrumentality of a State.”2 To decide if an entity is a municipality, one court used a three-part test looking at (1) whether the entity has traditional government attributes or engages in traditional government functions, (2) if so, whether there is state control, and (3) whether or not the state categorizes the entity as a municipality.3 Gener-ally, a political subdivision typically includes such entities as cities, coun-ties, townships or towns, while public agencies are “state-sponsored or controlled” authorities or entities that raise revenues through taxes.4
A municipality must be also be authorized by state law to file for Chapter 9 bankruptcy relief. The authorizing statute must be explicit, written and exact, plain and “direct with well-defined limits, so that nothing is left to inference or implication.”5 Courts will no longer find “general authoriza-tion” to file for Chapter 9 bankruptcy by inference from the general pow-ers that a municipality possesses.6 For example, authorization will not be found in states that generally allow municipalities to sue or be sued, to control finances or to be debtors.7
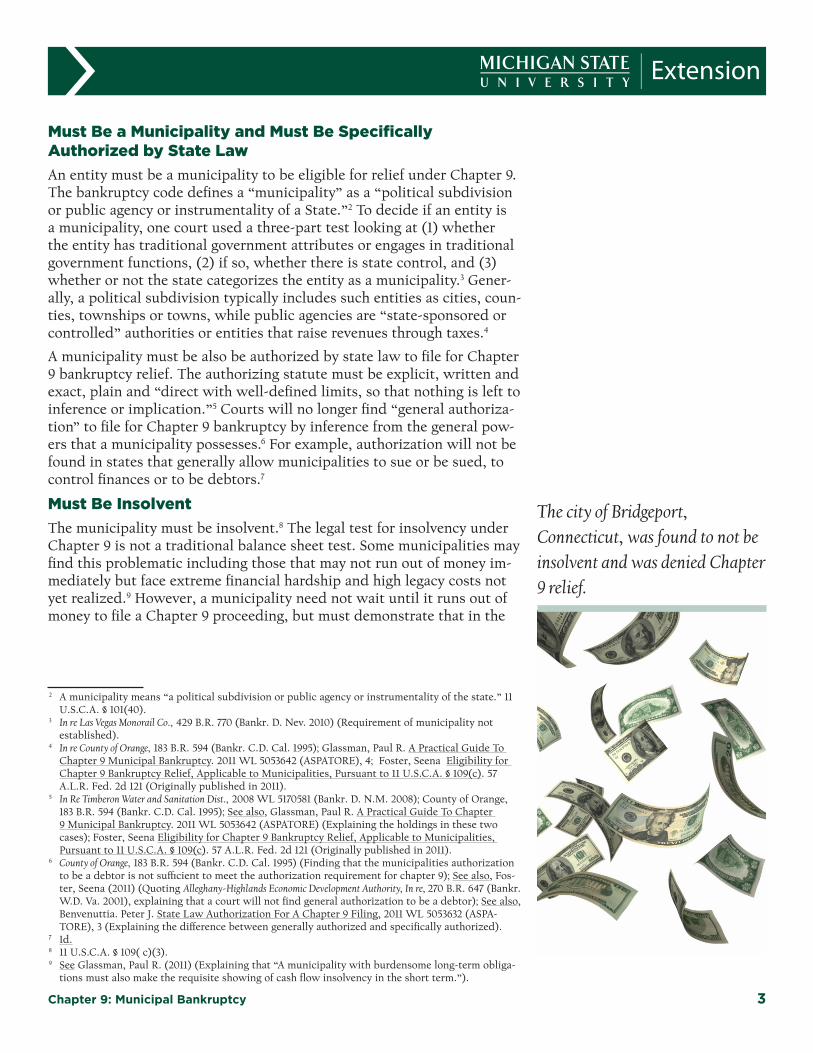
Must Be InsolventThe municipality must be insolvent.8 The legal test for insolvency under Chapter 9 is not a traditional balance sheet test. Some municipalities may find this problematic including those that may not run out of money im-mediately but face extreme financial hardship and high legacy costs not yet realized.9 However, a municipality need not wait until it runs out of money to file a Chapter 9 proceeding, but must demonstrate that in the
2 A municipality means “a political subdivision or public agency or instrumentality of the state.” 11 U.S.C.A. § 101(40).
3 In re Las Vegas Monorail Co., 429 B.R. 770 (Bankr. D. Nev. 2010) (Requirement of municipality not established).
4 In re County of Orange, 183 B.R. 594 (Bankr. C.D. Cal. 1995); Glassman, Paul R. A Practical Guide To Chapter 9 Municipal Bankruptcy. 2011 WL 5053642 (ASPATORE), 4; Foster, Seena Eligibility for Chapter 9 Bankruptcy Relief, Applicable to Municipalities, Pursuant to 11 U.S.C.A. § 109(c). 57 A.L.R. Fed. 2d 121 (Originally published in 2011).
5 In Re Timberon Water and Sanitation Dist., 2008 WL 5170581 (Bankr. D. N.M. 2008); County of Orange, 183 B.R. 594 (Bankr. C.D. Cal. 1995); See also, Glassman, Paul R. A Practical Guide To Chapter 9 Municipal Bankruptcy. 2011 WL 5053642 (ASPATORE) (Explaining the holdings in these two cases); Foster, Seena Eligibility for Chapter 9 Bankruptcy Relief, Applicable to Municipalities, Pursuant to 11 U.S.C.A. § 109(c). 57 A.L.R. Fed. 2d 121 (Originally published in 2011).
6 County of Orange, 183 B.R. 594 (Bankr. C.D. Cal. 1995) (Finding that the municipalities authorization to be a debtor is not sufficient to meet the authorization requirement for chapter 9); See also, Fos-ter, Seena (2011) (Quoting Alleghany-Highlands Economic Development Authority, In re, 270 B.R. 647 (Bankr. W.D. Va. 2001), explaining that a court will not find general authorization to be a debtor); See also, Benvenuttia. Peter J. State Law Authorization For A Chapter 9 Filing, 2011 WL 5053632 (ASPA-TORE), 3 (Explaining the difference between generally authorized and specifically authorized).
7 Id.8 11 U.S.C.A. § 109( c)(3).9 See Glassman, Paul R. (2011) (Explaining that “A municipality with burdensome long-term obliga-
tions must also make the requisite showing of cash flow insolvency in the short term.”).
The city of Bridgeport, Connecticut, was found to not be insolvent and was denied Chapter 9 relief.
4 Chapter 9: Municipal Bankruptcy
near future it will run out of money and will be unable to pay its debts as they become due.10
We can say a municipality is insolvent when it is (1) generally not paying debts as they become due unless such debts are the subject of a bona fide dispute or (2) unable to pay its debts as they become due.11 The test for insolvency involves a prospective cash flow test beginning from the date the municipality files the petition. The prospective analysis will look no further than the current or upcoming fiscal year.
Must Desire to Effect a Plan of AdjustmentThe municipality must desire to effect a plan of adjustment.12 This re-quirement assures that the purpose of Chapter 9 is being realized. Courts have generally held that there is no bright-line rule or specific test to prove when a municipality meets this requirement.13
Usually, a filed statement or oath indicating intent to effect a plan of adjustment, combined with evidence of efforts made toward negotiat-ing and drafting a plan, would satisfy the court that the municipality met the requirement.14 The municipality may use direct or circumstantial evidence to fulfill this requirement. Best practice indicates that a munici-pality should file a draft plan of adjustment with the petition for relief, or file one as close to the filing of the petition as possible.
Creditor Negotiation TestsAs previous stated, the municipality must meet at least one of the four Creditor Negotiation tests. The four tests are listed under 11 USC 109(c)(5) of the bankruptcy code. The tests require that the municipality show that (1) it has reached an agreement with the majority of its creditors to file for bankruptcy, (2) it has negotiated in good faith with its creditors but failed to reach an agreement, (3) negotiations are impractical, or (4) it believes a creditor may attempt to obtain an avoidable preference.15 The following section further explains each of these tests.
Obtained an Agreement of Creditors or Negotiated in Good Faith with CreditorsThe municipality must show it has reached an agreement with the ma-jority of its creditors to file for bankruptcy. Prior to filing the petition, a municipality could obtain the agreement of creditors holding at least a majority of the claims of each class that the municipality intends to
10 Foster, Seena (2011) (Explaining the court in City of Bridgeport, In re, 129 B.R. 332 (Bankr. D. Conn. 1991) was “in agreement with the proposition that a city should not have to wait until it runs out of money in order to qualify for bankruptcy protection.”).
11 11 U.S.C.A 101 § (32)(C ).12 11 U.S.C.A. § 109(c)(4).13 Foster, Seena (2001) (Explaining the holdings in New York City Off-Track Betting Corp., In re, 427 B.R.
256 (Bankr. S.D. N.Y. 2010) and City of Vallejo, 408 B.R. 280, 57 A.L.R. Fed. 2d 637 (B.A.P. 9th Cir. 2009)).
14 Foster, Seena (2011) (“A filed statement indicating an intent to effect a plan of reorganization, said the court, combined with efforts made towards negotiating the drafting plan, is sufficient to fulfill this requirement.”)
15 11 USC 109(c)(5).
In the Bankruptcy Code, Chapter 9 is 11 pages total including annotations.
Chapter 9: Municipal Bankruptcy 5
impair.16 Municipalities may find this a difficult option because, as dis-cussed earlier, creditors usually want to keep a debtor out of bankruptcy for fear of losing control of their claims. A small municipality with few creditors may be able to obtain an agreement of the majority of its credi-tors to enter bankruptcy and pass the Creditor Negotiation test using this first option.
Additionally, the municipality could attempt to negotiate in good faith but fail to reach an agreement and also meet the negotiation require-ment.17 This requirement ensures that municipalities choose bankruptcy as a last resort. Good faith negotiations alone will not meet this require-ment unless they revolve around negotiating the terms of a plan the municipality could achieve under Chapter 9.18 This requires actual nego-tiation of a plan that addresses all of the municipality’s liabilities and the methods they would use to adjust them.19
During negotiations, municipalities must be transparent with creditors, making it clear that unsuccessful negotiations may result in Chapter 9 bankruptcy. In at least one case, the court has held that negotiations pre-sented on a “take it or leave it basis,” or with an unwillingness to com-promise, will not meet the negotiated-in-good-faith requirement.20
Showed Negotiations Are ImpracticalAlternatively, a municipality may argue that negotiation with its creditors is impracticable. The court defined impracticable negotiations as those causing extreme and unreasonable difficulty. For example, a debtor may have a large number of creditors. Municipalities might also apply this test when taking time to negotiate before filing for Chapter 9 would put its assets at risk or cause it to be unable to provide services. The munici-pality’s need to act quickly to avoid public harm may make negotiations impracticable.21 This is a “fact sensitive inquiry and will depend on each debtor’s unique circumstances.”22
Believes a Creditor May Attempt to Obtain an Avoidable PreferenceThe municipality may believe a creditor may attempt to obtain an avoid-able preference. Rarely used to prove Chapter 9 eligibility, this final alter-native has never been successfully utilized. At least one bankruptcy judge
16 11 U.S.C.A § 109(c)(5)(a).17 11 U.S.C.A § 109(c)(5)(b).18 Foster, Seena (2011) (Explaining the holding in Sullivan County Regional Refuse Disposal Dist., In re, 165
B.R. 60 (Bankr. D. N.H. 1994)).19 Id.20 In re Ellicott School Bldg. Authority, 150 B.R. 261, 266 (Bankr. D. Colo. 1992) (Holding that “the Authority
presented the plan as a “take it or leave it” proposal, and expressed unwillingness to compromise. For these reasons, it appears to the Court that no true good faith negotiations took place.”).
21 In re Valley Health System, 383 B.R. 156, 163 (Bankr. C.D. Cal. 2008)3 (“Negotiations may also be impracticable when a municipality must act to preserve its assets and a delay in filing to negotiate with creditors risks a significant loss of those assets.”); See, Foster (2011) (Explaining the holding in New York City Off-Track Betting Corp., In re, 427 B.R. 256 (Bankr. S.D. N.Y. 2010)).
22 Id.
Chapter 9 has been infrequently used so it’s not a well-understood area of law.
6 Chapter 9: Municipal Bankruptcy
has questioned the requirement’s wording.23 Some believe the word-ing may be flawed. The code does not make it clear that a transfer by a municipality is actually avoidable under Section 547 because a Chapter 7 liquidation procedure is unavailable in a Chapter 9 proceeding.
What Is the Plan of Adjustment?The plan of adjustment is essentially nothing more than a contract be-tween the debtor and its creditors, which defines how the debt is to be adjusted and how the debtor will be structured post-bankruptcy. In fact, one can think of the entire Chapter 9 proceeding as a structured negotia-tion that leads to a new agreement between all the parties, voted on by the creditors and confirmed by the court.
The plan must include provisions for assumption, rejection, or assign-ment of executor contracts and unexpired leases, it should separate creditor claims into different classes, and it must be voted on.
The bankruptcy code states the confirmation requirements as follows: “The court shall confirm the plan if—
1. The plan complies with the provisions of this title made applicable by sections 103(e) and 901 of this title;
2. The plan complies with the provisions of this chapter;
3. All amounts to be paid by the debtor or by any person for services or expenses in the case or incident to the plan have been fully disclosed and are reasonable;
4. The debtor is not prohibited by law from taking any action necessary to carry out the plan;
5. Except to the extent that the holder of a particular claim has agreed to a different treatment of such claim, the plan provides that on the effective date of the plan each holder of a claim of a kind specified in section 507(a)(1) of this title will receive on account of such claim cash equal to the allowed amount of such claim;
6. Any regulatory or electoral approval necessary under applicable non-bankruptcy law in order to carry out any provision of the plan has been obtained, or such provision is expressly conditioned on such approval; and
7. The plan is in the best interests of creditors and is feasible.”24
Compliance With the Applicable Provisions of the CodeCompliance with the applicable provisions of the code generally means classifying the claims, and that the plan designates classes of claims as impaired and unimpaired. It also requires the same treatment for each claim of a particular class, unless the holder of a particular claim agrees
23 Klein, Christopher. U.S. Bankruptcy Judge, Eastern District of California. Eligibility Litigation in Chapter 9 Municipality Cases Under U.S. Bankruptcy Code. Published in The Ugly Truth: Munici-pal Restructuring and Bankruptcy. Presented by: The American Bar Association. (2012).
24 11 U.S.C. § 943(b).
The plan of adjustment is essentially nothing more than a contract between the debtor and its creditors.
Chapter 9: Municipal Bankruptcy 7
to less favorable treatment. The plan must also provide adequate means for its implementation and examples of methods to do so.
The municipality must make proper disclosure. The municipality must propose the plan in good faith and not by any means forbidden by law it. It must receive regulatory approval for any rate changes.
Each class of the claims that is impaired must accept the plan, unless no classes are impaired under the plan. If utilizing the Cram Down provi-sion, minimum acceptance must be met. This means that at least one class of impaired claims must accept the plan.
The “Cram Down” ProvisionIn a Chapter 9 proceeding, getting the majority of creditors in every class of creditors to vote in favor of the plan is difficult. For this reason, the court utilizes the “cram down provision.” This provision allows the court to confirm the plan if at least one impaired class has accepted the plan, the plan complies with all other requirements of the code, and the plan does not discriminate unfairly and is fair and equitable with respect to each class of impaired creditors that has not accepted the plan.25 To “not discriminate unfairly” means that creditors with the same legal rights receive equal treatment. “Fair and equitable” usually means that a plan must at a minimum satisfy all other requirements.26
If a municipality anticipates using the cram down provision, it should have at least one class of creditors who supports the proposed plan of adjustment pre-bankruptcy. The plan still must treat similarly situated creditors the same, and thus, an entity cannot gerrymander one class of creditors for the sole purpose of gaining their approval. If very similar classes of creditors are classified separately, an objection will likely be filed.
Advanced planning will allow a municipality to think strategically about how it treats varying classes and how it arranges its creditors into class-es. Advanced planning will likely lead to more effective use of the cram down provision.
Court ApprovalIf either the majority of the creditors accept the plan or the majority do not approve so the court utilizes the cram down provision and the plan of adjustment meets the remaining requirements in the code, then the court will approve the plan if it meets the best interest of the creditors test and the plan is feasible.
Courts have interpreted the best interest of the creditors test to mean that the plan must be better than other alternatives available to the
25 United States Courts. Municipal Bankruptcy, Chapter 9. http://www.uscourts.govfederalcourts/bankruptcy/bankruptcybasics/Chapter9.aspx. (Last Accessed July 3, 2012). 24. Id; See 6 COLLIER ON BANKRUPTCY § 943.03[7] (15th ed. rev. 2005).
26 Id.
Lack of proper planning can waste time and money. The municipality should go into bankruptcy with a class of creditors supporting the plan of adjustment. If it does not have the support of at least one class, the process will be longer and more expensive.
8 Chapter 9: Municipal Bankruptcy
creditors.27 “Generally speaking, the alternative to Chapter 9 is dismissal of the case, allowing every creditor to fend for itself.”28 However, the municipality must not devote all its resources to the repayment of its creditors.29 Instead, courts require an outcome that is better for the creditors than having the case dismissed.30
The debtor generally must show it can meet its obligations under the plan and still maintain its operations at a satisfactory level.31 When refer-ring to a city or town, the term “operations” generally means the entity’s ability to provide services to its citizens. The requirements of this test generally require the court to simply review whether the evidence the debtor submitted proves that it can perform its obligations under the plan.
Commonly Cited Advantages and Disadvantages of a Chapter 9 ProceedingAdvantagesThe major advantage of a Chapter 9 proceeding is that it forces all the creditors to come together all before one judge in the same proceeding. Though, in some cases, it may be possible to negotiate a similar plan of adjustment outside of a Chapter 9 proceeding, the process prevents creditors from holding out for more. Additionally, negotiations outside of a Chapter 9 proceeding often lead to lawsuits being filed, which diverts time, money and energy away from the real issues while the municipality is still trying to provide basic services to its citizens. Conversely, during a Chapter 9 proceeding, a debtor can take advantage of the automatic stay and still maintain substantial control over its day-to-day operations. Entities whose main form of debt lies in burdensome collective bargain-ing agreements may find Chapter 9 especially useful. The standard for adjusting these agreements is of a lower threshold than a Chapter 11 restructuring.
DisadvantagesA major disadvantage of a Chapter 9 proceeding is the lack of control of the outcome from a political standpoint. For example, in states with laws that provide for local government financial control boards, receivers or managers, the powers of these parties are set aside during the Chapter 9 process. In most cases, however, they have been instrumental in Chapter
27 See United States Courts. Municipal Bankruptcy, Chapter 9. http://www.uscourts.gov federal-courts/bankruptcy/bankruptcybasics/Chapter9.aspx. (Last Accessed July 3, 2012) (Citing, 6 COL-LIER ON BANKRUPTCY § 943.03[7] (15th ed. rev. 2005)).
28 Id. (Again Citing, 6 COLLIER ON BANKRUPTCY § 943.03[7] (15th ed. rev. 2005)).29 Id. (Stating: An interpretation of the “ best interests of creditors” test to require that the munici-
pality devote all resources available to the repayment of creditors would appear to exceed the standard.)
30 Id. (Stating: “The courts generally apply the test to require a reasonable effort by the municipal debtor that is a better alternative for its creditors than dismissal of the case.”)
31 See Glassman, Paul R. (2011) 2011 WL 5053642 (ASPATORE), 15 (“This means that there must be a reasonable prospect that the debtor will be able to perform under the plan.”)
“Failure to Prepare is to Prepare to Fail.”
– John Robert Wooden
Chapter 9: Municipal Bankruptcy 9
9 negotiations. However, once in bankruptcy, some political power to control at least the outcome is ceded to the bankruptcy judge.
Additionally, debtors who file a Chapter 9 worry about the credit mar-ket response, and surrounding cities worry about “contagion,” or the bankruptcy affecting their ability to borrow. Entities will also likely face stigma and negative media attention. Another potential disadvantage of Chapter 9 is the unknown. In some states, no city has ever filed a Chap-ter 9 petition, and therefore, results in a lack of controlling case law and little predictability. Even in states such as California, which has seen many recent filings, the case law is sparse, and many questions still need to be answered. Lastly, bankruptcy can be expensive and consume hu-man resources.
Fortunately, proper planning, pre-negotiations and transparency with a municipality’s creditors can avoid at least some of these negative effects.
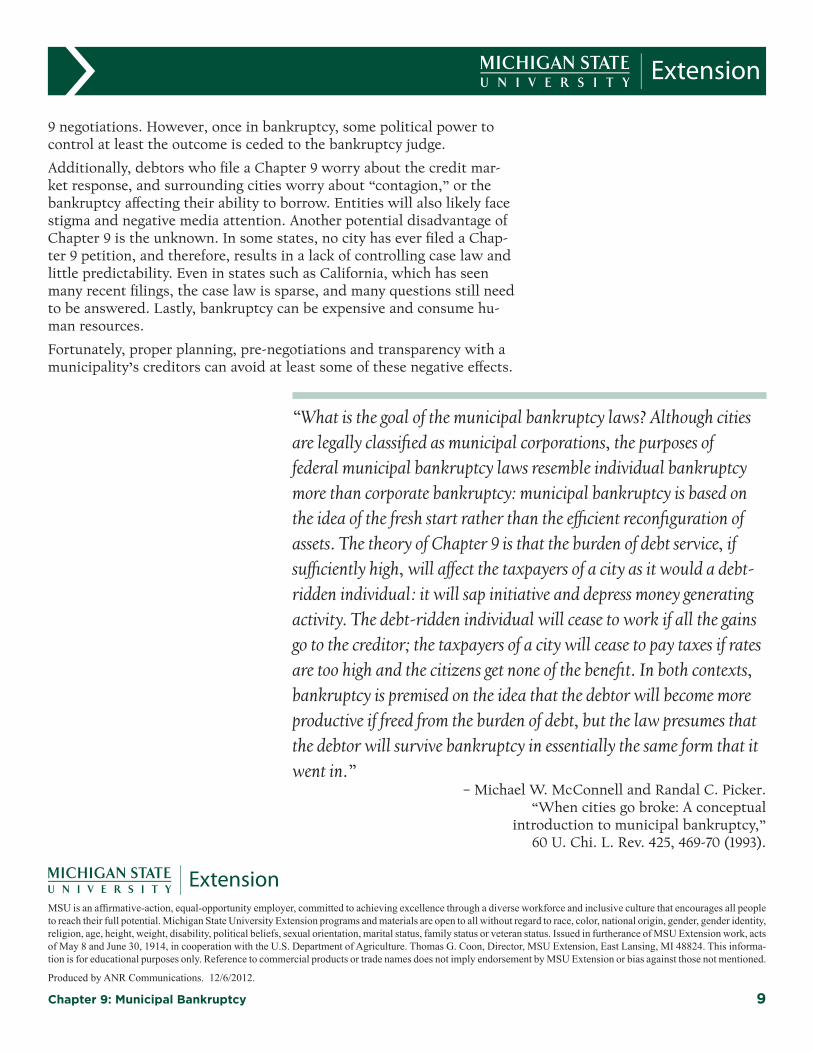
“What is the goal of the municipal bankruptcy laws? Although cities are legally classified as municipal corporations, the purposes of federal municipal bankruptcy laws resemble individual bankruptcy more than corporate bankruptcy: municipal bankruptcy is based on the idea of the fresh start rather than the efficient reconfiguration of assets. The theory of Chapter 9 is that the burden of debt service, if sufficiently high, will affect the taxpayers of a city as it would a debt-ridden individual: it will sap initiative and depress money generating activity. The debt-ridden individual will cease to work if all the gains go to the creditor; the taxpayers of a city will cease to pay taxes if rates are too high and the citizens get none of the benefit. In both contexts, bankruptcy is premised on the idea that the debtor will become more productive if freed from the burden of debt, but the law presumes that the debtor will survive bankruptcy in essentially the same form that it went in.”
– Michael W. McConnell and Randal C. Picker. “When cities go broke: A conceptual
introduction to municipal bankruptcy,” 60 U. Chi. L. Rev. 425, 469-70 (1993).
MSU is an affirmative-action, equal-opportunity employer, committed to achieving excellence through a diverse workforce and inclusive culture that encourages all people to reach their full potential. Michigan State University Extension programs and materials are open to all without regard to race, color, national origin, gender, gender identity, religion, age, height, weight, disability, political beliefs, sexual orientation, marital status, family status or veteran status. Issued in furtherance of MSU Extension work, acts of May 8 and June 30, 1914, in cooperation with the U.S. Department of Agriculture. Thomas G. Coon, Director, MSU Extension, East Lansing, MI 48824. This informa-tion is for educational purposes only. Reference to commercial products or trade names does not imply endorsement by MSU Extension or bias against those not mentioned.
Produced by ANR Communications. 12/6/2012.
APPENDIX B:Process for Analyzing Solvency
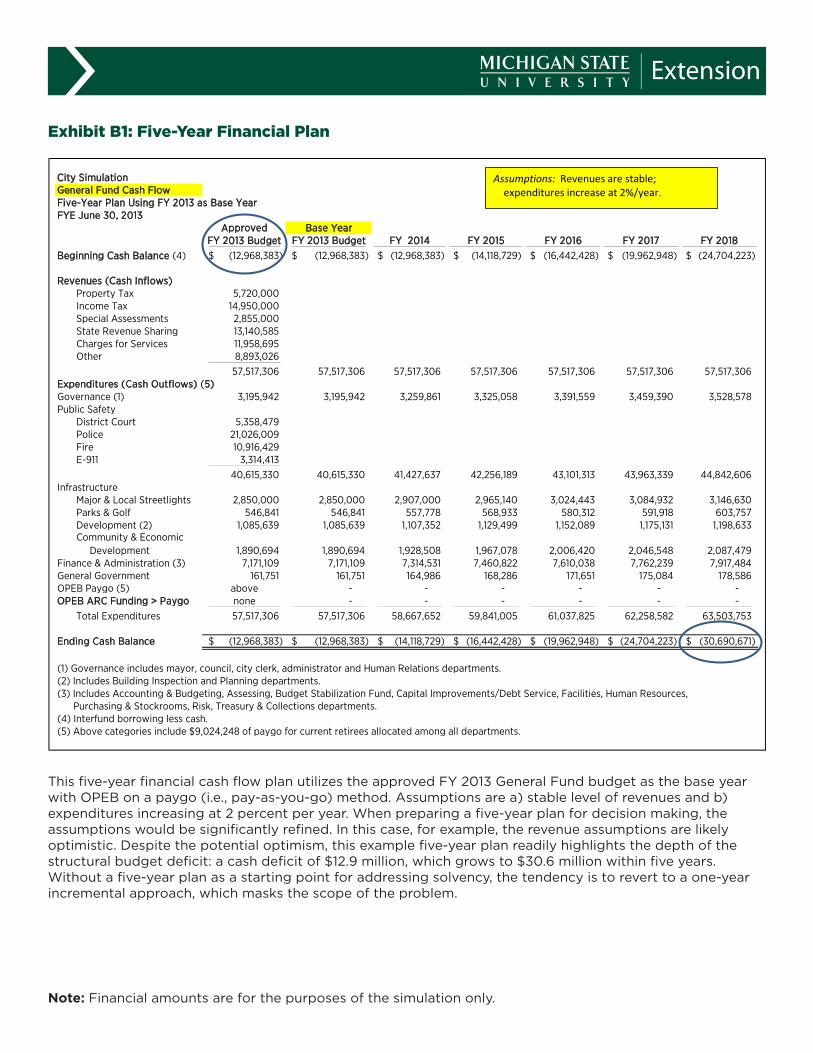
Exhibit B1: Five-Year Financial Plan
ed-psa-Copy of Exhibit B1 Five Year Financial Plan.xlsxEx B1 Five Year Fin Plan
City SimulationGeneral Fund Cash Flow Five-Year Plan Using FY 2013 as Base YearFYE June 30, 2013
Approved Base YearFY 2013 Budget FY 2013 Budget FY 2014 FY 2015 FY 2016 FY 2017 FY 2018
Beginning Cash Balance (4) (12,968,383)$ (12,968,383)$ (12,968,383)$ (14,118,729)$ (16,442,428)$ (19,962,948)$ (24,704,223)$
Revenues (Cash Inflows)Property Tax 5,720,000 Income Tax 14,950,000 Special Assessments 2,855,000 State Revenue Sharing 13,140,585 Charges for Services 11,958,695 Other 8,893,026
57,517,306 57,517,306 57,517,306 57,517,306 57,517,306 57,517,306 57,517,306 Expenditures (Cash Outflows) (5)Governance (1) 3,195,942 3,195,942 3,259,861 3,325,058 3,391,559 3,459,390 3,528,578 Public Safety
District Court 5,358,479 Police 21,026,009 Fire 10,916,429 E-911 3,314,413
40,615,330 40,615,330 41,427,637 42,256,189 43,101,313 43,963,339 44,842,606 Infrastructure
Major & Local Streetlights 2,850,000 2,850,000 2,907,000 2,965,140 3,024,443 3,084,932 3,146,630 Parks & Golf 546,841 546,841 557,778 568,933 580,312 591,918 603,757 Development (2) 1,085,639 1,085,639 1,107,352 1,129,499 1,152,089 1,175,131 1,198,633 Community & Economic Development 1,890,694 1,890,694 1,928,508 1,967,078 2,006,420 2,046,548 2,087,479
Finance & Administration (3) 7,171,109 7,171,109 7,314,531 7,460,822 7,610,038 7,762,239 7,917,484 General Government 161,751 161,751 164,986 168,286 171,651 175,084 178,586 OPEB Paygo (5) above - - - - - - OPEB ARC Funding > Paygo none - - - - - -
Total Expenditures 57,517,306 57,517,306 58,667,652 59,841,005 61,037,825 62,258,582 63,503,753
Ending Cash Balance (12,968,383)$ (12,968,383)$ (14,118,729)$ (16,442,428)$ (19,962,948)$ (24,704,223)$ (30,690,671)$
(1) Governance includes mayor, council, city clerk, administrator and Human Relations departments.(2) Includes Building Inspection and Planning departments.(3) Includes Accounting & Budgeting, Assessing, Budget Stabilization Fund, Capital Improvements/Debt Service, Facilities, Human Resources, Purchasing & Stockrooms, Risk, Treasury & Collections departments.(4) Interfund borrowing less cash.(5) Above categories include $9,024,248 of paygo for current retirees allocated among all departments.
Assumptions: Revenues are stable; expenditures increase at 2%/year.
This five-year financial cash flow plan utilizes the approved FY 2013 General Fund budget as the base year with OPEB on a paygo (i.e., pay-as-you-go) method. Assumptions are a) stable level of revenues and b) expenditures increasing at 2 percent per year. When preparing a five-year plan for decision making, the assumptions would be significantly refined. In this case, for example, the revenue assumptions are likely optimistic. Despite the potential optimism, this example five-year plan readily highlights the depth of the structural budget deficit: a cash deficit of $12.9 million, which grows to $30.6 million within five years. Without a five-year plan as a starting point for addressing solvency, the tendency is to revert to a one-year incremental approach, which masks the scope of the problem.
Note: Financial amounts are for the purposes of the simulation only.
Exhi
bit
B2:
Cas
h Fl
ow b
y Fu
nd (
Gen
eral
Fun
d)
Cit
y Si
mul
atio
nG
ener
al F
und
Cas
h Fl
ow (
Pay
go
for
OP
EB)
FYE
June
30
, 20
13B
ALA
NC
EDM
onth
ly C
ash
Flow
FY 2
013
Bud
get
Jul-
12A
ug-1
2Se
p-12
Oct
-12
Nov
-12
Dec
-12
Jan-
13Fe
b-13
Mar
-13
Apr
-13
May
-13
Jun-
13B
egin
ning
Cas
h B
alan
ce(1
2,96
8,38
3)$
(1
2,96
8,38
3)$
(1
2,41
6,32
2)$
(11,1
92,18
4)$
(13,
607,
698)
$
(12,
871,0
30)
$
(1
4,10
7,41
2)$
(1
3,34
5,97
2)$
(14,
789,
618)
$
(13,
809,
153)
$
(16,
203,
495)
$
(15,
622,
299)
$
(15,
889,
600
)$
Rev
enue
s (C
ash
Infl
ows)
Prop
erty
Tax
5,72
0,0
00
2,50
6,37
7
403,
254
11
7,87
4
66
3,81
8
16
1,30
2
13
6,48
6
26
6,76
8
266,
768
22
3,34
1
22
3,34
1
-
75
0,6
73
In
com
e Ta
x14
,950
,00
0
1,1
25,2
69
1,553
,943
996,
667
1,50
0,3
58
1,264
,588
1,2
96,7
38
1,939
,749
1,0
28,8
17
1,468
,20
8
943,
082
760
,896
1,071
,685
Spec
ial A
sses
smen
ts2,
855,
00
0
1,2
50,9
98
201,2
74
58,8
34
331,3
29
80
,510
68,12
4
13
3,15
1
13
3,15
1
11
1,475
11
1,475
-
37
4,68
1
St
ate
Rev
enue
Sha
ring
13,14
0,5
85
-
2,19
0,0
98
-
2,19
0,0
98
-
2,
190
,098
-
2,
190
,098
-
2,
190
,098
-
2,
190
,098
C
harg
es fo
r Se
rvic
es11
,958
,695
923,
451
923,
451
92
3,45
1
92
3,45
1
92
3,45
1
92
3,45
1
92
3,45
1
92
3,45
1
92
3,45
1
92
3,45
1
43
8,63
9
2,
285,
542
O
ther
8,89
3,0
26
68
6,72
0
68
6,72
0
686,
720
686,
720
686,
720
68
6,72
0
686,
720
68
6,72
0
686,
720
686,
720
326,
192
1,699
,632
57
,517
,30
6
6,
492,
816
5,
958,
740
2,78
3,54
6
6,29
5,77
4
3,11
6,57
1
5,30
1,617
3,
949,
839
5,22
9,0
05
3,41
3,19
5
5,0
78,16
7
1,525
,728
8,
372,
310
Ex
pen
dit
ures
(C
ash
Out
flow
s)G
over
nanc
e (1
)3,
195,
942
33
0,0
97
263,
078
28
8,88
5
30
8,89
1
24
1,871
252,
274
29
9,68
8
236,
070
32
2,69
5
24
9,87
4
99
,629
30
2,88
9
Pu
blic
Saf
ety
Dis
tric
t C
ourt
5,35
8,47
9
553,
458
441,0
89
484,
360
517,
902
405,
534
42
2,97
6
502,
473
39
5,80
6
541,0
47
41
8,95
1
16
7,0
44
50
7,84
0
Po
lice
21,0
26,0
09
2,17
1,70
0
1,730
,779
1,90
0,5
67
2,0
32,18
5
1,591
,264
1,6
59,7
06
1,971
,641
1,5
53,0
95
2,12
3,0
02
1,6
43,9
11
65
5,45
9
1,9
92,7
00
Fi
re10
,916
,429
1,127
,518
898,
598
98
6,75
0
1,0
55,0
84
826,
164
861,6
97
1,0
23,6
50
80
6,34
7
1,10
2,23
5
853,
497
340
,30
6
1,0
34,5
84
E-91
13,
314,
413
34
2,33
4
27
2,83
0
299,
594
320
,341
250
,837
26
1,626
310
,798
244,
820
33
4,65
7
25
9,13
6
10
3,32
3
31
4,11
7
40,6
15,3
30
4,
195,
011
3,
343,
296
3,67
1,270
3,
925,
513
3,
073
,799
3,20
6,0
05
3,80
8,56
1
3,0
00
,068
4,10
0,9
41
3,17
5,49
6
1,266
,130
3,84
9,24
0
Infr
astr
uctu
reM
ajor
& L
ocal
Str
eetli
ghts
2,85
0,0
00
294,
366
234,
601
25
7,61
5
27
5,45
5
21
5,69
0
22
4,96
7
267,
249
21
0,5
16
28
7,76
5
22
2,82
6
88
,845
27
0,10
3
Pa
rks
& G
olf
546,
841
56,4
81
45,0
14
49
,430
52,8
53
41,3
85
43
,165
51,2
78
40
,393
55,2
15
42,7
55
17,0
47
51,8
26
Dev
elop
men
t (2
)1,0
85,6
39
112,
132
89
,366
98,13
2
104,
928
82,16
2
85
,696
101,8
02
80,19
1
109,
617
84,8
80
33
,843
10
2,88
9
C
omm
unity
& E
cono
mic
Dev
elop
men
t1,8
90,6
94
195,
283
155,
635
17
0,9
02
182,
737
143,
089
14
9,24
4
177,
293
139,
657
190
,90
4
14
7,82
3
58
,940
17
9,18
7
Fina
nce
& A
dmin
istr
atio
n (3
)7,
171,1
09
74
0,6
78
590
,298
64
8,20
5
69
3,0
95
54
2,71
5
56
6,0
57
672,
446
52
9,69
7
724,
069
560
,671
223,
550
679,
628
Gen
eral
Gov
ernm
ent
161,7
51
16,7
07
13
,315
14,6
21
15,6
33
12,2
41
12,7
68
15
,168
11
,948
16
,332
12
,646
5,
042
15
,330
Tota
l Exp
endi
ture
s57
,517
,30
6
5,
940
,755
4,
734,
601
5,19
9,0
60
5,55
9,10
6
4,35
2,95
3
4,
540
,177
5,39
3,48
5
4,
248,
540
5,80
7,53
8
4,49
6,97
1
1,793
,028
5,
451,0
92
End
ing
Cas
h B
alan
ce(1
2,96
8,38
3)$
(1
2,41
6,32
2)$
(1
1,192
,184)
$
(13,
607,
698)
$
(12,
871,0
30)
$
(14,
107,
412)
$
(13,
345,
972)
$
(1
4,78
9,61
8)$
(1
3,80
9,15
3)$
(1
6,20
3,49
5)$
(1
5,62
2,29
9)$
(1
5,88
9,60
0)
$
(12,
968,
382)
$
(1)
Gov
erna
nce
incl
udes
may
or, c
ounc
il, c
ity c
lerk
, adm
inis
trat
or a
nd H
uman
Rel
atio
ns d
epar
tmen
ts.
(2)
Incl
udes
Bui
ldin
g In
spec
tion
and
Plan
ning
dep
artm
ents
.(3
) In
clud
es A
ccou
ntin
g &
Bud
getin
g, A
sses
sing
, Bud
get
Stab
iliza
tion
Fund
, Cap
ital I
mpr
ovem
ents
/Deb
t Se
rvic
e, F
acili
ties,
Hum
an r
esou
rces
, Pur
chas
ing
& S
tock
room
s, R
isk,
Tre
asur
y &
Col
lect
ions
dep
artm
ents
(4)
Inte
rfun
d bo
rrow
ing
less
cas
h.
Thi
s m
ont
hly
Gen
eral
Fun
d C
ash
Flo
w is
als
o b
ased
on
the
app
rove
d F
Y 2
013
bud
get
, whi
ch li
mit
s fu
ndin
g f
or
OP
EB
to
pay
go
. T
he c
ash
flo
w d
emo
nstr
ates
tha
t th
e ci
ty is
ind
ebte
d t
o t
he p
oo
led
cas
h fu
nd o
f $
12.9
mill
ion
at t
he b
egin
ning
of
the
year
, whi
ch
dec
reas
es t
o $
11.1
mill
ion
in A
ugus
t an
d p
eaks
at
$16
.2 m
illio
n in
Mar
ch. T
his
anal
ysis
hig
hlig
hts
the
ong
oin
g c
ash
inso
lven
cy
thro
ugho
ut t
he fi
scal
yea
r (r
athe
r th
an b
eing
an
exce
pti
on
at y
ear
end
). P
rese
ntin
g a
cas
h fl
ow
ana
lysi
s re
tro
spec
tive
ly t
o t
he
dat
e o
f in
itia
l cas
h d
efici
t ai
ds
in e
xpla
inin
g t
hat
this
co
ndit
ion
is n
ot
an a
nom
aly;
in f
act,
it is
a r
ealit
y th
at h
as n
ot
bee
n re
med
ied
d
esp
ite
effo
rts
to r
educ
e ex
pen
dit
ures
and
incr
ease
rev
enue
s.
No
te: F
inan
cial
am
oun
ts a
re f
or
the
pur
po
ses
of
the
sim
ulat
ion
onl
y.
Exhi
bit
B3:
Cas
h Fl
ow b
y Fu
nd (
Wat
er a
nd S
ewer
Fun
ds)
The
Co
mb
ined
Wat
er a
nd S
ewer
Fun
ds’
cas
h fl
ow
ana
lysi
s ab
ove
is a
lso
bas
ed o
n th
e ap
pro
ved
FY
20
13 b
udg
et a
nd u
tiliz
es
pay
go
fo
r O
PE
B. I
n ad
dit
ion
to t
he c
om
men
ts n
ote
d w
ith
the
Gen
eral
Fun
d C
ash
Flo
w, t
he a
bov
e an
alys
is h
ighl
ight
s tw
o f
urth
er
po
ints
. Fir
st, d
esp
ite
sig
nifi
cant
rat
e in
crea
ses
of
12.5
per
cent
fo
r w
ater
and
45
per
cent
fo
r se
wer
eff
ecti
ve J
uly
1, 20
12, t
he f
und
s’
cash
po
siti
on
imp
rove
s m
od
estl
y fr
om
less
tha
n 1
per
cent
of
reve
nues
at
June
30
, 20
12, t
o 2
.9 p
erce
nt b
y Ju
ne 2
013
. Thi
s m
ay
be
cont
rary
to
the
imp
ress
ions
tha
t st
akeh
old
ers
wo
uld
hav
e w
itho
ut t
his
typ
e o
f an
alys
is b
ased
on
the
leve
l of
rate
incr
ease
s in
cur
rent
yea
rs. S
eco
nd, t
he c
ash
bal
ance
s co
ntin
ue t
o d
eclin
e in
Feb
ruar
y th
roug
h th
e en
d o
f th
e fi
scal
yea
r. T
his
pat
tern
is
cons
iste
nt w
ith
the
gen
eral
fun
d. A
ltho
ugh
this
pap
er e
mp
hasi
zes
the
need
fo
r ca
sh fl
ow
by
fund
, an
enti
ty-w
ide
cash
flo
w
anal
ysis
is a
lso
cri
tica
l to
man
agin
g t
he p
oo
led
cas
h fu
nds.
Cit
y W
ater
and
Sew
er F
unds
(C
ombi
ned)
Cas
h Fl
ow (
Payg
o fo
r O
PEB
)FY
E Ju
ne 3
0, 2
013
App
rove
dM
onth
ly C
ash
Flow
2013
Bud
get
Jul-1
2A
ug-1
2Se
p-12
Oct
-12
Nov
-12
Dec
-12
Jan-
13Fe
b-13
Mar
-13
Apr
-13
May
-13
Jun-
13O
pera
ting
Rev
enue
s 81
,734
,552
$
6,95
5,0
19$
9,
534,
826
$
9,46
5,10
2$
7,
652,
265
$
6,86
7,86
4$
6,
623,
828
$
6,92
0,15
7$
7,
129,
331
$
6,
153,
188
$
6,
257,
774
$
1,237
,610
$
6,93
7,58
8$
O
ther
Rev
enue
s45
5,86
7
37,9
89
37
,989
37,9
89
37
,989
37,9
89
37
,989
37,9
89
37
,989
37,9
89
37
,989
37,9
89
37,9
89
Cas
h in
flow
s82
,190
,419
6,99
3,0
08
9,57
2,81
5
9,
503,
091
7,69
0,2
53
6,
905,
853
6,66
1,817
6,
958,
146
7,16
7,32
0
6,
191,1
77
6,29
5,76
3
1,2
75,5
99
6,
975,
577
Wat
er P
urch
ased
24
,031
,417
2,0
15,0
57
2,
292,
260
2,66
5,41
9
2,
270
,937
2,11
1,012
2,
025
,718
2,11
1,012
2,
111,0
12
2,11
1,012
2,
111,0
12
255,
880
1,9
51,0
87
Pers
onne
l Cos
ts28
,546
,350
2,41
0,6
20
2,
437,
208
2,37
5,17
0
2,
268,
819
2,36
6,30
7
3,
323,
465
2,33
0,8
57
2,
197,
918
2,
135,
880
2,14
4,74
3
2,
215,
643
2,33
9,71
9
Ope
ratin
g Ex
pens
es7,
259,
290
613,
017
61
9,77
8
604,
00
2
576,
957
60
1,748
84
5,15
2
592,
733
55
8,92
7
543,
151
545,
405
56
3,43
4
594,
987
A
dmin
istr
ativ
e Ex
pens
es14
,140
,047
1,194
,068
1,20
7,23
8
1,1
76,5
08
1,123
,829
1,1
72,11
8
1,646
,233
1,154
,558
1,0
88,7
09
1,057
,979
1,062
,369
1,097
,489
1,158
,948
C
apita
l Out
lay
2,40
1,583
20
0,13
2
200
,132
20
0,13
2
200
,132
20
0,13
2
200
,132
20
0,13
2
200
,132
20
0,13
2
200
,132
20
0,13
2
200
,132
In
tere
st E
xpen
se64
4,31
4
58
,986
14,7
47
13
6,12
3
10
7,76
4
1,134
1,1
34
20,4
18
1,1
34
181,4
97
11
9,10
7
1,1
34
1,134
Tr
ansf
ers
to O
ther
Fun
ds2,
990
,00
0
24
9,16
7
249,
167
24
9,16
7
249,
167
24
9,16
7
24
9,16
7
249,
167
24
9,16
7
249,
167
24
9,16
7
249,
167
24
9,16
7
Cas
h ou
tflo
ws
80,0
13,0
01
6,74
1,046
7,0
20,5
29
7,
406,
520
6,79
7,60
4
6,
701,6
18
8,29
1,00
2
6,
658,
877
6,40
6,99
9
6,
478,
818
6,43
1,934
4,58
2,88
0
6,
495,
174
Cha
nge
in C
ash
2,17
7,41
8
251,9
62
2,55
2,28
6
2,
096
,571
892,
650
20
4,23
5
(1,6
29,18
5)
29
9,26
9
760
,321
(2
87,6
41)
(1
36,17
1)
(3,3
07,
281)
480
,40
4
Cas
h (u
nres
tric
ted)
- b
egin
nin
228,
967
22
8,96
7
480
,929
3,
033
,215
5,12
9,78
6
6,
022
,435
6,22
6,67
0
4,
597,
486
4,89
6,75
5
5,
657,
075
5,36
9,43
4
5,
233,
263
1,925
,982
C
ash
(unr
estr
icte
d) -
end
ing
2,40
6,38
5$
48
0,9
29$
3,0
33,2
15$
5,
129,
786
$
6,0
22,4
35$
6,
226,
670
$
4,59
7,48
6$
4,
896,
755
$
5,65
7,0
75$
5,
369,
434
$
5,23
3,26
3$
1,9
25,9
82$
2,
406,
386
$
No
te: F
inan
cial
am
oun
ts a
re f
or
the
pur
po
ses
of
the
sim
ulat
ion
onl
y.
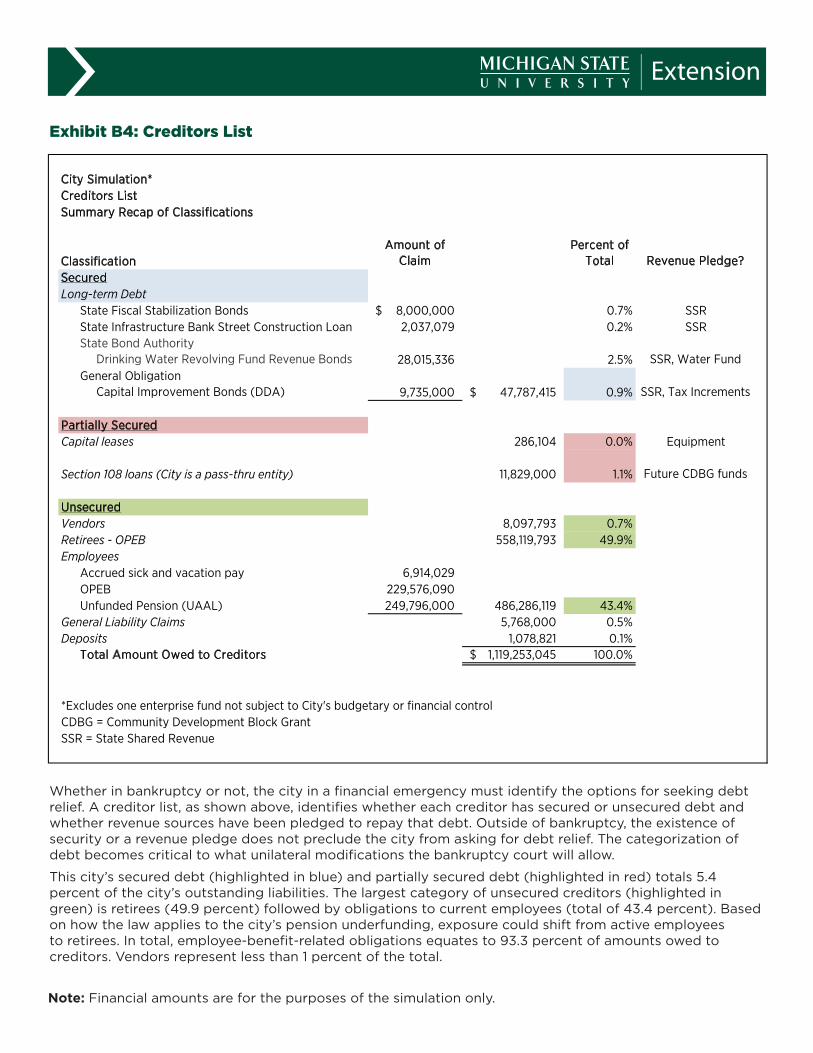
Exhibit B4: Creditors List
City Simulation*Creditors ListSummary Recap of Classifications
ClassificationAmount of
ClaimPercent of
Total Revenue Pledge?SecuredLong-term Debt
State Fiscal Stabilization Bonds 8,000,000$ 0.7% SSRState Infrastructure Bank Street Construction Loan 2,037,079 0.2% SSRState Bond Authority Drinking Water Revolving Fund Revenue Bonds 28,015,336 2.5% SSR, Water FundGeneral Obligation Capital Improvement Bonds (DDA) 9,735,000 47,787,415$ 0.9% SSR, Tax Increments
Partially SecuredCapital leases 286,104 0.0% Equipment
Section 108 loans (City is a pass-thru entity) 11,829,000 1.1% Future CDBG funds
UnsecuredVendors 8,097,793 0.7%Retirees - OPEB 558,119,793 49.9%Employees
Accrued sick and vacation pay 6,914,029 OPEB 229,576,090 Unfunded Pension (UAAL) 249,796,000 486,286,119 43.4%
General Liability Claims 5,768,000 0.5%Deposits 1,078,821 0.1%
Total Amount Owed to Creditors 1,119,253,045$ 100.0%
*Excludes one enterprise fund not subject to City's budgetary or financial controlCDBG = Community Development Block GrantSSR = State Shared Revenue
Whether in bankruptcy or not, the city in a financial emergency must identify the options for seeking debt relief. A creditor list, as shown above, identifies whether each creditor has secured or unsecured debt and whether revenue sources have been pledged to repay that debt. Outside of bankruptcy, the existence of security or a revenue pledge does not preclude the city from asking for debt relief. The categorization of debt becomes critical to what unilateral modifications the bankruptcy court will allow.
This city’s secured debt (highlighted in blue) and partially secured debt (highlighted in red) totals 5.4 percent of the city’s outstanding liabilities. The largest category of unsecured creditors (highlighted in green) is retirees (49.9 percent) followed by obligations to current employees (total of 43.4 percent). Based on how the law applies to the city’s pension underfunding, exposure could shift from active employees to retirees. In total, employee-benefit-related obligations equates to 93.3 percent of amounts owed to creditors. Vendors represent less than 1 percent of the total.
Note: Financial amounts are for the purposes of the simulation only.
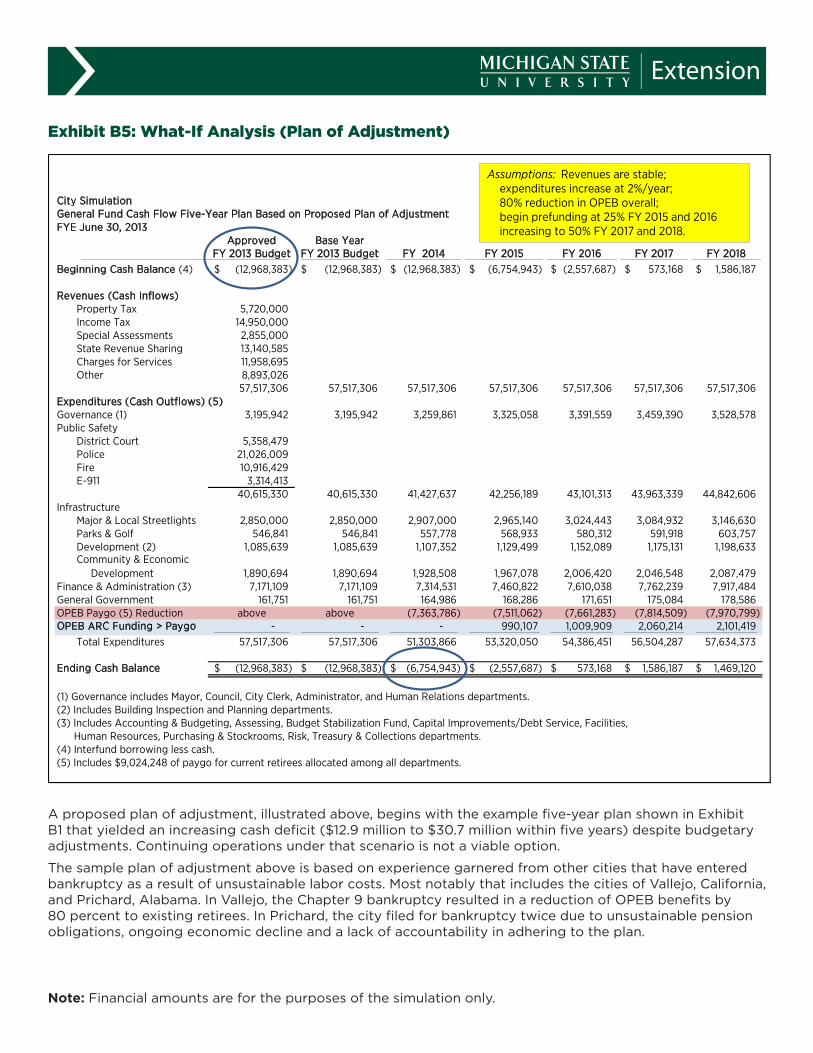
Exhibit B5: What-If Analysis (Plan of Adjustment)
A proposed plan of adjustment, illustrated above, begins with the example five-year plan shown in Exhibit B1 that yielded an increasing cash deficit ($12.9 million to $30.7 million within five years) despite budgetary adjustments. Continuing operations under that scenario is not a viable option.
The sample plan of adjustment above is based on experience garnered from other cities that have entered bankruptcy as a result of unsustainable labor costs. Most notably that includes the cities of Vallejo, California, and Prichard, Alabama. In Vallejo, the Chapter 9 bankruptcy resulted in a reduction of OPEB benefits by 80 percent to existing retirees. In Prichard, the city filed for bankruptcy twice due to unsustainable pension obligations, ongoing economic decline and a lack of accountability in adhering to the plan.
ed-psa-Copy of Exhibit B5 What-If Analysis (Plan of Adjustment).xlsxVer B Gen Fund Five Year Plan
City SimulationGeneral Fund Cash Flow Five-Year Plan Based on Proposed Plan of AdjustmentFYE June 30, 2013
Approved Base YearFY 2013 Budget FY 2013 Budget FY 2014 FY 2015 FY 2016 FY 2017 FY 2018
Beginning Cash Balance (4) (12,968,383)$ (12,968,383)$ (12,968,383)$ (6,754,943)$ (2,557,687)$ 573,168$ 1,586,187$
Revenues (Cash Inflows)Property Tax 5,720,000 Income Tax 14,950,000 Special Assessments 2,855,000 State Revenue Sharing 13,140,585 Charges for Services 11,958,695 Other 8,893,026
57,517,306 57,517,306 57,517,306 57,517,306 57,517,306 57,517,306 57,517,306 Expenditures (Cash Outflows) (5)Governance (1) 3,195,942 3,195,942 3,259,861 3,325,058 3,391,559 3,459,390 3,528,578 Public Safety
District Court 5,358,479 Police 21,026,009 Fire 10,916,429 E-911 3,314,413
40,615,330 40,615,330 41,427,637 42,256,189 43,101,313 43,963,339 44,842,606 Infrastructure
Major & Local Streetlights 2,850,000 2,850,000 2,907,000 2,965,140 3,024,443 3,084,932 3,146,630 Parks & Golf 546,841 546,841 557,778 568,933 580,312 591,918 603,757 Development (2) 1,085,639 1,085,639 1,107,352 1,129,499 1,152,089 1,175,131 1,198,633 Community & Economic Development 1,890,694 1,890,694 1,928,508 1,967,078 2,006,420 2,046,548 2,087,479
Finance & Administration (3) 7,171,109 7,171,109 7,314,531 7,460,822 7,610,038 7,762,239 7,917,484 General Government 161,751 161,751 164,986 168,286 171,651 175,084 178,586 OPEB Paygo (5) Reduction above above (7,363,786) (7,511,062) (7,661,283) (7,814,509) (7,970,799) OPEB ARC Funding > Paygo - - - 990,107 1,009,909 2,060,214 2,101,419
Total Expenditures 57,517,306 57,517,306 51,303,866 53,320,050 54,386,451 56,504,287 57,634,373
Ending Cash Balance (12,968,383)$ (12,968,383)$ (6,754,943)$ (2,557,687)$ 573,168$ 1,586,187$ 1,469,120$
(1) Governance includes Mayor, Council, City Clerk, Administrator, and Human Relations departments.(2) Includes Building Inspection and Planning departments.(3) Includes Accounting & Budgeting, Assessing, Budget Stabilization Fund, Capital Improvements/Debt Service, Facilities, Human Resources, Purchasing & Stockrooms, Risk, Treasury & Collections departments.(4) Interfund borrowing less cash.(5) Includes $9,024,248 of paygo for current retirees allocated among all departments.
Assumptions: Revenues are stable; expenditures increase at 2%/year; 80% reduction in OPEB overall; begin prefunding at 25% FY 2015 and 2016 increasing to 50% FY 2017 and 2018.
Note: Financial amounts are for the purposes of the simulation only.

The general fund’s base year budget (FY 2013) includes OPEB on a paygo basis of $9 million. The additional amount needed to prefund OPEB for general fund services is $19.4 million. The illustrative proposed plan of adjustment reduces OPEB by 80 percent for FY 2014 as highlighted in red. In addition, this plan requires the city to begin prefunding the remaining OPEB (“ARC > paygo”) at 25 percent in FY 2015 and 2016 and increasing it further in FY 2017 and 2018.
Despite the proposed OPEB reduction of 80 percent, the general fund cash balance does not return to a positive status until FY 2016 assuming that the OPEB plan change for existing retirees is effectuated by July 1, 2013. The limited options to address the remaining shortfall of $6.7 million include vendors, capital leases, general obligation bonds and unfunded pension benefits.
While unimaginable that the city and related stakeholders would be faced with a bankruptcy plan of adjustment, the proposed plan meets the three objectives noted earlier:
a. Restructures liabilities to provide an acceptable level of services within resources available
b. Exits the bankruptcy process with a financial plan and controls to mitigate overextending the city’s financial obligations in the future
c. Develops a plan that is responsibly committed to addressing the adjusted obligations (Municipalities accomplish this by designing a five-year plan that establishes prefunding OPEB.)
Exhibit B5: What-If Analysis (Plan of Adjustment) Continued
Note: Financial amounts are for the purposes of the simulation only.
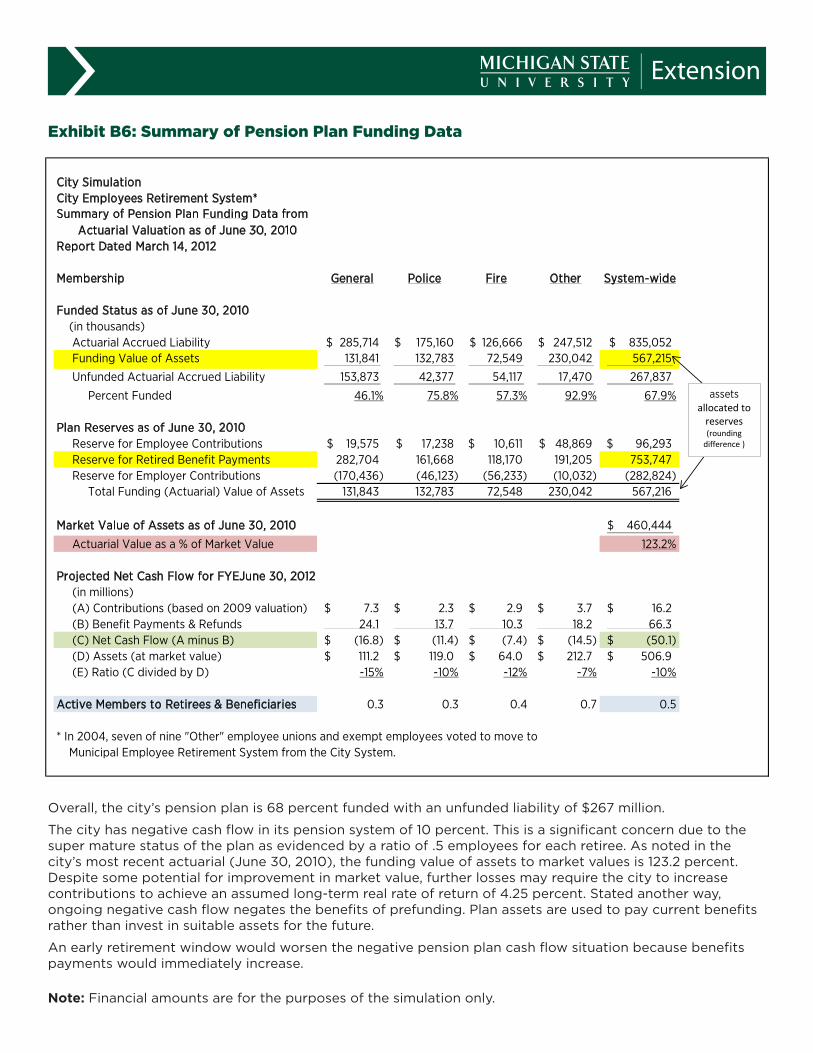
Exhibit B6: Summary of Pension Plan Funding Data
Overall, the city’s pension plan is 68 percent funded with an unfunded liability of $267 million.
The city has negative cash flow in its pension system of 10 percent. This is a significant concern due to the super mature status of the plan as evidenced by a ratio of .5 employees for each retiree. As noted in the city’s most recent actuarial (June 30, 2010), the funding value of assets to market values is 123.2 percent. Despite some potential for improvement in market value, further losses may require the city to increase contributions to achieve an assumed long-term real rate of return of 4.25 percent. Stated another way, ongoing negative cash flow negates the benefits of prefunding. Plan assets are used to pay current benefits rather than invest in suitable assets for the future.
An early retirement window would worsen the negative pension plan cash flow situation because benefits payments would immediately increase.
Cells B3 to J45
City SimulationCity Employees Retirement System*Summary of Pension Plan Funding Data from Actuarial Valuation as of June 30, 2010Report Dated March 14, 2012
Membership General Police Fire Other System-wide
Funded Status as of June 30, 2010 (in thousands) Actuarial Accrued Liability 285,714$ 175,160$ 126,666$ 247,512$ 835,052$ Funding Value of Assets 131,841 132,783 72,549 230,042 567,215
Unfunded Actuarial Accrued Liability 153,873 42,377 54,117 17,470 267,837
Percent Funded 46.1% 75.8% 57.3% 92.9% 67.9%
Plan Reserves as of June 30, 2010 Reserve for Employee Contributions 19,575$ 17,238$ 10,611$ 48,869$ 96,293$ Reserve for Retired Benefit Payments 282,704 161,668 118,170 191,205 753,747 Reserve for Employer Contributions (170,436) (46,123) (56,233) (10,032) (282,824) Total Funding (Actuarial) Value of Assets 131,843 132,783 72,548 230,042 567,216
Market Value of Assets as of June 30, 2010 460,444$
Actuarial Value as a % of Market Value 123.2%
Projected Net Cash Flow for FYEJune 30, 2012 (in millions) (A) Contributions (based on 2009 valuation) 7.3$ 2.3$ 2.9$ 3.7$ 16.2$ (B) Benefit Payments & Refunds 24.1 13.7 10.3 18.2 66.3 (C) Net Cash Flow (A minus B) (16.8)$ (11.4)$ (7.4)$ (14.5)$ (50.1)$ (D) Assets (at market value) 111.2$ 119.0$ 64.0$ 212.7$ 506.9$ (E) Ratio (C divided by D) -15% -10% -12% -7% -10%
Active Members to Retirees & Beneficiaries 0.3 0.3 0.4 0.7 0.5
* In 2004, seven of nine "Other" employee unions and exempt employees voted to move to Municipal Employee Retirement System from the City System.
City SimulationCity Employees Retirement System*Summary of Pension Plan Annual Cost Data from Actuarial Valuation as of June 30, 2010Report Dated March 14, 2012
Membership General Police Fire Other System-wide
Net Employer Contribution Rate (as a % of payroll)
2013 (estimated) 68.00% 46.00% 60.00% 20.00% n/a2012 59.98% 36.04% 51.42% 12.23% n/a2011 43.35% 22.96% 39.17% 10.72% n/a
Rate increase from 2011 to 2013 24.65% 23.04% 20.83% 9.28%
Member Payroll (fiscal year basis; in thousands)2010 68,968$ 2009 89,636$ 2008 89,636$
Census Data (as of June 30, 2009)(Note: Actuarial report does not provide employee or retiree census data. Amounts obtained from FY 2011 Audited Financial Statements.)
Active Plan Members 1,676 Inactive, vested members 233 Retirees and Beneficiaries 2,820
* In 2004, seven of nine "Other" employee unions and exempt employees voted to move to Municipal Employee Retirement System from the City System.
assets allocated to
reserves (rounding
difference )
Note: Financial amounts are for the purposes of the simulation only.
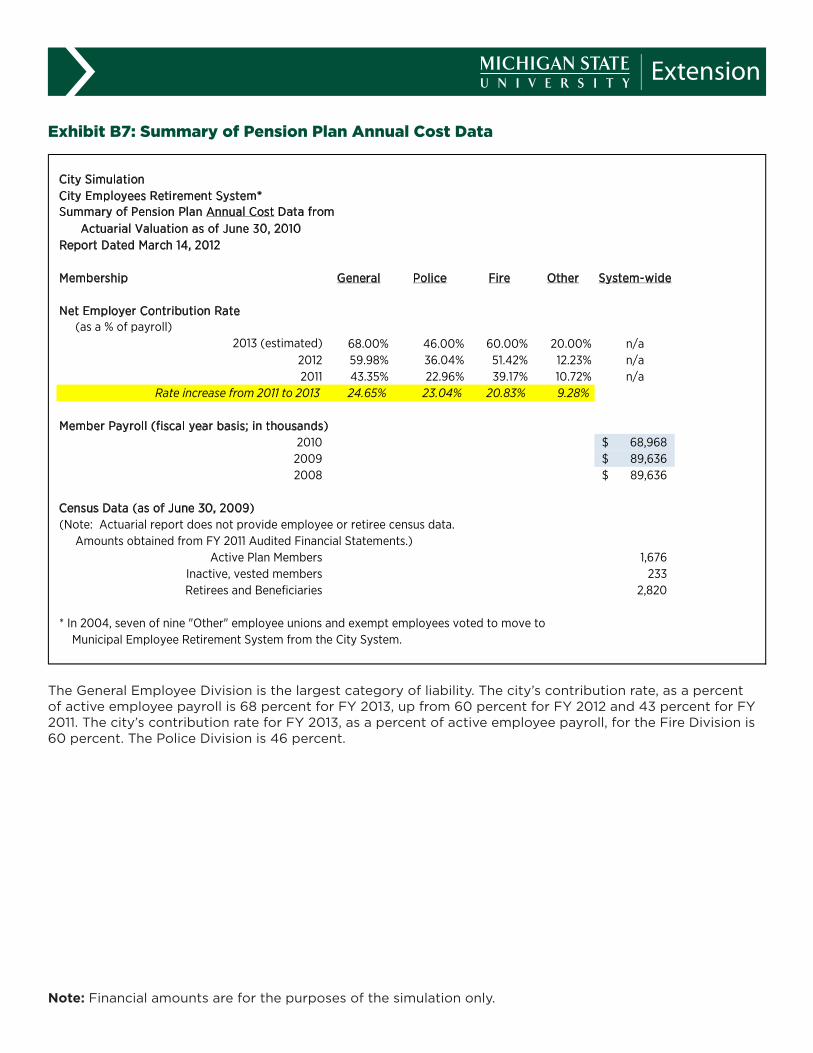
Exhibit B7: Summary of Pension Plan Annual Cost Data
The General Employee Division is the largest category of liability. The city’s contribution rate, as a percent of active employee payroll is 68 percent for FY 2013, up from 60 percent for FY 2012 and 43 percent for FY 2011. The city’s contribution rate for FY 2013, as a percent of active employee payroll, for the Fire Division is 60 percent. The Police Division is 46 percent.
City SimulationCity Employees Retirement System*Summary of Pension Plan Annual Cost Data from Actuarial Valuation as of June 30, 2010Report Dated March 14, 2012
Membership General Police Fire Other System-wide
Net Employer Contribution Rate (as a % of payroll)
2013 (estimated) 68.00% 46.00% 60.00% 20.00% n/a2012 59.98% 36.04% 51.42% 12.23% n/a2011 43.35% 22.96% 39.17% 10.72% n/a
Rate increase from 2011 to 2013 24.65% 23.04% 20.83% 9.28%
Member Payroll (fiscal year basis; in thousands)2010 68,968$ 2009 89,636$ 2008 89,636$
Census Data (as of June 30, 2009)(Note: Actuarial report does not provide employee or retiree census data. Amounts obtained from FY 2011 Audited Financial Statements.)
Active Plan Members 1,676 Inactive, vested members 233 Retirees and Beneficiaries 2,820
* In 2004, seven of nine "Other" employee unions and exempt employees voted to move to Municipal Employee Retirement System from the City System.
Note: Financial amounts are for the purposes of the simulation only.
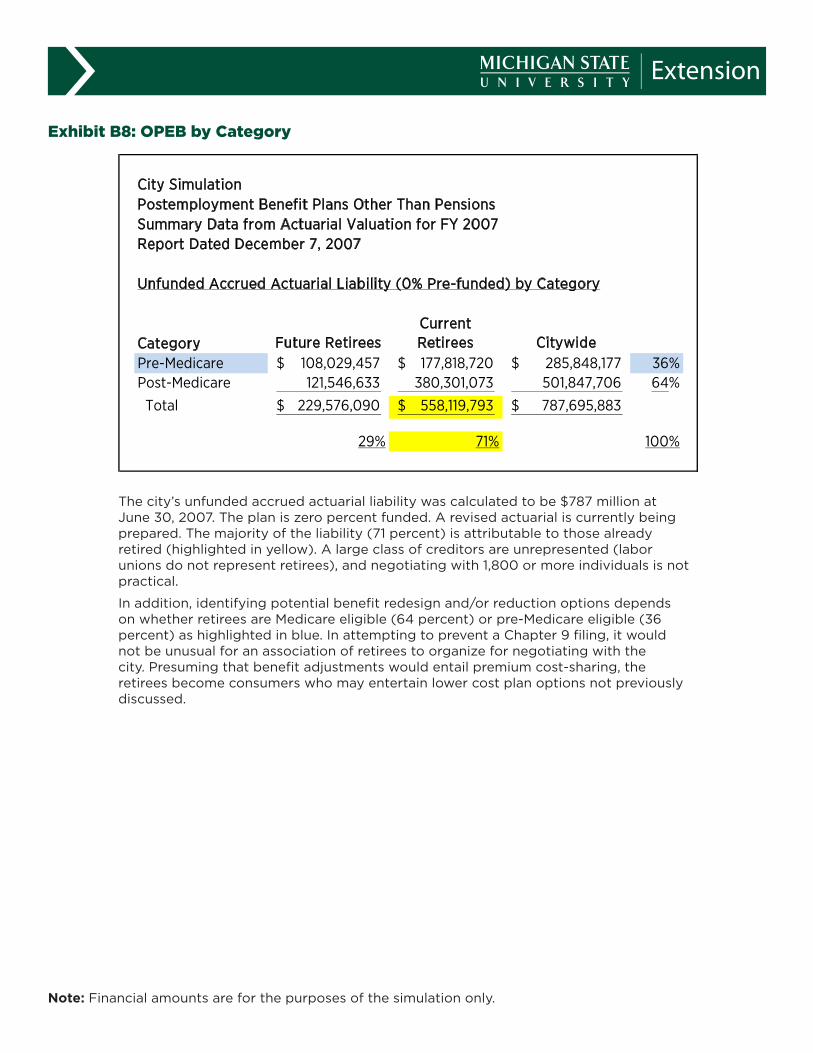
Exhibit B8: OPEB by Category
The city’s unfunded accrued actuarial liability was calculated to be $787 million at June 30, 2007. The plan is zero percent funded. A revised actuarial is currently being prepared. The majority of the liability (71 percent) is attributable to those already retired (highlighted in yellow). A large class of creditors are unrepresented (labor unions do not represent retirees), and negotiating with 1,800 or more individuals is not practical.
In addition, identifying potential benefit redesign and/or reduction options depends on whether retirees are Medicare eligible (64 percent) or pre-Medicare eligible (36 percent) as highlighted in blue. In attempting to prevent a Chapter 9 filing, it would not be unusual for an association of retirees to organize for negotiating with the city. Presuming that benefit adjustments would entail premium cost-sharing, the retirees become consumers who may entertain lower cost plan options not previously discussed.
City SimulationPostemployment Benefit Plans Other Than PensionsSummary Data from Actuarial Valuation for FY 2007Report Dated December 7, 2007
Unfunded Accrued Actuarial Liability (0% Pre-funded) by Category
Category Future RetireesCurrent Retirees Citywide
Pre-Medicare 108,029,457$ 177,818,720$ 285,848,177$ 36%Post-Medicare 121,546,633 380,301,073 501,847,706 64%
Total 229,576,090$ 558,119,793$ 787,695,883$
29% 71% 100%
Note: Financial amounts are for the purposes of the simulation only.
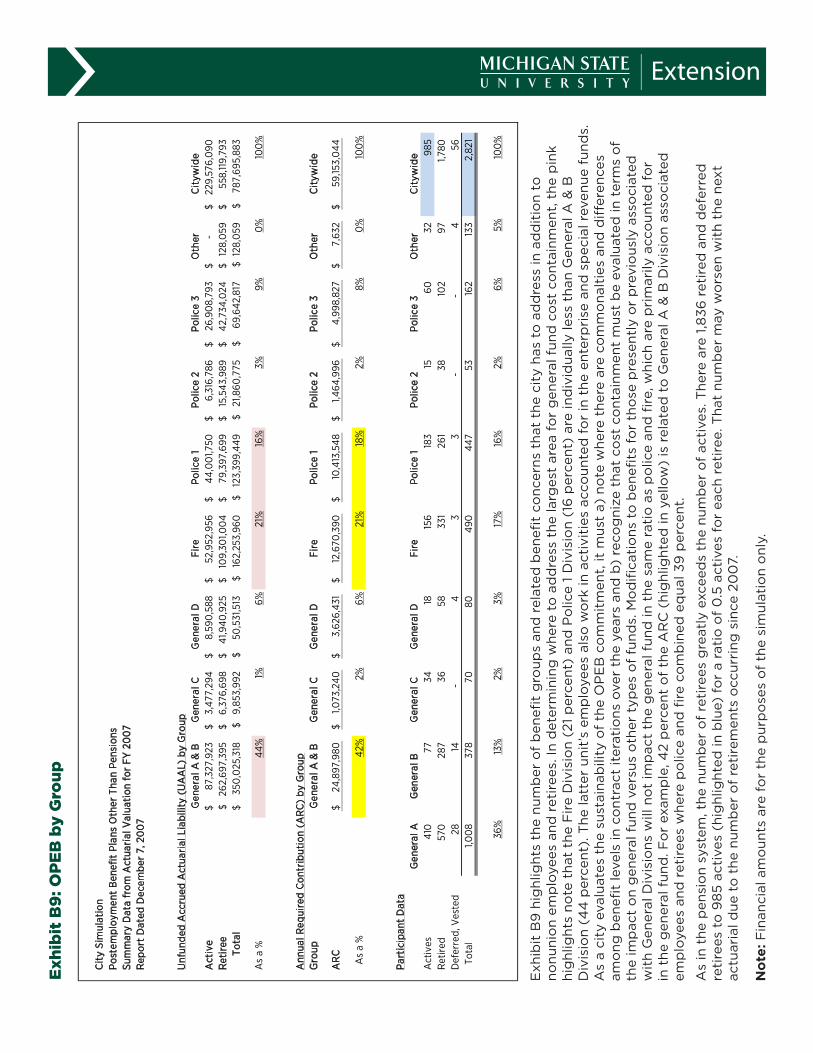
Exhi
bit
B9:
OPE
B b
y G
roup
Exh
ibit
B9
hig
hlig
hts
the
num
ber
of
ben
efit
gro
ups
and
rel
ated
ben
efit
conc
erns
tha
t th
e ci
ty h
as t
o a
dd
ress
in a
dd
itio
n to
no
nuni
on
emp
loye
es a
nd r
etir
ees.
In d
eter
min
ing
whe
re t
o a
dd
ress
the
larg
est
area
fo
r g
ener
al f
und
co
st c
ont
ainm
ent,
the
pin
k hi
ghl
ight
s no
te t
hat
the
Fir
e D
ivis
ion
(21
per
cent
) an
d P
olic
e 1
Div
isio
n (1
6 p
erce
nt)
are
ind
ivid
ually
less
tha
n G
ener
al A
& B
D
ivis
ion
(44
per
cent
). T
he la
tter
uni
t’s
emp
loye
es a
lso
wo
rk in
act
ivit
ies
acco
unte
d f
or
in t
he e
nter
pri
se a
nd s
pec
ial r
even
ue f
und
s.
As
a ci
ty e
valu
ates
the
sus
tain
abili
ty o
f th
e O
PE
B c
om
mit
men
t, it
mus
t a)
no
te w
here
the
re a
re c
om
mo
nalt
ies
and
diff
eren
ces
amo
ng b
enefi
t le
vels
in c
ont
ract
iter
atio
ns o
ver
the
year
s an
d b
) re
cog
nize
tha
t co
st c
ont
ainm
ent
mus
t b
e ev
alua
ted
in t
erm
s o
f th
e im
pac
t o
n g
ener
al f
und
ver
sus
oth
er t
ypes
of
fund
s. M
od
ifica
tio
ns t
o b
enefi
ts f
or
tho
se p
rese
ntly
or
pre
vio
usly
ass
oci
ated
w
ith
Gen
eral
Div
isio
ns w
ill n
ot
imp
act
the
gen
eral
fun
d in
the
sam
e ra
tio
as
po
lice
and
fire
, whi
ch a
re p
rim
arily
acc
oun
ted
fo
r in
the
gen
eral
fun
d. F
or
exam
ple
, 42
per
cent
of
the
AR
C (
hig
hlig
hted
in y
ello
w)
is r
elat
ed t
o G
ener
al A
& B
Div
isio
n as
soci
ated
em
plo
yees
and
ret
iree
s w
here
po
lice
and
fire
co
mb
ined
eq
ual 3
9 p
erce
nt.
As
in t
he p
ensi
on
syst
em, t
he n
umb
er o
f re
tire
es g
reat
ly e
xcee
ds
the
num
ber
of
acti
ves.
The
re a
re 1
,836
ret
ired
and
def
erre
d
reti
rees
to
98
5 ac
tive
s (h
ighl
ight
ed in
blu
e) f
or
a ra
tio
of
0.5
act
ives
fo
r ea
ch r
etir
ee. T
hat
num
ber
may
wo
rsen
wit
h th
e ne
xt
actu
aria
l due
to
the
num
ber
of
reti
rem
ents
occ
urri
ng s
ince
20
07.
No
te: F
inan
cial
am
oun
ts a
re f
or
the
pur
po
ses
of
the
sim
ulat
ion
onl
y.
Cit
y Si
mul
atio
nPo
stem
ploy
men
t B
enef
it P
lans
Oth
er T
han
Pens
ions
Sum
mar
y D
ata
from
Act
uari
al V
alua
tion
for
FY
20
07
Rep
ort
Dat
ed D
ecem
ber
7, 2
00
7
Unf
unde
d A
ccru
ed A
ctua
rial
Lia
bilit
y (U
AA
L) b
y G
roup
Gen
eral
A &
BG
ener
al C
Gen
eral
DFi
rePo
lice
1Po
lice
2Po
lice
3O
ther
C
ityw
ide
Act
ive
87,3
27,9
23$
3,47
7,29
4$
8,
590
,588
$
52
,952
,956
$
44
,00
1,750
$
6,
316,
786
$
26
,90
8,79
3$
-$
22
9,57
6,0
90$
R
etir
ee26
2,69
7,39
5$
6,
376,
698
$
41,9
40,9
25$
10
9,30
1,00
4$
79
,397
,699
$
15
,543
,989
$
42,7
34,0
24$
128,
059
$
558,
119,
793
$
Tot
al35
0,0
25,3
18$
9,85
3,99
2$
50
,531
,513
$
16
2,25
3,96
0$
12
3,39
9,44
9$
21
,860
,775
$
69,6
42,8
17$
128,
059
$
787,
695,
883
$
As
a %
44%
1%6%
21%
16%
3%9%
0%
100
%
Ann
ual R
equi
red
Con
trib
utio
n (A
RC
) by
Gro
upG
roup
Gen
eral
A &
BG
ener
al C
Gen
eral
DFi
rePo
lice
1Po
lice
2Po
lice
3O
ther
C
ityw
ide
AR
C24
,897
,980
$
1,0
73,2
40$
3,62
6,43
1$
12,6
70,3
90$
10,4
13,5
48$
1,464
,996
$
4,
998,
827
$
7,
632
$
59
,153,
044
$
As
a %
42%
2%6%
21%
18%
2%8%
0%
100
%
Part
icip
ant
Dat
aG
ener
al A
Gen
eral
BG
ener
al C
Gen
eral
DFi
rePo
lice
1Po
lice
2Po
lice
3O
ther
C
ityw
ide
Act
ives
410
77
34
18
156
18
3
15
60
32
985
R
etire
d57
0
28
7
36
58
33
1
261
38
10
2
97
1,780
D
efer
red,
Ves
ted
28
14
-
4
3
3
-
-
4
56
Tot
al1,0
08
37
8
70
80
49
0
447
53
16
2
133
2,
821
36%
13%
2%3%
17%
16%
2%6%
5%10
0%
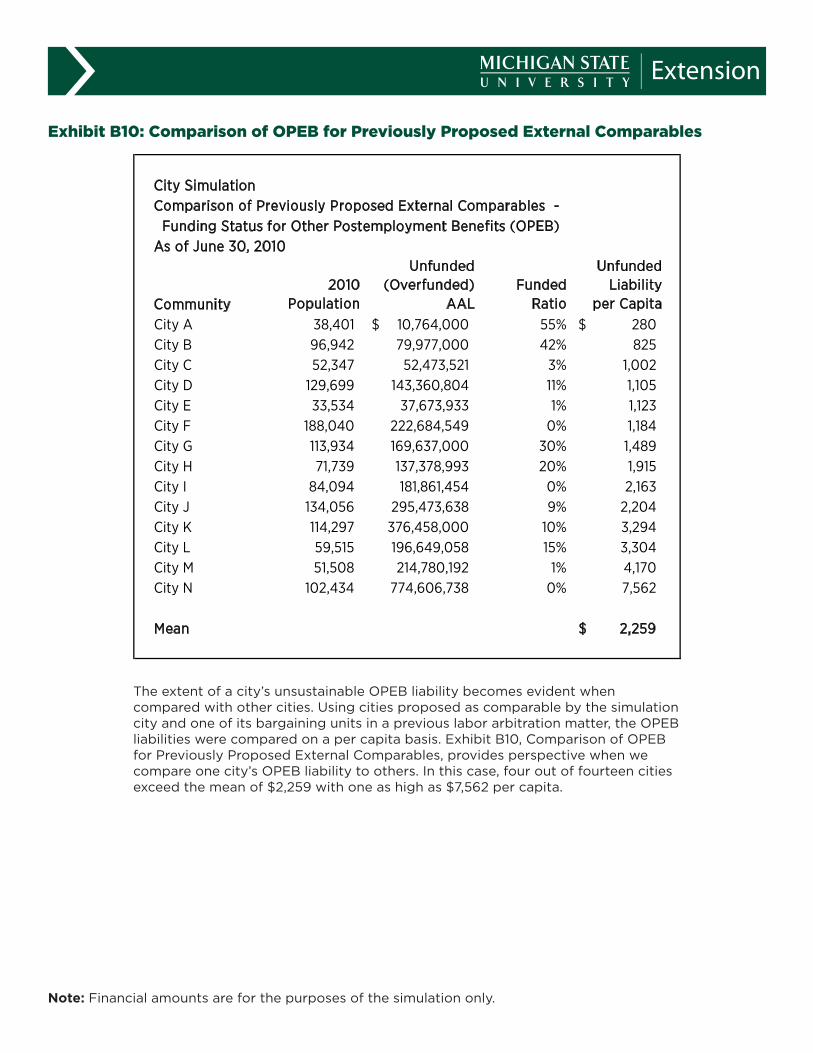
Exhibit B10: Comparison of OPEB for Previously Proposed External Comparables
The extent of a city’s unsustainable OPEB liability becomes evident when compared with other cities. Using cities proposed as comparable by the simulation city and one of its bargaining units in a previous labor arbitration matter, the OPEB liabilities were compared on a per capita basis. Exhibit B10, Comparison of OPEB for Previously Proposed External Comparables, provides perspective when we compare one city’s OPEB liability to others. In this case, four out of fourteen cities exceed the mean of $2,259 with one as high as $7,562 per capita.
City SimulationComparison of Previously Proposed External Comparables - Funding Status for Other Postemployment Benefits (OPEB) As of June 30, 2010
Community2010
Population
Unfunded (Overfunded)
AALFunded
Ratio
Unfunded Liability
per Capita City A 38,401 10,764,000$ 55% 280$ City B 96,942 79,977,000 42% 825 City C 52,347 52,473,521 3% 1,002 City D 129,699 143,360,804 11% 1,105 City E 33,534 37,673,933 1% 1,123 City F 188,040 222,684,549 0% 1,184 City G 113,934 169,637,000 30% 1,489 City H 71,739 137,378,993 20% 1,915 City I 84,094 181,861,454 0% 2,163 City J 134,056 295,473,638 9% 2,204 City K 114,297 376,458,000 10% 3,294 City L 59,515 196,649,058 15% 3,304 City M 51,508 214,780,192 1% 4,170 City N 102,434 774,606,738 0% 7,562
Mean 2,259$
Note: Financial amounts are for the purposes of the simulation only.
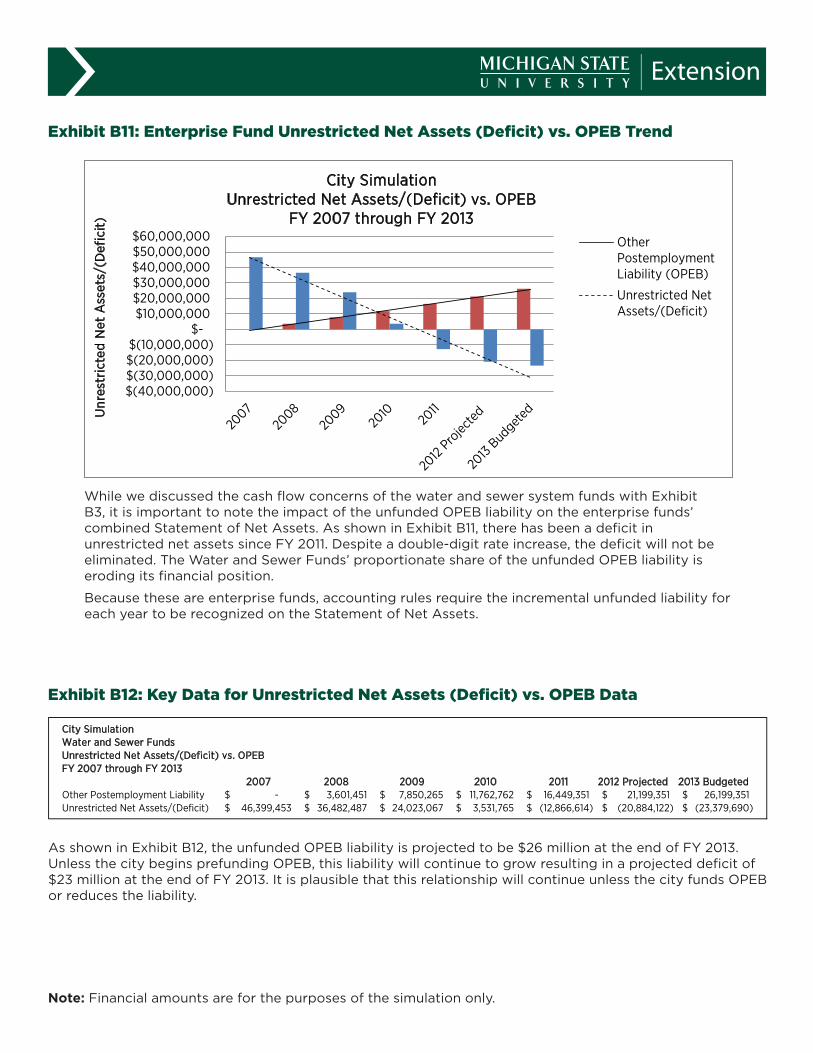
Exhibit B11: Enterprise Fund Unrestricted Net Assets (Deficit) vs. OPEB Trend
Exhibit B12: Key Data for Unrestricted Net Assets (Deficit) vs. OPEB Data
While we discussed the cash flow concerns of the water and sewer system funds with Exhibit B3, it is important to note the impact of the unfunded OPEB liability on the enterprise funds’ combined Statement of Net Assets. As shown in Exhibit B11, there has been a deficit in unrestricted net assets since FY 2011. Despite a double-digit rate increase, the deficit will not be eliminated. The Water and Sewer Funds’ proportionate share of the unfunded OPEB liability is eroding its financial position.
Because these are enterprise funds, accounting rules require the incremental unfunded liability for each year to be recognized on the Statement of Net Assets.
City SimulationWater and Sewer FundsUnrestricted Net Assets/(Deficit) vs. OPEBFY 2007 through FY 2013
2007 2008 2009 2010 2011 2012 Projected 2013 BudgetedOther Postemployment Liability -$ 3,601,451$ 7,850,265$ 11,762,762$ 16,449,351$ 21,199,351$ 26,199,351$ Unrestricted Net Assets/(Deficit) 46,399,453$ 36,482,487$ 24,023,067$ 3,531,765$ (12,866,614)$ (20,884,122)$ (23,379,690)$
As shown in Exhibit B12, the unfunded OPEB liability is projected to be $26 million at the end of FY 2013. Unless the city begins prefunding OPEB, this liability will continue to grow resulting in a projected deficit of $23 million at the end of FY 2013. It is plausible that this relationship will continue unless the city funds OPEB or reduces the liability.
Note: Financial amounts are for the purposes of the simulation only.
City of Flint Water Fund
Fiscal Year Ended June 30
2007 2008 2009 2010 2011 2012 Projected 2013 Budget
Current Assets 17,248,277 16,155,282 13,213,411 9,092,746 9,295,966 Current Liabilities 7,053,131 7,039,015 6,796,178 8,287,409 11,736,286
Capital Assets, net of accumulated de 34,453,626 57,264,585 55,977,802 54,419,070 52,253,233 Revenue Bonds, long-term portion 33,759,432 31,804,432 30,156,259 28,116,259 25,925,336 Unrestricted Net Assets/(Deficit) 12,183,661 8,396,496 2,694,056 (5,795,973) (12,443,265) (13,237,665) (12,733,233)
City of Flint Sewer Fund
Fiscal Year Ended June 30
2007 2008 2009 2010 2011 2012 Projected 2013 Budget
Current Assets 45,805,754 45,515,711 39,299,954 22,199,959 16,496,427 Current Liabilities 17,117,109 18,000,968 12,928,688 2,570,710 1,894,249
Capital Assets, net of accumulated de 76,913,051 73,794,673 74,719,675 70,200,627 65,736,675 Revenue Bonds, long-term portion - - - - - Unrestricted Net Assets/(Deficit) 34,215,792 28,085,991 21,329,011 9,327,738 (423,349) (7,646,457) (10,646,457)
Water and Sewer Combined
City SimulationWater and Sewer FundsUnrestricted Net Assets/(Deficit) vs. OPEBFY 2007 through FY 2013
2007 2008 2009 2010 2011 2012 Projected 2013 BudgetedOther Postemployment Liability -$ 3,601,451$ 7,850,265$ 11,762,762$ 16,449,351$ 21,199,351$ 26,199,351$ Unrestricted Net Assets/(Deficit) 46,399,453$ 36,482,487$ 24,023,067$ 3,531,765$ (12,866,614)$ (20,884,122)$ (23,379,690)$
2008 2009 2010 2011 2012 Proj 2013 Budgeted###### ###### ###### ###### ###### ######
Proprietary Funds Revenues, Expenditures, and Changes in Net Assets
Proprietary Funds Revenues, Expenditures, and Changes in Net Assets
0
10000000
20000000
30000000
40000000
50000000
60000000
70000000
20072008200920102011
Bala
nce
at Y
ear E
nd
City of Flint Water and Sewer Fund Current Assets and Liabilities
FY 2007 through FY 2011
Current Assets
CurrentLiabilities 100000000
110000000120000000130000000140000000
2007 2008 2009 2010 2011
City of Flint Water and Sewer Funds
Capital Assets, net of accumulated depreciation FY 2007 through 2011
Capital Assets, net of accumulated depreciation
$(40,000,000) $(30,000,000) $(20,000,000) $(10,000,000)
$- $10,000,000 $20,000,000 $30,000,000 $40,000,000 $50,000,000 $60,000,000
Unr
estr
icte
d N
et A
sset
s/(D
efic
it)
City Simulation Unrestricted Net Assets/(Deficit) vs. OPEB
FY 2007 through FY 2013 OtherPostemploymentLiability (OPEB)
Unrestricted NetAssets/(Deficit)
200000002200000024000000260000002800000030000000320000003400000036000000
2007 2008 2009 2010 2011
City of Flint Revenue Bonds, long-term portion
FY 2007 through FY 2011
-
5,000,000
10,000,000
15,000,000
20,000,000
25,000,000
30,000,000
2008 2009 2010 2011 2012 Projected 2013 Budgeted
City of Flint Other Postemployment Liabilities
FY 2007 through FY 2011
This Chart is Exhibit B11
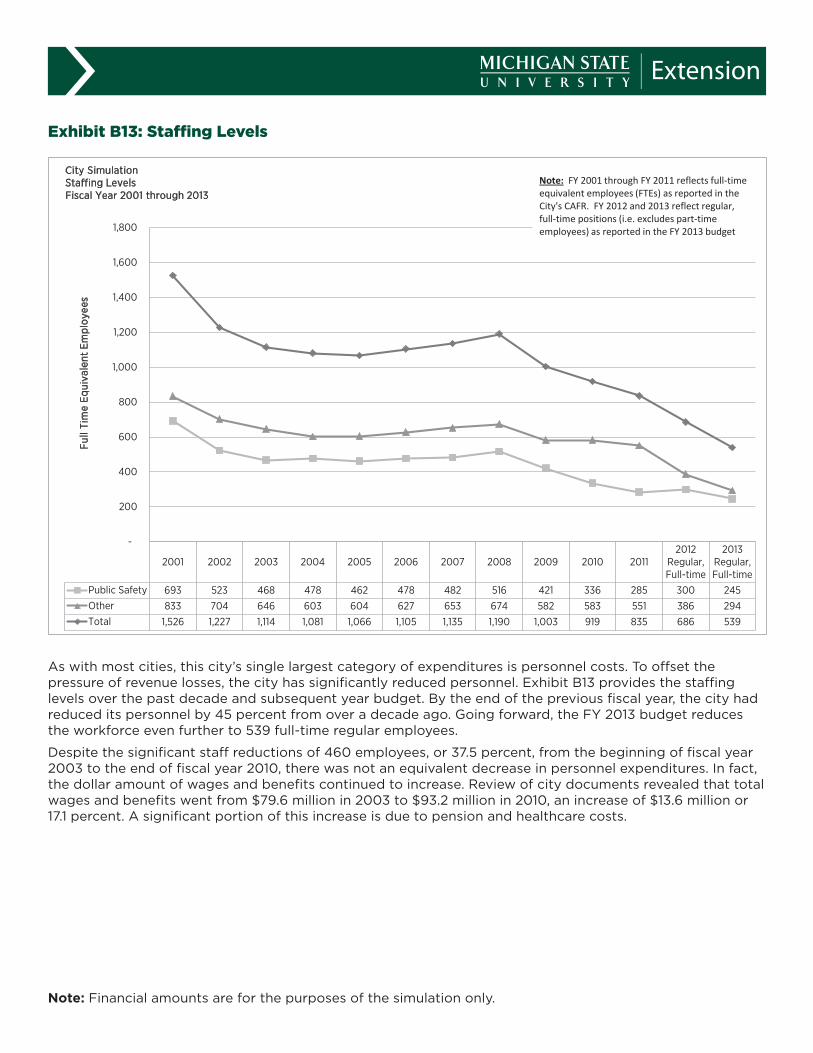
Exhibit B13: Staffing Levels
As with most cities, this city’s single largest category of expenditures is personnel costs. To offset the pressure of revenue losses, the city has significantly reduced personnel. Exhibit B13 provides the staffing levels over the past decade and subsequent year budget. By the end of the previous fiscal year, the city had reduced its personnel by 45 percent from over a decade ago. Going forward, the FY 2013 budget reduces the workforce even further to 539 full-time regular employees.
Despite the significant staff reductions of 460 employees, or 37.5 percent, from the beginning of fiscal year 2003 to the end of fiscal year 2010, there was not an equivalent decrease in personnel expenditures. In fact, the dollar amount of wages and benefits continued to increase. Review of city documents revealed that total wages and benefits went from $79.6 million in 2003 to $93.2 million in 2010, an increase of $13.6 million or 17.1 percent. A significant portion of this increase is due to pension and healthcare costs.
NOTE: FY 2010 Staffing changed from 767 in FY2010 CAFR to 918.8 in FY2011 CAFR - pg S-20 of CAFR
Fiscal Year 2001 2002 2003 2004 2005 2006 2007 2008 2009 2010 2011
2012 Regular, Full-
time
2013 Regular, Full-
time
Public Safety 693 523 468 478 462 478 482 516 421 336 285 300 245Other 833 704 646 603 604 627 653 674 582 583 551 386 294Total 1,526 1,227 1,114 1,081 1,066 1,105 1,135 1,190 1,003 919 835 686 539
budget budget
1,526 1,227 1,114 1,081 1,066 1,105 1,135 1,190 1,003 919 - - - - - - - - - -
151.8
2001 2002 2003 2004 2005 2006 2007 2008 2009 2010 20112012
Regular,Full-time
2013Regular,Full-time
Public Safety 693 523 468 478 462 478 482 516 421 336 285 300 245Other 833 704 646 603 604 627 653 674 582 583 551 386 294Total 1,526 1,227 1,114 1,081 1,066 1,105 1,135 1,190 1,003 919 835 686 539
-
200
400
600
800
1,000
1,200
1,400
1,600
1,800
Full
Tim
e Eq
uiva
lent
Em
ploy
ees
City Simulation Staffing Levels Fiscal Year 2001 through 2013
Note: FY 2001 through FY 2011 reflects full-time equivalent employees (FTEs) as reported in the City's CAFR. FY 2012 and 2013 reflect regular, full-time positions (i.e. excludes part-time employees) as reported in the FY 2013 budget
Personnel reduced by 50%
This is Exhibit B13
Note: Financial amounts are for the purposes of the simulation only.

Exhibit B14: Per Employee Cost
Exhibit B14, above, demonstrates the impact of current retiree healthcare costs and the OPEB liability on a “per employee” costing unit basis. The FY 2010 average direct cost rate per employee was $82,355. Adding in the cost of current retiree healthcare premiums, that rate increases to $105,324. Finally, adding the actuarially determined annual contribution, the per employee basis increases to $147,102.
The purpose of analysis as shown in the last two exhibits is 1) for local officials to better understand the personnel costs for decision-making purposes and 2) to explain the impact of fringe benefits versus wages to stakeholders.
City SimulationWages and Benefits on a Per Employee BasisFiscal Year 2003 through 2010
Fiscal Year 2003 2004 2005 2006 2007 2008 2009 2010Annual wages (including overtime)* 45$ 44$ 43$ 47$ 52$ 58$ 49$ 46$ Direct Cost of Fringe Benefits for Active Employees* 20.8 18.8 19.5 23.2 26.2 27.6 28.9 26.6 Total Wages and Benefits* 66$ 63$ 62$ 70$ 78$ 85$ 78$ 73$ Average # of Employees During the Fiscal year 1,114 1,097 1,073 1,085 1,120 1,163 1,096 885 Average Wages and Benefits per Employee 59,379$ 57,608$ 57,966$ 64,778$ 69,468$ 73,502$ 71,117$ 82,355$
Retiree Healthcare - Current premiums* 13.5 15.8 16.4 16.2 18.6 19.2 19.5 20.3
Per Employee Basis With Current Retiree Premiums (pay as you go) 71,476$ 71,987$ 73,292$ 79,670$ 86,054$ 90,010$ 88,933$ 105,324$
OPEB ARC for Unfunded Liability* 40.9 35.7 37.0 Per Employee Basis All Costs 125,210$ 121,512$ 147,102$
* Expense levels shown in millions
Notes(1) Includes all employees, both those with full benefits and those with minimum benefits required by law.
(2) Includes contribution for both normal cost and unfunded actuarial accrued liability for the defined benefit pension system.
Also includes other fringe benefits for active employees such as healthcare, worker compensation, FICA, unemployment, and life insurance.
(3) Represents annual required contribution (ARC) for other postemployment benefits (OPEB) (i.e. retiree healthcare). Data available as of FY 2008.
(4) Amounts obtained from City Finance Department.
Note: Financial amounts are for the purposes of the simulation only.