Embed Size (px)
Citation preview
CHAPTER 5
CHANGES OF LIPIDS IN SARDINE (SARDINELLA GIBBOSA) MUSCLE DURING
ICED STORAGE
5.1 Abstract
Changes in lipids of sardine (Sardinella gibbosa) muscle during 15 days of iced
storage were investigated. Lipid deterioration, lipolysis and lipid oxidation, occurred throughout
the storage. A progressive peroxide formation monitored by the increase in absorbance band at
3,600-3,200 cm-1 in Fourier transform infrared (FTIR) spectra and increased peroxide value were
observed in sardine muscle up to 6 days of iced storage, followed by a continuous decrease from
then for 9 days (P<0.05). The increase in thiobarbituric reactive substances (TBARS) was
noticeable throughout the iced storage (P<0.05). However, no difference in conjugated diene
(CD) of sardine muscle was found within the first 12 days of iced storage (P>0.05). Marked
decreases in unsaturated fatty acids, especially eicosapentaenoic acid (EPA; C20:5(n-3)) and
docosahexaenoic acid (DHA; C22:6(n-3)) were observed as the storage time increased. Those
changes indicated lipid oxidation occurred in sardine muscle. A gradual increase in free fatty acid
formation, with decreases in triglyceride and phospholipid contents, was found during iced
storage (P<0.05), suggesting the hydrolysis induced by lipases and phospholipases.
5.2 Introduction
Fresh fish is susceptible to spoilage caused by both microbiological and
chemical reactions. Lipid deterioration easily takes place and limits the shelf-life of oily fish
during storage (Cho et al., 1989; Mcdonald and Hultin, 1987). Both hydrolytic and oxidative
rancidities in fish muscle are associated with the quality deterioration (Pacheco-Aguilar et al.,
80
81
2000). Hydrolysis, induced by lipases and phospholipases, produces free fatty acids that undergo
further oxidation to produce low-molecular-weight compounds that are responsible for the rancid
off-flavour and taste of fish and fish products (Toyomizu et al., 1981).
The lipid components of post-mortem fish muscle tissue are prone to the
oxidation because fatty acids of fish lipids are much more unsaturated than those of mammals and
birds (Foegeding et al., 1996). The basic mechanisms of lipid oxidative reactions can be
characterized by three distinctive steps: initiation, propagation and termination reactions
(Undeland, 2001; Nawar, 1996). This phenomenon can be influenced by both intrinsic and
extrinsic factors such as the fatty acid composition, the concentration of prooxidants, endogenous
ferrous iron, myoglobin, enzymes, pH, temperature, ionic strength and oxygen consumption
reaction (Andreo et al., 2003; Undeland, 2001; Harris and Tall, 1994a; Renerre and Labas, 1978).
Metmyoglobin formation is positively correlated with lipid oxidation (Lee et al., 2003a; Chan et
al., 1997). Myoglobin and other heme compounds, at high concentration in red meats, function as
prooxidants in muscle tissue (Love, 1983). Chaijan et al. (2005a) reported that the release of non-
heme iron in sardine and mackerel during iced storage might be associated with the induced
oxidation process in the muscle. Enzymatic and non-enzymatic reducing systems, converting iron
from the inactive ferric form to the active ferrous state, can accelerate oxidation of meat
(Foegeding et al., 1996). In addition, membrane components, such as cytochromes or non-heme
iron proteins, are able to convert species, such as superoxyl radicals into more reactive species,
such as the hydroxyl radical (Hultin and Kelleher, 2000a). The conversion of superoxide (O2°-) to
the more reactive HOO° favours the oxidative reactions (McDonal and Hultin, 1987).
Due to the lack of lean fish, which are commonly used for surimi production,
dark-fleshed fish, such as sardine, have recently received more attention as the raw material for
surimi production (Chaijan et al., 2004). However, the large quantity of lipids and myoglobin in
the muscle tissue limits the surimi production, from those fatty dark-fleshed fish. During post-
mortem handling or storage, several reactions take place, particularly lipid deterioration (Cho et
al., 1989; Mcdonald and Hultin, 1987). Recently, sardine myoglobin extractability has been
reported to be lowered during extended iced storage (Chaijan et al., 2005a). This might be
associated with increased lipid oxidation and the occurrence of oxidation products, such as
aldehydes, associated with protein cross-linking (Tironi et al., 2002; Li and King, 1999).
82
However, no information regarding the changes in lipid in muscle of sardine caught in Thailand
has been reported. Thus, this study aimed to investigate the changes of lipid components, lipolysis
and lipid oxidation, in whole sardine (Sardinella gibbosa) meat during the extended storage in
ice.
5.3 Materials and Methods
Chemicals
Palmitic acid, cupric acetate and pyridine were purchased from Sigma (St. Louis.
MO, USA). Sodium thiosulfate, potassium iodide, trichloroacetic acid, anhydrous sodium sulfate,
isooctane and benzene were obtained from Merck (Damstadt, Germany). Chloroform was
purchased from BDH (Poole, England). 2-thiobarbituric acid and 1,1,3,3-tetramethoxypropane
were procured from Fluka (Buchs, Switzerland). All chemicals were of analytical grade.
Fish samples
Sardine (Sardinella gibbosa) with an average weight of 55-60 g was caught from
Songkhla-Pattani Coast along the Gulf of Thailand in November, 2004. The fish, off-loaded
approximately 12 h after capture, were placed in ice with a fish/ice ratio of 1:2 (w/w) and
transported to the Department of Food Technology, Prince of Songkla University, Hat Yai within
2 h. Whole fish were immediately washed and kept in ice with a fish/ice ratio of 1:2 (w/w). The
fish were placed and distributed uniformly between the layers of ice. The box containing fish and
ice was kept at 4°C for 15 days. To maintain the ice content, melted ice was removed and
replaced with an equal amount of ice every 2 days. During storage, 1 kg of fish was randomly
taken as the composite sample at day 0, 3, 6, 9, 12 and 15 for analyses. The fish samples were
washed and filleted. The flesh was chopped to uniformity and used for analyses.
Lipid extraction
83
Lipid was extracted by the Bligh and Dyer method (1959). Sample (25 g) was
homogenized with 200 ml of a chloroform:methanol:distilled water mixture (50:100:50) at the
speed of 9,500 rpm for 2 min at 4°C using an IKA Labortechnik homogenizer (Selangor,
Malaysia). The homogenate was treated with 50 ml of chloroform and homogenized at 9,500 rpm
for 1 min. Then, 25 ml of distilled water were added and homogenized again for 30 sec. The
homogenate was centrifuged at 3,000 rpm at 4°C for 15 min using a RC-5B plus centrifuge
(Sorvall, Norwalk, CT, USA), and transferred into a separating flask. The chloroform phase was
drained off into the 125 ml Erlenmeyer flask containing about 2-5 g of anhydrous sodium sulfate,
shaken very well, and decanted into a round-bottom flask through a Whatman No.4 filter paper.
The solvent was evaporated at 25°C using an EYELA rotary evaporator N-100 (Tokyo, Japan),
and the residual solvent was removed by flushing nitrogen. The total lipid content ranged from
4.62% to 6.70%.
Measurement of peroxide value (PV)
Peroxide value was determined according to the method of Low and Ng (1978).
The lipid sample (1.0 g) was treated with 25 ml of organic solvent mixture (chloroform:acetic
acid mixture, 2:3). The mixture was shaken vigorously, followed by addition of 1 ml of saturated
potassium iodide solution. The mixture was kept in the dark for 5 min and 75 ml of distilled water
were added and the mixture was shaken. To the mixture, 0.5 ml of starch solution (1%, w/v) was
added as an indicator. The peroxide value was determined by titrating iodine liberated from
potassium iodide with standardized 0.01 N sodium thiosulfate solution. The PV was expressed as
the milliequivalents of free iodine per kg of lipid.
Measurement of conjugated diene (CD)
Conjugated diene was measured according to the method of Frankel and Huang
(1996). Oil sample (0.1 g) was dissolved in 5.0 ml of isooctane and the absorbance was measured
at 234 nm using a UV-1601 spectrophotometer (Shimadzu, Japan).
84
Measurement of thiobarbituric acid-reactive substances (TBARS)
Thiobarbituric acid-reactive substances (TBARS) assay was performed as
described by Buege and Aust (1978). Ground sample (0.5 g) was homogenized with 2.5 ml of a
solution containing 0.375% thiobarbituric acid, 15% trichloroacetic acid and 0.25 N HCl using an
IKA Labortechnik homogenizer (Selangor, Malaysia). The mixture was heated in a boiling water
bath (95-100°C) for 10 min to develop a pink color, cooled with running tap water and
centrifuged at 3,600×g at 25°C for 20 min using a RC-5B plus centrifuge (Sorvall, Norwalk, CT,
USA). The absorbance of the supernatant was measured at 532 nm. A standard curve was
prepared using 1,1,3,3-tetramethoxypropane at concentrations ranging from 0 to 10 ppm. TBARS
was calculated and expressed as mg malonaldehyde/kg sample.
Measurement of free fatty acid (FFA)
Free fatty acid content was determined according to the method of Lowry and
Tinsley (1976). Lipid sample (0.1 g) was added with 5 ml of isooctane and swirled vigorously to
dissolve the sample. The mixture was then treated with 1 ml of 5% (w/v) cupric acetate-pyridine
reagent, prepared by dissolving the reagent grade cupric acetate, filtering and adjusting the pH to
6.0-6.2 using pyridine. The mixture was shaken vigorously for 90 s using a Vortex-Genie2 mixer
(Bohemia, NY, USA) and allowed to stand for 10-20 s. The upper layer was subjected to
absorbance measurement at 715 nm, using a UV-1601 spectrophotometer (Shimadzu, Japan). A
standard curve was prepared using palmitic acid in isooctane at concentrations ranging from 0 to
50 µmol/5 ml. FFA content was expressed as g FFA/100 g lipid.
Lipid compositions
85
Lipid classes were determined using a thin layer chromatography/flame
ionization detection analyzer (IATROSCAN TLC/FID Analyzer, IATRON Laboratories, Inc.,
Tokyo, Japan). One µl of lipid sample (0.25 mg/ml) was spotted onto the scanned quartz rod
(silica powder coated ChrmatorodS III, IATRON Laboratories, Inc., Tokyo Japan) and separated
using the mixtures of benzene:chloroform:acetic acid (50:20:0.7) for 35 min. The developed
sample was dried in an oven at 105°C for 5 min and immediately scanned with the TLC-FID
analyzer with a scanning speed of 30 sec/scan. The analytical conditions were: H2, flow rate of
160 ml/min; air, flow rate of 2,000 ml/min. Retention times of lipid standards were used to
identify chromatographic peaks of the samples. Each lipid content was calculated, based on peak
area ratio and expressed as mg lipid/kg meat.
Fatty acid profile
Fatty acid profile was determined as fatty acid methyl esters (FAMEs). The
FAMEs were prepared according to the method of AOAC (2000). The prepared methyl ester was
injected to the gas chromatography (Shimadzu, Kyoto, Japan) equipped with the flame ionization
detector (FID) at a split ratio of 1:20. A fused silica capillary column (30 m × 0.25 mm), coated
with bonded polyglycol liquid phase, was used. The analytical conditions were: injection port
temperature of 250°C and detector temperature of 270°C. The oven was programed from 170 to
225°C at a rate of 1°C /min (no initial or final hold). Retention times of FAME standards were
used to identify chromatographic peaks of the samples. Fatty acid content was calculated, based
on the peak area ratio and expressed as g fatty acid/100 g oil.
Fourier transform infrared (FTIR) spectra analysis
FTIR analysis of crude sardine oil was performed in a horizontal ATR Trough
plate crystal cell (45° ZnSe; 80 mm long, 10 mm wide and 4 mm thick) (PIKE Technology, Inc.,
Madison, WI) equipped with a Bruker Model Vector 33 FTIR spectrometer (Bruker Co.,
Ettlingen, Germany). Prior to analysis, the crystal cell was cleaned with acetone, wiped dry with
soft tissue and the background scan was run. For spectra analysis, oil sample (200 µl) was
86
applied directly onto the crystal cell and the cell was clamped into the mount of the FTIR
spectrometer. The spectra in the range of 4,000-400 cm-1 (mid-IR region) with the automatic
signal gain were collected in 16 scans at a resolution of 4 cm-1 and were ratioed against a
background spectrum recorded from the clean, empty cell at 25°C. Analysis of spectral data was
carried out using the OPUS 3.0 data collection software program (Bruker Co., Ettlingen,
Germany).
Statistical analysis
Data were subjected to analysis of variance (ANOVA). Comparison of means
was carried out by DuncanIs multiple range test (Steel and Torrie, 1980). Statistical analysis was
performed using the Statistical Package for Social Science (SPSS 11.0 for windows, SPSS Inc.,
Chicago, IL).
5.4 Results and Discussion
Changes in PV
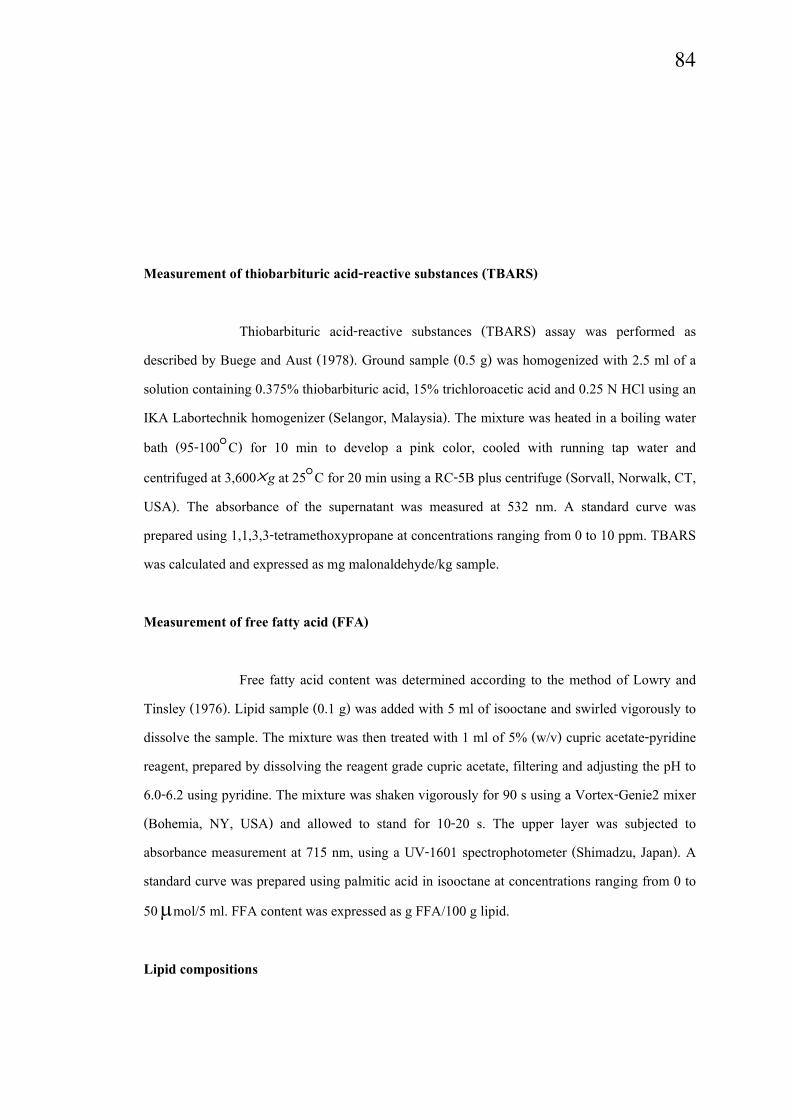
Marked increase in PV was observed in sardine muscle throughout the iced
storage up to 6 days (P<0.05) (Figure 17). No changes in PV were found from days 6 to 9 (P>
0.05). Thereafter, a decrease in PV was noticeable (P<0.05). The decreased PV observed with
extended storage time was presumed to be due to the decomposition of hydroperoxide.
Hydroperoxides break down in several steps, yielding a wide variety of decomposition products
including aldehydes (Nawar, 1996).
87
Figure 17. Changes in peroxide values of sardine muscle during iced storage. Bars indicate
standard deviations from triplicate determinations.
From the result, the lipid oxidation occurred in sardine muscle rapidly during
iced storage, probably due to the high content of unsaturated fatty acids and prooxidants in the
muscle, especially dark muscle. Pacheco-Aguilar et al. (2000) reported that the shelf life of oily
Monterey sardine was limited by lipid oxidation, as shown by the increase of PV during storage at
0°C up to 15 days. Myoglobin and other heme compounds in red meats functioned as prooxidants
in muscle tissue (Han et al., 1994; Love, 1983). A high concentration of polyunsaturated fatty
acids made Monterey sardine susceptible to oxidation (Pacheco-Aguilar et al., 2000). Lipid
oxidation is a complex process in which unsaturated fatty acids react with molecular oxygen,
usually via a free radical mechanism, to form hydroperoxides, the primary oxidation products
(Simic and Taylor, 1987). Apart from a plenty of unsaturated fatty acids, heme protein as well as
reactive iron in the muscle, might contribute to the accelerated oxidation of sardine. Kisia (1996)
reported that sardine contained more dark muscle, and greater quantities of mitochondria,
myoglobin, fats, glycogen and cytochromes, than did with white fleshed-fish species. Dark
muscle from sardine contained much greater pigment content than ordinary muscle (Chaijan et
al., 2005a). The release of non-heme iron in sardine muscle during extended iced storage might
enhance the oxidation process in the muscle (Chaijan et al., 2005a).
Changes in CD
0
10
20
30
40
50
0 3 6 9 12 15
Storage time (day)
Per
oxid
e va
lue
(meq
/kg l
ipid
)
88
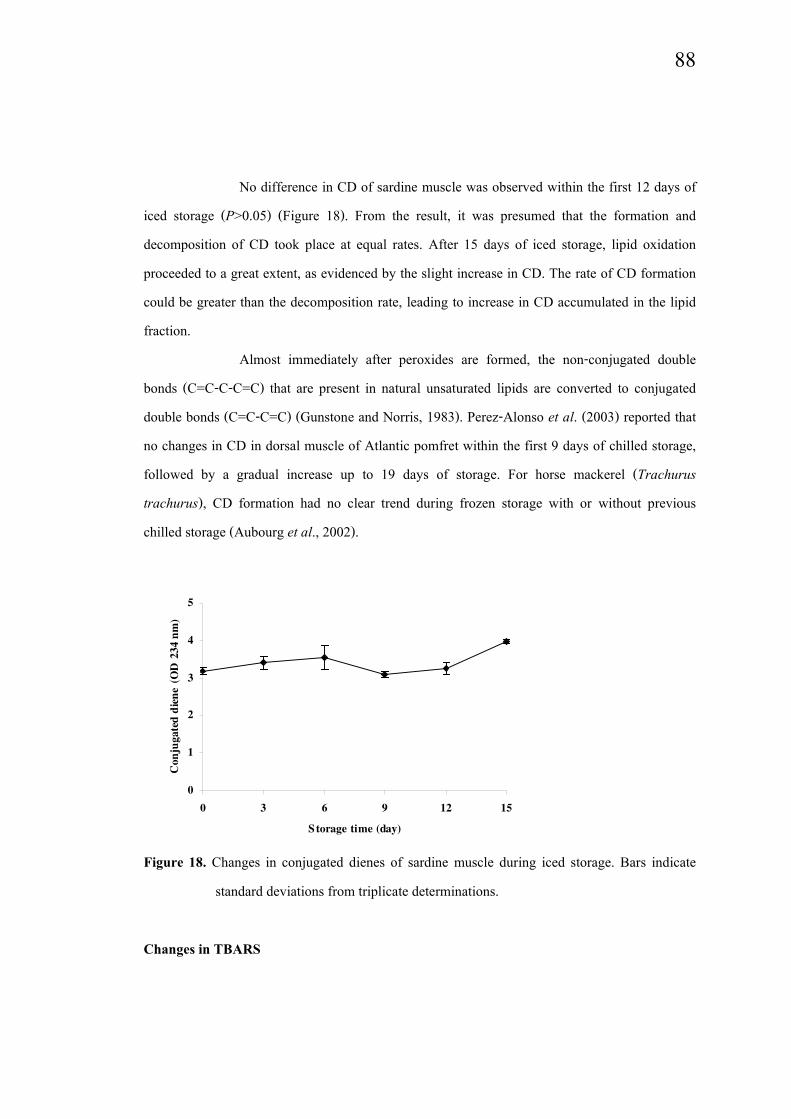
No difference in CD of sardine muscle was observed within the first 12 days of
iced storage (P>0.05) (Figure 18). From the result, it was presumed that the formation and
decomposition of CD took place at equal rates. After 15 days of iced storage, lipid oxidation
proceeded to a great extent, as evidenced by the slight increase in CD. The rate of CD formation
could be greater than the decomposition rate, leading to increase in CD accumulated in the lipid
fraction.
Almost immediately after peroxides are formed, the non-conjugated double
bonds (C=C-C-C=C) that are present in natural unsaturated lipids are converted to conjugated
double bonds (C=C-C=C) (Gunstone and Norris, 1983). Perez-Alonso et al. (2003) reported that
no changes in CD in dorsal muscle of Atlantic pomfret within the first 9 days of chilled storage,
followed by a gradual increase up to 19 days of storage. For horse mackerel (Trachurus
trachurus), CD formation had no clear trend during frozen storage with or without previous
chilled storage (Aubourg et al., 2002).
Figure 18. Changes in conjugated dienes of sardine muscle during iced storage. Bars indicate
standard deviations from triplicate determinations.
Changes in TBARS
0
1
2
3
4
5
0 3 6 9 12 15
Storage time (day)
Con
jug
ate
d d
ien
e (O
D 2
34 n
m)
89
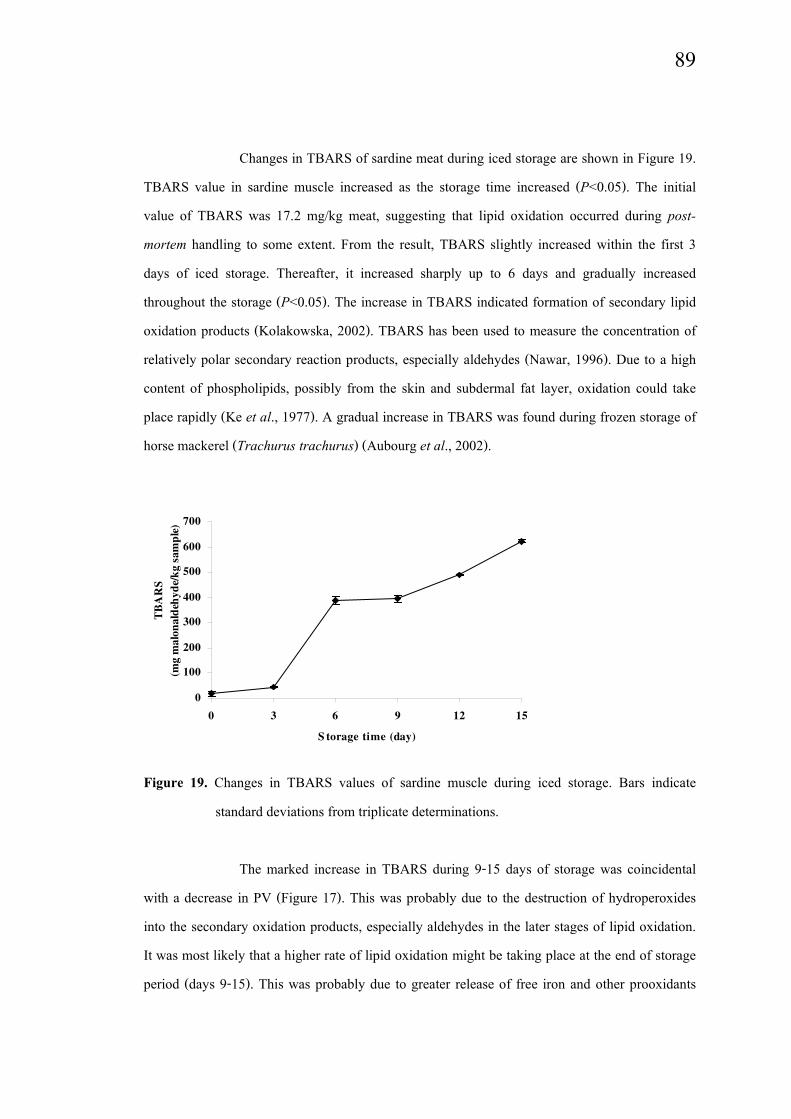
Changes in TBARS of sardine meat during iced storage are shown in Figure 19.
TBARS value in sardine muscle increased as the storage time increased (P<0.05). The initial
value of TBARS was 17.2 mg/kg meat, suggesting that lipid oxidation occurred during post-
mortem handling to some extent. From the result, TBARS slightly increased within the first 3
days of iced storage. Thereafter, it increased sharply up to 6 days and gradually increased
throughout the storage (P<0.05). The increase in TBARS indicated formation of secondary lipid
oxidation products (Kolakowska, 2002). TBARS has been used to measure the concentration of
relatively polar secondary reaction products, especially aldehydes (Nawar, 1996). Due to a high
content of phospholipids, possibly from the skin and subdermal fat layer, oxidation could take
place rapidly (Ke et al., 1977). A gradual increase in TBARS was found during frozen storage of
horse mackerel (Trachurus trachurus) (Aubourg et al., 2002).
Figure 19. Changes in TBARS values of sardine muscle during iced storage. Bars indicate
standard deviations from triplicate determinations.
The marked increase in TBARS during 9-15 days of storage was coincidental
with a decrease in PV (Figure 17). This was probably due to the destruction of hydroperoxides
into the secondary oxidation products, especially aldehydes in the later stages of lipid oxidation.
It was most likely that a higher rate of lipid oxidation might be taking place at the end of storage
period (days 9-15). This was probably due to greater release of free iron and other prooxidants
0
100
200
300
400
500
600
700
0 3 6 9 12 15
S torage time (day)
TB
AR
S
(m
g m
alo
na
ldeh
yd
e/k
g s
am
ple
)
90
from the muscle which was excessively degraded when storage time increased. Muscle proteins,
as well as heme proteins, might undergo degradation with increasing storage times in ice.
Benjakul et al. (2003) reported a marked increase in protein hydrolysis, especially myosin heavy
chain, in lizardfish during extended iced storage. Additionally, the loss in natural antioxidants
during extended storage might contribute to the increased lipid oxidation. Thus, lipid oxidation
became more pronounced in sardine muscle when iced storage time increased. This resulted in the
deterioration and unacceptability of the sardine meat.
Changes in FFA
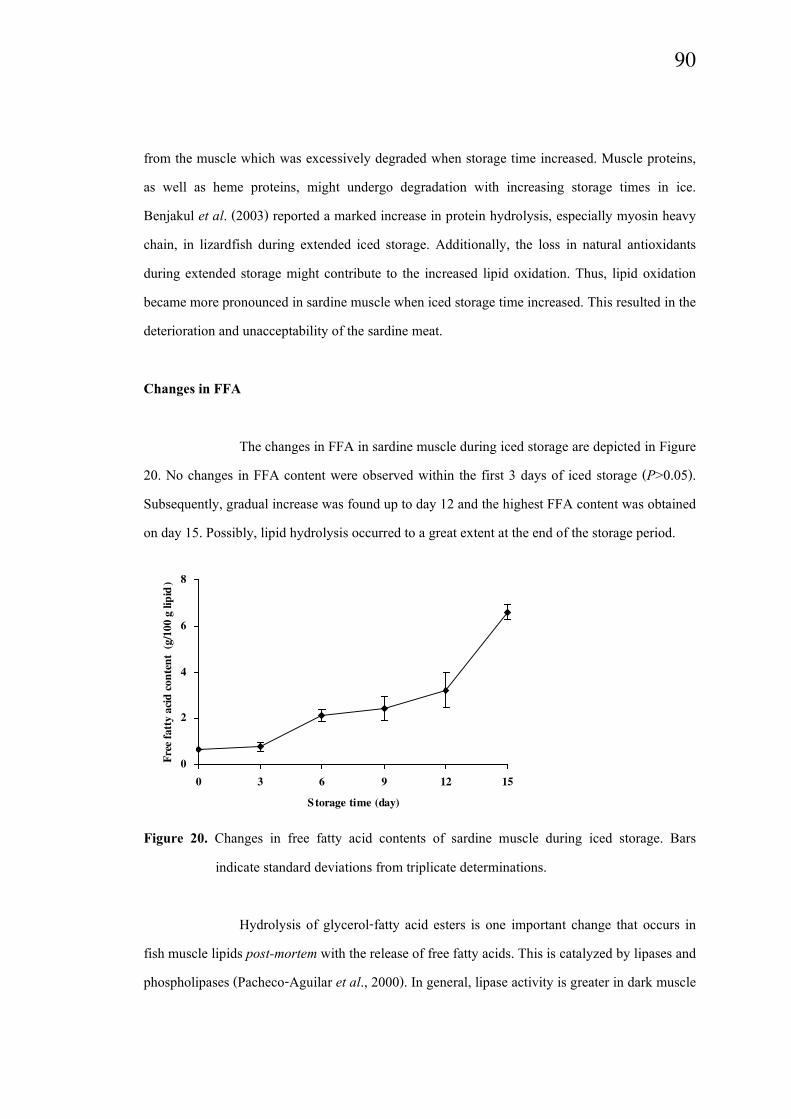
The changes in FFA in sardine muscle during iced storage are depicted in Figure
20. No changes in FFA content were observed within the first 3 days of iced storage (P>0.05).
Subsequently, gradual increase was found up to day 12 and the highest FFA content was obtained
on day 15. Possibly, lipid hydrolysis occurred to a great extent at the end of the storage period.
Figure 20. Changes in free fatty acid contents of sardine muscle during iced storage. Bars
indicate standard deviations from triplicate determinations.
Hydrolysis of glycerol-fatty acid esters is one important change that occurs in
fish muscle lipids post-mortem with the release of free fatty acids. This is catalyzed by lipases and
phospholipases (Pacheco-Aguilar et al., 2000). In general, lipase activity is greater in dark muscle
0
2
4
6
8
0 3 6 9 12 15
Storage time (day)
Fre
e fa
tty a
cid
co
nte
nt
(g/1
00 g
lip
id)
91
than in ordinary muscle of the same fish species (Foegeding et al., 1996). Since the whole fish
were stored in ice, lipases from internal organs might be released into muscle, where lipids were
localized. Intestinal lipase was found in oil sardine (Sardinella longiceps Linnaeus) (Nayak et al.,
2003). Kolakowska et al. (2002) also found active phospholipase in fish pyloric caeca. In
addition, extracellular lipase, produced by certain microorganisms, such as Pseudomonas fragi
also contributed to the lipolytic breakdown of fish lipids (Nayak et al., 2003). The accumulation
of FFA in sardine muscle could be attributable to the lipase and phospholipase activity in sardine
muscle, digestive organs as well as microorganisms, which were enhanced with extended storage.
Changes in lipid compositions
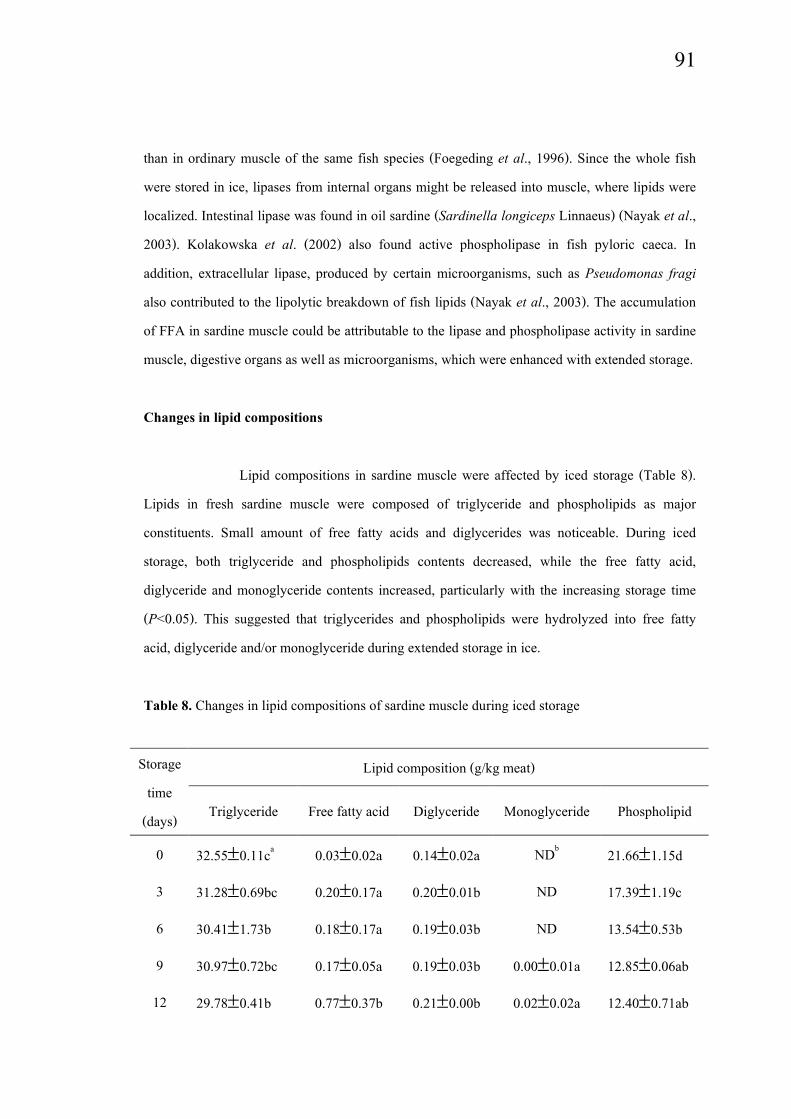
Lipid compositions in sardine muscle were affected by iced storage (Table 8).
Lipids in fresh sardine muscle were composed of triglyceride and phospholipids as major
constituents. Small amount of free fatty acids and diglycerides was noticeable. During iced
storage, both triglyceride and phospholipids contents decreased, while the free fatty acid,
diglyceride and monoglyceride contents increased, particularly with the increasing storage time
(P<0.05). This suggested that triglycerides and phospholipids were hydrolyzed into free fatty
acid, diglyceride and/or monoglyceride during extended storage in ice.
Table 8. Changes in lipid compositions of sardine muscle during iced storage
Lipid composition (g/kg meat)Storage
time
(days)Triglyceride Free fatty acid Diglyceride Monoglyceride Phospholipid
0 32.55±0.11ca 0.03±0.02a 0.14±0.02a NDb
21.66±1.15d
3 31.28±0.69bc 0.20±0.17a 0.20±0.01b ND 17.39±1.19c
6 30.41±1.73b 0.18±0.17a 0.19±0.03b ND 13.54±0.53b
9 30.97±0.72bc 0.17±0.05a 0.19±0.03b 0.00±0.01a 12.85±0.06ab
12 29.78±0.41b 0.77±0.37b 0.21±0.00b 0.02±0.02a 12.40±0.71ab
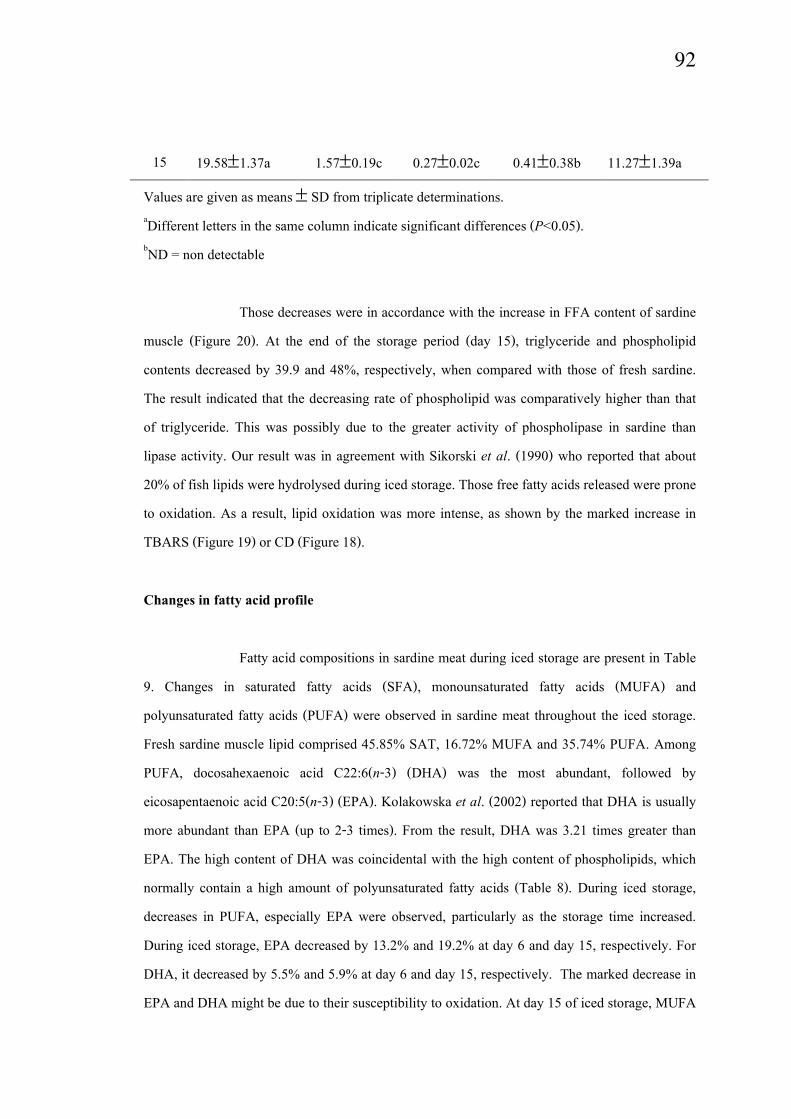
92
15 19.58±1.37a 1.57±0.19c 0.27±0.02c 0.41±0.38b 11.27±1.39a
Values are given as means ± SD from triplicate determinations.aDifferent letters in the same column indicate significant differences (P<0.05).bND = non detectable
Those decreases were in accordance with the increase in FFA content of sardine
muscle (Figure 20). At the end of the storage period (day 15), triglyceride and phospholipid
contents decreased by 39.9 and 48%, respectively, when compared with those of fresh sardine.
The result indicated that the decreasing rate of phospholipid was comparatively higher than that
of triglyceride. This was possibly due to the greater activity of phospholipase in sardine than
lipase activity. Our result was in agreement with Sikorski et al. (1990) who reported that about
20% of fish lipids were hydrolysed during iced storage. Those free fatty acids released were prone
to oxidation. As a result, lipid oxidation was more intense, as shown by the marked increase in
TBARS (Figure 19) or CD (Figure 18).
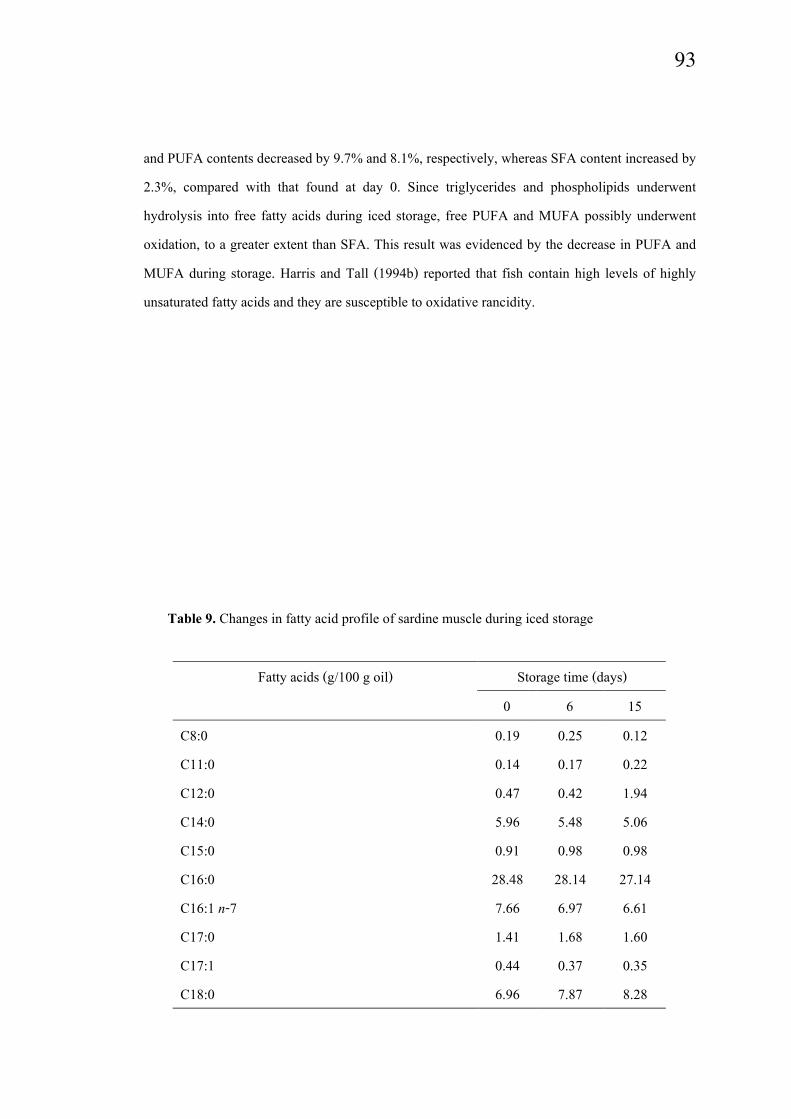
Changes in fatty acid profile
Fatty acid compositions in sardine meat during iced storage are present in Table
9. Changes in saturated fatty acids (SFA), monounsaturated fatty acids (MUFA) and
polyunsaturated fatty acids (PUFA) were observed in sardine meat throughout the iced storage.
Fresh sardine muscle lipid comprised 45.85% SAT, 16.72% MUFA and 35.74% PUFA. Among
PUFA, docosahexaenoic acid C22:6(n-3) (DHA) was the most abundant, followed by
eicosapentaenoic acid C20:5(n-3) (EPA). Kolakowska et al. (2002) reported that DHA is usually
more abundant than EPA (up to 2-3 times). From the result, DHA was 3.21 times greater than
EPA. The high content of DHA was coincidental with the high content of phospholipids, which
normally contain a high amount of polyunsaturated fatty acids (Table 8). During iced storage,
decreases in PUFA, especially EPA were observed, particularly as the storage time increased.
During iced storage, EPA decreased by 13.2% and 19.2% at day 6 and day 15, respectively. For
DHA, it decreased by 5.5% and 5.9% at day 6 and day 15, respectively. The marked decrease in
EPA and DHA might be due to their susceptibility to oxidation. At day 15 of iced storage, MUFA
93
and PUFA contents decreased by 9.7% and 8.1%, respectively, whereas SFA content increased by
2.3%, compared with that found at day 0. Since triglycerides and phospholipids underwent
hydrolysis into free fatty acids during iced storage, free PUFA and MUFA possibly underwent
oxidation, to a greater extent than SFA. This result was evidenced by the decrease in PUFA and
MUFA during storage. Harris and Tall (1994b) reported that fish contain high levels of highly
unsaturated fatty acids and they are susceptible to oxidative rancidity.
Table 9. Changes in fatty acid profile of sardine muscle during iced storage
Fatty acids (g/100 g oil) Storage time (days)
0 6 15
C8:0 0.19 0.25 0.12
C11:0 0.14 0.17 0.22
C12:0 0.47 0.42 1.94
C14:0 5.96 5.48 5.06
C15:0 0.91 0.98 0.98
C16:0 28.48 28.14 27.14
C16:1 n-7 7.66 6.97 6.61
C17:0 1.41 1.68 1.60
C17:1 0.44 0.37 0.35
C18:0 6.96 7.87 8.28
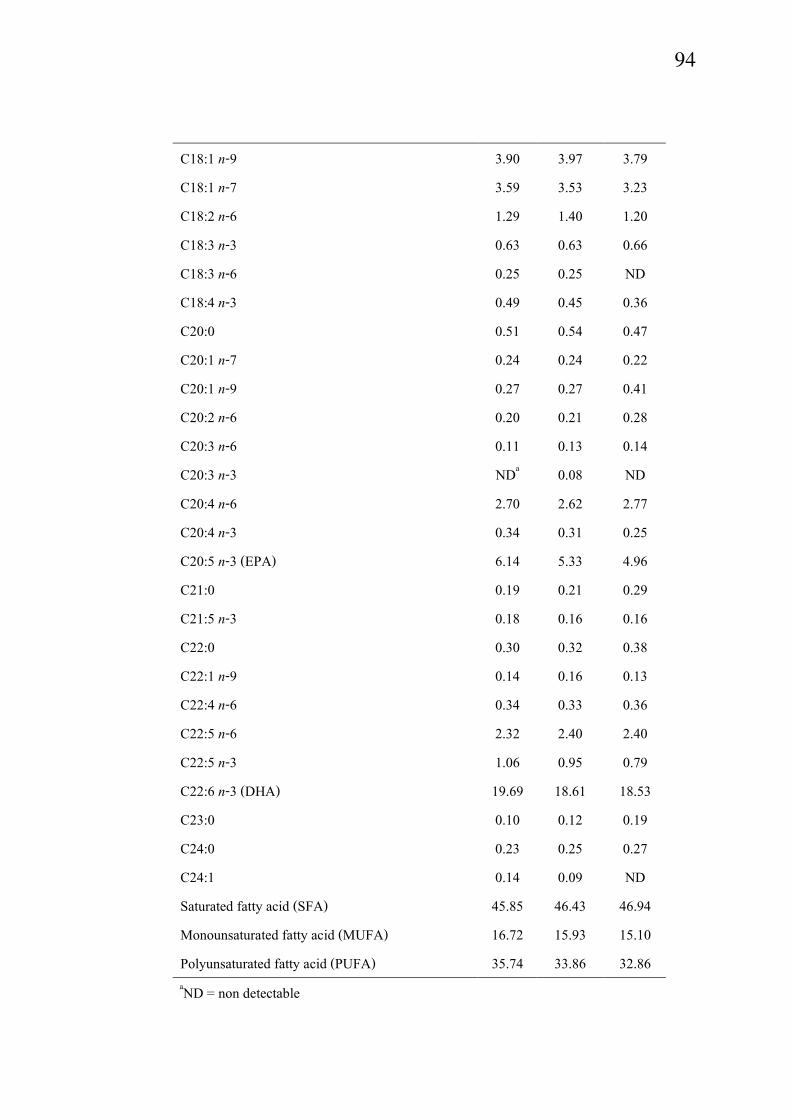
94
C18:1 n-9 3.90 3.97 3.79
C18:1 n-7 3.59 3.53 3.23
C18:2 n-6 1.29 1.40 1.20
C18:3 n-3 0.63 0.63 0.66
C18:3 n-6 0.25 0.25 ND
C18:4 n-3 0.49 0.45 0.36
C20:0
C20:1 n-7
0.51
0.24
0.54
0.24
0.47
0.22
C20:1 n-9 0.27 0.27 0.41
C20:2 n-6 0.20 0.21 0.28
C20:3 n-6 0.11 0.13 0.14
C20:3 n-3 NDa
0.08 ND
C20:4 n-6 2.70 2.62 2.77
C20:4 n-3 0.34 0.31 0.25
C20:5 n-3 (EPA) 6.14 5.33 4.96
C21:0
C21:5 n-3
0.19
0.18
0.21
0.16
0.29
0.16
C22:0 0.30 0.32 0.38
C22:1 n-9 0.14 0.16 0.13
C22:4 n-6 0.34 0.33 0.36
C22:5 n-6 2.32 2.40 2.40
C22:5 n-3 1.06 0.95 0.79
C22:6 n-3 (DHA) 19.69 18.61 18.53
C23:0 0.10 0.12 0.19
C24:0 0.23 0.25 0.27
C24:1 0.14 0.09 ND
Saturated fatty acid (SFA) 45.85 46.43 46.94
Monounsaturated fatty acid (MUFA) 16.72 15.93 15.10
Polyunsaturated fatty acid (PUFA) 35.74 33.86 32.86
aND = non detectable
95
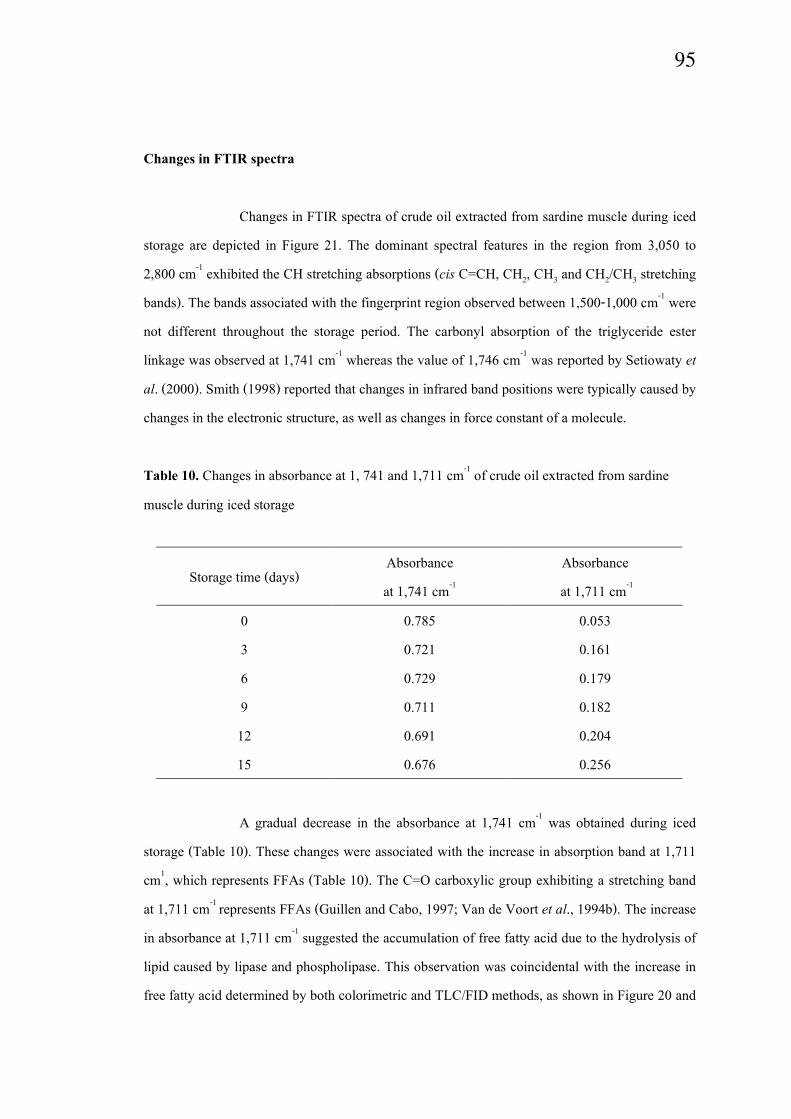
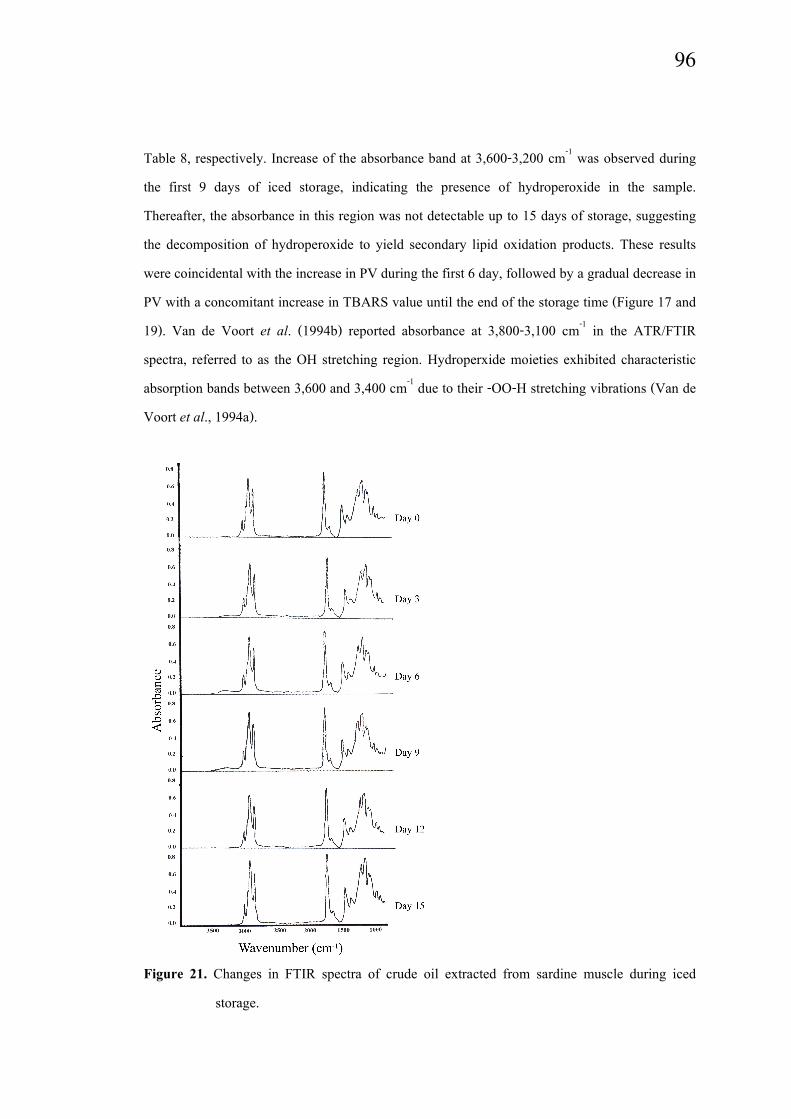
Changes in FTIR spectra
Changes in FTIR spectra of crude oil extracted from sardine muscle during iced
storage are depicted in Figure 21. The dominant spectral features in the region from 3,050 to
2,800 cm-1 exhibited the CH stretching absorptions (cis C=CH, CH2, CH3 and CH2/CH3 stretching
bands). The bands associated with the fingerprint region observed between 1,500-1,000 cm-1 were
not different throughout the storage period. The carbonyl absorption of the triglyceride ester
linkage was observed at 1,741 cm-1 whereas the value of 1,746 cm
-1 was reported by Setiowaty et
al. (2000). Smith (1998) reported that changes in infrared band positions were typically caused by
changes in the electronic structure, as well as changes in force constant of a molecule.
Table 10. Changes in absorbance at 1, 741 and 1,711 cm-1 of crude oil extracted from sardine
muscle during iced storage
Storage time (days)Absorbance
at 1,741 cm-1
Absorbance
at 1,711 cm-1
0 0.785 0.053
3 0.721 0.161
6 0.729 0.179
9 0.711 0.182
12 0.691 0.204
15 0.676 0.256
A gradual decrease in the absorbance at 1,741 cm-1 was obtained during iced
storage (Table 10). These changes were associated with the increase in absorption band at 1,711
cm1, which represents FFAs (Table 10). The C=O carboxylic group exhibiting a stretching band
at 1,711 cm-1 represents FFAs (Guillen and Cabo, 1997; Van de Voort et al., 1994b). The increase
in absorbance at 1,711 cm-1 suggested the accumulation of free fatty acid due to the hydrolysis of
lipid caused by lipase and phospholipase. This observation was coincidental with the increase in
free fatty acid determined by both colorimetric and TLC/FID methods, as shown in Figure 20 and
96
Table 8, respectively. Increase of the absorbance band at 3,600-3,200 cm-1 was observed during
the first 9 days of iced storage, indicating the presence of hydroperoxide in the sample.
Thereafter, the absorbance in this region was not detectable up to 15 days of storage, suggesting
the decomposition of hydroperoxide to yield secondary lipid oxidation products. These results
were coincidental with the increase in PV during the first 6 day, followed by a gradual decrease in
PV with a concomitant increase in TBARS value until the end of the storage time (Figure 17 and
19). Van de Voort et al. (1994b) reported absorbance at 3,800-3,100 cm-1 in the ATR/FTIR
spectra, referred to as the OH stretching region. Hydroperxide moieties exhibited characteristic
absorption bands between 3,600 and 3,400 cm-1 due to their -OO-H stretching vibrations (Van de
Voort et al., 1994a).
Figure 21. Changes in FTIR spectra of crude oil extracted from sardine muscle during iced
storage.

97
5.5 Conclusion
Whole sardine lipids were susceptible to the hydrolysis and oxidation during
iced storage. Hydroperoxides and conjugated dienes were generated and underwent some changes
to yield the secondary oxidation products, especially aldehydes. An increase in lipolysis,
indicated by free fatty acid formation, and decrease in triglycerides and phospholipids was
observed throughout the storage period. Those lipid changes showed a detrimental effect on
sardine meat quality and might be associated with the lowered heme protein removal during
washing process of surimi production.