Embed Size (px)
Citation preview
52
CHAPTER 3
CUK CONVERTER BASED MPPT SYSTEM USING
ADAPTIVE PAO ALGORITHM
3.1 INTRODUCTION
The power electronics interface, connected between a solar panel
and a load or battery bus, is a pulse width modulated DC-DC converter used
to extract maximum power from solar PV panel. The I-V characteristic curve
of photovoltaic generator is validated based on various DC-DC converters.
The nominal duty cycle of the main switch in the DC-DC converter is
adjusted to a value, so that the input resistance of the converter is equal to the
equivalent output resistance of the solar panel at the MPP. This approach
ensures maximum power transfer under all atmospheric conditions. Buck
converter cannot emulate smaller impedance than the load impedance, and
therefore, it does not reach values near the short circuit current of the PV
module. The input resistance of buck converter is given by R i = R / d2. Boost
converter cannot emulate greater impedances than the impedance of load, and
therefore, it does not reach values near the open circuit voltage of the PV
module. The value of input resistance is given by Ri = R (1-d) 2. Buck-Boost
derived converters are capable of sweeping the whole I-V curve of a module
in CCM, from open circuit voltage (Voc) to short-circuit current (Isc). The
input resistance of Buck-Boost converter is given by Ri = R (1-d) 2/ d2. But it
has discontinuous input current which creates greater harmonic distortion
factor in current. Hence, it is also not useful in practice. But Cuk converter is

53
capable of sweeping the whole I-V curve of a module in CCM, from open
circuit voltage (Voc) to short-circuit current (Isc). Hence, it is inferred that Cuk
converter is a good choice to track maximum power from solar PV module.
3.2 DESIGN CONSIDERATION OF CUK CONVERTER
The relation between input and output currents and voltage is given
in Equations 2.24 and 2.25.
The duty cycle of the Cuk converter under continuous conduction
mode is given by
d = (3.1)
V is the forward voltage drop across the diode (D). The maximum
duty cycle is given by Equation (3.2).
dmax =( )
(3.2)
The value of the inductor is selected based on the following
Equation
L1 = L2 = L = ( ) (3.3)
I is the peak-to-peak ripple current at the minimum input voltage
and fs-switching frequency. The value of C1 depends on RMS current which
is given by
Ic1(rms) = Iout *( )
(3.4)
54
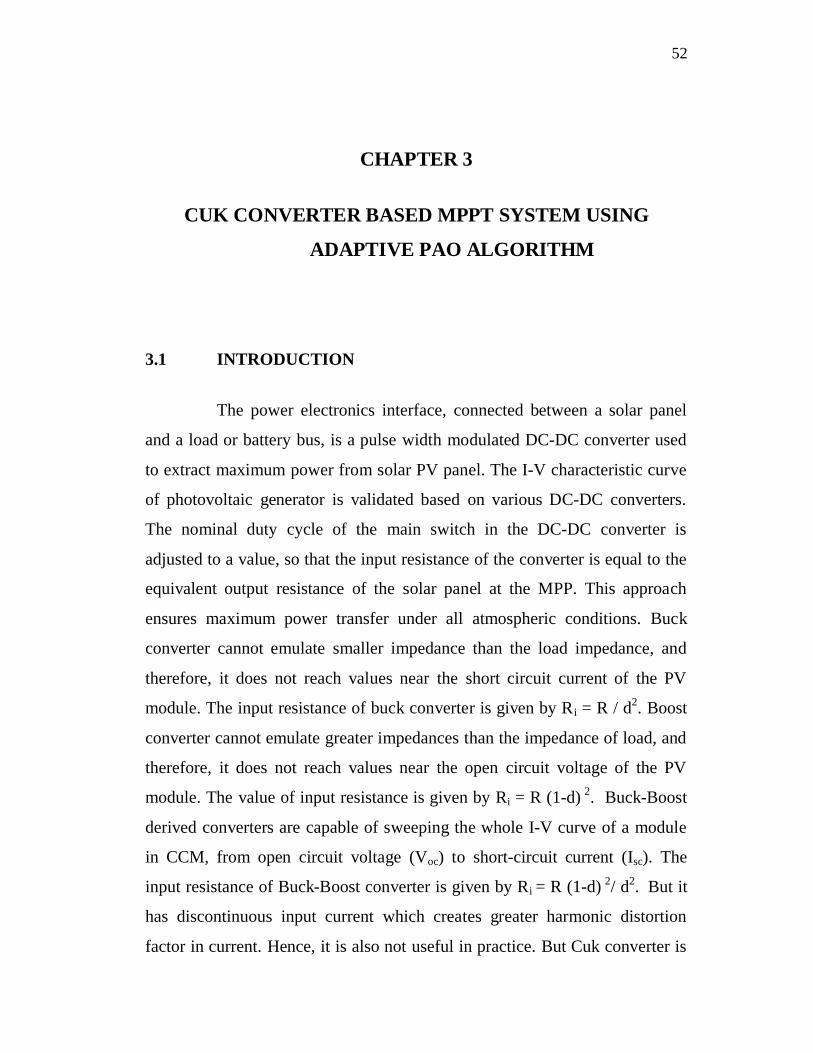
The voltage rating of capacitor C1 must be greater than the input
voltage. The ripple voltage on C1 is given by
Vc1 =( ) (3.5)
The parameters governing the selection of the MOSFET are the
minimum threshold voltage Vth(min), the on-resistance RDS (ON), gate-drain
charge QGD, and the maximum drain to source voltage, VDS(max). The peak
switch voltage is equal to Vin + Vout. The peak switch current is given by
IQ1(Peak) = IL1(PEAK) + IL2(PEAK) (3.6)
The RMS current is given by
I Q1(rms) = I out v + v ( )( )
( 3.7)
The total power dissipation for MOSFET includes conduction loss
(as shown in the first term of the above equation) and switching loss as shown
in the second term. IG is the gate drive current. The RDS(ON) value should be
selected at maximum operating junction temperature and is typically given in
the MOSFET datasheet.
Pswitch = (IQ1(rms)*RDS (ON) *dmax) + (Vin (min)+Vout) * I Q1(Peak * (QGD * fS )/ IG
(3.8)
The output diode must be selected to handle the peak current and
the reverse voltage. In a Cuk converter, the diode peak current is the same as
the switch peak current IQ1(peak). The minimum peak reverse voltage that the
diode must withstand is
VRD = Vin(max) + Vout (max) (3.9)
55
Similar to the boost converter, the average diode current is equal to
the output current. The power dissipation of the diode is equal to the output
current multiplied by the forward voltage drop of the diode. Schottky diodes
are recommended in order to minimize the efficiency loss.
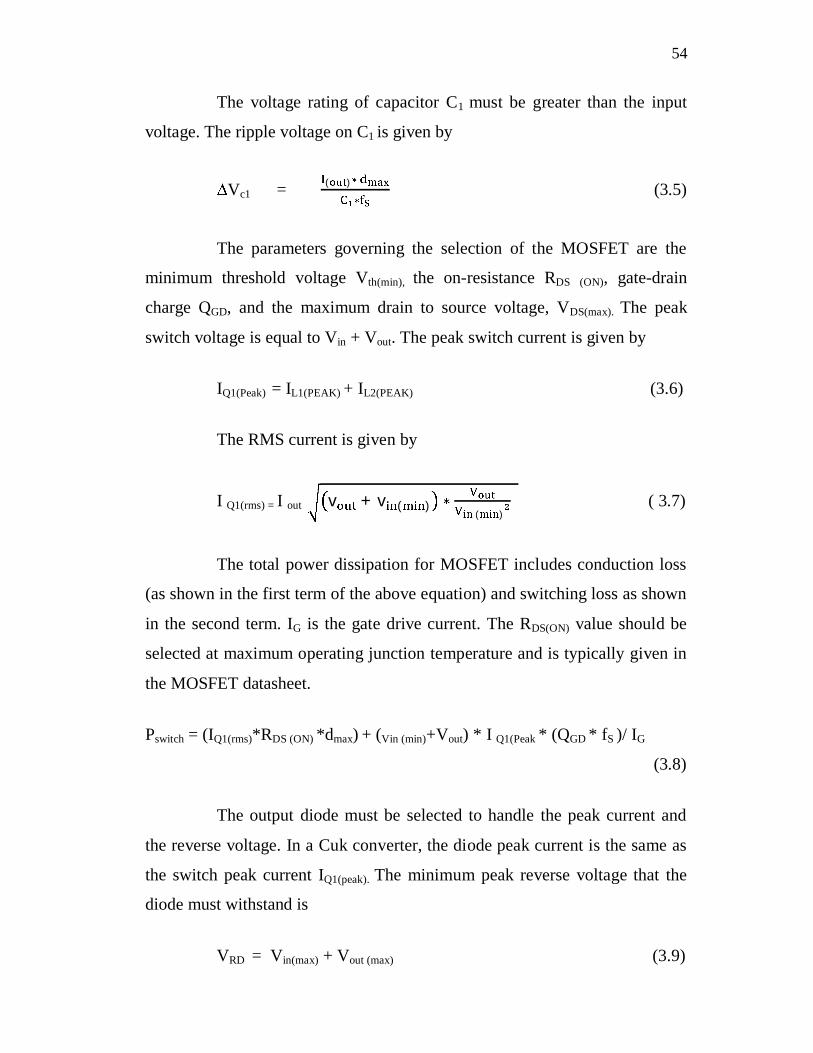
Table 3.1 shows the components used in simulation and hardware
setup for the power circuit.
Table 3.1 Specification of Cuk converter
Input inductor L1 500e-6 H
Filter inductor L2 500e-6H
Capacitor C1 220e-6F
Filter capacitor C2 220e-6F
Resistive load R
Switching frequency 25kHz
Switch : MOSFET IRF510
Optocoupler MCT2E
Diode MUR450
3.3 CUK CONVERTER-BASED MPPT FOR SOLAR PV
SYSTEM
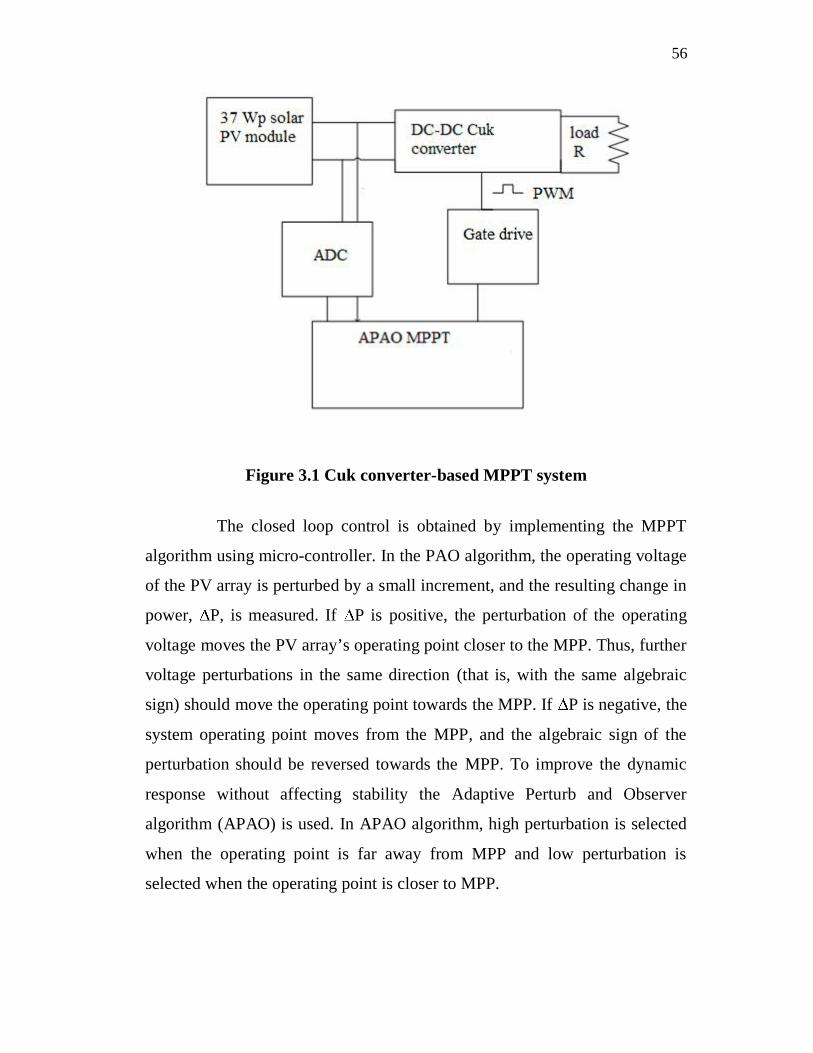
Figure 3.1 shows a Cuk converter-based MPPT system consisting
of solar PV module, Cuk converter (DC-DC) and load. Cuk converter is
capable of sweeping the I-V curve of solar PV module in CCM from open
circuit voltage to short-circuit current condition and, hence, Cuk converter is
suitable to be employed in designing the MPPT circuits.
56
Figure 3.1 Cuk converter-based MPPT system
The closed loop control is obtained by implementing the MPPT
algorithm using micro-controller. In the PAO algorithm, the operating voltage
of the PV array is perturbed by a small increment, and the resulting change in
power, P, is measured. If P is positive, the perturbation of the operating
voltage moves the PV array’s operating point closer to the MPP. Thus, further
voltage perturbations in the same direction (that is, with the same algebraic
sign) should move the operating point towards the MPP. If P is negative, the
system operating point moves from the MPP, and the algebraic sign of the
perturbation should be reversed towards the MPP. To improve the dynamic
response without affecting stability the Adaptive Perturb and Observer
algorithm (APAO) is used. In APAO algorithm, high perturbation is selected
when the operating point is far away from MPP and low perturbation is
selected when the operating point is closer to MPP.
57
3.4 SIMULATION RESULTS
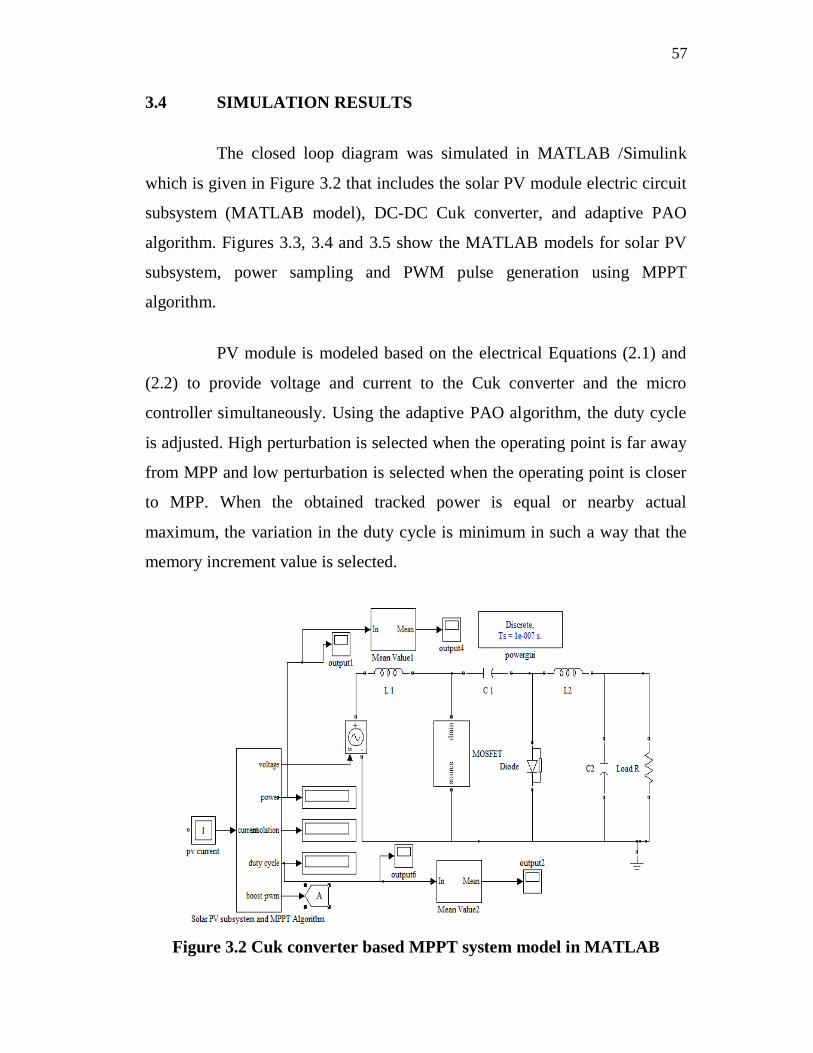
The closed loop diagram was simulated in MATLAB /Simulink
which is given in Figure 3.2 that includes the solar PV module electric circuit
subsystem (MATLAB model), DC-DC Cuk converter, and adaptive PAO
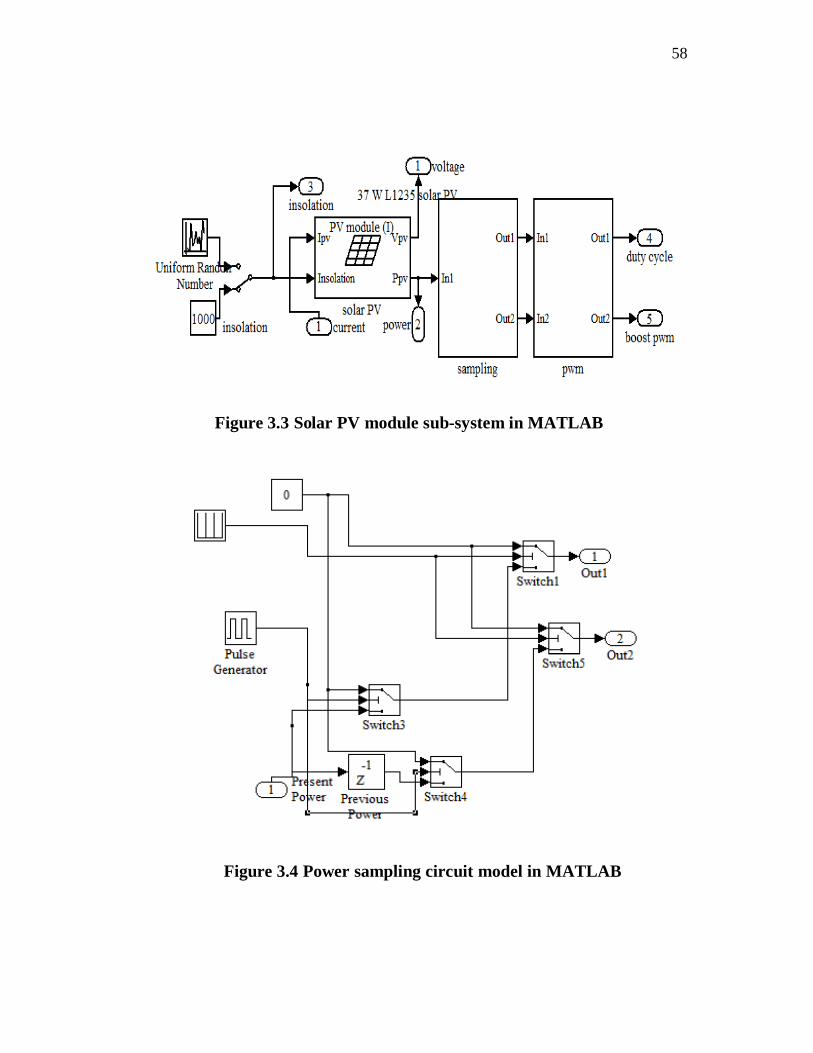
algorithm. Figures 3.3, 3.4 and 3.5 show the MATLAB models for solar PV
subsystem, power sampling and PWM pulse generation using MPPT
algorithm.
PV module is modeled based on the electrical Equations (2.1) and
(2.2) to provide voltage and current to the Cuk converter and the micro
controller simultaneously. Using the adaptive PAO algorithm, the duty cycle
is adjusted. High perturbation is selected when the operating point is far away
from MPP and low perturbation is selected when the operating point is closer
to MPP. When the obtained tracked power is equal or nearby actual
maximum, the variation in the duty cycle is minimum in such a way that the
memory increment value is selected.
Figure 3.2 Cuk converter based MPPT system model in MATLAB
58
Figure 3.3 Solar PV module sub-system in MATLAB
Figure 3.4 Power sampling circuit model in MATLAB
59
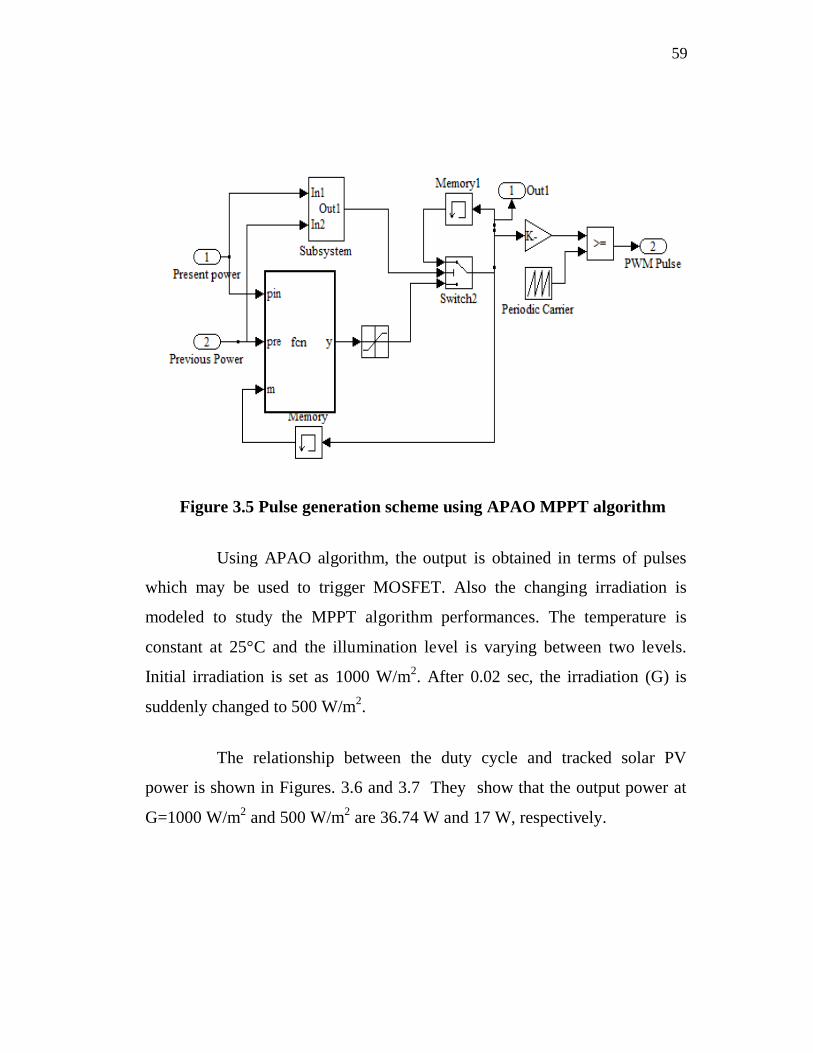
Figure 3.5 Pulse generation scheme using APAO MPPT algorithm
Using APAO algorithm, the output is obtained in terms of pulses
which may be used to trigger MOSFET. Also the changing irradiation is
modeled to study the MPPT algorithm performances. The temperature is
constant at 25°C and the illumination level is varying between two levels.
Initial irradiation is set as 1000 W/m2. After 0.02 sec, the irradiation (G) is
suddenly changed to 500 W/m2.
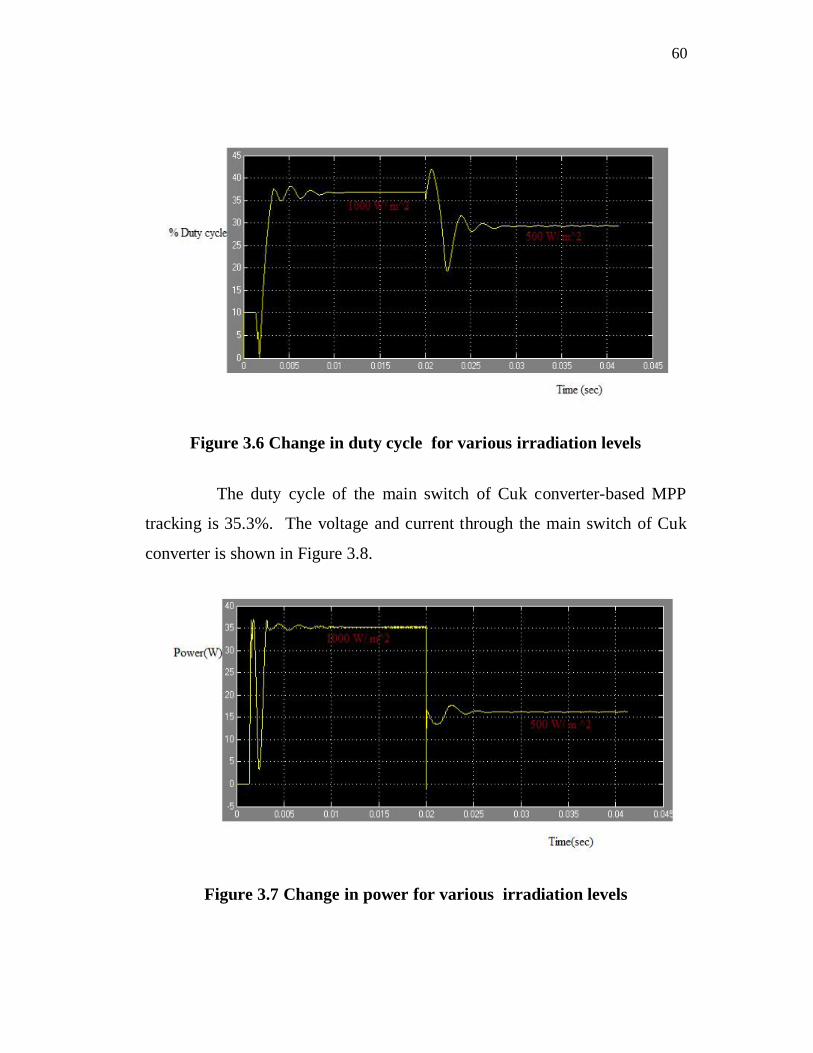
The relationship between the duty cycle and tracked solar PV
power is shown in Figures. 3.6 and 3.7 They show that the output power at
G=1000 W/m2 and 500 W/m2 are 36.74 W and 17 W, respectively.
60
Figure 3.6 Change in duty cycle for various irradiation levels
The duty cycle of the main switch of Cuk converter-based MPP
tracking is 35.3%. The voltage and current through the main switch of Cuk
converter is shown in Figure 3.8.
Figure 3.7 Change in power for various irradiation levels

61
Figure 3.8 Voltage and current through the switch S of Cuk converter
3.4.1 Study of Effects of Partial Shading
A shadow falling on a group of three cells will reduce the total
tracked power by two mechanisms: 1) by reducing the energy input to the
cell, and 2) by increasing energy losses in the shaded cells. Problems become
more serious when shaded cells get reverse-biased. A group of cells under
full illumination is connected in series with another group of cells under
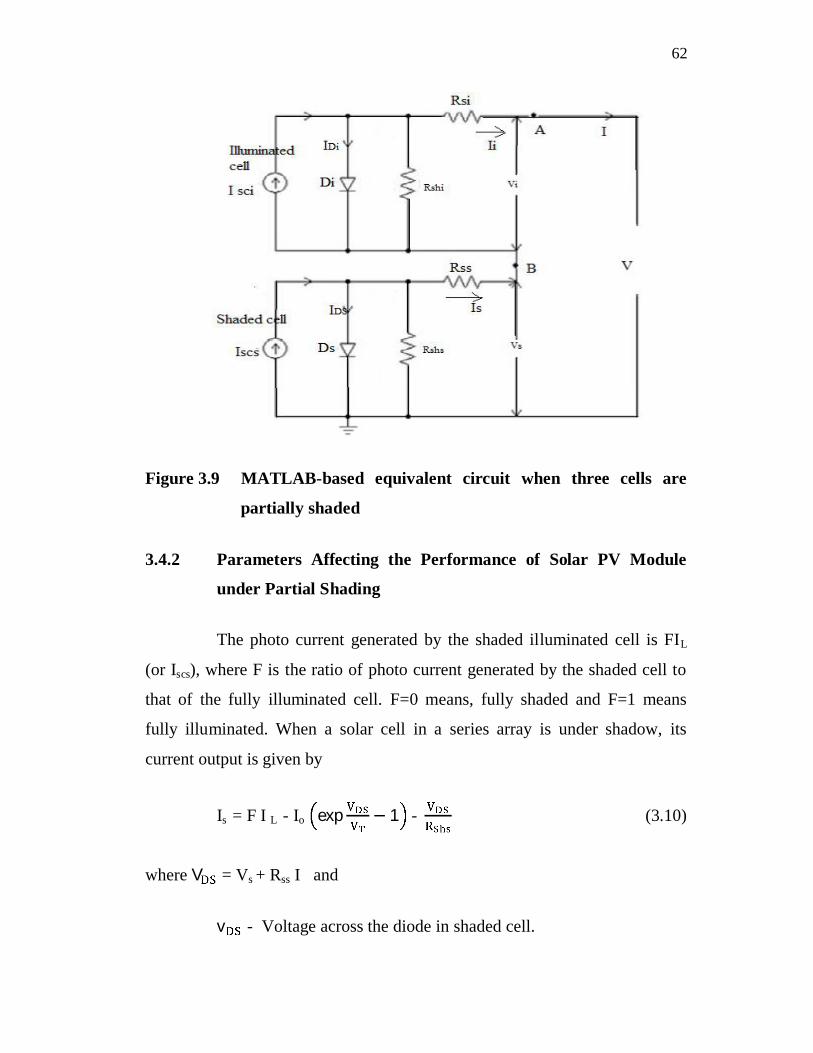
shaded illumination. Figure 3.9 shows the MATLAB-based equivalent circuit
of solar module under partial shaded condition. The photon current of fully
illuminated cells Isci is high compared with that of the shaded illuminated cells
Iscs. If the module current I < Iscs, diode Ds is forward-biased and there is no
risk for the shaded cells. But if I > Iscs, then the diode current IDs = Iscs -I
flows through the diode in the reverse direction. Reverse-biased diode Ds
offers high resistance which will consume power and significantly reduce the
load current (I) itself. The point B will assume negative potential. If the
difference in illumination levels is high, Ds may get damaged due to
overheating.
62
Figure 3.9 MATLAB-based equivalent circuit when three cells are
partially shaded
3.4.2 Parameters Affecting the Performance of Solar PV Module
under Partial Shading
The photo current generated by the shaded illuminated cell is FIL
(or Iscs), where F is the ratio of photo current generated by the shaded cell to
that of the fully illuminated cell. F=0 means, fully shaded and F=1 means
fully illuminated. When a solar cell in a series array is under shadow, its
current output is given by
Is = F I L - Io exp 1 - (3.10)
where V = Vs + Rss I and
v - Voltage across the diode in shaded cell.

63
Similarly, the current through the illuminated cell is given by
Ii = I L - Io exp 1 - (3.11)
where V = Vs + Rsi Ii and
V - Voltage across diode in illuminated solar cell
As the shaded and illuminated cells are connected in a series, the
same current is forced to flow through both. Hence Is and Ii are replaced by
the same current I. Therefore,
I = F IL - Io exp 1 - (3.12)
I = IL - Io exp 1 - (3.13)
As the value of F (illumination) decreases from 1 to 0, exp
tends to reach zero. Hence, the equation can be simplified as
I = F I L - Io - (3.14)
The voltage across the shaded cell Vs is given by
Vs = (F IL – I ) RShs – I Rss (3.15)
In the above equation, Io Rshs is neglected in comparison with larger
terms. The total module output voltage is the sum of voltages across each cell
operating at the same current I. So the module consists of 36 identical series
connected cells, the output voltage can be expressed
64
V = V + V (3.16)
The power dissipated by the shaded cell is obtained by
P= I * Vs = I * (F IL – I ) Rshs – I Rss (3.17)
Power dissipation in the shaded cell may be substantial leading to
increase in its temperature. Due to increased temperature, the cell current gets
concentrated in an increasingly small region of the cell, producing the hot
spot. The power extracted from the solar cell is reduced when the cells are
shaded.
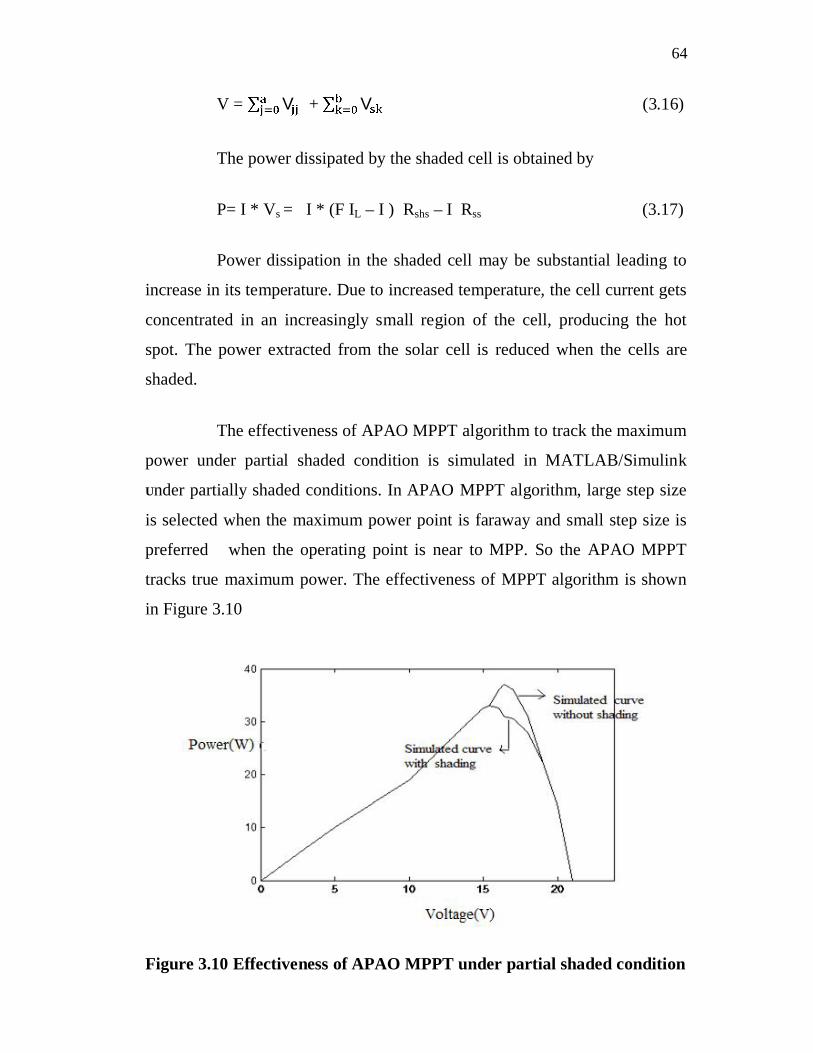
The effectiveness of APAO MPPT algorithm to track the maximum
power under partial shaded condition is simulated in MATLAB/Simulink
Under partially shaded conditions. In APAO MPPT algorithm, large step size
is selected when the maximum power point is faraway and small step size is
preferred when the operating point is near to MPP. So the APAO MPPT
tracks true maximum power. The effectiveness of MPPT algorithm is shown
in Figure 3.10
Figure 3.10 Effectiveness of APAO MPPT under partial shaded condition
65
The APAO MPPT tracks maximum power of 37 W under unshaded
condition with a voltage of 16.4 V. The tracked power from the solar PV
module is lowered when solar cells are shaded. The voltage corresponding to
maximum power under shaded condition is 15.6 V with the true maximum
power of 33 W. The implemented MPPT algorithm effectively tracks
maximum power from solar PV module under shaded and unshaded
conditions.
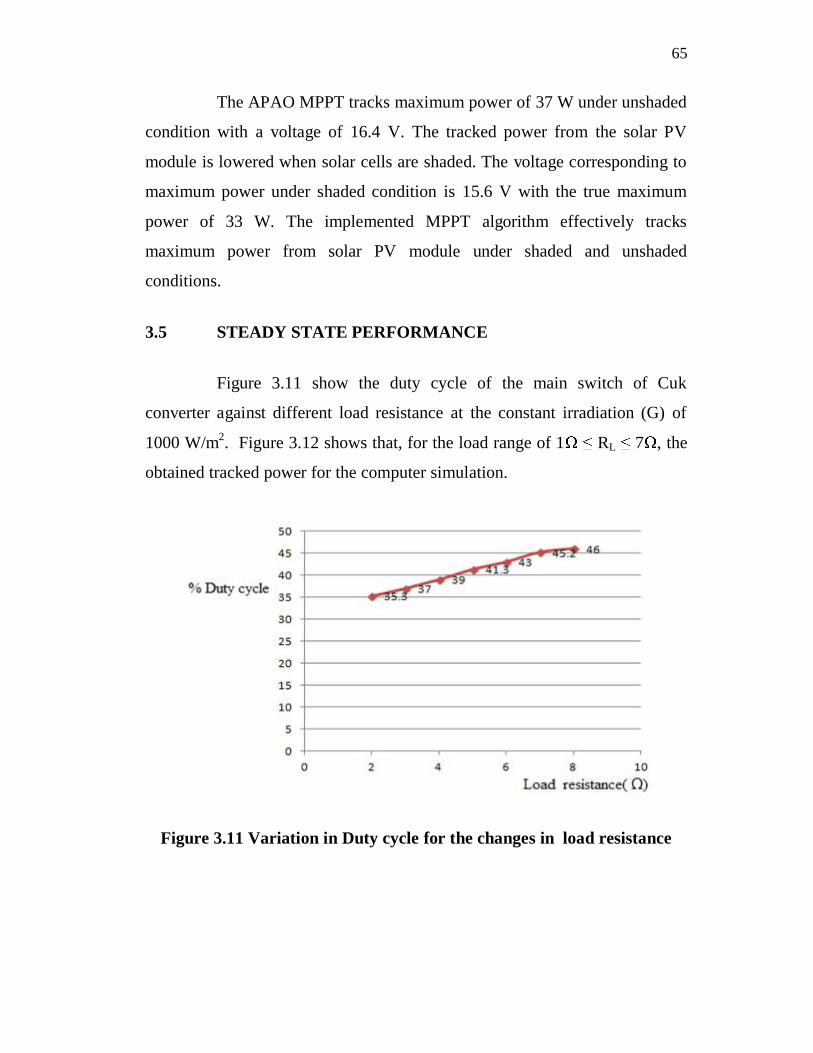
3.5 STEADY STATE PERFORMANCE
Figure 3.11 show the duty cycle of the main switch of Cuk
converter against different load resistance at the constant irradiation (G) of
1000 W/m2. Figure 3.12 shows that, for the load range of 1 RL 7 , the
obtained tracked power for the computer simulation.
Figure 3.11 Variation in Duty cycle for the changes in load resistance
66
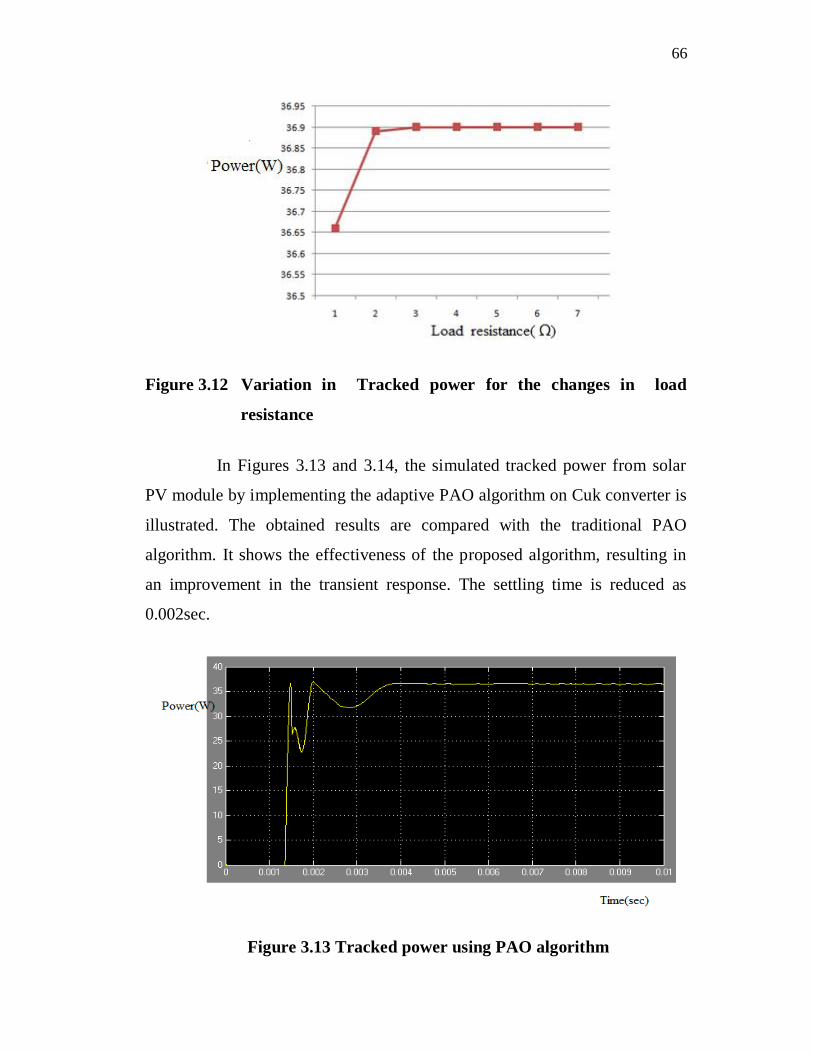
Figure 3.12 Variation in Tracked power for the changes in load
resistance
In Figures 3.13 and 3.14, the simulated tracked power from solar
PV module by implementing the adaptive PAO algorithm on Cuk converter is
illustrated. The obtained results are compared with the traditional PAO
algorithm. It shows the effectiveness of the proposed algorithm, resulting in
an improvement in the transient response. The settling time is reduced as
0.002sec.
Figure 3.13 Tracked power using PAO algorithm
67
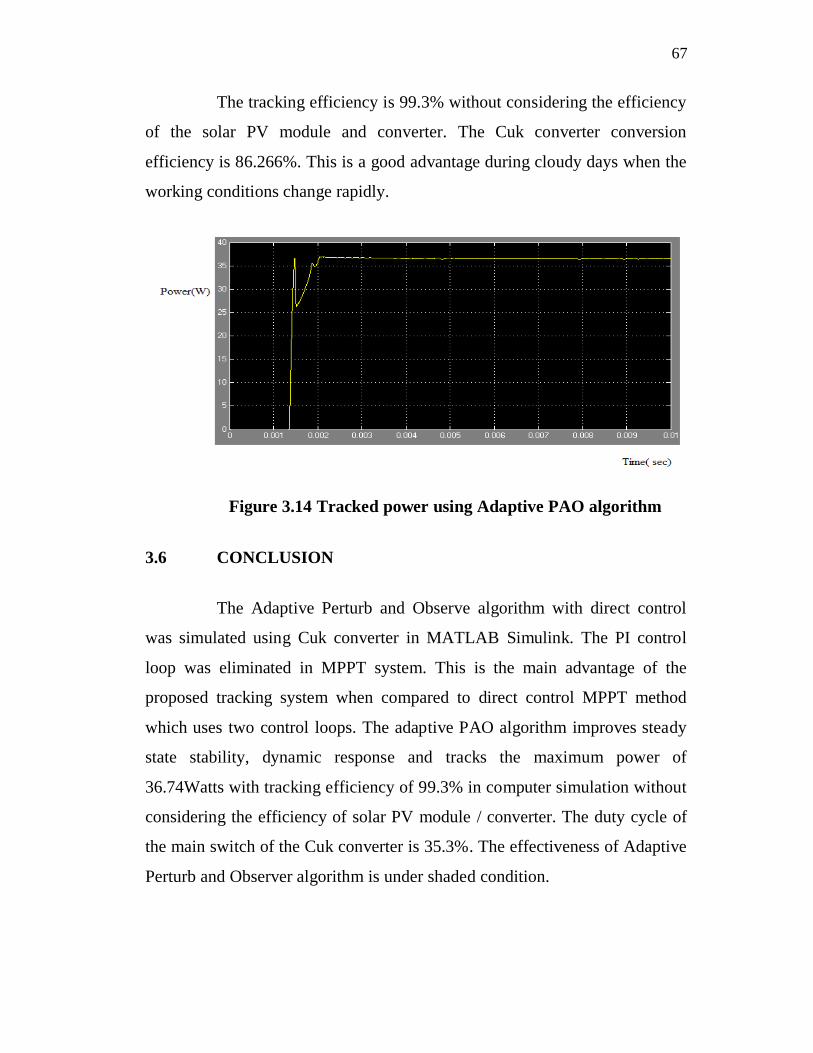
The tracking efficiency is 99.3% without considering the efficiency
of the solar PV module and converter. The Cuk converter conversion
efficiency is 86.266%. This is a good advantage during cloudy days when the
working conditions change rapidly.
Figure 3.14 Tracked power using Adaptive PAO algorithm
3.6 CONCLUSION
The Adaptive Perturb and Observe algorithm with direct control
was simulated using Cuk converter in MATLAB Simulink. The PI control
loop was eliminated in MPPT system. This is the main advantage of the
proposed tracking system when compared to direct control MPPT method
which uses two control loops. The adaptive PAO algorithm improves steady
state stability, dynamic response and tracks the maximum power of
36.74Watts with tracking efficiency of 99.3% in computer simulation without
considering the efficiency of solar PV module / converter. The duty cycle of
the main switch of the Cuk converter is 35.3%. The effectiveness of Adaptive
Perturb and Observer algorithm is under shaded condition.