Embed Size (px)
Citation preview

CHAPTER 3
AGRICULTURAL AND DAIRY
SCENARIO IN GUJARAT

3. Agricultural and dairy scenario in Gujarat
3-1
Crop and livestock mixed farming are essential characteristics of Indian agriculture, pursued
simultaneously with each complimenting other. Structurally, both are pursued to maximize utility
of the farmer. The majority of the farmers, who are marginal and small, generally rear one or two
milch animals, mainly using crop residues, by-products and family labour especially from the
women and children (George 1996). In short, dairy activities are directly or indirectly inked with
agriculture and crop production in the country. Therefore, it is pertinent to understand the trends
and development in agricultural sector and its implications on dairy sector.
3A. AGRICULTURAL SITUATION IN GUJARAT
This section intends to provide information about the state of Gujarat and the study area with a
view to relating the focus of the study with the associated features of the region. The regional
characteristics become important as it helps in linking the different observations of the study with
that of the macro and regional features and thus facilitate deeper understanding of the main issues.
Looking from a different perspective, a discussion on the land use pattern, agriculture, crop
husbandry and irrigation system would always generate additional insights into exploring
potential for commercial dairying and the background under which such a system could be firmed
up. Therefore, the relevance on such a discussion emanates from various dimensions. This has
been the motive in introducing an analysis into this subject. The scope of analysis is limited to
capturing overall developments and understanding the baseline situations in agriculture and their
possible linking with the dairy sub-sector. Hierarchy of analysis has been presented in order of
spatial importance of state, region and the districts.
3A.1 Regions of the state
The regions of the state are quite well defined. According to one study by the Agro Economic
Research Centre, Vallabh Vidyanagar there are five broad regions in the state-South Gujarat,
Central Gujarat, North Gujarat, Kachchh Region and the Saurashtra Region (Dutta & Bhaiya
2004). As these regions appear quite common with our understanding of the state, they are
accepted as such. However, the district of Kachchh itself constitutes a region, and therefore for
ease of understanding and compilation of regional data the hitherto conspicuous Kachchh region

3. Agricultural and dairy scenario in Gujarat
3-2
is clubbed with the Saurashtra region. The box below defined the various sub-regions of the state
as per the literature survey.
Table 3.1: Region-wise districts of Gujarat
South Gujarat The Dangs, Surat, Bharuch, Valsad
Central Gujarat Vadodara, Kheda, Panchmahal
North Gujarat Ahmedabad, Gandhinagar, Banaskantha, Mehsana
Kachchh Region Kachchh
Saurashtra Region Jamnagar, Junagadh, Rajkot, Bhavnagar, Amreli, Surendranagar
3A.2 Land use
Use of lands among different uses set a limit for productive use of valuable land asset. There are
some standard classifications by which the land use system is characterized. Generally, net
cropped area is that portion of the geographic area that is put to crop use at least in one of the
seasons. The extent of arable land depends on topography, soil characteristics, irrigation, forest
area, fallow area and area not available for cultivation. A gradual change in net cropped area
could signify a major change in the land use for agriculture purpose. Conversely, stagnancy would
limit its further use, due to various reasons. As the focus of the investigation is to relate dairy
farming with agriculture, the scope is restricted to proportion of cultivated area and their historical
trends. It is this trend that generally sets a limit to growth in area coverage - technically, termed as
assessing scope for bringing additional area under crop cultivation.
Historically, it is found that proportion of net area cultivated to total geographical area has
remained at a level of around 50% over a period of last 40 years. That is quite intriguing. On a
simple understanding, this data brings to fore the potential for bringing additional area under crop
farming. Probably, the scope has perhaps been exploited. To articulate this point, during 1960s
and 1970s about half of the land masses could be cultivated, even today this land mass is
unchanged (Table 3.2). Therefore, the state does not show incremental scope for further
appreciation in crop lands. This situation causes a perpetual decline in per capita availability of
net area sown, from a point of 0.58 hectare in the 1960s to only 0.19 hectare in 2000s.

3. Agricultural and dairy scenario in Gujarat
3-3
A stagnancy of the net arable lands could be a subject of detailed investigation for the fact that
there have been greater efforts on the part of the government for watershed developments for
improving soil characteristics, bringing uncultivated lands into cultivation and improving
productivity of lands. The examination of time series data somehow fails to bring out this point. It
is possible that there have been improvements in the net acreage, but it is also possible that some
agricultural lands might have been converted into non-agricultural uses. These forces might have
taken the total net acreage to a point of near stagnancy in the net cultivated area.
Different regions of the state have however exhibited some differences in the proportion net area
irrigated. In the central and northern regions the net area cultivated formed in excess of 60% while
the regions of Saurashtra and Southern territory of the state had less than 50% of the geographical
area under cultivation. Per capita net cultivated area has been one of the lowest in the central
region, which is another noteworthy characteristic of the land use pattern in the state.
The cropping intensity which is a measure of how intensive is the area under cultivation has
remained at a level of 110% to 115% over the years. This is yet another feature of agricultural
constraint, wherein it is found that the extent of multiple cropped areas has remained unchanged.
Only the northern region of the state showed a relative improvement in the cropping intensity of
124%. The limited analysis therefore showed that agriculture in the state has somehow been
settled at a level wherein additional improvement in the increase in gross acreage is constrained.
Though it is not the focus of the present research to unravel the causes of such situations, it is
apparent that the nature of growth and development in the state would revolve round the crop
diversifications, value addition and linking crops with the markets. It may not be unfounded that
under such condition, crop diversification into horticulture, food crops and also cash crops would
be the logical strategy for promotion of agricultural growth.
If the attention is turned towards the districts, it is found that Mahesana, Gandhinagar, Kheda and
Amreli have a relatively higher geographical area under crop farming (around 70%). As usual, the
district of Kachchh has one of the lowest areas under crop farming. The position of Anand is
around 50%, which is on the lower end of the distribution. As a result of low coverage under crop
farming the per capita net area sown is one of the lowest in the district (0.08 ha), a factor which

3. Agricultural and dairy scenario in Gujarat
3-4
may have influence in crop as well as other diversification into dairy farming. It is in this context
pertinent to mention that the district of Anand has relatively high cropping intensity of 122%, a
level which could be attained probably due to better irrigation coverage (discussed later). The
other districts which showed higher cropping intensity are Banas Kantha and Mahesana.
Table 3.2: Land use classification
(area in ’00 hectares)
Year Geo. Area
(sq. Km.)
Net
area
sown
% Net
area
sown
Area
sown
more
than once
Total
cropped
area
Per
capita net
area
sown
Cropping
intensity
Gujarat
1960-61 187115 93970 50.2 3706 97676 0.58 103.94
1970-71 195984 97130 49.6 7789 104919 0.47 108.02
1980-81 196024 95765 48.9 11694 107459 0.36 112.21
1990-91 196024 93502 47.7 12846 106348 0.24 113.74
1991-92 196024 92471 47.2 12106 104577 0.22 113.09
1992-93 196024 96379 49.2 14203 110582 0.23 114.74
1993-94 196024 94470 48.2 12819 107289 0.22 113.57
1994-95 196024 96653 49.3 15798 112451 0.22 116.35
1995-96 196024 96116 49.0 13284 109400 0.21 113.82
1996-97 196024 95995 49.0 14013 110008 0.21 114.60
1997-98 196024 96741 49.4 14826 111567 0.23 115.33
1998-99 196024 96674 49.3 14764 111438 0.2 115.27
1999-00 196024 94429 48.2 12020 106449 0.23 112.73
2000-01 196024 94333 48.1 10067 104400 0.19 110.67
2001-02 196024 96217 49.1 11119 107336 0.19 111.56
Region (2001-02)
Central 23575 14520 61.6 1546 16066 0.13 110.65
North 38511 25728 66.8 6192 31920 0.18 124.07
Saurashtra 109991 44167 40.2 2337 46504 0.29 105.29
South 23947 11802 49.3 1044 12846 0.12 108.85
Source: Statistical Abstract, Gujarat State (2005)

3. Agricultural and dairy scenario in Gujarat
3-5
Table 3.3: District-wise land use classification (2001-02)
(area in ’00 hectares)
Year Geo. Area
(sq. Km.)
Net
area
sown
% Net
area
sown
Area
sown
more
than once
Total
cropped
area
Per
capita net
area
sown
Cropping
intensity
Vadodara 7549 5203 68.9 438 5641 0.14 108.42
Kheda 4219 3088 73.2 501 3589 0.15 116.22
Anand 2941 1551 52.7 356 1907 0.08 122.95
Panch Mahals 5220 2710 51.9 136 2846 0.13 105.02
Dohad 3646 1968 54.0 115 2083 0.12 105.84
Ahmedabad 8087 5056 62.5 367 5423 0.09 107.26
Banas Kantha 10757 7364 68.5 3001 10365 0.29 140.75
Gandhinagar 2163 1597 73.8 351 1948 0.12 121.98
Mahesana 4384 3464 79.0 1107 4571 0.19 131.96
Patan 5730 3866 67.5 645 4511 0.33 116.68
Sabar Kantha 7390 4381 59.3 721 5102 0.21 116.46
Amreli 7397 5407 73.1 108 5515 0.39 102.00
Bhavnagar 9981 5474 54.8 268 5742 0.22 104.90
Jamnagar 14125 5997 42.5 260 6257 0.31 104.34
Junagadh 8846 5238 59.2 784 6022 0.21 114.97
Porbandar 2298 1122 48.8 142 1264 0.21 112.66
Kachchh 45652 6689 14.7 319 7008 0.42 104.77
Rajkot 11203 7378 65.9 181 7559 0.23 102.45
Surendranagar 10489 6862 65.4 275 7137 0.45 104.01
Bharuch 6527 3311 50.7 39 3350 0.24 101.18
Narmada 2755 1088 39.5 13 1101 0.21 101.19
Valsad 3035 1614 53.2 166 1780 0.11 110.29
Navsari 2209 1470 66.5 231 1701 0.12 115.71
The Dangs 1764 NA NA NA NA NA NA
Surat 7657 4319 56.4 595 4914 0.09 113.78
State 196024 96217 49.1 11119 107336 0.19 111.56
Source: Statistical Abstract, Gujarat State (2005)
3A.3 Irrigated area
About one-third of the gross cultivated area receives irrigation from some sources. Over a span of
last 20 years, this proportion has increased from 22% to 33% (Table 3.4). In absolute term, about
12 lakh hectares of additional area has been brought under irrigation. This appears impressive as
there has not much improvement in gross cropped area during the same period, while irrigation
3. Agricultural and dairy scenario in Gujarat
3-6
coverage has been expanded. It is difficult to reconcile this finding, as in normal condition
increase in irrigation coverage leads to more intensive crop farming. There is of course some clue
to understand this as the irrigation intensity which is a direct measure of gross irrigated area over
net irrigated area appears modest at 119%, suggesting only one-fifth of the irrigated area receive
irrigation for multiple cropping. It is also possible that the expansion of irrigation area benefit
more to the field crops in providing supplementary irrigation during monsoon season rather than
providing irrigation in rabi season. Another explanation could be that the irrigation coverage
might have been expanded to the plantation or horticulture crops, which generally do not form
basis for reckoning in gross cropped area. The correlation between cropping intensity and
irrigation intensity is moderate at 0.45, which partially supports the hypothesis that the expanded
area under irrigation is for protective irrigation during periods of monsoon failure or
environmental stress.
According to Patel (2006), more than two-thirds of the net cropped areas of the state receive
average rainfall of less than 750 mm. For the country, the comparative figure is only 34%. Only
8% of the net copped areas of the state receive sufficient rainfall. It is this rainfall scarcity which
explains why the increase in irrigated areas could not supplement double cropped area—instead,
the role of stabilizing agriculture assumes importance.
The North Gujarat region is better irrigated in relation to other regions. However, the regions of
Central and the South are relatively moderate in irrigation availability with around 38-40% of the
gross cropped area receiving irrigation. On the whole, the constraint in irrigation water for crop
farming appears to be important in the context of undertaking crop diversification based on
resource compatibility of the region.
The district of Anand has 75% of the gross cropped area under irrigation, highest in the state
followed by Gandhinagar with 65% irrigation coverage. The districts of Navsari, Surat and Kheda
have moderate coverage with more than half of the gross cultivated area receiving irrigation. Now
if irrigation intensity and cropping intensity are compared across the districts the case of weak
relationship appears more prominent (Table 3.5). Somehow, the macro level data cannot provide
further insights into this issue but it can be inferred that with the availability of irrigation,

3. Agricultural and dairy scenario in Gujarat
3-7
sustainability of at least the monsoon crops have improved in the state. Patel (2006) has come out
with a similar observation in which it is observed that ―crop production has been stabilized
through provision of supplementary irrigation, as & when required, during critical stages of crop
growth‖
Table 3.4: Gross irrigated area and intensity of irrigation (Area in 00 ha)
Year Gross cropped
area( GCA)
Gross
Irrigated
area (GIA)
GIA as %
GCA
Net irrigated
area
Irrigation
Intensity
(%)
Gujarat
1980-81 107459 23344 21.72 20026 116.57
1985-86 104390 23812 22.81 20395 116.75
1990-91 106348 29105 27.37 24376 119.40
1992-93 110582 32269 29.18 26425 122.12
1993-94 107289 30869 28.77 25405 121.51
1994-95 112451 36548 32.50 30021 121.74
1995-96 109955 34994 31.83 28922 120.99
1996-97 110560 36424 32.95 30418 119.74
1997-98 112130 37798 33.71 30585 123.58
1998-98 112001 38406 34.29 30824 124.60
1999-00 107017 36267 33.89 29795 121.72
2000-01 104970 33421 31.84 28060 119.11
2001-02 107910 35728 33.11 29944 119.32
Region
Central 16066 6176 38.44 5055 122.18
North 31920 13739 43.04 10989 125.03
Saurashtra 46504 10592 22.78 9253 114.47
South 13420 5221 38.90 4647 112.35
Source: Statistical Abstract, Gujarat State (2005)
Table 3.5: District wise gross irrigated area and intensity of irrigation (Area in 00 ha)
District
Gross
cropped
area
(GCA)
Gross
Irrigated
area (GIA)
GCA as
% GIA
Net
irrigated
area
Irrigation
Intensity
(%)
Cropping
intensity
(%)
Vadodara 5641 2358 41.80 1969 119.76 108.42
Kheda 3589 1891 52.69 1513 124.98 116.22
Anand 1907 1439 75.46 1191 120.82 122.25
Panch Mahals 2846 403 14.16 326 123.62 105.02
Dohad 2083 85 4.08 56 151.79 105.84
Ahmedabad 5423 1629 30.04 1324 123.04 107.26
Banas 10365 4900 47.27 4021 121.86 108.42

3. Agricultural and dairy scenario in Gujarat
3-8
District
Gross
cropped
area
(GCA)
Gross
Irrigated
area (GIA)
GCA as
% GIA
Net
irrigated
area
Irrigation
Intensity
(%)
Cropping
intensity
(%)
Gandhinagar 1948 1284 65.91 895 143.46 121.98
Mahesana 4571 2652 58.02 2065 128.43 131.96
Patan 4511 1456 32.28 1250 116.48 116.68
Sabar Kantha 5102 1818 35.63 1434 126.78 116.46
Amreli 5515 1010 18.31 919 109.90 102
Bahavnagar 5742 1707 29.73 1509 113.12 104.9
Jamnagar 6257 875 13.98 715 122.38 104.34
Junagadh 6022 1545 25.66 1231 125.51 114.97
Porbandar 1264 194 15.35 158 122.78 112.66
Kutch 7008 1989 28.38 1714 116.04 104.77
Rajkot 7559 1984 26.25 1832 108.30 102.45
Surendranagar 7137 1288 18.05 1175 109.62 104.01
Bharuch 3350 927 27.67 888 104.39 101.18
Narmada 1101 183 16.62 175 104.57 101.19
Valsad 1780 503 28.26 447 112.53 110.29
Navsari 1701 1006 59.14 867 116.03 115.71
The Dangs 574 5 NA 4 125.00 NA
Surat 4914 2597 52.85 2266 114.61 113.78
Source: Statistical Abstract, Gujarat State (2005)
3A.4 Cropping pattern
A good historical account of cropping pattern and growth of crop production of the state has been
provided through some secondary literature (Patel 2006) covering the scenario from post
independence to as late as early 2000s. It was therefore prudent to analyze the same in the context
of present research rather than rediscovering the subject de novo. The motivation for undertaking
a discussion on the cropping pattern and crop productivity originates from the fact that
agricultural developments and their changes are central to understand the likely changes in the
dairy and livestock sector. Moreover, crop production is the core issue in any agrarian society and
therefore the developments in this sector would have a direct bearing on the dairy sector. With
this premise in the background a comprehensive discussion is initiated in other components of
agricultural changes.
The study of cropping pattern in the state is diversified in the sense that there are certain
discernible changes that offer interesting reading. To begin with, area under food grain used to
occupy around 50% of the total cropped area until mid 1980s; subsequently started declining and

3. Agricultural and dairy scenario in Gujarat
3-9
now stands at less than one- third. The non-food grain crops, conversely, occupied a minor share
in the post independence period, but consistently gained importance and now involves nearly 70%
of the total cropped area. Gujarat is one of the two states in India where in non-foodgrain crops
dominate the agricultural economy, the other being Kerala (Patel 2006). From the point of view
this change, it is found that the crop profile is more diversified towards cash crops, notable being
groundnut, castor seeds, sesamum, cotton etc. The cereal crops which were the most significant
crops in the 1950s, have given way to non- food crops. Proportionate area under Bajra and Jowar
has declined significantly, while area under maize and wheat have either increased or maintained
at a constant level. A detailed account on the changes in the cropping pattern is provided through
Table 3.6.
Table 3.6: Cropping pattern in Gujarat (%)
Crops 1950-53 1960-63 1970-73 1980-83 1990-93 1998-2001
Rice 5.51 5.49 4.83 5.31 6.15 5.81
Wheat 3.79 3.82 4.93 5.92 5.45 4.42
Bajra 23.01 14.28 18.59 13.06 13.39 8.86
Jowar 18.46 13.17 11.19 10.08 5.90 1.86
Maize 2.14 2.25 2.56 2.94 3.53 3.60
Cereals 57.04 41.69 44.31 40.21 35.71 24.90
Tur 3.49 0.90 0.89 2.85 3.99 3.13
All pulses 5.25 5.30 4.46 7.86 8.71 6.59
All foodgrains 62.29 46.99 48.77 48.07 44.42 31.49
Groundnut 8.74 22.07 18.22 19.76 17.71 16.57
Castorseeds 0.73 0.67 0.60 1.78 3.31 3.13
Rape & mustard 0.34 0.36 0.54 1.77 3.24 2.55
Sesamum 2.62 1.04 1.14 1.22 2.34 2.71
All Oilseeds 12.43 24.14 20.65 24.62 26.81 25.33
Cotton 13.75 17.56 19.43 14.04 10.70 14.49
Sugarcane - - 0.40 1.02 1.62 1.73
Other non-foodgrain crops 11.53 11.31 11.15 13.23 18.07 26.96
All non-foodgrain crops 37.71 53.01 51.23 51.93 55.58 68.51
All crops 100.00 100.00 100.00 100.00 100.00 100.00
Source: Patel (2006)

3. Agricultural and dairy scenario in Gujarat
3-10
3A.5 Crop production
The analysis of food grain production over the entire period of 1949 to 1996 indicates that the
compounded annual growth has been positive for quite a long until the early 1980s, but after that
it has been declining. For majority of the food grain crops the declining rate of growth of
production is noticeable following the period of 1980s; only exception has however been the
growth of rice production. The output for most of the cereal crops like jowar, maize, bajra, wheat,
gram have declined during the later part of the last two decades. It is difficult to take a view if this
trend has to impact the dairy production in some way or other. Interestingly, the production
scenario in the oil seeds and other non-food crops has largely been positive and consistent.
Notable improvement in the production of castor seeds, chilly, potato, cotton and tobacco are
redeeming. On the whole, the inclination towards improvements in production of non-food grain
and commercial crops are indicative of agricultural diversification. A detailed analysis indicating
point to point growth in crop production has been provided through Table 3.7.
Table 3.7: Growth of production of different crops in Gujarat (% p.a.)
Crop 1949-96 1948-68 1968-96 1971-81 1981-91 1981-96
Rice 3.08 4.05 3.22 4.18 0.63 1.95
Wheat 4.51 5.11 2.43 4.93 -3.38 -0.07
Jowar 0.28 1.48 -1.87 5.58 -7.35 -7.02
Bajra 2.65 5.00 -0.03 -0.63 -2.17 -1.23
Maize 2.66 6.27 1.76 -5.25 0.79 1.33
Other cereals -4.59 -2.95 -8.42 -0.04 -8.13 -18.20
Gram 2.08 0.75 2.75 2.06 -5.42 -1.62
Tur 6.00 1.67 9.59 17.23 1.53 1.90
All pulses 3.39 1.22 5.43 12.80 -1.79 -0.07
All cereals 2.46 3.57 1.03 1.98 -2.32 -0.70
All food grains 2.55 3.40 1.36 2.65 -2.26 -0.63
Sugarcane 8.26 8.99 7.59 15.45 3.36 3.70
Chilly 5.69 19.70 4.04 6.14 3.38 0.90
Potato 10.31 0.87 9.97 12.48 3.33 4.45
Groundnut 2.27 11.00 -0.39 5.58 -5.38 -1.91
Castor seeds 9.31 -0.06 12.48 16.87 7.39 8.85
Sesamum 1.64 -2.15 2.95 -0.68 0.40 6.79
Rapeseed & mustard 10.60 4.12 14.16 25.86 4.38 4.14
Cotton 1.64 5.84 -0.52 -1.27 -3.76 0.86
3. Agricultural and dairy scenario in Gujarat
3-11
Crop 1949-96 1948-68 1968-96 1971-81 1981-91 1981-96
Tobacco 4.63 6.27 3.30 8.26 0.55 0.59
All oilseeds 3.67 9.78 2.49 6.74 -1.15 1.40
Source: Patel (2006)
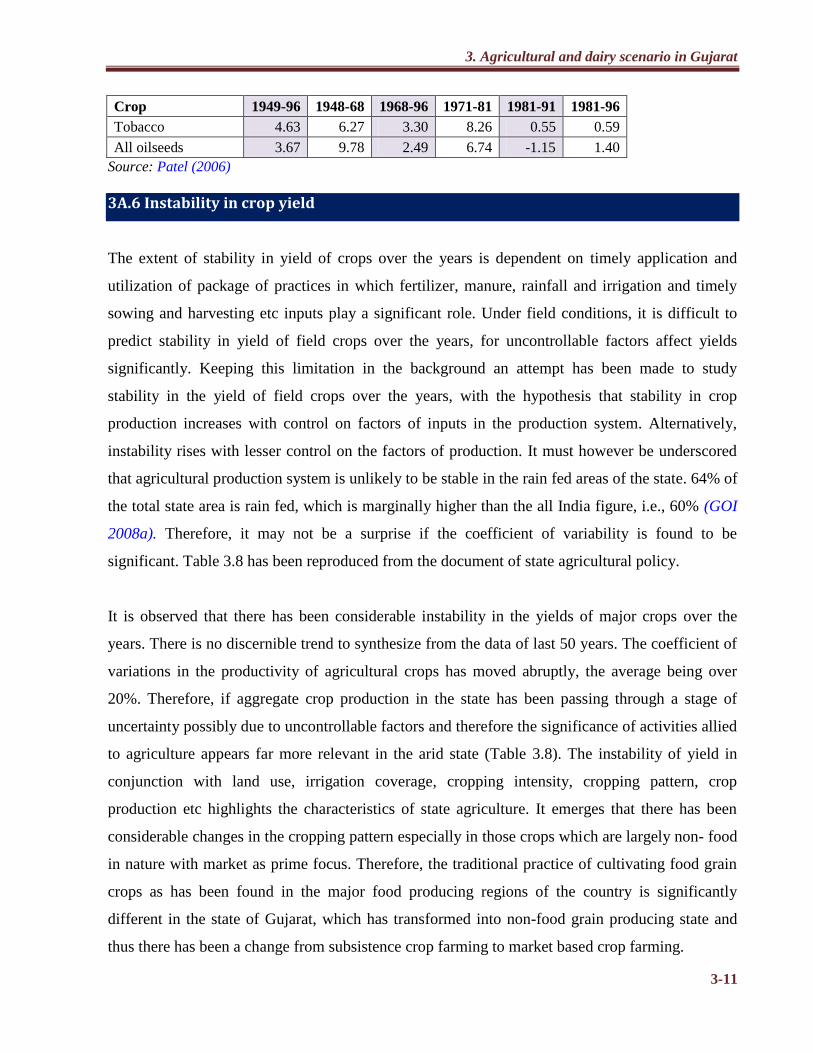
3A.6 Instability in crop yield
The extent of stability in yield of crops over the years is dependent on timely application and
utilization of package of practices in which fertilizer, manure, rainfall and irrigation and timely
sowing and harvesting etc inputs play a significant role. Under field conditions, it is difficult to
predict stability in yield of field crops over the years, for uncontrollable factors affect yields
significantly. Keeping this limitation in the background an attempt has been made to study
stability in the yield of field crops over the years, with the hypothesis that stability in crop
production increases with control on factors of inputs in the production system. Alternatively,
instability rises with lesser control on the factors of production. It must however be underscored
that agricultural production system is unlikely to be stable in the rain fed areas of the state. 64% of
the total state area is rain fed, which is marginally higher than the all India figure, i.e., 60% (GOI
2008a). Therefore, it may not be a surprise if the coefficient of variability is found to be
significant. Table 3.8 has been reproduced from the document of state agricultural policy.
It is observed that there has been considerable instability in the yields of major crops over the
years. There is no discernible trend to synthesize from the data of last 50 years. The coefficient of
variations in the productivity of agricultural crops has moved abruptly, the average being over
20%. Therefore, if aggregate crop production in the state has been passing through a stage of
uncertainty possibly due to uncontrollable factors and therefore the significance of activities allied
to agriculture appears far more relevant in the arid state (Table 3.8). The instability of yield in
conjunction with land use, irrigation coverage, cropping intensity, cropping pattern, crop
production etc highlights the characteristics of state agriculture. It emerges that there has been
considerable changes in the cropping pattern especially in those crops which are largely non- food
in nature with market as prime focus. Therefore, the traditional practice of cultivating food grain
crops as has been found in the major food producing regions of the country is significantly
different in the state of Gujarat, which has transformed into non-food grain producing state and
thus there has been a change from subsistence crop farming to market based crop farming.

3. Agricultural and dairy scenario in Gujarat
3-12
Table 3.8: Coefficient of variation (%) in productivity growth of major food grain and non-food
grain crops
Crop 1949-68 1968-96 1970s 1980s 1990s
Rice 28.09 19.67 27.15 26.95 8.47
Wheat 16.05 10.59 10.66 10.91 11.85
Jowar 17.33 26.79 25.53 27.94 34.33
Bajra 22.59 27.04 28.29 26.26 25.83
Maize 31.23 36.30 46.56 36.77 22.56
Other cereals 18.21 24.27
All cereals 15.79 20.10 22.52 27.25 15.99
Gram 21.88 23.17
Tur 10.91 23.97
All pulses 13.83 22.89 23.21 25.50 19.18
All food grains 15.34 20.62 19.35 23.25 16.92
Sugarcane 12.54 14.61 23.95 9.62 5.32
Chilly 36.90 20.94 28.82 26.81 12.89
Potato 31.40 27.01 13.00 22.61 8.05
Groundnut 25.13 45.94 38.15 51.50 50.94
Castor seeds 18.01 22.96 19.90 24.62 32.07
Sesamum 16.26 39.51 26.47 49.11 38.38
Rapeseed & mustard 18.27 25.14 45.24 53.28 23.70
Cotton 18.00 21.62 13.39 25.91 21.62
Tobacco 16.89 11.86 12.58 11.80 11.75
All oilseeds 23.97 38.83 35.47 38.28 34.2
Simple average 20.4 24.9 25.5 28.8 21.9
Source: Patel (2006)
3A.7 Value of output from agriculture and livestock
The state of Gujarat has shown much diversification in agricultural sector – a visible transition
from food crop economy to non-food crop economy. The major non-food crops grown in the state
are – oilseeds especially groundnut, tobacco and cotton. Gulati et al (2009) computed the share of
different segments of the total value of output from agriculture and livestock only, which
constitutes 94% of total value of output from agriculture and allied activities (T.E. 2005-06). The
share of cash crops, other than cotton (value from oilseeds, fibers, condiments, sugars and drugs
& narcotics) has fallen from around 27.4% (T.E. 1995-96) to 25.8% (T.E. 2005-06) of the total
value of output of agriculture and livestock. On the other hand, the share of cotton grew by two
third, from 9.4% to 15.6%. The share of high value sector i.e., livestock, fruits/ vegetables has
3. Agricultural and dairy scenario in Gujarat
3-13
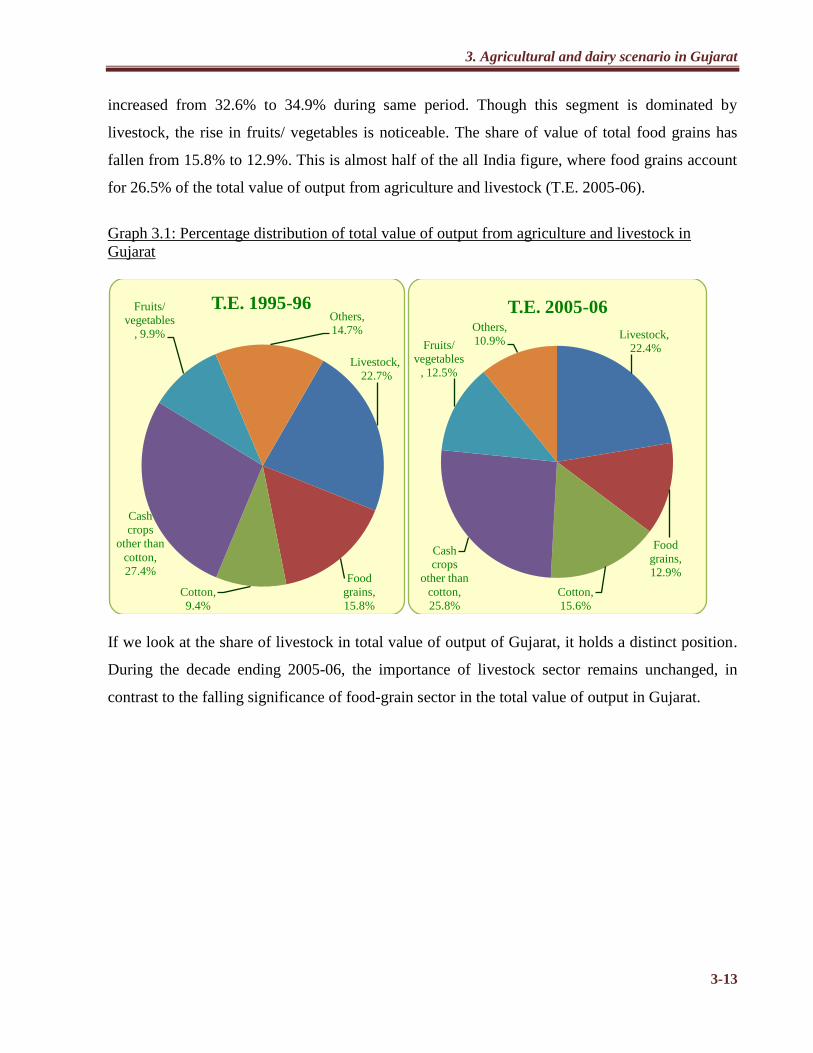
increased from 32.6% to 34.9% during same period. Though this segment is dominated by
livestock, the rise in fruits/ vegetables is noticeable. The share of value of total food grains has
fallen from 15.8% to 12.9%. This is almost half of the all India figure, where food grains account
for 26.5% of the total value of output from agriculture and livestock (T.E. 2005-06).
Graph 3.1: Percentage distribution of total value of output from agriculture and livestock in
Gujarat
If we look at the share of livestock in total value of output of Gujarat, it holds a distinct position.
During the decade ending 2005-06, the importance of livestock sector remains unchanged, in
contrast to the falling significance of food-grain sector in the total value of output in Gujarat.
Livestock,
22.7%
Food
grains,
15.8%
Cotton,
9.4%
Cash
crops
other than
cotton,
27.4%
Fruits/
vegetables
, 9.9%
Others,
14.7%
T.E. 1995-96
Livestock,
22.4%
Food
grains,
12.9%
Cotton,
15.6%
Cash
crops
other than
cotton,
25.8%
Fruits/
vegetables
, 12.5%
Others,
10.9%
T.E. 2005-06

3. Agricultural and dairy scenario in Gujarat
3-14
3B. DAIRY PRODUCTION SYSTEM IN GUJARAT
Size of milch animal population, compositional characteristics of the milch animals and yields are
important determinants of the strength of milk production. In India, the production attributes of
milk production have followed a diversified path. In some states, increase in milch animal
population has been the most important reason for growth, some states have gone in for
technological intervention in breeding and attained growth, while in some states a judicious mix
of population growth and improvement in quality in milch animal have been noticed. Therefore, a
study of the Indian states and characterization of their growth trajectory would be a subject of
interest.
It is under this premise the present section is conceptualized to highlight the important reasons for
growth of production and also examine the behaviour of the constituent factors and possible
direction for future. To limit the outcome, the discussion has been centered on the state of Gujarat
and the nation. However, useful references that are available from different literature have been
used for driving the point in the context of the situation in the state.
3B.1 Dairy animals in Gujarat – Evidence from Livestock Census
The analysis of milch animal population and all female population for Gujarat and all India for the
three time points of 1992, 1997 and 2003 for which Livestock Census data is available have been
provided in Table 3.9. For ease of understanding, compounded annual growth rate (CAGR) has
been computed across these periods and inferences were drawn. Apart from milch animals, total
female population has also been considered for the purpose of taking a view on the potential size
of milch animals. Needless to mention, male population has been purposively kept out of analysis
as they are unrelated to the dairy production.
Buffalo: The buffalo population in the state has been appreciating consistently—the rate of
appreciation is higher than the national average. This is a positive development. During the
decade ending 2003 (1992-2003) the growth rate in buffalo population in the state was 2.55% per
annum as against national average growth of 1.46% per annum. In the intervening periods of

3. Agricultural and dairy scenario in Gujarat
3-15
1992-97 and 1997-2003, the state consistently outperformed the national average in respect of
growth in buffalo population. Though premature, it can be conjectured that buffaloes are the
mainstay of milk production and a healthy growth in their number could augur well for future
prospect of production.
Local cow: The local cow population of the state has distinct characteristics, unlike in many other
states where the local stock are usually less productive and low yielding animals. Major descript
breeds of the state are Kankrej and Gir cows. They are robust, large in body weight, thrive well in
the environment and yield reasonable good volume of output. Therefore, it would be natural that
these stocks are nurtured well for milk production.
Evidence from the livestock census data pertaining to indigenous stock confirms the above
contention in the context of the state. This means that the growth in local milch cow in Gujarat
has consistently been healthy, against depletion in stock elsewhere in the county and also
nationally. Statistically, it is found that the local cow population has clocked a growth of around
1% per annum as against a depletion of equal percentage point nationally. This implies that while
the economic value of these stocks is probably going down in the country, the state of Gujarat has
continued to rear these cattle for milk production. Alternatively, it could be argued that there is
possibly a substitution effect in local cow with improved cow; such substitution may also be
taking place in this state, but the degree of such substitution may be less pronounced.
Crossbred cow: The growth in crossbred cow population in the state has been phenomenal, much
higher than the national growth. It is another important dimension of the compositional
improvement in the quality of milch cattle. 7-10% annual appreciation in the number of crossbred
milch cattle could only be rationalized under favorable artificial delivery mechanism in place.
Though it portrays the propensity of the cattle keepers to improvise on the quality of milch asset it
can safely be argued that unless a congenial technology improvement system is in place, such
growth cannot be realized.
Summarily, the changes in the total milch animal stock have been positive and consistent.
Compared to national average, the state has been registering a growth which is three to four times

3. Agricultural and dairy scenario in Gujarat
3-16
larger than the national growth. This development is indicative of a strong base in productive
asset of milk production.
Table 3.9: Growth in milch animal population (% p.a.)
Type Gujarat India
1992-03 1992-97 1997-03 1992-03 1992-97 1997-03
Local Cow
Milch animals 1.10 1.27 0.97 -0.94 -0.83 -1.04
In-milk animals 1.29 1.97 0.73 0.02 -0.14 0.16
All Female 1.31 1.41 1.23 -0.98 -0.85 -1.09
Crossbred Cow
Milch animals 9.21 7.07 11.03 6.20 7.60 5.05
In-milk animals 9.27 7.35 10.90 6.69 8.11 5.52
All Female 9.37 7.58 10.89 5.86 6.93 4.97
Buffalo
Milch animals 2.55 3.44 1.82 1.46 1.19 1.68
In-milk animals 2.69 4.08 1.55 2.32 1.87 2.69
All Female 2.62 3.34 2.02 1.65 1.29 1.95
All Milch Bovine
Milch animals 2.26 2.74 1.87 0.65 0.58 0.71
In-milk animals 2.48 3.44 1.67 1.70 1.43 1.91
All Female 2.38 2.75 2.08 0.67 0.56 0.76
Source: Deduced through data available from Indian Livestock Census (1992, 1997, 2003)
3B.2 Milk production and per capita availability: Gujarat Vs India
During the last 16 years ending 2005-06 data of total production of milk in Gujarat and all India
has been provided in Table 3.10. It is found that there has been monotonous increase in absolute
production of milk in both the cases. However, the increase in state contribution in national
production is noteworthy, though it is slow yet steady. In 1990-91, Gujarat accounted for 6.5% of
national production, increased to 7% around 1994-95 and finally, touched around 7.5% in 2007-
08. Under a perpetual growth in both the cases, steady increase in state share in national
production is significant (Table 3.10).

3. Agricultural and dairy scenario in Gujarat
3-17
Table 3.10: Production of milk (million tonnes)
Y
ear
Ind
ia
Gu
jara
t
Co
ntr
ibu
tio
n
(%)
Yea
r
Ind
ia
Gu
jara
t
Co
ntr
ibu
tio
n
(%)
1990-91 53.9 3.5 6.5 1999-2000 78.3 5.3 6.7
1991-92 55.6 3.6 6.5 2000-01 80.6 5.3 6.6
1992-93 58.0 3.8 6.5 2001-02 84.4 5.9 6.9
1993-94 60.6 3.9 6.5 2002-03 86.5 6.1 7.0
1994-95 63.8 4.5 7.0 2003-04 88.1 6.4 7.3
1995-96 66.2 4.6 7.0 2004-05 92.5 6.7 7.3
1996-97 69.1 4.8 7.0 2005-06 97.1 7.0 7.2
1997-98 72.1 4.9 6.8 2006-07 100.9 7.5 7.4
1998-99 75.4 5.1 6.7 2007-08 104.8 7.9 7.5
Source: Various issues of BAHS, GOI
Per capita availability of milk
Cereal and milk are two important components of food basket. As in absolute production of milk,
the per capita availability of milk has been constantly increasing in the state and also nationally.
The domestic availability of milk on per capita basis has always been higher than the national
average. Availability of milk and its ever increasing volumes has been contributing in food
security and sustenance of food production. The state of Gujarat has been historically contributing
to ensuring food security in the state but also elsewhere in the country. It is significant that in
1990-91, the difference in incremental availability of milk in the state was 60 grams compared to
national availability, and the difference continued to favour the state over the years, and stood at
135 grams in 2007-08. This has been possible due to two factors (1) higher growth in milk
production compared to growth in human population, and (ii) the rate of growing in milk
production in the state exceeding the national rate of growth. The finding therefore is that the
consistency in increase in absolute growth in milk production is not only adding to food security
but also ensuring employment and livelihood sustenance.

3. Agricultural and dairy scenario in Gujarat
3-18
Table 3.11: Per capita availability (grams per day)
Year India Gujarat Year India Gujarat
1990-91 176 236 1999-00 217 297
1991-92 178 236 2000-01 220 280
1992-93 182 245 2001-02 225 317
1993-94 188 249 2002-03 230 321
1994-95 191 277 2003-04 231 330
1995-96 197 282 2004-05 233 344
1996-97 202 289 2005-06 241 349
1997-98 207 290 2006-07 246 374
1998-99 213 290 2007-08 252 387
Source: Various issues of BAHS, GOI
The foregoing discussions have further been articulated with the data computed on the growth
rates in milk production and per capita availability of milk (Table 3.12). These parameters are
compared across different periods, as given below. It is found that the pace of growth in the state
has been faster than the national growth. The analysis therefore through historical as well as
current evidence to suggest how the state has maintained a lead position in milk production and
availability of milk.
Table 3.12: Growth in milk production and per capita availability (% p.a.)
Period Milk production Per capita availability
India Gujarat India Gujarat
91-92 to 96-97 4.5 6.1 2.6 4.1
96-97 to 01-02 4.1 3.9 2.2 1.9
01-02 to 07-08 3.7 5.1 1.9 3.4
91-92 to 07-08 4.0 5.1 2.2 3.1
Source: Various issues of BAHS, GOI
3B.3 Milch animals and dairy production
The observations that emerged from analysis of agricultural data are now to be examined in the
context of dairy and milk production activities at the regional as well as district level. Ideally, an

3. Agricultural and dairy scenario in Gujarat
3-19
analysis of this kind will sharpen understanding of both agriculture and dairy husbandry sector
and hence the utility. Besides, it is important that the regional characteristics of dairy production
are analyzed from the perspective of different components that singularly or in conjunction with
others shape the nature of the production systems. The canvas of study of livestock production has
covered composition of milch animals, growth of different species of milch animal, milk
production of different species, elasticity of milk production and analysis of factors contributing
to milk production. The various issues of Integrated Sample Survey (ISS), Govt. of Gujarat were
used for present analyses.
3B.3.1 Milch animals and their changes
Numerically, buffaloes are the principal specie in milk production. In 2005-06 there were 43 lakhs
milch buffaloes followed by 22 lakhs of local cows and the cross bred cows were the least (only
2.3 lakhs). Over a span of last 15-16 years, there has been an appreciation of about 25 lakh milch
animals. This translates into 1.7 lakh milch animal annually.
There has been a positive appreciation in all categories of milch animals, but the rate of
appreciation in the buffaloes has far outpaced the rate of appreciation of local cows. It is this
differential rate of appreciation that has caused an intelligent shift in composition of local cows
from 39% in 1990-91 to 32% in 2005-06, while the share of buffaloes improved from 59% in
1990-91 to 64% in 2005-06. The cross bred cows accounted for only 3% of milch animals (Table
3.13).
Another significant feature of this change relate to gradual and consistent shift in identical
direction from local cows to buffaloes. It may be mentioned that at the All India level too, a
similar trend is observed. Within the different regions of the state, the Saurashtra region has
significant contribution of local cows (45%), followed by the Southern region (36%). The
Northern and Central regions have relatively lower proportion of local cows.

3. Agricultural and dairy scenario in Gujarat
3-20
Table 3.13: Region-wise composition of milch animals
(in ’00 Nos.)
Region
Local cow Crossbred cow Buffalo
1990-
91
2000-
01
2005-
06
1990-
91
2000-
01
2005-
06
1990-
91
2000-
01
2005-
06
Central 2886 4366 4969 292 522 486 7161 11465 12645
North 4033 4800 5329 257 485 977 9198 12629 15743
Saurashtra 7374 9483 8783 55 93 123 6172 9900 10566
South 2496 3035 2824 175 289 709 2842 3617 4385
Gujarat State 16788 21682 21906 778 1390 2294 25372 37612 43341
% Composition
Central 28 27 27 3 3 3 69 70 70
North 30 27 24 2 3 4 68 70 71
Saurashtra 54 49 45 0 0 1 45 51 54
South 45 44 36 3 4 9 52 52 55
Gujarat State 39 36 32 2 2 3 59 62 64
Source: Deduced from ISS Reports, Gujarat State (1990-91, 2000-01, 2005-06)
Table 3.14: District-wise composition of milch animals
(in ’00 Nos.)
District
Local cow Crossbred cow Buffalo
1990-
91
2000-
01
2005-
06
1990-
91
2000-
01
2005-
06
1990-
91
2000-
01
2005-
06
Ahmedabad 945 1318 1385 27 157 162 1867 2887 3312
Amreli 866 872 829 2 12 10 729 994 1257
Banaskantha 1229 1217 1426 25 43 169 1995 2974 3507
Bharuch 603 788 677 20 32 47 842 1112 1263
Bhavnagar 994 1209 1095 12 19 23 1241 1603 1842
Jamnagar 779 1001 1048 2 2 5 634 869 1141
Junagadh 1264 2112 1512 7 22 17 1508 3372 2498
Kachchh 1424 1667 1618 7 7 11 654 914 1040
Kheda 444 885 1122 206 438 380 3553 5457 5531
Mehsana 820 1024 1282 156 140 289 3374 3711 5169
Panchmahal 1702 2412 2593 12 26 45 2061 3819 4664
Rajkot 1160 1418 1448 23 31 55 928 1210 1712
Sabarkantha 1039 1241 1236 49 145 357 1962 3057 3755
Surat 844 1033 1048 60 73 261 1242 1533 2172
Surendranagar 887 1204 1233 2 2 1 478 938 1076
Vadodara 740 1069 1254 74 58 61 1547 2189 2450

3. Agricultural and dairy scenario in Gujarat
3-21
District
Local cow Crossbred cow Buffalo
1990-
91
2000-
01
2005-
06
1990-
91
2000-
01
2005-
06
1990-
91
2000-
01
2005-
06
Valsad 1049 1214 1099 94 183 401 758 972 950
Gujarat State 16788 21682 21906 778 1390 2294 25372 37612 43341
% Composition
Ahmedabad 33 30 29 1 4 3 66 66 68
Amreli 54 46 40 0 1 0 46 53 60
Banaskantha 38 29 28 1 1 3 61 70 69
Bharuch 41 41 34 1 2 2 57 58 64
Bhavnagar 44 43 37 1 1 1 55 57 62
Jamnagar 55 53 48 0 0 0 45 46 52
Junagadh 45 38 38 0 0 0 54 61 62
Kachchh 68 64 61 0 0 0 31 35 39
Kheda 11 13 16 5 6 5 85 80 79
Mehsana 19 21 19 4 3 4 78 76 77
Panchmahal 45 39 36 0 0 1 55 61 64
Rajkot 55 53 45 1 1 2 44 46 53
Sabarkantha 34 28 23 2 3 7 64 69 70
Surat 39 39 30 3 3 8 58 58 62
Surendranagar 65 56 53 0 0 0 35 44 47
Vadodara 31 32 33 3 2 2 66 66 65
Valsad 55 51 45 5 8 16 40 41 39
Gujarat State 39 36 32 2 2 3 59 62 64
Source: Deduced from ISS Reports, Gujarat State (1990-91, 2000-01, 2005-06)
3B.3.2 Growth in milch animals
The growth in population of cross bred cows has been remarkable from 6% per annum in 1990-91
to 2000-01 to 11% per annum during 2000-01 to 2005-06. However, this was possible as the
baseline population was at a low level. Between the populations of local cows and buffaloes, the
growth rate in the former group has slowed down (0.21%) during the later period of 2001-06,
compared to the previous period (2.59%). On the contrary, the growth in buffalo population has
been maintained at a level of nearly 3% per annum during both the periods. It is therefore
postulated that with intensification of milk production there would be further reorganization in the
herd structure favouring buffaloes and the cross bred cows (Table 3.15).

3. Agricultural and dairy scenario in Gujarat
3-22
Table 3.15: Region-wise growth in milch animals (% p.a.)
Region
Local cow Crossbred cow Buffalo
90-91 to
00-01
00-01 to
05-06
90-91 to
00-01
00-01 to
05-06
90-91 to
00-01
00-01 to
05-06
Central 4.23 2.62 6.00 -1.43 4.82 1.98
North 1.76 2.11 6.57 15.02 3.22 4.51
Saurashtra 2.55 -1.52 5.51 5.65 4.84 1.31
South 1.97 -1.43 5.15 19.69 2.44 3.93
Gujarat State 2.59 0.21 5.98 10.55 4.02 2.88
Source: Deduced from ISS Reports, Gujarat State (1990-91, 2000-01, 2005-06)
Table 3.16: District-wise growth in milch animals (% p.a.)
Region
Local cow Crossbred cow Buffalo
90-91 to
00-01
00-01 to
05-06
90-91 to
00-01
00-01 to
05-06
90-91 to
00-01
00-01 to
05-06
Ahmedabad 3.38 1.00 19.33 0.69 4.46 2.78
Amreli 0.07 -1.01 19.59 -2.87 3.15 4.81
Banaskantha -0.10 3.22 5.65 31.51 4.07 3.35
Bharuch 2.71 -2.99 5.03 7.79 2.82 2.58
Bhavnagar 1.98 -1.96 4.31 4.59 2.59 2.82
Jamnagar 2.54 0.92 2.16 20.39 3.20 5.60
Junagadh 5.27 -6.47 12.14 -4.91 8.38 -5.82
Kachchh 1.59 -0.59 -0.72 11.37 3.40 2.62
Kheda 7.14 4.86 7.84 -2.77 4.38 0.27
Mehsana 2.25 4.60 -1.09 15.58 0.96 6.85
Panchmahal 3.55 1.46 8.08 11.36 6.36 4.08
Rajkot 2.03 0.42 3.12 12.29 2.69 7.19
Sabarkantha 1.79 -0.08 11.55 19.66 4.53 4.20
Surat 2.04 0.29 1.97 28.87 2.13 7.22
Surendranagar 3.10 0.48 -2.62 -8.46 6.97 2.78
Vadodara 3.75 3.24 -2.33 0.80 3.53 2.28
Valsad 1.47 -1.97 6.84 17.00 2.52 -0.46
Gujarat State 2.59 0.21 5.98 10.55 4.02 2.88
Source: Deduced from ISS Reports, Gujarat State (1990-91, 2000-01, 2005-06)
3. Agricultural and dairy scenario in Gujarat
3-23
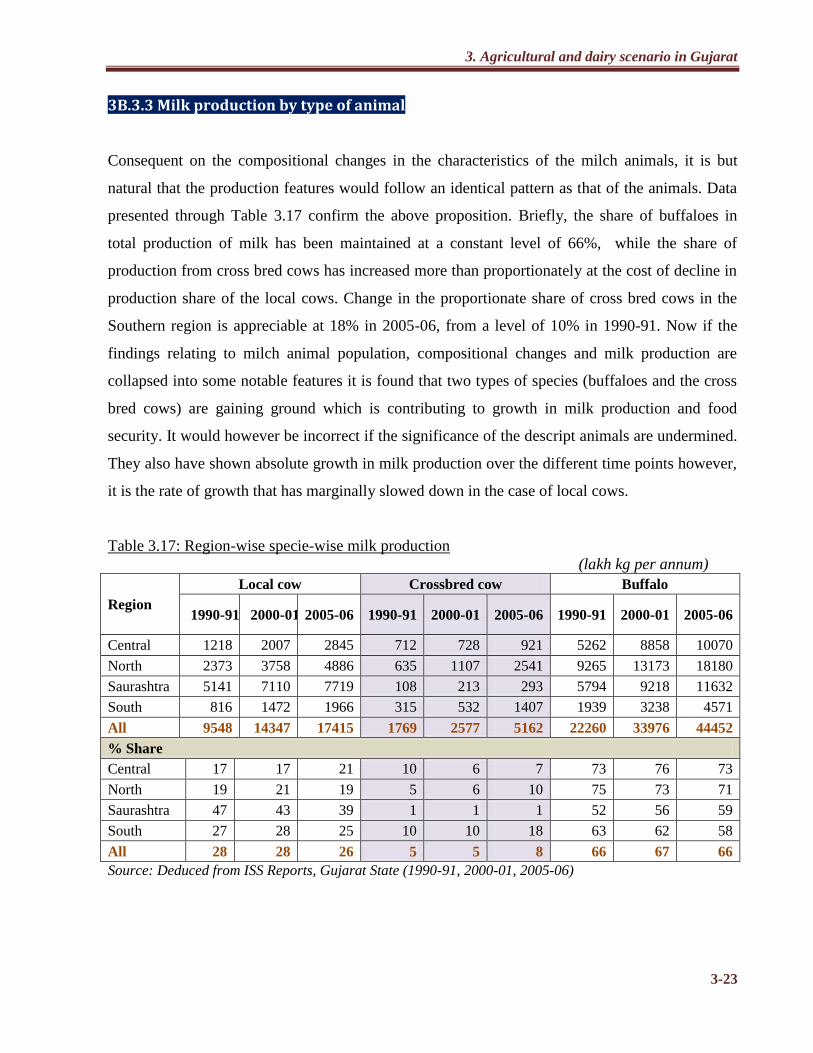
3B.3.3 Milk production by type of animal
Consequent on the compositional changes in the characteristics of the milch animals, it is but
natural that the production features would follow an identical pattern as that of the animals. Data
presented through Table 3.17 confirm the above proposition. Briefly, the share of buffaloes in
total production of milk has been maintained at a constant level of 66%, while the share of
production from cross bred cows has increased more than proportionately at the cost of decline in
production share of the local cows. Change in the proportionate share of cross bred cows in the
Southern region is appreciable at 18% in 2005-06, from a level of 10% in 1990-91. Now if the
findings relating to milch animal population, compositional changes and milk production are
collapsed into some notable features it is found that two types of species (buffaloes and the cross
bred cows) are gaining ground which is contributing to growth in milk production and food
security. It would however be incorrect if the significance of the descript animals are undermined.
They also have shown absolute growth in milk production over the different time points however,
it is the rate of growth that has marginally slowed down in the case of local cows.
Table 3.17: Region-wise specie-wise milk production
(lakh kg per annum)
Region
Local cow Crossbred cow Buffalo
1990-91 2000-01 2005-06 1990-91 2000-01 2005-06 1990-91 2000-01 2005-06
Central 1218 2007 2845 712 728 921 5262 8858 10070
North 2373 3758 4886 635 1107 2541 9265 13173 18180
Saurashtra 5141 7110 7719 108 213 293 5794 9218 11632
South 816 1472 1966 315 532 1407 1939 3238 4571
All 9548 14347 17415 1769 2577 5162 22260 33976 44452
% Share
Central 17 17 21 10 6 7 73 76 73
North 19 21 19 5 6 10 75 73 71
Saurashtra 47 43 39 1 1 1 52 56 59
South 27 28 25 10 10 18 63 62 58
All 28 28 26 5 5 8 66 67 66
Source: Deduced from ISS Reports, Gujarat State (1990-91, 2000-01, 2005-06)

3. Agricultural and dairy scenario in Gujarat
3-24
Table 3.18: District-wise specie-wise milk production (lakh kg per annum)
District
Local cow Crossbred cow Buffalo
1990
-91
2000-
01
2005-
06
1990-
91
2000-
01
2005-
06
1990-
91
2000-
01
2005-
06
Ahmedabad 572 957 1232 67 330 353 1506 2740 2923
Amreli 601 672 775 4 22 22 653 908 1299
Banaskantha 785 1005 1294 56 107 442 2203 3158 4154
Bharuch 232 383 387 45 57 90 547 905 1114
Bhavnagar 783 1050 1078 22 33 55 1166 1612 1788
Jamnagar 508 692 862 4 6 14 494 841 1315
Junagadh 1011 1694 1389 15 44 37 1643 3033 2927
Kachchh 872 1072 1283 17 11 25 538 781 1158
Kheda 340 626 991 492 585 746 3061 4367 4913
Mehsana 463 948 1307 432 401 960 3862 4323 7310
Panchmahal 516 757 1085 26 45 80 1054 2795 3204
Rajkot 813 1180 1342 41 93 137 854 1254 2068
Sabarkantha 554 849 1052 80 269 786 1694 2951 3792
Surat 328 602 898 105 148 525 930 1473 2420
Surendranagar 552 751 991 5 4 3 446 790 1076
Vadodara 363 624 769 193 98 94 1147 1697 1953
Valsad 257 487 681 165 327 793 462 859 1036
Gujarat State 9548 14347 17415 1769 2577 5162 22260 33976 44452
% Share
Ahmedabad 27 24 27 3 8 8 70 68 65
Amreli 48 42 37 0 1 1 52 57 62
Banaskantha 26 24 22 2 3 8 72 74 71
Bharuch 28 28 24 5 4 6 66 67 70
Bhavnagar 40 39 37 1 1 2 59 60 61
Jamnagar 50 45 39 0 0 1 49 55 60
Junagadh 38 36 32 1 1 1 62 64 67
Kachchh 61 58 52 1 1 1 38 42 47
Kheda 9 11 15 13 10 11 79 78 74
Mehsana 10 17 14 9 7 10 81 76 76
Panchmahal 32 21 25 2 1 2 66 78 73
Rajkot 48 47 38 2 4 4 50 50 58
Sabarkantha 24 21 19 3 7 14 73 73 67
Surat 24 27 23 8 7 14 68 66 63
Surendranagar 55 49 48 0 0 0 44 51 52
Vadodara 21 26 27 11 4 3 67 70 69
Valsad 29 29 27 19 20 32 52 51 41
Gujarat State 28 28 26 5 5 8 66 67 66
Source: Deduced from ISS Reports, Gujarat State (1990-91, 2000-01, 2005-06)

3. Agricultural and dairy scenario in Gujarat
3-25
Table 3.19: Region-wise growth in milk production (% p.a.)
Region
Local cow Crossbred cow Buffalo
90-91 to
00-01
00-01 to
05-06
90-91 to
00-01
00-01 to
05-06
90-91 to
00-01
00-01 to
05-06
Central 5.12 7.23 0.23 4.81 5.35 2.60
North 4.71 5.39 5.71 18.09 3.58 6.66
Saurashtra 3.30 1.66 7.09 6.56 4.75 4.76
South 6.07 5.96 5.38 21.50 5.26 7.14
All 4.16 3.95 3.84 14.91 4.32 5.52
Source: Deduced from ISS Reports, Gujarat State (1990-91, 2000-01, 2005-06)
Table 3.20: District-wise growth in milk production (% p.a.)
District
Local cow Crossbred cow Buffalo
90-91 to
00-01
00-01 to
05-06
90-91 to
00-01
00-01 to
05-06
90-91 to
00-01
00-01 to
05-06
Ahmedabad 5.29 5.18 17.33 1.38 6.17 1.30
Amreli 1.12 2.91 18.78 -0.09 3.35 7.44
Banaskantha 2.50 5.19 6.67 32.75 3.67 5.64
Bharuch 5.13 0.20 2.28 9.66 5.17 4.23
Bhavnagar 2.98 0.52 4.01 10.98 3.29 2.10
Jamnagar 3.15 4.49 4.48 17.86 5.45 9.36
Junagadh 5.29 -3.90 11.66 -3.35 6.32 -0.71
Kachchh 2.09 3.65 -4.03 16.72 3.80 8.20
Kheda 6.30 9.63 1.74 5.00 3.62 2.38
Mehsana 7.43 6.65 -0.76 19.08 1.13 11.08
Panchmahal 3.91 7.47 5.47 12.21 10.24 2.77
Rajkot 3.79 2.61 8.57 8.03 3.91 10.52
Sabarkantha 4.37 4.38 12.95 23.93 5.71 5.14
Surat 6.28 8.33 3.49 28.82 4.71 10.44
Surendranagar 3.11 5.71 -2.15 -5.42 5.90 6.37
Vadodara 5.58 4.25 -6.55 -0.77 3.99 2.85
Valsad 6.61 6.96 7.11 19.38 6.40 3.83
Gujarat State 4.16 3.95 3.84 14.91 4.32 5.52
Source: Deduced from ISS Reports, Gujarat State (1990-91, 2000-01, 2005-06)
3B.3.4 Proportion of milking to total milch animal
Of the possible reasons that are often cited in explaining the health of a milch herd is the percent
milking animal in a given universe. A higher percent of milking animal will positively influence

3. Agricultural and dairy scenario in Gujarat
3-26
milk production as there would be more milking animals that would contribute to milk
production. But the point is that a progressive increase in this percentage is biologically
impossible, as milking and dry periods are the two unavoidable periods of the animal psychology.
Nonetheless, a point of maximum level can only be achieved under control condition where all
factors of production are regulated and provided in sufficient volume and quantity. Admittedly,
under the field condition, it is a difficult call. Given this situation, a brief analysis has been
provided on the historical averages of the percentage in- milk animals for regions and districts of
the state at different points of time (Table 3.21). Important observations are as under.
A consistent improvement in percentage milking animals of local cows
Buffalo herd seems to have improved, albeit marginally
Cross bred cows show slight fall in percentage milking animals
The fall in milking percentage in the Central Region is significant
Table 3.21: Region-wise % in-milk animals
Region
Local cow Crossbred cow Buffalo
1990-
91
2000-
01
2005-
06
1990-
91
2000-
01
2005-
06
1990-
91
2000-
01
2005-
06
Central 53 54 62 86 60 65 63 60 63
North 54 60 65 69 74 78 65 65 66
Saurashtra 65 64 67 69 73 79 66 64 67
South 49 57 64 73 76 74 63 69 73
All 58 60 65 76 69 74 64 64 66
Source: Deduced from ISS Reports, Gujarat State (1990-91, 2000-01, 2005-06)
Table 3.22: District-wise % in-milk animals
District
Local cow Crossbred cow Buffalo
1990-
91
2000-
01
2005-
06
1990-
91
2000-
01
2005-
06
1990-
91
2000-
01
2005-
06
Ahmedabad 55 61 65 75 75 76 63 66 58
Amreli 62 60 66 75 69 74 66 60 62
Banaskantha 58 65 63 65 71 71 65 61 64
Bharuch 50 54 61 75 70 76 62 67 68
Bhavnagar 68 70 71 69 68 80 65 70 63
Jamnagar 73 65 67 77 89 88 67 72 72
Junagadh 68 67 68 75 72 75 68 62 68

3. Agricultural and dairy scenario in Gujarat
3-27
District
Local cow Crossbred cow Buffalo
1990-
91
2000-
01
2005-
06
1990-
91
2000-
01
2005-
06
1990-
91
2000-
01
2005-
06
Kachchh 60 59 62 76 44 75 59 60 64
Kheda 68 60 64 86 58 66 66 61 64
Mehsana 50 66 68 73 78 88 65 67 74
Panchmahal 48 50 61 76 76 64 53 56 64
Rajkot 68 69 74 63 83 81 72 70 74
Sabarkantha 50 50 64 55 69 72 65 64 63
Surat 55 60 69 76 82 76 65 70 75
Surendranagar 56 55 64 75 76 81 63 59 64
Vadodara 54 57 60 85 72 63 68 64 62
Valsad 44 56 62 70 75 73 59 72 74
Gujarat State 58 60 65 76 69 74 64 64 66
Source: Deduced from ISS Reports, Gujarat State (1990-91, 2000-01, 2005-06)
3B.4 Growth in milk output and associated factors
In the background of growth in milk output, it would be useful if the causes of growth are studied.
Birthal et al (1999), in a similar issue, has found that output index of milk has expanded at 3.98%
per annum over a horizon of 15 years ending 1995-96, and the growth in input index has been
2.19% per annum.. The net result (output index minus input index) has been a growth of 1.79%
per annum which has been attributed to Total Factor Productivity (TFP) index. The basket of
input index in the formulation consisted of feed index, labour index and population stock index.
Technically, it has been argued that the due to improvement in Technical Factor Productivity the
growth in livestock sector has been positive and secular over a longer horizon.
Given the lead from the computational process followed by the proponents of the TFP theory, an
attempt has been made to study growth of milk output in the state and the changes in different
components that have contributed growth. Though it cannot be attributable to the theory of TFP,
the analysis underlined below seeks to diagnose the factors that are directly responsible in the
acceleration of milk output. It may be clarified that among the factors studied it is likely that some
would have positive impact while some could react adversely. Cumulatively, if the positive forces
outpace the negative ones, outputs are enhanced and a reverse holds good when negative forces
outnumber the positive ones.

3. Agricultural and dairy scenario in Gujarat
3-28
Under the frame work of milk production, the facilitating or hindering factors are as under.
Percentage in-milk animal
Yield of in- milk animal
Number of milch animal
Now the district wise and time series data for the years 1990-91 to 2005-06 have been fitted under
a semi-logarithm regression equation for estimating trend growth rates region wise as well as
specie wise. The results of which are presented graphically as well as through boxes. It is found
that for local cows the growth in milk production at the state level has been 4.20% per annum.
This growth has been contributed by positive contribution of all the three variables listed above.
Most significant contributor to growth in production has been increase in number of milch animal
(2.03%), followed by yield of the milking animals (1.46%) and the increase in proportion of
milking animals (0.71%).
The growth analysis of cross bred cows and the buffaloes however do not follow that of the local
cows. In both the cases, impact of proportion of milking animals has been negative, while other
two factors have positively influenced production. Significantly, increase in number of milch
animal has been far stronger compared to increase in yield of milking animals.
If the growth enhancing factors are carefully studied, it is found that it is the local cows that have
consistently improved their performance benchmarks, across the regions as well as the state. But
the cross bred cows and the buffaloes though improved on two counts (in-milk yield and increase
in number), yet stumbled on percentage milking animals. It is therefore important that yield rates
have constantly aided improvement in milk production which could be ascribed to technological
improvements in milk production. As there could be a biological limit to improvement in per cent
milking animal, it is possible that a limit in this regard has already set in. Nonetheless, the two
other factors that seemed to be driving the production growth are quite redeeming in the context
of the state and therefore much of the efforts need to be crystallized for sustenance of the same.

3. Agricultural and dairy scenario in Gujarat
3-29
Graph 3.2: Growth in milk production and associated factors: Local cow (% p.a.) – 1990-91 to
2005-06
Graph 3.3: Growth in milk production and associated factors: Crossbred cow (% p.a.) – 1990-91
to 2005-06
Local cow
0.00
1.00
2.00
3.00
4.00
5.00
6.00
7.00
% In-milk 1.08 1.12 0.26 1.42 0.71
In-milk yield 0.98 1.63 1.33 3.43 1.46
Milch animals 4.14 2.21 1.15 1.27 2.03
Production 6.20 4.96 2.74 6.12 4.20
Central North Saurashtra South All
Crossbred cow
-4.00
-2.00
0.00
2.00
4.00
6.00
8.00
10.00
12.00
% In-milk -2.35 -2.35 0.86 0.14 -0.43
In-milk yield -0.05 -0.04 0.29 -3.08 0.30
Milch animals 2.51 8.25 6.32 11.93 6.48
Production 0.10 8.65 7.47 8.99 6.35
Central North Saurashtra South All

3. Agricultural and dairy scenario in Gujarat
3-30
Graph 3.4: Growth in milk production and associated factors: Buffalo cow (% p.a.) – 1990-91 to
2005-06
3B.5 Elasticity of milk production
In order to further drive the findings established above, elasticity of milk production with respect
to ratio of in-milk to milch animal, yield of in-milk animal, milch animal population has been
computed and presented through Table 3.23. Elasticity coefficients reflect per cent change in milk
production with one per cent change in the dependent variable under the condition of ―other
things remaining same‖. Improvement in yield of milking animal appears to be most commonly
and uniformly significant factor which could improve milk production in the universe across any
type of specie. Common sense knowledge easily confirms this observation. However,
improvement in the ratio of milking to total animal under the given situation of the state cannot
influence milk production, especially in case of cross bred cows and buffaloes. In the earlier
analysis, a similar trend was also observed in the case of ascertaining the growth rates. It is
therefore established that for a healthy development and growth of the milch herd it is necessary
that yield stimulating factors are further cared and attended, which by itself would fuel
intensification in the production system.
Buffalo
-2.00
-1.00
0.00
1.00
2.00
3.00
4.00
5.00
6.00
% In-milk -0.34 0.05 -0.26 -1.87 -0.03
In-milk yield 0.34 0.85 1.15 2.47 0.87
Milch animals 4.30 3.68 3.67 5.25 3.79
Production 4.30 4.58 4.56 5.85 4.62
Central North Saurashtra South All

3. Agricultural and dairy scenario in Gujarat
3-31
Box 3.1: Elasticity is the responsiveness of variable in question (i.e., dependent variable) to
changes in another (i.e., independent variable(s)). If we take common example of price and
demand, generally with rise in price, demand falls. But, it will not give the extent/ magnitude of
fall. Elasticity is the ratio of the percent change in one variable to the percent change in another
variable. It is a tool for measuring the responsiveness of a function to changes in parameters in a
relative way. Commonly analyzed are elasticity of substitution, price and wealth. Elasticity is a
popular tool among empiricists because it is independent of units and thus simplifies data analysis.
Types of elasticity Inelastic: Percentage change in dependent variable (D) is less than percentage change in independent variable (I). Numerical value of E is between 0 and -1 Elastic: Percentage change in D exceeds percentage change in I. Numerical value of E is greater than 1 Unitary elasticity: Percentage change in D and I same. Numerical value equals to 1
The formula used to calculate elasticity coefficient (E) is
% 𝐶ℎ𝑎𝑛𝑔𝑒 𝑖𝑛 𝑑𝑒𝑝𝑒𝑛𝑑𝑒𝑛𝑡 𝑣𝑎𝑟𝑖𝑎𝑏𝑙𝑒 (𝐷)
% 𝐶ℎ𝑎𝑛𝑔𝑒 𝑖𝑛 𝑖𝑛𝑑𝑒𝑝𝑒𝑛𝑑𝑒𝑛𝑡 𝑣𝑎𝑟𝑖𝑎𝑏𝑙𝑒 (𝐼)
= 𝜕𝐷
𝜕𝐼 𝐼
𝐷 =
𝜕 ln 𝐷
𝜕ln 𝐼
Table 3.23: Elasticity co-efficient of milk production
Region
Local cow Cross-bred cow Buffalo
Ratio of
in-milk
to milch
In-
milk
yield
Milch
popula
tion
Ratio of
in-milk
to milch
In-
milk
yield
Milch
popula
tion
Ratio of
in-milk
to milch
In-
milk
yield
Milch
popula
tion
Central 3.28** 2.665** 1.436** 0.146 1.428** 0.496** -1.236 2.448* 0.935**
North 3.519** 2.888** 2.417** 8.724** 0.454 1.053** 7.68 4.534** 1.235**
Saurashtra 5.135** 1.997** 1.835** 4.633** 5.262** 1.172** -0.766 2.648** 1.179**
South 0.934* 1.733** 0.751 1.06 -0.021 0.205 -0.166 1.882** 0.345**
All 5.016** 2.785** 1.989** -3.208 5.424** 0.997** -0.148 4.774** 1.198**
** Significant at 0.05 level
* Significant at 0.1 level

3. Agricultural and dairy scenario in Gujarat
3-32
3C. MILK IN FOOD BASKET IN GUJARAT — DRIVERS FOR DEMAND
Traditionally, Indian food basket is culturally enriched with a variety of food components in
which milk occupies an important position. The food delicacies, especially milk and milk
derivatives, are inseparable in our normal as well as special diets. It is no gainsaying that
expenditure on milk and milk products would constitute a good proportion of total food
expenditure. Between 1983 and 1999-2000, consumption of milk among the very poor households
increased by 49% and the corresponding increase in milk consumption among rich households
was 39% (Birthal and Taneja 2006). The demand for animal products is more income elastic
compared to staple foods, and the poor, with rise in their income, spend more on high-value food
products including animal products. The value of expenditure when transformed into volume of
consumption would take the form commodity demand in the context of a macro society. It is
under this preview, it would be desirable that an analysis is carried out to understand the
development relating to consumption or demand.
The National Sample Survey (NSSO) is the most important and regular source of information,
especially, the quinquennial rounds of surveys, which provide consumer expenditure data from a
large scale sample survey, and therefore create a canvas to examine the phenomenon from
longitudinal as well as cross sectional perspectives. Data aggregation is, however, done at the
state level both for rural and urban areas, and for individual state, value of consumption of
different items is presented on the basis of 12 expenditure classes. The scope in NSSO inquiry is
limited to household consumption. By default, out of home or institutional consumption is not
reported. For milk, following definition is contained in the report; ―consumption of milk (liquid)
includes milk converted into curds, butter, ghee, paneer etc within the household prior to
consumption. It also includes milk going into household preparation of sweetmeats. Bottled or
poly packed flavoured milk comes under milk (liquid)‖.
3C.1 Food consumption basket
Food consumption basket consists of the range of commodities that are consumed in the society.
This basket changes with changes in food habits, level of income and life styles, urbanization,
3. Agricultural and dairy scenario in Gujarat
3-33
affordability and accessibility. With increase in level of income and improvement in life styles,
the consumption basket tends to be more diversified—the traditional cereal consumption makes
way for non-cereal based food and other items of consumption, mostly noon-food items.
Economists often relate this phenomenon with the operation of Engel’s law of Demand. This has
relevance in the changes in the Indian food consumption basket as has been found through the
analysis of last 30 years.
During the 1980s, nationally, some 63% of the total consumer expenditure in the rural areas used
to be devoted towards food expenditure, and non-food used to share about 37% of the expenditure
(Table 3.24). Over the years, this non-food component gained prominence, and currently placed at
45%-- a significant shift in the consumer expenditure pattern, perfectly in line with Engel’s law of
Demand. It can be contented that with changes in affordability and higher disposable incomes,
consumers tend to spend more on non-food especially on consumer durables, clothing, footwear
etc items. In the urban areas also, what was 45% as non-food expenditure in the 1980s, stands at
57% in the 2000s—a significant shift away from food expenditure (Table 3.24).
As in the country, the consumer shift in expenditure pattern is also noticeable in the state of
Gujarat. Typically, an average consumer spent 69% of total expenditure on food related consumer
items in the rural areas in mid 1980s, which fell to 58% in mid 2000s. Thus, the consumer shift in
expenditure pattern is a global phenomenon, more and more non food items of expenditure are
gaining prominence in the consumer purchase profile. Decline in shift of food expenditure to total
expenditure in the urban areas of Gujarat is far stronger, from 60% to 45%.
Within the food expenditure, the importance of cereals have decreased gradually—26% to 18%
over a span of 20 years in the rural areas of India, and 15% to 10% in mid 2000s in the urban
areas. Consumer expenditure on milk has remained at a level of 8-9% over the same period in
rural areas in either of the situations, suggesting the relative importance of milk in the consumer
basket has remained unaffected over a longer horizon. In Gujarat, the expenditure on milk & milk
products has continued to remain stable around 14% in either of the situations. It also brings to
light that despite increase in per capita disposable incomes, the Indian consumers have not
changed their food habits away from milk. On the contrary, it has remained at a level which is the

3. Agricultural and dairy scenario in Gujarat
3-34
second highest item of food expenditure, greater than meat, fish and eggs. Therefore, while food
consumption expenditure has tapered off over the years, the importance of milk in food
expenditure has been maintained at a level commensurate with the improvement in the supply
position. This is another facilitating factor that has contributed significantly in increasing a
concomitant growth in the consumer market for milk & milk products.
Table 3.24: Expenditure as % of total consumer expenditure: India and Gujarat
Item
India Gujarat
43rd
round
50th
round
55th
round
61st
round
43rd
round
50th
round
55th
round
61st
round
RURAL
Cereals 26.1 24.2 22.2 18.0 19.4 16.7 14.7 13.3
Gram 0.2 0.2 0.1 0.1 0.2 0.1 0.1 0.1
Cereal Substitutes 0.1 0.1 0.1 0.1 0.0 0.0 0.0 0.0
Pulses & pulse products 4.0 3.8 3.8 3.1 4.8 4.6 4.2 3.4
Milk & milk products 8.6 9.5 8.8 8.5 13.9 14.1 14.3 13.1
Edible oil 5.6 4.4 3.7 4.6 8.1 8.7 6.3 7.3
Egg, fish and meat 3.2 3.3 3.3 3.3 0.8 1.0 0.8 0.9
Vegetables 5.2 6.0 6.2 6.1 7.6 7.9 6.9 7.2
Fruits (fresh & dry) 1.6 1.7 1.7 1.9 1.2 1.3 1.5 1.8
Sugar 2.9 3.0 2.4 2.4 4.8 4.7 3.1 3.2
Salt 0.2 0.2 0.2 0.2 0.1 0.1 0.1 0.1
Spices 2.7 2.5 2.7 2.3 2.9 2.5 2.5 2.2
Beverages etc 3.9 4.2 4.2 4.5 5.4 5.3 5.2 5.3
Total Food 63.8 63.2 59.4 55.0 69.1 67.1 59.8 58.0
Total Non-food 36.2 36.8 40.6 45.0 30.9 32.9 40.2 42.0
Total Expenditure 100.0 100.0 100.0 100.0 100.0 100.0 100.0 100.0
URBAN
Cereals 14.8 14.0 12.3 10.1 12.4 11.3 9.3 8.0
Gram 0.2 0.2 0.1 0.1 0.2 0.1 0.1 0.1
Cereal Substitutes 0.1 0.1 0.0 0.0 0.0 0.0 0.0 0.0
Pulses & pulse products 3.4 3.0 2.8 2.1 4.2 3.4 2.9 2.3
Milk & milk products 9.5 9.8 8.7 7.9 13.5 13.6 12.4 11.3
Edible oil 5.3 4.4 3.1 3.5 8.9 7.7 5.0 5.2
Egg, fish and meat 3.5 3.4 3.1 2.7 1.2 1.2 1.0 0.7
Vegetables 5.3 5.5 5.1 4.5 6.5 6.4 5.9 5.3
Fruits (fresh & dry) 2.5 2.7 2.4 2.3 2.0 2.2 2.5 2.4
Sugar 2.3 2.4 1.6 1.5 3.2 3.1 2.0 1.9

3. Agricultural and dairy scenario in Gujarat
3-35
Item
India Gujarat
43rd
round
50th
round
55th
round
61st
round
43rd
round
50th
round
55th
round
61st
round
Salt 0.1 0.1 0.2 0.1 0.1 0.1 0.1 0.1
Spices 2.2 1.9 2.1 1.5 2.3 1.8 1.9 1.5
Beverages etc 6.7 7.2 6.3 6.2 5.6 7.5 6.4 6.0
Total Food 55.9 54.7 48.1 42.5 60.3 58.4 49.6 44.9
Total Non-food 44.1 45.3 51.9 57.5 39.7 41.6 50.4 55.1
Total Expenditure 100.0 100.0 100.0 100.0 100.0 100.0 100.0 100.0
Source: Deduced from Consumer expenditure survey report, NSSO, GOI
Note: 43rd
Round: July 1987 to June 1988 55th Round: July 1999 to June 2000
50th Round: July 1993 to June 1994 61st Round: July 2004 to June 2005
3C.2 Milk consumption
The urban consumption of milk in absolute volume has been rising over the years for over a
decade beginning 1987-88, the year when first quinquennial round of consumer expenditure
survey results were published. The rural consumption, on the other hand, though increased during
1987-88 and 1993-94, showed a decline in 1999-00 over 1993-94 and 2004-05 over 1999-2000.
The pooled data (rural + urban) of milk consumption has almost stagnated at country level and
even declined marginally in case of Gujarat. But this low estimate could open up another
dimension of milk consumption within and outside home. The interpretation of NSS data could
suggest that perhaps out of home consumption of milk is on the rise, which is not get captured
under NSS framework. In Gujarat, the volume of milk consumption has been increasing during
four time points (i.e., 1987-88, 1993-94, 1999-2000 and 2004-05) urban areas. During 1999-2000
and 2004-05, the volume of milk consumption dropped in rural areas. Nonetheless, the average
per capita monthly consumption of milk in Gujarat is higher than the national average at any time
point.
If incidence of consumption rises, it would be construed as enhancement of consumption base
across wider population. It is found that incidence of milk consumption is rising over the years
uniformly across urban and rural areas. For instance, in 1987-88, 78% of the urban households
reported milk consumption, which increased to 85% in 2004-05. Similarly, in rural areas the
incidence increased from 62% in 1987-88 to 71% in 2004-05. In essence, the purchase incidence

3. Agricultural and dairy scenario in Gujarat
3-36
improved by 7-11 percentage point over last 17 years. It may be noted that incidence of milk
consumption in Gujarat is very high compared to national level and no room left for further rise in
incidence. That’s why the incidence of milk consumption both in rural as well as urban areas
remained almost constant during this period in Gujarat. (Table 3.25 & 3.26).
Therefore, a higher per capita consumption coupled with rising incidence would automatically
induce higher demand for milk, especially in the urban areas. On the contrary, the increase in
incidence of consumption in rural areas would partially offset relative drop in per capita
consumption in the rural areas.
Table 3.25: Per capita monthly consumption of milk (ltrs/month)
Year
Urban Rural % Change in Qty Pooled per
capita milk
consumption
(ltrs/month) Qty Value Qty Value Urban Rural
INDIA
43rd
Round (1987-88) 4.26 19.42 3.20 12.06 - - 3.48
50th Round (1993-94) 4.89 39.09 3.94 24.89 (+) 14.79 (+) 23.13 4.18
55th Round (1999-2000) 5.10 62.66 3.79 38.37 (+) 4.29 (-) 3.89 4.12
61st Round (2004-05) 5.11 73.30 3.87 44.32 (+) 0.20 (+) 2.11 4.18
GUJARAT
43rd
Round (1987-88) 5.48 32.59 4.55 22.41 - - 4.81
50th Round (1993-94) 6.21 51.18 5.07 37.72 (+)13.32 (+) 11.43 5.44
55th Round (1999-2000) 6.58 88.23 5.42 66.95 (+) 5.96 (+) 6.90 5.79
61st Round (2004-05) 6.70 106.75 4.98 71.66 (+) 1.82 (-) 8.11 5.57
Source: Deduced from Consumer expenditure survey report, NSSO, GOI
Table 3.26: Incidence of milk consumption (%)
Year All India Gujarat
Urban Rural Urban Rural
1987-88 78.9 61.9 96.0 95.3
1993-94 80.0 66.3 96.0 93.8
1999-2000 82.9 67.8 94.1 92.9
2004-05 85.0 71.3 94.2 91.7
Source: Deduced from Consumer expenditure survey reports, NSSO

3. Agricultural and dairy scenario in Gujarat
3-37
3C.3 Sources of consumption
It would be interesting to analyze the sources of milk consumption in both urban and rural areas.
As expected, those who consume milk, 96% of the population in the urban area consumes milk
from purchases and another 4% consume milk from their own stock. For the purpose of general
understanding this 4% of the population could be construed as milk producers in the urban areas
(Table 3.27). Now, this particular statistic revealed through NSS does not vary much with the
population distribution of milch animal as described through the Livestock Census 2003 (only 5%
of milch animal reside in urban areas).
Source of consumption of milk in the rural areas is balanced between purchase and home grown
stock. Ironically, of those who consume milk, only 36% meet their demand from home raised
animal, and 62% get their milk from purchases. This is a very interesting observation from the
NSS survey. Prima facie, it may appear as myth. Nonetheless, as per these data, there could be
apparent scope for exploring rural marketing of milk. The state of Gujarat also follows the
national pattern in case of sources of milk consumption in rural and urban areas.
Table 3.27: % Distribution of source of consumption of milk
Items All India Gujarat
Urban Rural Urban Rural
Only purchase 95.60 62.00 95.60 63.20
Only home grown 3.80 36.20 3.20 34.80
Both purchased & home grown 0.02 0.08 0.40 1.20
Free collection 0.01 0.04 0.00 0.40
Others 0.03 0.06 0.80 0.40
All 100.00 100.00 100.00 100.00
Source: Consumer Expenditure Survey Report (1999-2000), NSSO
3C.4 Inequality in milk consumption
A technical measure of inequality in distribution of assets, income or consumption or even the
welfare measure of public goods is the estimate of gini coefficient whose value lies between 0 and

3. Agricultural and dairy scenario in Gujarat
3-38
1 – the lower value signifies absolute equality while the upper value signifies absolute inequality.
These absolute values are nonetheless never found in the society, and therefore the estimated
value and their difference from the point of absolute equality (i.e. 0) is the conventional measure
of inequality. The estimated values are presented in Table 3.28 for cereal, pulses, edible oil, milk
& milk products, meat, fish & eggs, vegetables, total food, total non-food and total expenditure.
A disturbing trend emerges from the analysis of gini-coefficient relating to milk & milk products.
The inequality in milk consumption is the highest in comparison to other food products. It holds
good both for rural and urban areas. However, the inequality in milk consumption is less in
Gujarat compared to all India.
While at all India level, the disparity in consumption of meat, fish & eggs among different
segments of populations has shown a gradual fall during 1988 and 2000, the same for milk has in
fact not changed much. In Gujarat, the disparity in consumption of meat, fish and eggs has
widened in rural areas, where as it has narrowed down in urban areas.
In order to understand reasons for increase in disparity we have further extracted data on
consumer price of milk, fish and egg; price data of meat could not be extracted for all the three
rounds due to change in the definition of meat. It is found that consumer price of milk has
increased at 6.53% and 6.4% per annum during 1988 and 2000 in rural and urban areas
respectively. This rise is higher compared to 4.46% and 5.45% of fish and 4.95% and 5.03% of
egg respectively. Therefore, relatively higher increase in consumer prices of milk could possibly
be one of the reasons for which milk might have been relatively costlier for the people in the
lower expenditure bracket. This in turn, might have contributed to increasing inequality in milk
consumption. In comparison to all India, the disparities in food as well as non-food commodities
are either same or less in Gujarat.
These results could be interpreted from the point of view of significance of milk as an item of
consumption among the economically weaker sections of the society, price of milk vis-à-vis their
affordability and the nature of the products. If for the sake of comparison, one could assume that
milk is a costly commodity like meat and fish, the value should have been closer to each other.

3. Agricultural and dairy scenario in Gujarat
3-39
Somehow, they are different. This could possibly mean that probably the consumer attach higher
significance in choosing meat, fish or eggs compared to milk.
Table 3.28: Estimate of Gini coefficient of inequality in select food and non-food items
Commodity Area
All India Gujarat
1987-
88
1993-
94
1999-
2000
2004-
05
1987-
88
1993-
94
1999-
2000
2004-
05
Cereal Rural 0.16 0.14 0.12 0.13 0.19 0.17 0.16 0.15
Urban 0.11 0.11 0.12 0.14 0.13 0.12 0.13 0.13
Pulses Rural 0.34 0.31 0.31 0.28 0.32 0.29 0.23 0.26
Urban 0.34 0.29 0.30 0.25 0.24 0.25 0.22 0.20
Edible oil Rural 0.43 0.35 0.33 0.29 0.40 0.37 0.29 0.31
Urban 0.45 0.38 0.35 0.31 0.35 0.24 0.24 0.19
Milk & Milk
products
Rural 0.81 0.75 0.77 0.70 0.58 0.48 0.56 0.53
Urban 0.68 0.64 0.62 0.58 0.56 0.48 0.48 0.43
Meat, fish &
egg
Rural 0.56 0.52 0.49 0.54 0.27 0.38 0.35 0.43
Urban 0.54 0.48 0.44 0.43 0.32 0.24 0.14 0.23
Vegetable Rural 0.33 0.30 0.29 0.26 0.30 0.30 0.27 0.26
Urban 0.44 0.38 0.36 0.32 0.28 0.22 0.24 0.23
Food Rural 0.38 0.36 0.36 0.36 0.34 0.32 0.32 0.34
Urban 0.44 0.41 0.42 0.40 0.35 0.33 0.34 0.33
Non-food Rural 0.75 0.72 0.58 0.73 0.55 0.59 0.51 0.64
Urban 0.84 0.82 0.77 0.84 0.72 0.75 0.66 0.70
Total exp. Rural 0.51 0.48 0.45 0.52 0.40 0.40 0.40 0.47
Urban 0.61 0.59 0.60 0.65 0.48 0.49 0.50 0.53
Source: Deduced from Consumer expenditure survey report, NSSO
3C.5 Income elasticity of milk demand
This section deals with the income elasticity of milk consumption, which indicates the propensity
to consume milk with rise in income. It means how a unit rise in income would affect the milk
consumption expenditure. Household surveys generally provide the data necessary to analyze the
relationship between consumption of different commodities (expressed in terms of quantities or
expenditure) and disposable income (or total expenditure). Ernest Engel, a German economist did

3. Agricultural and dairy scenario in Gujarat
3-40
the pioneering work in the analysis of family budget in the nineties of the last century. He
analyzed some family budgets and found that ―the poorer a family is, the greater is the proportion
of the total outgo (total expenditure) which must be used for food‖. Though he seemingly reported
the results of empirical studies, his work is now considered, and rightly so, classic in the field of
demand analysis. His finding is now known as the Engel law of consumption. His own version,
very concise but very precise, could be slightly elaborated as follows: ―As income increases the
expenditure on different items in the budget has changing proportions, and the proportions
devoted to urgent needs (such as food) decrease, while those devoted to luxuries or semi-luxuries
increase (Allen & Bowley)‖.
A study conducted by Saxena (2000) using National Sample Survey (NSS) data for 1993-94
showed that income elasticity of demand for milk and milk products is higher (1.96 national level)
in rural areas (ranging from 1.24 in Punjab to 2.92 in Orissa) than in urban areas (ranging from
0.99 in Punjab to 1.78 in Bihar). Radhakrishna and Ravi (1994), Gandhi and Mani (1995), Kumar
(1998) and Dastagiri (2001) have estimated demand and income elasticity of demand for milk
and milk products, and show similar trends. The income elasticity of demand for livestock
products is high, estimated at around unity for certain wealth groups in rural areas (Mehta et al,
2003). Here, an attempt was made to work out income elasticity of milk demand for Gujarat and
India for rural and urban areas separately by using latest data-set.
The household consumption expenditure data of 61st round of NSSO, across 12 expenditure
classes on total expenditure and expenditure on milk & milk products have been used to estimate
the income elasticity of demand. These estimates are provided separately for rural & urban areas
in Table 3.29. The double-log method provides a better-fit in estimation of income elasticity of
demand, for its maximization of 𝑹𝟐 values.
Table 3.29: Income elasticity of demand for milk in Gujarat and India
Rural Urban
Elasticity 𝑹𝟐 Elasticity 𝑹𝟐
Gujarat 1.304 0.921 0.908 0.950
India 1.543 0.882 1.000 0.928

3. Agricultural and dairy scenario in Gujarat
3-41
The estimate reveals that in the rural areas the income elasticity of demand for milk in case of
Gujarat and India is elastic, while in urban areas, it is inelastic or just elastic. This means the
consequences on a unit rise in per capita income will push the demand for milk more in the rural
areas than that in the urban areas. Given its high income elasticity, the demand for milk and dairy
products is expected to grow rapidly.
3.D Conclusion
The districts of Gujarat have been categorized in broad five regions viz., South Gujarat, Central
Gujarat, North Gujarat, Saurashtra and Kachchh. The area under agriculture remains almost
constant over last 50 years. However, the nature of growth and development in the state would
revolve around the crop diversification, value addition and linking crops with the markets. There
is an impressive progress in expanding the coverage of irrigated area – this is more of a protective
irrigation during the monsoon failure or environmental stress than expanding the coverage of
agriculture area as the gross cropped area has not increased much during same period. The inter-
temporal analysis of cropping pattern indicates the shift from food crops to non-food grain and
commercial crops.
Milk production in Gujarat grew at a higher rate than that of a nation and hence the contribution
of state in national production increased from 6.5% to 7.5% during last 15 years. Among all the
species, buffalo has been gaining importance in state milk production. The main driver of the
growth in milk production in the state has largely been incremental animal numbers. However,
henceforth it is the yield of lactating animals – a single-most significant factor that could augment
milk production across any type of specie.
From the perspective of milk demand, the state of Gujarat incurs higher proportion of the total
expenditure towards milk and milk products as compared to Indian average and therefore, the per
capita consumption of milk in Gujarat is higher than that of national average. At the country level,
the inequality in milk consumption is the highest in comparison to other food products. It holds
true for both rural and urban areas. However, the inequality in milk consumption is less in Gujarat
compared to all India. The results of income elasticity of milk demand indicate that the demand

3. Agricultural and dairy scenario in Gujarat
3-42
for milk and milk products is expected to grow rapidly with the rise in per capita income both in
Gujarat as well as in India.