Embed Size (px)
Citation preview

-138-
- CHAPTER V
CORR~A'r TON B1ID'-n'fEEN SIZE AND. EFFICIENCY
Jh the earlier chapters the criterion to judge
the size and the existing sizes of the various units
were studied. Jh this chapter it is proposed to study
to correlation betwe~ size and efficiency, for
efficiency is the sum total of the act ion of the
various factors that have been considered as consti
-tuting the size. Size and efficiency are interrelated
that is, the size is dependent on efficiency and
efficiency on size. Normally, the efficiency of
standard size is taken to be one and the relation
-ship between the variation in size and variation
in efficiency are studied. 1n this context, the
management could be considered as possessing stan
-dard efficiency if it utilises each one of the
factors of prod:qction to the fullest extent vis~a-vis
the size operated and produces maximum net margin.
It should be reTnembered that with increasing effi
-ciency, the manageable size may also increase.
But this situation is rather the exception when the
variation in efficiency has reached unity. When
the efficiency is unity, the size is considered
as one with standarrd efficiency. The quest ion
arises Whether efficiency could be increased and
with it the size. Here, normally, after standard
J

•
-139-
-~ efficienc1an increase in efficiency is not~ ea gy.
However some units may reach an ~fficiency greater
than the standard one if the management is of
exceptionally high calibre. The exceptional
·condition arises more out of individual conditions
of managem~t,S where the management is of a very
high calibre and attempts at higher and higher
level of efficiency are made. Everi then, there is
a limit, in as much as, even in industries there is
a stage at which the law of diminish~g retums
starts operating. Therefore, it is proposed to
study the normal correlation between efficiency
and size in competitive strutture of industry.
In normal parlance, efficiency is defined
either by dividends declared on subscribed capital
.or earning,S capacity or net margin or the reserves.
In the case of joint stock companies under the
managing agency sy stern, dividend is declared, not
alwaYs with a bearing on the capacity to declare
dividends, but very oft en depending on various
other factors of interest to the managing direc
-tors or managing agents. In as much as there is
no principle ih determining the :sate of dividend
to be declared, it becomes an unreliable index
of efficiency. The net rtiargin or the eaming
capacity could normally be an index of efficiency,
. I

-140-
~~ ~ but it is defined ~for/purposes. To
cite one instance, the place of commission as a
part of profit or cost, is disputed. The mana
-ging agents as well as the income tax authorities
consider it as a part of cost while the tariff board
considers it as a part of profits. Since 11:945,
the tariff board has been allowing 10% retum on
block value which according to it should be su
-fficient both for a reasonable dividend and for
adequate renru.neration to the managing agents.*
It might appear at the out set that it should not
matter and that whichever way it. is taken, if
consistently taken should satisfy the purpose.
The correlation between size and net margin is
studied taking the net margin, both before and
after providing the commission as part of the cost,
and is studied as· an index of efficiency. The
last possible definition of efficiency mentioned above,
namely reserves are also not satisfactory as a test
of efficiencYjas they are not prdvided on any basis
of any accepted principles. The reserves include,
for instance, depreciation fund and the contribution
towards it is different on different accounts. The
income tax authority may allow a particular level
but of the profits are inadequate the management

-141-
may set aside much less than what it should be
and possibly might contribute nothing in a par
-ticular year and they tnay wait until better
profits are earned, to contribute on a much larger
scale to meet the accul'm.l.lat ed arrears of provision
for depreciation. A consequence of this is that
in a boom period ~en the profits are high, accumulated
deficit contributions to the depreciation fund may be
contributed. Thus, with the variation in the levels
of contributions which are not statutory but are
more a tnatter of convenience, the reserves, of which
depreciation _fund cent ribut ion~s a substantial part
become an mrJtmrft:iirllx'i'llfi unretiable test of effi
-ciency. Thus all the three indices of efficiency
mentioned above are 'dnreliable and so bther possible . indices have to be considered.
'T'he l"'lore scientific indices would be the
productivity per loom, productivity of labour, i.e.,
man hour production or average costs of production.
Factors like productivity and costs which have a
bearing on efficiency are more reliable, but t~ere
are limit at ions for· the reliability of the first
two factors. "rhe data available is invariably
insufficient and sometimes not very rel,a'iable and
it is a difficult proposition to get even this data.

-142-
~en here the cost of major it erns alone would be a
dependable index rather than the total cost. As has
been mentioned earlier, the cost in respect of commiss
-ion, depreciation and taxes is variable but the cost
in respect of active factors of production cannot be
managed and therefmre are dependent on efficiency.
Fence a correlation between the ~otal cost~ as well
as the cost of the major items individually, viz.;
cotton, wages, stores, fuel, repairs on the one hand
and efficiency on the other hand woyld appear to be
more conclusive as a guide. <In the paragraphs follow
-ing, the cost on the 111ajor items if is examined with
a view to take in for correlation studies such of the
major itemsas might be dependable. - ..
The first major it em is the expenditure on
cotton, the chief raw l'l1ateriatl. It a'llounts to 49.36;t
of the total expenditure • The a'Ilount spent on
cotton per loom per shift is Rs. 15.01 Naturally, it
stands to reason that the major raw material s."'lould
be purchased at as cheap a rate as possible. It
shoul:d however be verified as to whether large units . are able to secure cotton at a cheaper rate, having
the advantage of economies of large scale buying • . Of course, when there is a case of buying in bulk,
there are advantages of getting better terms. Again
~ ~' ~+-~~,f4>gc
-143-
' the /.Larger fdrms can afford to employ expert
buyers, backed up by all the resources of scienti
-fic knowledge and equipment •* But, it is
-difficult to det er'nine to what e:xt ent this
econo~ is gained by large sized firms. Here
are some of the factocrs which deserve rnent ion.
The 'disadvantage of smaller units !'!laY b.e .~
off set, when the unit is managed by agents who
"'lanage a group of mills. They definitely can
afford to buy in bulk and can also afford the
servlces of an expert. And, again, in the case of · • Ah "'led a bad Mills particularly, we have seen that
less than two dozen families control most of the
units of the centre.
Yet another point that affects the cost
of the cotton to the mills, irrespective of the
size of the unit is the intelligent as well as
lucky purchases by the managing agents. In this
case size has nothing to do with the cost.
One small point remains to be mentioned
and it is that some of the mill agents themselves
are dealing in cotton business. Hence, ·irres
-pective of the size of the -nills, they being
well conversant with the cotton tnarket, are
l

-144-
generally in a well placed position for buying
cotton. The mills they "1anage nee"' not employ tech
-nical staff and experts for the purpose. Hence,
without any consideration of the size of the mills,
the units !YJ.anaged by such 'Ilill agents are alwaYs
at an advantage.
The last point is in regard to the s!'llall .
units having strong financial reserves. And there
are quite a few in .Ahmedabad, which can be. ascer
-tained from the statement appearing at the end of
Cha'Pt er VII. These units are surely at an advantage
dn the 'llatter of purchases. These gactors clearly
indicate the size is not the only factor which
deterrnines the purchase price of cotton .but various
uncounted factors plaY their part.
The next important it em of cost is the expen
-diture on salaries and wages. This it em a'llount s to
29.28~ of the total a'ilount of expenditure. The a11ount
spent on salaries and wages per l:loom per shift is
Roo .• · 8 .91. Econol'llies of large scale do accrue in case
of labour and supervisory· cost. The advantage of division
of labour accrues to larger units only. But, in the
case of cotton textile industry this carries little
weight • The reason for it is that, for qui1re a con
-siderable period, there has not been many technical

-145-
changes which offer scope for fUrther division of
labour. 'Wen a rnoderat e sized unit can, o·fcourse
upto a certain point, enjoy the advantage of division
of labour.
Of~ourse in the case of xaknr cost on super.
-visory starr, the larger units are better placed.
Certain of the posts do not depend upon the size of
the unit. ltlat....--ever be the size of the unit, within
li"'lits, the nu'1'!ber of posts will be identical. Bor
exa~le, units which differ in size ~pto a certain li~it,
will need each one an engineer, or a spinning master
or a weaving master and such others and these posts
will not increase in number for small variations in
size. Again, larger units can afford to engage
expert and highly trainer" techn"tcal staff, which
cannot be afforded by _small~r units. But, however,
in the case o.f small units under one group of mana
-gement, this disadvantage is eliminated.
The major part of this dltem of expenditure
consists of wages to labour. Tn the case of the
Ahmedabad centre, to which this study is 'nainly confin.ed, . ' 4.M we find that sizeLvery little to do with labour cost,S.
The reasons for this are numerous. The variations
in the size of units of machinery, is one of them;
for exal'l!p~e; in the warp and the weft ring frames

-146- '
the nu.'nber of spindles varies from 292 to 440 and
352 to :J[ 492 respectively. And, the number of
workers depends upon the number of machines and
not on the number of spindles. The type of rnachi
-ner.Y used is another disturbdng factor. For
example, mills equipped with mechanical steam
enlines, high J)ressure turbines,· and elect rifi
-cation plant for power generation have varying
number of workers irrespective of the size of the
units. Yet another reason is the variations
in the designing and technique of the machines;
for e~ample, the installation of easablanka and
double zone systems, high speed winding and
warping machines and such others. A more per
-tinent factor responsible for such variations
which does not depend upon the size of the unit
is the variations in the agreements with the
labour associations, and the resultant rationali
-sation of labour in the ring spinning and the
automatic loom shed depart rnent. All these points
have been discussed at length in the third chapter.
Hence we see that the size has very little effect
on labour cost, but has a definite effect on the
supervisory costs, excepting in the case of mills
under the same management. The Tariff Board has

-147-
remarked; "Bombay has sonte advantage as compared with
An~edabarand other upcountry centres in respect of
the salaries of supervisory staff and technical s~aff,
· §gain, owing in main, to the large size of BombaY
mills."*
The ne:xt item of cost in order of importance
is the expenditure on stores and chemic'als. It amounts
to 9 .07" of the total expenditure. The amount spent on
stores and chemicals per loom per shirt is Rs. 2.76. All
~hat is . said in respe~t of cotton holds good fo·r the . purchase of stores and chemicals. And one important
point is that the consurnpt ion of and the expenses on
stores and chemicals vary in main with the variation
in different finishing processes, such as bleaching,
dyeing of yarn and cloth, printing, mercerising and
· sanforising of cloth. Naturally, fewer the processed
goods manufactured, less are the expenses incurred on
the item of store~ and chemicals irrespective of the
size of the units,
The ne:xt it em of cost is the expenditure on
fuel. It amounts to 3.68% of the total cost. The
aiJlount spent on fuel p e·r loom per shift is Rs. 1.12
An import ant point to note is that different mills
use_different types of machinery for generating
power, wh-ich we have already discussed and so the
cost of this it em varies from mill to mill, in spite
*Report of the Indian Tariff Board on Cotton te:xtile industry, 1927, Volume I, P.l22
_j

-148-
of the fact thatfhe number of spindles and looms might
remain the same.
Yet anbther it e'll of expenditure ici the sum
, total of Minor it ems totalled as 'other expenses'. These
include brokerage .for cotton purchases, yarn sales
and purchases, cloth sales, waste sales, fees to
auditors, fees to directors, interest, 'vatav', tra
-velling expenses, stationdery and postal expenses,
insurance pre'!liurns and sundries. The amount spent on
these e:xoenses id R.:;. 0.95 per loom per shirt. This
a'!lounts to 3.12% of the total expenditure. Tt should '
however be noted that the expenses in regard to fees 1
to directors, fees to auditors, travelling expenses,
stationery and po.stal charges are not likely to in-
-crease or decrease with the increase or decrease I
in the size of the unit. 'l'bereas expenses in regard
to insurance, cornrnission and brokerage on cqtton
and yarn purchases, yarn, cloth and waste sales, are
likely to increase or decrease with the increase or
decrease in the size. But so far as there is varia
-tion in the rate of commission and brokerage of the
above items, the increase or decrease in expenses
in relation to size will not be in the same proportion.
Again, the policy, as far as insurance is concerned,
is also varying. There are mills wh.ich keep some of
J
-149-
the ris.'l{s uninSU:red .- Again, the insurance premiums
depend upon the stocks of raw material, stores and
che'!licals, cotton- and cloth. The variations in
stocks depend on the fluctuation~ in the market rl pric~ either raw '11aterials or finished products.
In the case of raw materials, a rising trend in the
market prices leads to stock piling with a view to
avail of the advantages of cheaper raw material,
at a future date, when the prices would be high.
In the case of finished product, there is a tendency
to hold stocks when the ·present trend in prices
is falling and there is an expectation of a turning
over in the reasonably near future. Ih the case
of rising prices of the· finished products also if
the expectation is one of a definite upward trend,
the stocks will be storeG for the highest price to
be r~ached. All these arguments become effective
only when·the ~anaging agents are intelligent and
speculative and can stand large expenditure ~ in
advance or wait for the sales for a considerable
time. And these conditions are very variable. And I
so far as these stocks vary, there are variations
in the insurance prel'l'liums, irrespective of the
sixe of the mills.
Cost on repairs to machinery and buildings

-150-
is the next it em of expenditure • It amounts to
pc. 0.59 per loom per shift. This is 1.94% of the
total cost. There are a couple of points in r"e
-gard to this item of expenditure which need be
noted. They are th'e age of the mills, and the po
-licy of the mills in renovating the machinery and '
buildings. The average age of the 49 mills under
exa'Tlination is 34.3. years. Out of these 49 rnills,
39 belonging to groups II, III, W, V and VI have
. an average age varying between 33 and 37 years.
Out of the re1'Tlaining 6 'Tlills, those of groups I
and X have an average age of 22 and 21· years re
-spectively. ,,tlereas 2 mills of group VIII and
other 2 of group XI are respectively of the
average age of 41 and 57 years.
We can see that' nearly 80% of mills under
exalilinat ion fall in the groups which have nearly
the same average age. Hence the variation under
this it em of· expenditure is not on account of any
difference in the age of the mills. Hence it
appears that .the variat'ion 1.n cost under this
ite'll is due to the other reason. The second
factor, viz. the policy of individual units in
regard to renovation of '"'lachine:ry and buildings

-151-
is very widely varying. There are some 111ills which
spend lavishly on "'laintenance and upkeep of their
plant and machinery and there are some Mills which
follow the reverse policy. They spend less on re
-pairs but are out to buy new plant and machinery.
And this is reflected in the figures in the state
-ment of co!'!Iplete cost structure given in appendix
II. ~he range of expensesraries from~. 0.44 to
'Rc. 1.02 per loom per shift, under this j it em. The
com111ission'·paid to managing agents, which is R~.
1.11 per loom per shift or 3.65% of the total ex
-"Pend1.ture is an i"!!portant item in, the real cost.
Tt is not considered as a nart of cost for certain . L.,..~ -
sp_Pcific ~. This, does not, in any wa:y, re-
-move the importance of this item of expenditure
asttpart of real cost to the mill company. Yet
another item of expenditure is depreciation. It
a~ount s to Rs. 0.59 per loom per shift, that is,
1.94% of the total expenses. The last it em income
-tax, though strictly not a part of cost, but an
o~! go to arrive at the net retum, amounts to Rs.
0.62 per loom per shift.
So far, we have exa"'lined all the it ems of
expenditure, detailed figures for every one of

-152-
which are shown in appendix I. 1-Tow, before
scrutinising the stat 1st ics of the entire average
cost st :MJcture, we should eliminate the variable
and non-dependable items for comparing the effects
of cost on size. Such items are,
( 1) colll"l'Jission to managing agents,
( ii) provision for depreciation,
(iii) provision for incometax.
Firstly in the case of the commission to
the managing agents, it is found that it is based
on varying standards. It l!aries any where between
3~ and 5~ on the a11ount of sales or in some cases
on the al'llount of production. There are certain
units which charge it at three pies per po'l!md of
yarn. 'T'h ere are yet others which charge commi
-!lsion on a basis of percentage on profits eamed.
All these have led to variations in the it em of
expenses on commission, irrespective of the size
of the units. FUrther, the managing agents have to
forego the whole or part of their due commission
~en ~he working bas not been quite profitable~~.__
Renee it is advisable to o!'!lit this fluctuatingtitem.
The figures for the provisions of deprecia
-tion are also non-dependable for this purpose. The
varving practices in charging depreciation has
been responsible for this. Some units charg~ it
'

•
-153-
fully, all that is due. Some charge only partially
and allow it to accumulate until periods of good
profits co'lle. .Again, the amount of depre~iation
not only depends on the size of the units but it
depends on the age of the buildings and machinery •
A small 'Ylill with 'Tiostly new machinery may have to
provide for a far larg.e amount of depreciation than
a co~arst ively bi~ger mill which has old machinery.
'f-Tence, factors other than size of the unit influ
-ence the arnount of provision for depreciation
a.nd so, it is not advisable to use these figures
for the purpose of correlat jng size and cost.
Jn the case of provisions for incometax
the actual payment is rather delayed and the mills
have to maintain a fund for this purpose. ·Some
-times this fund is very large. Again, if the
mills feel that the provision is sdfficient for
the Year in review, they do not make any further
provision to that fund in that. Year, even though
the mills had eamed profits and have to pay incom9"tax
for the year. This could be seen in the statement
of COY!lJ:llete cost structure of 11ills·in appendix I.
· It is quite clear that, because of the reasons
mentioned above, we should study the figures of
expenditure on cotton, wages, stores, fuel, other

-154-
tnisc ellaneous it ems and machinery & building repairs
while studying correlation between size and costs.
As discussed before, little variations do exist even
tn the case of these items as well, but as inferences
· arw to be ·drawn on the basis of groll:p averages, the
individual rrregularity and distortions will be evened
out.
In the re'Tlaining portion of this chapter it
is pcroposed to study all the indices individually
and jointly and arrive at a correlation between size
and eff;f.ciency. In gpit e of limit at ions of the
various indices every index is studied. It will be
observed that even in the case of unreliable indices,
the general trend of the sa"ne nature is visible. The
fo~1owing is the statement of profits per loom in
the various units grouped according to their sizes.
statement overleaf

-155-
5 : 27 stat e'nent showing profits per loom in jhmedabad in 1949 *
I 1- 799
II 800- 999
ITT 1000-1199
'N 1200-13~9
v 1400-1599
VI 1600-1799
VII 1800-1999
VITI 2000-2199
IX 2200-2399
X 2400-2599
XI 2600 & over
Ol M r-t or-1 9
IH 0 •
0 z
3
4
12
9
8
6
4
2
2
2
22 .81
37 - 1.72
35 1.94
33 2.21.
33 1.55
34 2.31
41
21
57
.80-
3.10
3.30
1.64
2.96
3.09
3.39
2.73
3.38
.87
4.53
4.40
A study of profits including and excluding
commission as a part of cost, as shown in the above
stat ernent is fairly interesting. It has been dis
-cussed earlier as to what exactly is the difference
*Based on published balance sheets, year 1949

!' I

-156-
between the two. The trend of profit.s per loom in
-cluding commission as part of cost shows that the \
order of efficiency is group XI with over 2600 looms,
group X with 2400-2599 looms, group VI having 1600-
1799 looms, group IT having 1200-1399 looms and the
order of least efficiency is group I with 1-~9 looms
and group VIII with 2000-2199 looms.
An analysis of the data in the statement
above shows that there is a definite periodicity in the
trend of profits. Groups IT with 1200-1399 looms,
YI having 1600-1799 looms, X having 2400-2599 looms
indicate peak points. Group V having 1400-1599
looms and VIII having 2000-2199 looms indicate the
t~roughs; ~hat is, the low points. The graph ot
profits shows in marked relief, the steep fall in
the case of the group VIII with 2000-2199 looms
and this fall is not due to the size which is between
two cyclical points of economic size, but due to
so~me other ext !aneous factors. The cyclical points
"f. are 1200, 1600, 2000, 2400 and so on. An examina
-tion of the conditions of operation of these units
included in group VIII having 2000-2199 looms bear
out this argument. Unreliable as it is, if this
group is elimin'!tt.ed from considerations,.Atill a
periodicity is indicated. But that the trend is

-157-
a rising one is also observable. Because there is
no sa'llple beyond group XI of 2600 and over looms, it
is difficult to saY, whether the trough point beyond
group X having 2400-2599 looms is higher than the
earlier trough points. Group XI having 2600 and over
looms has only two units and group XI is not of the
same class interval, but included aY classes beyond
2600 looms. The two units, if studied individually,
show that they belong to widely varying sizes. And
taken even individually, there is no turning point
at these units and therefore, we cannot saY at what
level the next trough point would be, but we maY infer
that it might be at a level higher than the earlier
troug~ point ~dicated by group V having 1400-1599
looms. This analysis and inference thereof are not ' .
very dep.endable1 for without reference to all expen
-d:tture incurred for earning these profits, profits
can never be an index for comparative purposes. The
absolute profits do not reflect the risk involvecJ,
and the capital invested as also the utilisation of
plant and machinery for earning these profits.
Therefore, the better index of efficiency would be a
ratio of profits to either production or total
costs. The statement below gives the ratio of percen
-tage of profits to production.
statement overleaf

-158-
5 : 28 statement showing the ratio of per~entage or profits to product ion per loom in
[illmed~bad in 1949 * Group Working looms No.or Age· of % ratio of % ratio or
'!\To • per daY mills mills balance profits ba-sheet pro- · -sed on pro -fits to -duction ' production cost to
l2 roduct ion
I . 1-799 4 22 2.64 s.oo II 800-999 12 37 5.55 9.55
III 1000-1199 9 35 6.05 9.70
"N 1200-1399 8 33 6.28 9.55
v 1400-1599 6 33 4.72 8.17
VI 1600-1799 4 34 7.41 10.83
VII 1800-1999
VIII 2000-2199 2 41 2.75 3.03
IX 2200-2399
X 2400-2599 2 21 9.30 13.52
XI 2600 & over 2 57 8.94 12.09 ----------~-------------------------------------------------
'I'h e statement gives the ratio of percentage or
profit per loom to the product ion per loom. One is based
on the profits which includes ~x~~~ commission as .ipart
of costs and the other which does not. Either way, the
trend is the same. Jn both the cases, the periodicity
is. the same except that, when the commission is includ
•ed as a part of cost, the efficiency index is inter-
*Based on published balance sheets year 1949

-159-
-changed between group III and TV having 1000-1199 and
lro0-1399 looms respectively. The periodicity is almost
similar to what we found in the case of absolute profit
per loom except for the variation that in the case of
absolute profits groups ~I having 2600 and over- looms
was better than group X having 2400 to 2599 looms, vbile
when we take the ratios, group X is definitelY better.
This variation between groups X and XI conveys very
insignificant inference in as ~uch as there are hardly
two samples in each of them and again the sizes of the
two samples in group XI ame very widely different. If
the two sarnples in group iCI are taken as two indepen-
state!Ilent overleaf ,
-160-
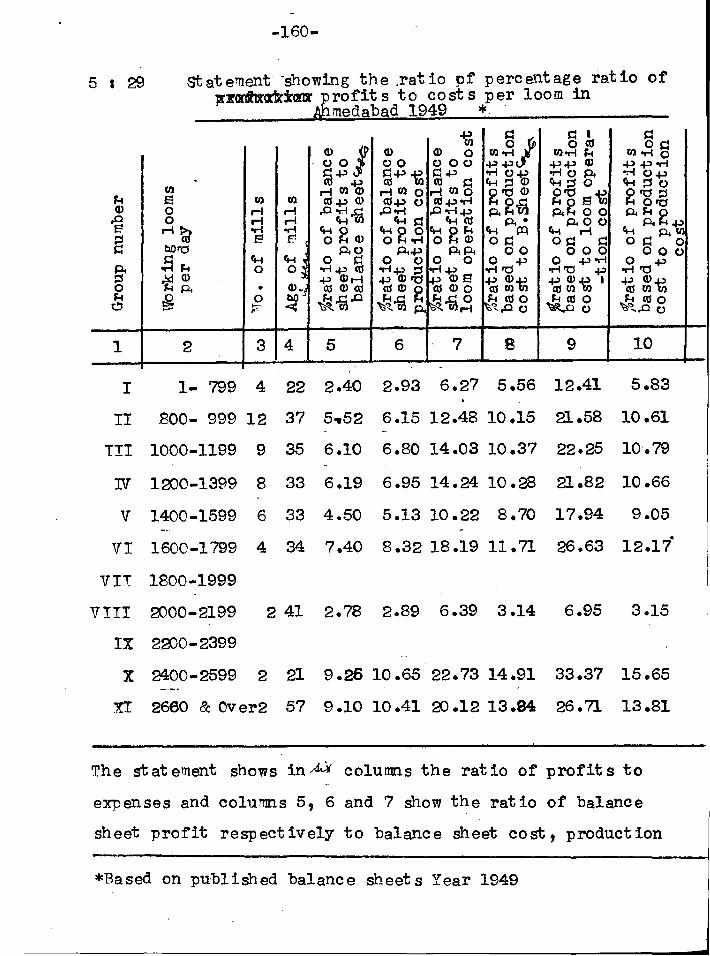
5 : 29 statement· -showing the .ratio pf percentage ratio of ]!':rcrflltd'icrtr profits to costs per loom in
Ahmedabad 1949 *
1
I
I'll r-1 r-1 ...-1 E!
ft..t 0
•
3 4 5 6 7 9
1- 799 4 22 2.40 2.93 6.27 5.56 12.41
10
5.83
rr Boo- 999 12 37 5~52 6.15 12.48 10.15 21.ss 10.61
TIT 1000-1199 9 35 6.10 6.80 14.03 10.37 22.25 10.79
"N 1200-1399 8 33 6.19 6.95 14.24 10.28 21.82 10.66
v 1400-1599 6 33 4.50 5.13 10.22 8.70 17.94 9.05
VI 1600-1799 4 34 7.40 8.32 18.19 11.71 26.63 12.1?"
VII. 1800-1999
VIII 2000-2199
IX 2200-2399
2 41 2.78 2.89 6.39 3.14 6.95 3.15
X 2400-2599 2 21 9.26 10.65 22.73 14.91 33.37 15.65
XI 2660 & Over2 57 9.10 10.41 20.12 13.94 26.71 13.81
The statement shows in 4-X columns the ratio of profits to
expenses and columns 5, 6 and 7 show the ratio of balance
sheet profit respectively to balance sheet cost, production
*Based on published balance sheets Year 1949

j .ll
'-:\· ··•.\\
•" r
l i'

-161-
cost and loom operation cost·. All the six columns
show practically the sa"le trend with the first three
ranks of efficiency. In the case of ratios of
balance sheet profits to costs, group T!l gets the
fourth rank, whiie in the case of ratios of product ion
profits to costs, group III gets the fourth rank. The
efficiency rank i_s groups X, XI and VI having ~0-2599,
2600 and over and 1200-1399 looms respectively 1n de
-cending order of efficiency. The last two, least
efficient are., no doubt, groups I and VIII having
1-799 and 2000 to 2199 looms respectively, group I being ~
least efficient if bala"t9ejprofit s are considered
and when profits based on production cost are consider
-ed, group VIII appears to be the least efficient.
This analysis also confirms the trend that has been ' ' ~
indicated in the earlier analyses.
So far, the earning capacity has been con
-sidered, and as an index of efficiency, it has been
found that it is not exclusively conclusive though
it revels a particular trend. As it has been said
earlier, more scientific index should be production
with reference either to the unit of machinery or
unit of labour. :rn either case, we could study
production in quantity or production in value.
Production in quantity has its own limitations

-162-
in the textile industry, in· that the quality and the
construction of production is not identical. Almost
every unit has a number of variable varieties of production.
Therefore, a comparison on this bas's becomes incorrect
when comparable data is meagre. The comparison cannot
be taken over the entire sample of our studY. There-
-fore it appears that it would be safer to go ·by value
of product ion~ Then every variation in quality will
have its •Wn repercussion ~n value and the quantity
being dependent on the different processes and quality,
these will be reflected in their proper posit ion.
The statement below shows the productivity. per loom
in rupees.
statement overleaf
I

----
-163-
5 :30 statement showing value of production per loom in rupees in Agmedabad 1949 *
Group Working looms 1\To .of Age of Production per No. per daY rnill s mills loom in Rs.
I 1- 799 4 22 30.69
II 800- 999 12 37 31.01
III 1000-1199 9 35 32.06
IV lroo-1399 8 33 35.21
v 1400-1599 6 33 32.82
VI 1600-1799 4 34 31.88
VII 1800-1999
VIII rooo-2199 2 41 29.11
IX 2roo-2399
X 2400-2599 2 21 33.35
XI 2600 & over 2 57 36.90
*Based on published bala'lce sheets 1949

A study of the above figures show~that
group XI having 2600 and oir'er looms has the highest
productivity, which is closely followed by group W
having lro0-1399 looms. The third place in order
of rank goes to group X having 2400-2599 looms.
Groups V and III having 1400-1599 and 1000-1199
looms respectively, follow ne:xt. The least effi
-cient groups are I and VIII having 1 to 799 and
'/ ro00-2199 looms respectively, group VIII being the
worse of the two. The production index shows a
slightly varying trend than was shown by the earli
---er indices. Fere, there are certain factors in-
-herent to the data which seem to distort the
trend to a s~all extent. The different variable
processes, particularly the finishing processes
and the different constructions of cloth invaria-
-bly affect the results. If you could get the
Yardage at the grey stage and reruce them to a
standard construct ion and evaluate the produc-
-t ion, then it would be a very good index of
efficiency. But, such data is not easily availa
-ble. It is not absolutely impossible to get the
data in as nru.ch as the primary docu11ent s are alwaYs
available with the units. From the primary documents,

-165-
the requisite data can be worked out, but they would
not be available wxcept at the authdratat ive level
of the government. Therefore, the product ion figures
actually available cannot give us a sufficient basis
for our study and there are possibilities of dis
-tortions reflected in the trend.
Labour productivity is even more elusive.
'P'ere, unless the data could be worked out on a scienti
-fic basis, no doubt, in terms of value, it can t:lever
be indicative of any results. In this case, the data
is not available and to standardise it on a
scientific basis is next tci impossible under the
existing conditions of operation of this industry.
Though theoretically, this is one of the scientific
indices, we are unable to apply this index to
test effie iency level.
Efficiency is better determined by costs.
It is therefore, that we said that cost would be
one of the most scientific of indices of efficiency
and :tt is directly correlated to size. v.hiile
studying costs, with reference to size, we should
normally take J.Ip the total costs. But,~ in the
cottr:'n textile i_ndustry, as it exists todaY, it
would not be correct to take the total costs for
-166-
reasons mentioned already. In many or the units,
the it ems of co!'Ylmission, depreciation and income ..
-tax are guided by individual decisions of the
managing agents of the units than by specific
or scientific rules• The other items of e:xpen
-diture which go to rnake up the production cost
are fairly dependable •. Therefore, it is nece
-ssary to confirm the analysis of observations
from product ion costs by an analysis of observa
-tions from loom operation costs. These two
together will give us a fairly reliable index
of efficiency, vis-a-vis the size. The state
-ment below shows the total costs and the
product ion costs.
stat etnent overleaf

-167-
5 : 31 statement showi_ng product ion costs and total costs pre in rupees per loom Ab.medabgd 1949 *
1 2
I 1- 799
• 0 z
3
4
4
22
5
~.03
§ .., I'll til .., E' E! 0 0
6
.83
II ~oo- 999 12 37 28.os 1.24
III 1000-1199 9 35 28.94 1.15
IV 1200-1399 8 33 31.80 1.18
v 1400-1599 6 33 31.01 1.18
VI 1600-1799 4 34 27.81 1.07
VII 1800-1999
VIII 2000-2199
IX 2200-2399
X 2400-2599
2 41 28.23 .07
2 21 28.81 1.43
XI 2600 & over 2 57 32 .so 1.10
7
.46
.66
.55
.73
.72
.47
.27
"< a:l
) CD E 0 0
~
8
.23
9
30.57
.61 30.56
• '71 31.30
.63 34.34
.58 32.49
.65 30 .oo
.19 28.76
.37 1.45
.73 .83 35.16
The stat,ement above shows the production costs,
commission, depreciation, incometax and the total costs
pwr loom in rupees. The production costs are built up
of costs on (1) cotton, (2) wages, (3) stores, (4)
fuel, (5) repairs and (6) other miscellanious.items
*Based on published balance sheets 1949
_ _j

-168-
of expenditure. An examination of the total costs
reveals that group VIII having 2000-2199 looms shows
the_least costs, groups VI, II and I having 1600-1'799,
800.999 and 1.799 looms respectively, following in
the second, third and fourth ranks. From what :Uas
been analysed so far, the trend appears to be high
-ly distorter". An e:xaminat ion of figures under
com.,.,_ission, depreciation and incometax reveals the
'Tlajor reasons for the distort ion. The average
expendtture on these three it ems has been very small
in the case of group VIII having g)00-2199 looms.
Therefore 1the total costs of this group becomes non
-dependable for comparison. Si>nilarly, in the
case of group I having 1-799 looms which takes the
fourth rank, figures for these three it ems are ltd
very low. In view of these observations, total
costs as such do not canst itut e a proper index. So
it is reasonable to consider the product ion costs
as an index of efficiency. An analysis of this
column showing product ion costs shows that group
VI having 1600-1799 looms has the lowest cost,
group II has the next lowest and group VIII and X
having 2000-2199, and 2400-2599 looms respectively,
follow on. The group VIII produces the cheapest
qual:i.:_ty as could be evidenced from the production
char,.et shown in the earlier statement ~:o. 5-: 30
·I
J
-169-
(i.e.~· 29.11 per loom) Therefore, if we -eliminate
group VITI, the group X having 2400-2599 looms takes the
th.i.rd rank. The trend is that group VI leads with
group II following as number two and group X as number
three. The trend is a bit surprising and appears ·'
to show that the group having 1600-1799 looms iB most
efficient while the next in efficiency is a smaller
group with 800-999 looms. The ne:A-t best is the group
with 2400-2599 looms. But, what ever it is, the
absolute cost without relation to product ion value
has its own limit at ions and therefore, such freaks
would be eXJ)lained. It is very likely that mills
producing costlier varieties of cloth will have
higher average costs per loom in spite of the units
being vetwy efficient and similarly in the converse,
it is quite likely that least efficient units manu
-facturing cheaper varieties rnay have a lower cost
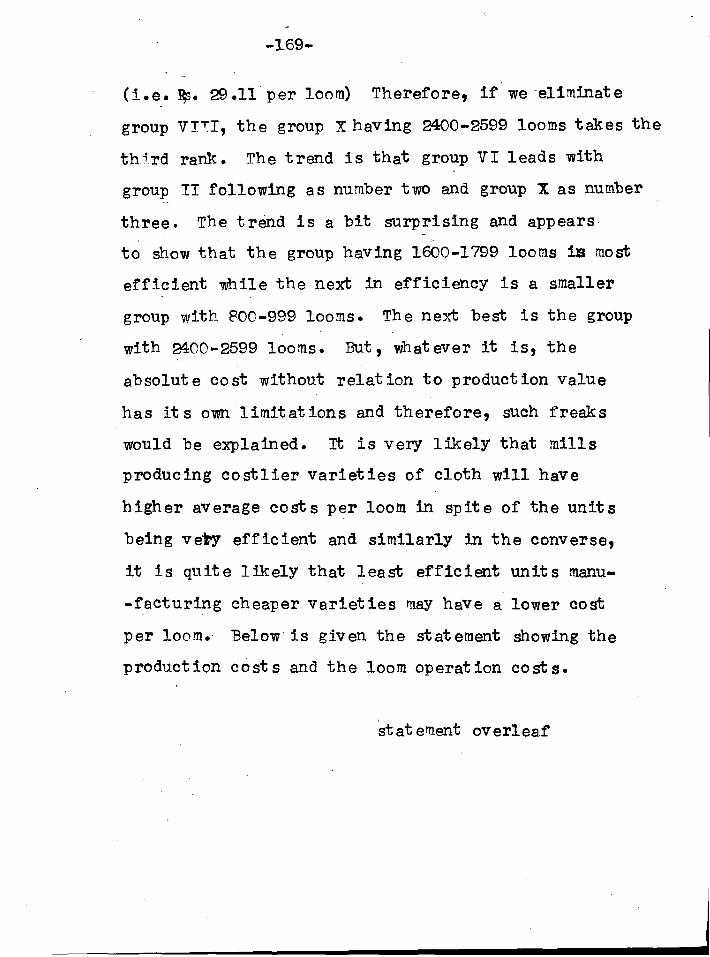
per loom. Below· is given the statement showing the
production costs and the loom operation costs.
stat ernent overleaf
-170-
5 : 32 statement showing product ion and loo 'l1 op erat ion,S costs in A('rned~b~d 1949 *
Group ,orking "To .or .Age of ~Vages stores FUel Repairs Other Loon Cotton Pro due-. 1\To. looms mills mills items opel -tion per daY of ex- t ior costs
penses cost
! 2 ~ 4 5 ~ ? s g !o !! 12
I 1- 799 4 22 8.82 2.19 1.20 .52 1.04 13.7• 15.29 29.03
II 800- 999 12 37 8.55 2.65 1.06 .48 1.04 13.7l 14.27 28.05
· ITT 1000-1199 9 35 8.67 2.74 1.18 .51 .92 14.1~ 14.84 28.94
N 1200-1399 8 33 9.44 3.52 1.19 .67 .97 15.?. 16.02 31.80
v 1400-1599 6 33 9.45 2.76 1.16 .76 1.06 15.1! 14.82 30.01
VI 1600-1799 4 34 8.48 2.21 .94 .62 .52 12.6 15.14 27.81
VII 1800-1999
VITI roo0--2199 2 41 9.03 1.81 .90 .44 1.12 13.3 14.92 28.23
IX 2200-2399
X: 2400-2599 2 21 8.58 2.23 .95 1.02 .73 13.4 15.32 28.81
XI 2600 Pc Over 2 57 9.73 4.19 1.44 .62 .33 16.? 15.72 32.50
*Based on published balance sheets year 1949

\
-171-
An analysts of production costs shows a new
set of results, quite "different from those observed
in the earlier analYses. The first four ranks fall
to groups VI, II, VIII and X, having 1600-1799, 800-
_ggg, roo0 .. 2199 and 2400-2599 looms respectively.
Ranks itx~ second and third go to the groups II
and VIII which groups do not appear in the first
four ranks 'in the earlier analysts. The reason
is not far to seek. An exa~ination of the expen
-diture on cotton shows that these have a low
cost of cotton. !\Text stage in the examination is
to find out the quality of product ion of the units
.constituting ,thes_e groups. The indication of the
trend of per loom cost of these groups is that
they should be using the cheaper local quality
of cotton and ~hat they should be producing coar
-ser varieties. lTnit by unit analysis reveals that
the prestimpt ion is not incorrect. Therefore, the
absolute per loom production cost is not a real
index of_ efficiency by it self, for· there is no
weightage for different varieties of cotton used
or the different kinds of cloth produced. If
such weights could be obtained and the correction
ap:olied then production cost would be a correct
index. It is very difficult to g-et the real

-172-
weight age as it is one of the trade secrets. There
-fore,_ the index of product ion costs becQmes unre-
-liable. This leads to a study of loom operation
costs ·which consists of expenses on wages, stores,
fuel, repairs and other miscellaneous ite:ns. Here
again, the analysis of trend of ranks shows surpris
-ing results. The earlier trend is not reflected
in its entirety. The second and fourth places are
taken by groups VIII and I with 2000-2199 and 1-799
looms respectively. An analysis of individual cost
of these two. groups shows that their stores and fuel
costs are low. It appears that the reason for
such low cost on stores and fuel might be due t6 the
absence of the finishing processes and this is very
likelY regponsible for the low loom operation costs.
Actually, labo,,r costs in group..S VITI are fairly
high and are not very low in group I. The cost on
repairs is very negligible and will not,.therefore,
seriously affect the total costs.
The examination so far reveals that absolute
per loom cost shows a trend which is not consistent
w~t~ ~?e __ t rend observed in the earlier analy see with
reference to different criteria. This leads us to
examine the reasons for such a variation. The

-173-
reason is not far to see1(. The cost depends on the
quality produced and has therefore, reference to
quality of product ion. Hence the absolute cost,
as has earlier been eXPlained, is not co!'llparable.
rr,however, the ~cost is examined with
reference to the production .value, the result~
might be more dependable. Beww is shown the
ratio of costs and production.
stat ernent overleaf

-174-
5 : 33 stat el!lent showing ratio of costs to produc-tion in T'ercentages - A"'lmedabad 1949- *
1 2
CI-t 0
• 0 :c:
3
fJl r-1 r-1 .,; E1
CI-t 0
4 5 6
0 ~Q)
Efll~ O~r-1 Ollla1
r-1 0 > ()
CI-t ~ 0~0
0..-1 0..-l~ ..-!~()
~ f!.S F-IG>O
""""' p..~ ,,._ 0 p..
7 8
I 1- 799 4 22 94.8 97.60 44.8 99.69
II 800- 999 12 37 90.4 94.48 44.1 98.48
III 1000-1199
IV 1200-1399
v 1400-1599
VI 1600-1799 . VII 1800-1999
9
8
6
4
35 90.1 93.90 43.9 97.70
33 90·.3 93.81 44.8 97.61
33 91.8 95.47 46.2 99.31
34 89~4 92.60 40.7 96.23
VIII lCl00-2199 9- 41 96.8 97.22 45.7 98.80
IX 2200-2399
X 2400-2599
XI 2600 and over
2 21 86.7 90.80 40.5 96.17
2 57 87.9 90.90 45.5 95.09
The ratios could be worked out between total
costs and production, balance sheet cost.s and
production, production costs and production, or
loom operation costs and production. The analysis
*Based on published ba1a:rmce sheets 1949
•
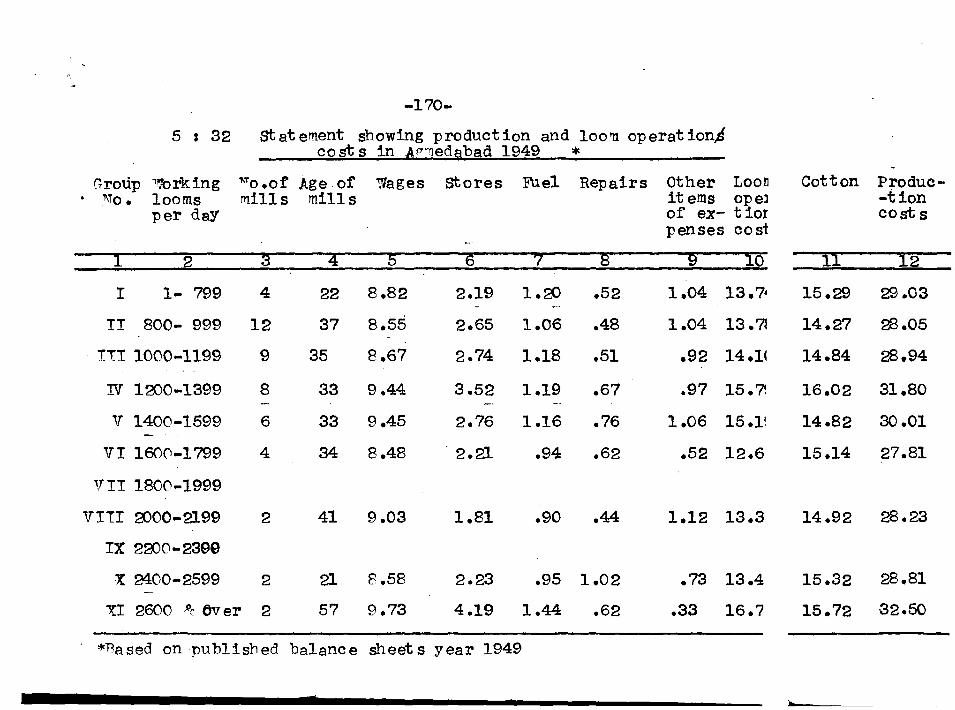
-175-
of the ratio of total costs to product ion shows group
~I, with 2600 and over looms in the first rank,
group X with 2400-2599 looms in the second rank,
groups VI and TV h~ving 1600-1799 and 1000-1399
loorns respect ~vely, in the third and fourth ranks •.
The ratio of balance sheet profits to product ion
gives the ranks to 1 to 4 in the order to groups
X, U, VI and "N. The production costs gives
almost the sa"ne rank, except that :in the fourth rank,
group III gets :in instead ·or group r:t. In the
case of loom operation costs, group X again takes
the first place with groups VI and ITT in the
second and third places and group II in the fourth place.
Taking all these four ratios consolidated, it is
clear that group X takes the first place while
group XI and VI take the second and the third
places respectively •. And the fourth t'lace is taken
by group W in two cases and groups II and III
once each, but group III takes the third place once. . -
The over all picture places group X with 2400-2599
loo'7ls at the first rank, XI ~ith 2600 and over looms
and group VI with 1600-1799 looms in the second and
the third ranks and group TV with lro0-1399 looms
and group Iri with 1000-1199 looms share the fourth . rank. The weightage, however small, is for group III • .It ~~ ~ ~ ~ ~ ~<?A- .t.. .M~ ~ ~ <Ut. •.
,tk~ ~~ ~ .ft,-~l<u-v·~Ll ~~~~~ ~t\-~~4~ ~Joa-tL-!L~.
~w..¥ crv~ j

1
I
II
2
-176-
• 0 ~
3
1- '799 4. 22
800· 999 12 37
III 1000-1199 9 35
IV 1200-1399 8 33
v 1400-1599 6 33
VI 1600-1799 4 34
.VII 1800·1999
VIII rooo-2199 2 41
IX 2200ro 2899
X 2100-2599 2 21
XI 2600 & over 2 57
5 I 34 : 1 stat ement showing t production' profits
· costs -
5 6 7
2.40 ·2.93
5.52 6.15 12.48
6.10 6.80 14.03
6.19 6.95 14.24
4.50 5.13 10.22
7~40 8.32 18.19
6.39
8
s.oo 9.55
9.70
9.55
8.17
10.83
3.03
9 .ro 10 .es 22.73 _ 1s .• s2
9.1o 10.41 ao.12 12.09
9
94.8 l'l- A
90.1
90.]
90.-1
91.8
89.4
96.E
86.7
87 .s
*Based on publiShed.balance Sheets, 1949
J

-177-
percentage ratios of costs to ) product ion 1edabad 1949
I
·~~ rca o s .0 0'1""1 . ..., 'H~() 0 Q) ::s . G>'O ~i2 ~G>A ~00 . ...,
10
97.60
94.48
93.90
93.81
95.47
92.00
97.22
90.80
90.90
and profits to -. *'
Cll ...,. ..-to '-1~0 2'0""'e p.202~ "" ~-i 02 oco ~
QC)Q)fll 0 00 or~ros:::io ..., Q) 0
QS Cll ori r-1
~ "'""' "' .01.0
11
5.56
10.15
10.37
19.2.8
8.70
11.71
3.14
14.91
13.34
I
Cll 2 .f.'IP.• 'I""'G Cll '-1~0~ f!'ts..., A2 fa g
'H A~ C 0 c 0 o.
00'1""1
~'iS::~ ~02~.g ~.pI I .
12
5.83
10.61
10.79
10.66
9.05
12.17
3.15
15.65
13.81
s Cllori ..., ..., ..
..... C) fll ' "" ~ ~ 2'0S 200 A oo '-! Ar-t C . 0 c 0 0
Oof.'--rl ~ ro 02~ .p Q)~ F-4 cu Cll (1)
~CGOA .0C>Il4
.13
12.41
21..59
22·25
21.82
17.94
26.63
6.95
33.3i
26.'71
Q)
00
i""' '«<CI) .0~~
'-10 1M2'" 0 ...,
AO 0 ,a .,....,., ~~2 ~iA
14
2.64
5.55
6.05
6.28
4.72
7.41
2.75
9.30
8.94
...
t s A ori 00 'Qj~ a""' "'5.6 002 ~~3 ""'2
Oor-1 '-lA 'HOof.' 0 0 () 0 . c ::s Oof.' o ore ori
'orf.,... 2 .f.)02 ~~ ~...,
F-tt!A ~g ~I
15 16
44.8 . 99.69
44.1 98.48
43.9 97.70
44.8 97.61
46.2 99.31
40.7 . 96.23
·' 45.7 I 98.81
40.5 96.17
45.5 95.09


-178-
5 I 34 I 2
5 6
( i) X X
( ii ) XI tt •
( 111) VI VI
( iv) IV IV
( v) III III
( vi) II II
( vii) v v
(viii) VIII I
( ix) I VIII
·s 1 34 I 3
( 1)
( 1i) -( iii) . -( iv)
( v)
( .vi) 1
( vii)
(viii) 6
( ix) s
5:34:4
statement showing t different st d rds
7 8 9
X X X
XI XI XI
VI VI VI
~ 1V III III
III 1V IV
II II II
v v v
VIII I I
I VIII VIII
ment of fre
-·1
11
III
-1
5
6
-
~ ( i) ( ii) ( iii) ( iv) ( v) ( vi) ( vii) .(viii)
( ix)
G r o u
6
6
-. -
t
number of credits based on measgring efficisgcy
11 12. 13
~ X X X ~
XI n VI
VI· VI· XI
III III III
[ IV 1V IV
[ II II II
r v ,v v [. I -I .I
I VIII VIII VIII
tlCY or ranks
Nu mb e r VI VII
§ VI!I
2 '-10 -- -
--
.. -
nt or r@a
--
1
5
.6
Group X
XI 'J/I
N III II ·v I
VIII
-179- •
14 15 16
X X XI
XI VI X
VI III #I
1JI II N·
III IV. III
II I II
v XI. VIII
VIII VIII v I v I
·IX X XI f
11 1
1 9
·- - 1
- -... -
- 1
'!"'
- - -
..
.,

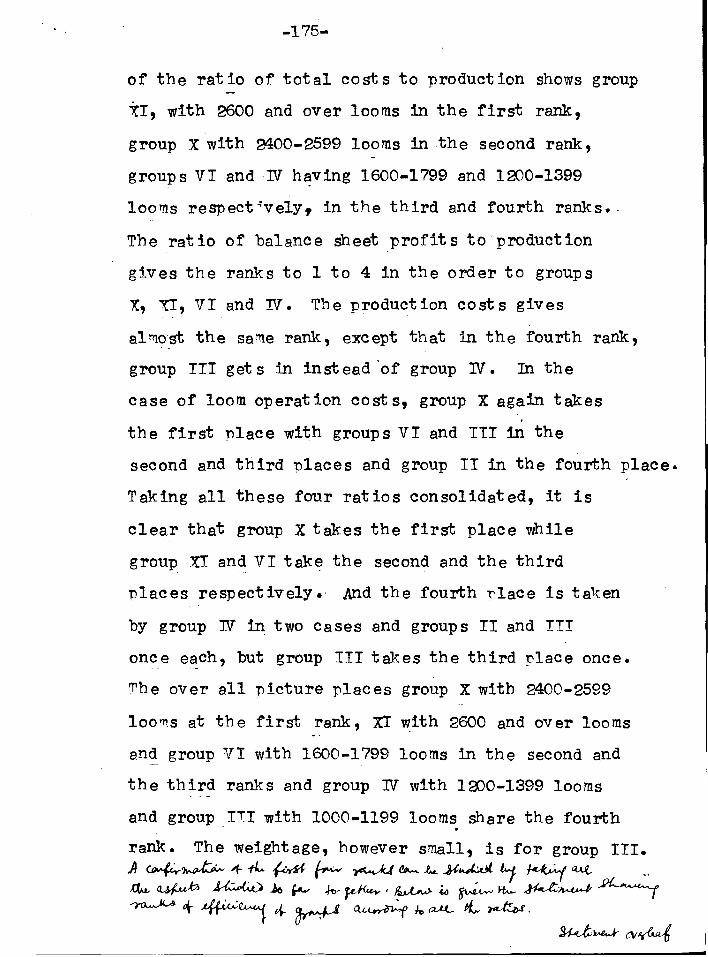
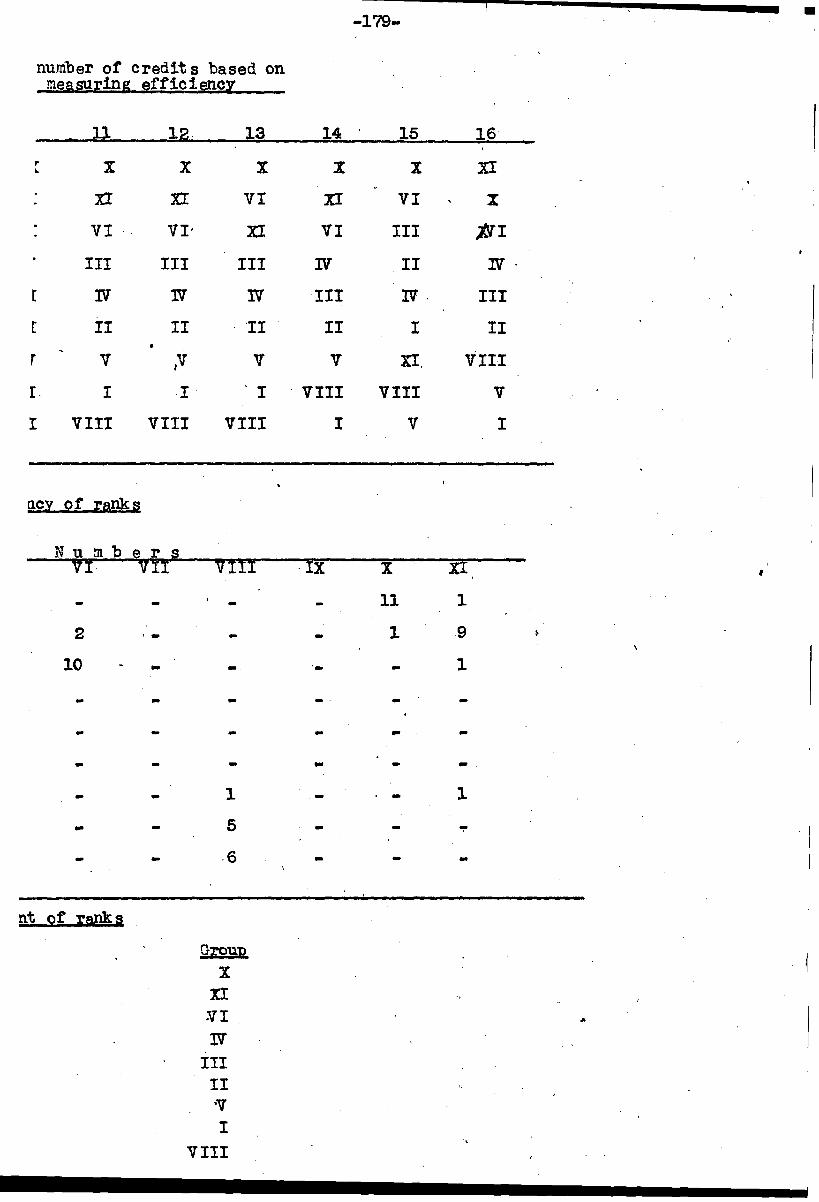
-180-
The twelve ratios have been worked out, four
relating. to costs and product ion, two relating to
profits and production, and six :r;elating to profits
and costs. Having worked out the ratios the ranks are
tabulated in the two-waY statement,S No. 5s34:2 showing
the number of times a particular rank is obtained
by each or the eleven group~. A study of the state
·~ent brings ouw prominen~ly groups X having 2400 ... 2599
looms, XI with 2600 and over looms, VI with 1600-1 '799
looms, II with 800 ... 999 looms, and V with 1400-1599
looms, each of them with well over 75% of the credits
in a particular rank. Groups X, XI and VI take the ~ .
;f'irst three ranks,igroups II and.V take the sixth and
seventh rank respectively. Groups III and IV with
1000-1199 and 1200-1399 looms t-espect ively rival
between themselves for the fourth and the fifth
ranks, while groups I and VIII with 1-799 and 2000-
.. £199 loolns respectively rival between themselves
for the eighth and the ninth ranks.
Having decided upon the first three ranks
undisput·edly between groups x, XI and VI the question
of fourth and fifth ranks have been examined in
detail because the ~race between ~ groups III and
·!Jl has been almost neck to neck. Group III gets
once rank three, five times rank four, and six times

-181-
rank fiVeJ while group rl get 1six times each ranks
fourth and f'itth. The tact that in one out or
twelve cases group III gets the third rank give
the strength or argument for t;,lac ing group III 1n
rank four. But the weighted average :ln the percen
-tage variation between the two groups clarifies
the position and shows that the ·mere attaining
or the third rank once does not give group III
the better right of being placed in rank four.
Therefore, we have placed group rl as the- fourth
in rank and group III as firth :ln rank.
Rank six and seven are distinctly occupied
by groups II and V respectively with eleven credits and
1l1r ten credits :ln those ranks. Again tor the eighth
and the ninth places there is a tie between groups
I and VIII; but a closer examination shows that
group I getting rank six once, rank eight six times
and rank nine five times is better' eligible for
rank eight than group VII which gets rank seven
once, rank eight five times and rank nine six
times. The actual ranks or the different groups
is shown in the statement of merits, 5s34:4.
The above anal~sis based on ranking vis-a-vis . ~ the twelve ratios has shown dipt inct ively that
group X with 2400-2599 looms is of the optimum

size among the samples studieq. The next higher
group, which is defined as 2600 and over looms, . ,
consists of only two units, one of them hav:1ng
2762 looms and the other 4604 looms. And because
there is a wide variation between the results of til• .
the units, on the average the group loses its
place to group x. If we had alrger number of
samples in group XI and also samples of large
sizesJin proper multiples of 400 looms, we would
have seen that the level or op-t-imum would be better
and better. The one unit whose loomage is in the
neighbourhood or 2800 shows a trend to be better
than group x, but dt cannot be accepted because
it would be an inference on the basis of a single
unit. This has led to the inference that the
best size from the observed facts is that or
group X as has been already 1ndicat ed.
The analysis further shows that the de
-gree of economy or operation places groups VI
and IV next in order, showing a periodicity of
400 with a break at the ltevel or 2000-2199 looms,
that is, group VIII. The disturbance in the
periodieity~t the level of this group is due to
the tact, as has been earlier explained, that the

-183-
average age of the group is high, and that there
are fewer fdnishing plants in the units of this
group. Further this group has only two samples
worked at diffe.rent levels of efficiency. .Had
there been sufficient samples, better indica-
.. t ions :WOuld have been observed. The analysis
shows the periodicity of economic levels start
·ing from 800 looms right upto 2400 looms at
intervals of 400 looms. The group below 800
looms is on the margin whose ratio of total
costs to product ion is 99.69 -..h.ich leaves prac
-t.ically no margin even under the controlled
economy which ensures by statutory provision
an accepted margin to every unit in operation in-
where the management is not/efficienc7t.
Therefore, this last group, that isJ group I
will tend to be unecononic under normal con
·ditions of operation of this indust,_.,.. The
marginal unit lies in the group having below
800 looms. The group just above the marginal
unit, therefore, should be taken to represent
the economic size. The analysis shows that
at intervals less than 400 looms the econom,y . ~
is distwrbing as the overhJ'ads are not fully
utilised. In the ne:xt chapter the relative

-- ------------ ----------------------
position or the different peaks above the economic
size will be studied.
'
~----------- -------~-.~-------