Embed Size (px)
Citation preview
Challenges to Estimating Tree Height via LiDAR in Closed-CanopyForests: A Parable from Western Oregon
Demetrios Gatziolis, Jeremy S. Fried, and Vicente S. Monleon
Abstract: We examine the accuracy of tree height estimates obtained via light detection and ranging (LiDAR)in a temperate rainforest characterized by complex terrain, steep slopes, and high canopy cover. The evaluationwas based on precise top and base locations for > 1,000 trees in 45 plots distributed across three forest types,a dense network of ground elevation recordings obtained with survey grade equipment, and LiDAR data fromhigh return density acquisitions at leaf-on and leaf-off conditions. Overall, LiDAR error exceeded 10% of treeheight for 60% of the trees and 43% of the plots at leaf-on and 55% of the trees and 38% of the plots at leaf-off.Total error was decomposed into contributions from errors in the estimates of tree top height, ground elevationmodel, and tree lean, and the relationships between those errors and stand- and site-level variables were explored.The magnitude of tree height error was much higher than those documented in other studies. These findings,coupled with observations that indicate suboptimal performance of standard algorithms for data preprocessing,suggest that obtaining accurate estimates of tree height via LiDAR in conditions similar to those in the USPacificNorthwest may require substantial investments in laser analysis techniques research and reevaluation of laserdata acquisition specifications. FOR. SCI. 56(2):139-155.
Keywords: airborne laser scanning, Pacific Northwest, terrain modeling, tree leaning, calibration
TREE HEIGHT IS a critical attribute assessed in mostforest inventories (McCombs et al. 2003). It is usedto estimate volume, biomass, and carbon stores of
individual trees and to compute site index and variousindices of forest structure (e.g., late successional status andcanopy fuel characteristics). Traditionally, tree height isassessed via labor-intensive and comparatively costly fieldmensuration techniques or a combination of field measure-ments and modeling. Forest managers and inventory spe-cialists have long sought alternative, more economical ap-proaches to obtain tree heights that meet establishedaccuracy standards (Aldred and Hall 1975). Remote sensingtechnologies have been regarded as perhaps the most prom-ising direction to pursue (Johnson 1958, Kovats 1997).
To a much greater degree than aerial photography andother forms of optical remote sensing, light detection andranging (LiDAR), an evolving remote sensing technologysometimes referred to as airborne laser scanning, can pen-etrate forest canopies, making it particularly well-suited todescribing the vertical profile of forests (Lim et al. 2003).Since the late 1990s, laser scanning has become an impor-tant component of forest management and inventory oper-ations in many countries (Hyyppa et al. 2003, Nilsson et al.2003, Wulder 2003). It has been successfully used to assessthe height and, by exploring crown width and tree diameterrelationships, the size of individual trees. At the stand level,LiDAR has been used to estimate canopy cover, volume,and biomass and to assess wildlife habitat and fire suscep-
tibility (Means et al. 2000, Naesset 2002, Persson et al.2002, Andersen et al. 2005, Hinsley et al. 2006, Popescuand Zhao 2007). Continuous technological advancementsand intense competition among vendors have resulted insubstantial reductions in the cost of acquiring LiDAR data,triggering an explosion of interest in LiDAR technology andprompting discussions on its integration with mainstreaminventory operations, such as those conducted by the USForest Inventory and Analysis program (FIA).
Discrete return LiDAR data consist of a set of points, or"returns," accurately and precisely georeferenced in threedimensions (Baltsavias 1999). These returns are the locationwhere laser pulse energy emitted from a scanning instru-ment is backscattered off of a target. Returns are identifiedalong the pulse trajectory as local amplitude maxima ofbackscattered energy in a process known as pulse discreti-zation. Owing to the capacity of small footprint laser pulsesto propagate through small canopy openings to the groundand backscatter to the airborne sensor, LiDAR is capable ofassessing ground elevation (Kraus and Pfeifer 1998). As-suming adequate return density, the "return cloud" of datapoints can be processed to detect individual trees (Brandt-berg et al. 2003) and to generate digital models of thevegetation canopy surface (canopy surface model [CSM])and bare ground (digital terrain model [DTM]) (Hodgson etal. 2003, Clark et al. 2004). Estimates of height for individ-ual trees are obtained by subtracting the DTM from theCSM value at selected locations believed to represent the
tops of tree crowns. Variants of this approach have yieldedheight estimates for individual trees that reportedly rival theaccuracy of those assessed in the field via conventionalmensurational techniques (Hyyppa et al. 2000, Persson et al.2002, Maltamo et al. 2004, Andersen et al. 2006). However,underestimation of tree height due to inadequate returndensity, lack of comprehensive pulse coverage of thescanned area, imperfections in the algorithms used to gen-erate the CSM and DTM, and other issues related to pulsepenetration into the canopy are also commonly reported(Lefsky et al. 2002, Gaveau and Hill 2003, Yu et al. 2004).Developing suitable corrections for such bias has beenchallenging because several factors contribute to the under-estimation (Hyyppa et al. 2004).
Nearly all evaluations of the suitability of LiDAR forestimating tree heights have been carried out in relativelysimple forest conditions with a uniform overstory, little ifany understory vegetation, and gentle topography (Naesset1997, Popescu et al. 2002, Maltamo et al. 2004). Thesecircumstances probably facilitate the extraction of laser-de-rived descriptions of forest canopy and bare ground that areof high fidelity and, hence, conducive to accurate and pre-cise estimates of tree height. However, such conditions arenot common in many forested areas, including the coastalforests of the US Pacific Northwest. For those forests, littleis known about the effects that their complex structure andterrain may have on the suitability of LiDAR-derived heightestimates. The objective of this study was to conduct arigorous evaluation of the accuracy and precision affordedby LiDAR-derived estimates of tree height in the structur-ally complex, high-density and biomass-rich forests grow-ing on the steep slopes of the coastal Pacific Northwest. Theevaluation was performed using laser data acquired underboth leaf-on and leaf-off conditions and was based on aprecise set of calibrated heights obtained in the field viasurvey-grade instruments.
Sources and Magnitude of Error in LiDARTree Height Estimation
Although the estimation of tree height from laser data isconceptually simple, implementation is susceptible to sev-eral potential sources of error related to instrument and dataacquisition specifications and how the LiDAR data areprocessed. This study focuses on three sources of error thatwill always be present: underestimation of tree top eleva-tion, discrepancies induced by tree lean, and overestimationof terrain height (DTM error), along with the interactionsamong these errors.
Tree top elevation is almost always underestimated be-cause the backscattered laser energy must exceed a discreti-zation threshold before it is sufficient to be identified as areturn, and this threshold will not be exceeded until somepoint deeper in the crown than the highest point of the tree.Error due to tree lean is introduced by the two-dimensionaloffset between tree base and top of the tree, which is notconsidered when height is computed as the elevation differ-ence between the return believed to represent the tree topand the point on the DTM surface directly below the treetop. There are no examples known to the authors for which
this source of error in LiDAR tree height estimation hasbeen identified, most likely because conditions under whichtree lean error becomes especially problematic are uncom-mon in most biomes. However, these conditions-very talltrees growing on steep slopes-are typical in the temperaterainforests of the Pacific Northwest.
DTM errors are artifacts that emerge from anomalies inthe spatial distribution of the return cloud and of the pro-cesses that generate terrain models. A key component inDTM generation is to classify laser returns as either on orabove the ground, filtering out the aboveground returnsbefore interpolating a ground surface. Retum classificationerrors or failures to identify and remove below-groundreturns (Hyyppa et al. 2004) lead to DTM errors. Popularapproaches suggested for processing laser return clouds togenerate DTMs in forested areas can be classified into threetypes: iterative approximation (Kraus and Pfeifer 1998,Elmqvist et al. 2001, Kobler et al. 2007), progressive den-sification (Axelsson 1999, Sohn and Dowman 2002), andmorphological filtering (Vosselman 2000, Sithole 2001,Chen et al. 2007).
Under iterative approximation, an initial surface model isgenerated using last returns or sometimes the entire returncloud. Returns that lie above the surface are assignedweights of magnitude proportional to the inverse of theirvertical distance above the surface. Returns under the sur-face receive weights that increase with their vertical dis-tance below the surface. The weights (low above the surfaceand high below) are used to influence the surface obtainedin the next iteration. Iterations continue until the magnitudeof elevation adjustments falls below a user-specifiedthreshold.
In progressive densification, a set of returns identified aslocal elevation minima within larger areas are classified asground points and used to obtain a base surface via trian-gulation. The angles formed between yet unclassified re-turns, the vertices of the closest triangle, and the triangle'splane are examined. Returns with angles below a user-spec-ified threshold are classified, one at a time, as ground, andthe triangulated surface is updated until no more returnswith angles below the threshold remain.
There are two variants of morphological filtering. Oneoperates directly on the return cloud and uses a functionof distance and elevation to test the realism of elevationdifferences between neighboring returns assumed to rep-resent the ground. Typically, the form of the function hasthe rate of elevation change, decreasing with distance andultimately reaching an asymptote, and functional form,either omnidirectional or aspect-specific and typicallyderived from terrain training data if available or fromassumptions about maximum terrain slope. Abovegroundreturns that exceed the function limits are eliminated. Thesecond variant works with raster representations of thereturn cloud, in which the value of each cell is initiallyset to the elevation of the lowest return present within thecell. The raster is then processed with the morphologicaloperation known as Opening (Haralick et al. 1987),which identifies groups of cells that protrude from (havevalues consistently higher than) their surroundings. This
is often the case in forested landscapes where the eleva-tion of the lowest return in cells under a tree is well abovethe ground. Performing the morphological operations us-ing raster windows of progressively larger size and as-signing weights to each cell depending on the outcome ofthe morphological operator for different window sizesallows identification and removal of aboveground objects(Zhang et al. 2003). In the last step, the morphologicaloperations Erosion and Dilation (Haralick et al. 1987)can be used to replace the initial raster values with thefiltered elevations (Lohmann et al. 2000). A notablelimitation of this approach, the assumption of constantslope, has been resolved by improvements introduced byChen et al. (2007)
An assumption intrinsic to all types of laser return clas-sification and DTM generation is that the local density ofon-ground and aboveground returns is adequate to quantifyelevation differences between and ultimately to discriminatebetween these two groups of returns. On forested land andsteep slopes in particular, this assumption may not alwayshold because the spatial arrangement of ground and vege-tation returns there have similar characteristics: large ele-vation differences within small horizontal distances (Kobleret al. 2007). Consequently, the magnitude of DTM errorsand therefore the accuracy of LiDAR-derived terrain mod-els in forested areas have been highly variable. Reutebuch etal. (2003) reported that under coniferous stands and 4 re-
turns m-2 density, they observed a root mean square error(RMSE) of 31 em, whereas Kraus and Pfeifer (1998) re-ported an RMSE of 57 em in wooded areas. However,others have reported that it is common to have a positiveelevation bias of > 1.5 m in more complex vegetation(Hodgson et al. 2003, Clark et al. 2004) and that bias is evengreater in sloped terrain (Kobler et al. 2007).
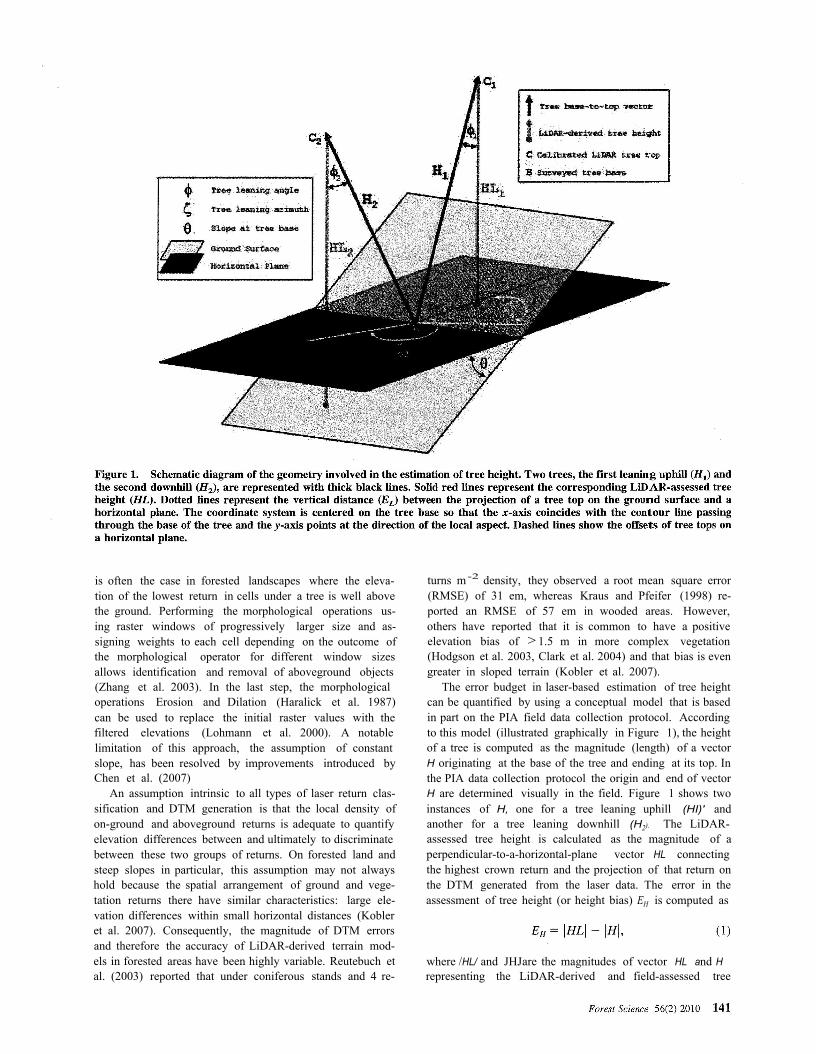
The error budget in laser-based estimation of tree heightcan be quantified by using a conceptual model that is basedin part on the PIA field data collection protocol. Accordingto this model (illustrated graphically in Figure 1), the heightof a tree is computed as the magnitude (length) of a vectorH originating at the base of the tree and ending at its top. Inthe PIA data collection protocol the origin and end of vectorH are determined visually in the field. Figure 1 shows twoinstances of H, one for a tree leaning uphill (HI)' andanother for a tree leaning downhill (H2). The LiDAR-assessed tree height is calculated as the magnitude of aperpendicular-to-a-horizontal-plane vector HL connectingthe highest crown return and the projection of that return onthe DTM generated from the laser data. The error in theassessment of tree height (or height bias) EH is computed as
where /HL/ and JHJare the magnitudes of vector HL and Hrepresenting the LiDAR-derived and field-assessed tree
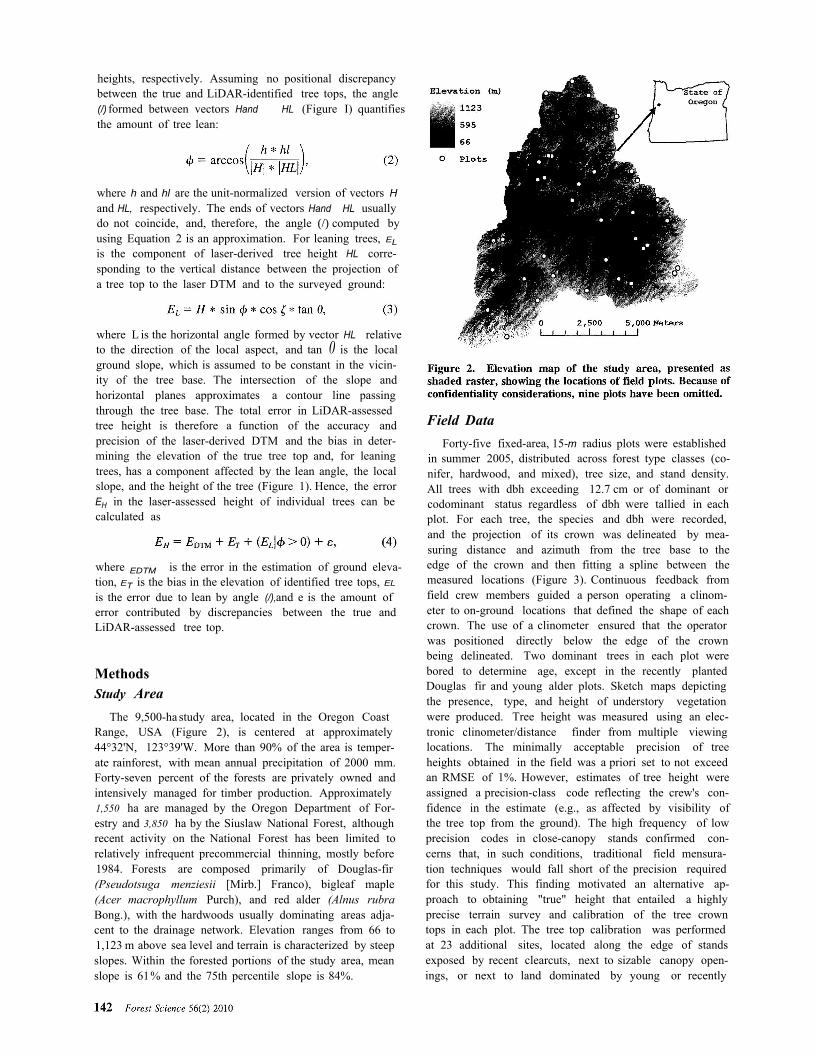
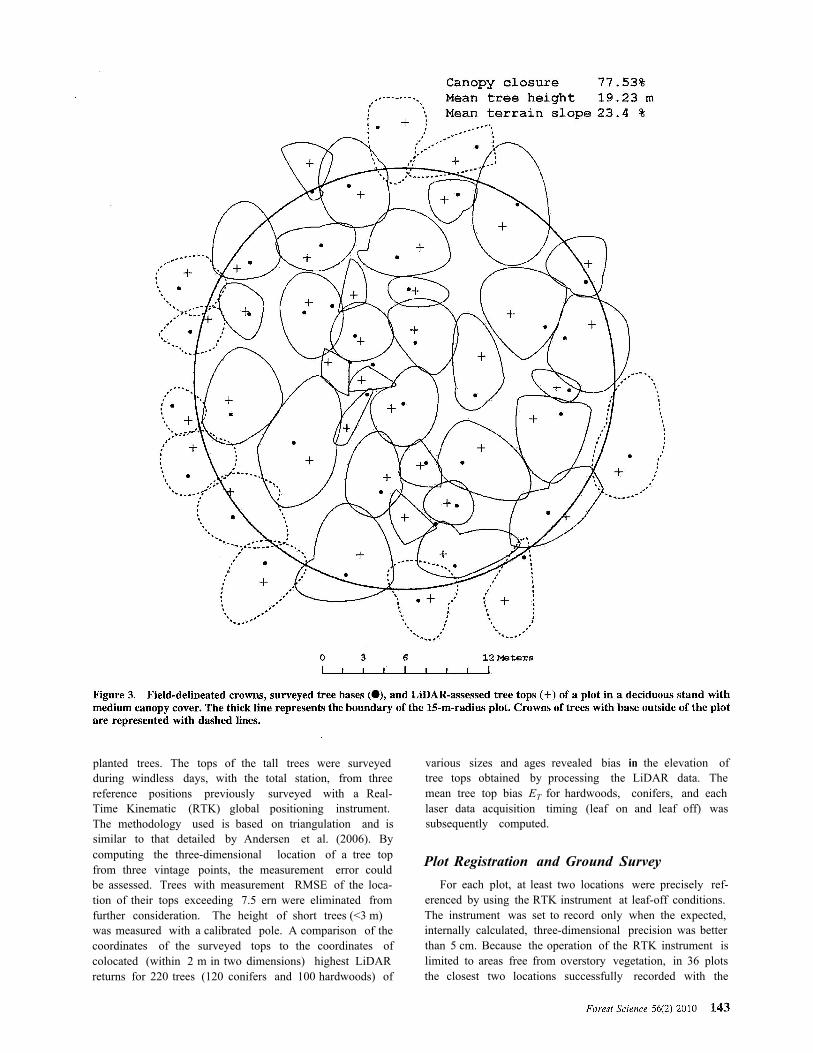
Field DataForty-five fixed-area, 15-m radius plots were established
in summer 2005, distributed across forest type classes (co-nifer, hardwood, and mixed), tree size, and stand density.All trees with dbh exceeding 12.7 cm or of dominant orcodominant status regardless of dbh were tallied in eachplot. For each tree, the species and dbh were recorded,and the projection of its crown was delineated by mea-suring distance and azimuth from the tree base to theedge of the crown and then fitting a spline between themeasured locations (Figure 3). Continuous feedback fromfield crew members guided a person operating a clinom-eter to on-ground locations that defined the shape of eachcrown. The use of a clinometer ensured that the operatorwas positioned directly below the edge of the crownbeing delineated. Two dominant trees in each plot werebored to determine age, except in the recently plantedDouglas fir and young alder plots. Sketch maps depictingthe presence, type, and height of understory vegetationwere produced. Tree height was measured using an elec-tronic clinometer/distance finder from multiple viewinglocations. The minimally acceptable precision of treeheights obtained in the field was a priori set to not exceedan RMSE of 1%. However, estimates of tree height wereassigned a precision-class code reflecting the crew's con-fidence in the estimate (e.g., as affected by visibility ofthe tree top from the ground). The high frequency of lowprecision codes in close-canopy stands confirmed con-cerns that, in such conditions, traditional field mensura-tion techniques would fall short of the precision requiredfor this study. This finding motivated an alternative ap-proach to obtaining "true" height that entailed a highlyprecise terrain survey and calibration of the tree crowntops in each plot. The tree top calibration was performedat 23 additional sites, located along the edge of standsexposed by recent clearcuts, next to sizable canopy open-ings, or next to land dominated by young or recently
heights, respectively. Assuming no positional discrepancybetween the true and LiDAR-identified tree tops, the angle(/) formed between vectors Hand HL (Figure I) quantifiesthe amount of tree lean:
where h and hl are the unit-normalized version of vectors Hand HL, respectively. The ends of vectors Hand HL usuallydo not coincide, and, therefore, the angle (/) computed byusing Equation 2 is an approximation. For leaning trees, ELis the component of laser-derived tree height HL corre-sponding to the vertical distance between the projection ofa tree top to the laser DTM and to the surveyed ground:
where L is the horizontal angle formed by vector HL relativeto the direction of the local aspect, and tan 0 is the localground slope, which is assumed to be constant in the vicin-ity of the tree base. The intersection of the slope andhorizontal planes approximates a contour line passingthrough the tree base. The total error in LiDAR-assessedtree height is therefore a function of the accuracy andprecision of the laser-derived DTM and the bias in deter-mining the elevation of the true tree top and, for leaningtrees, has a component affected by the lean angle, the localslope, and the height of the tree (Figure 1). Hence, the errorEH in the laser-assessed height of individual trees can becalculated as
where EDTM is the error in the estimation of ground eleva-tion, ET is the bias in the elevation of identified tree tops, EL
is the error due to lean by angle (/),and e is the amount oferror contributed by discrepancies between the true andLiDAR-assessed tree top.
MethodsStudy Area
The 9,500-ha study area, located in the Oregon CoastRange, USA (Figure 2), is centered at approximately44°32'N, 123°39'W. More than 90% of the area is temper-ate rainforest, with mean annual precipitation of 2000 mm.Forty-seven percent of the forests are privately owned andintensively managed for timber production. Approximately1,550 ha are managed by the Oregon Department of For-estry and 3,850 ha by the Siuslaw National Forest, althoughrecent activity on the National Forest has been limited torelatively infrequent precommercial thinning, mostly before1984. Forests are composed primarily of Douglas-fir(Pseudotsuga menziesii [Mirb.] Franco), bigleaf maple(Acer macrophyllum Purch), and red alder (Alnus rubraBong.), with the hardwoods usually dominating areas adja-cent to the drainage network. Elevation ranges from 66 to1,123 m above sea level and terrain is characterized by steepslopes. Within the forested portions of the study area, meanslope is 61% and the 75th percentile slope is 84%.
various sizes and ages revealed bias in the elevation oftree tops obtained by processing the LiDAR data. Themean tree top bias ET for hardwoods, conifers, and eachlaser data acquisition timing (leaf on and leaf off) wassubsequently computed.
Plot Registration and Ground SurveyFor each plot, at least two locations were precisely ref-
erenced by using the RTK instrument at leaf-off conditions.The instrument was set to record only when the expected,internally calculated, three-dimensional precision was betterthan 5 cm. Because the operation of the RTK instrument islimited to areas free from overstory vegetation, in 36 plotsthe closest two locations successfully recorded with the
planted trees. The tops of the tall trees were surveyedduring windless days, with the total station, from threereference positions previously surveyed with a Real-Time Kinematic (RTK) global positioning instrument.The methodology used is based on triangulation and issimilar to that detailed by Andersen et al. (2006). Bycomputing the three-dimensional location of a tree topfrom three vintage points, the measurement error couldbe assessed. Trees with measurement RMSE of the loca-tion of their tops exceeding 7.5 ern were eliminated fromfurther consideration. The height of short trees (<3 m)was measured with a calibrated pole. A comparison of thecoordinates of the surveyed tops to the coordinates ofcolocated (within 2 m in two dimensions) highest LiDARreturns for 220 trees (120 conifers and 100 hardwoods) of
RTK were in canopy openings well outside the plot bound-ary. For those plots, transects cormecting reference locationsto corresponding plot centers were established and surveyedwith a total station. For the remaining 9 plots, unobstructed,undercanopy lines of sight between the RTK referencelocations and the plot centers supported direct plot georef-erencing via the total station. Additional RTK referencelocations and transects installed in 12 of the plots revealedthat the location error of the plot center ranged from 3.4 to12.3 em (mean 5.4 cm), a precision that was deemed ac-ceptable. With the total station positioned and oriented onthe plot center, terrain inflection points were flagged overthe plot area and a 5-m buffer around the plot. The flagdensity was higher in portions of the plots exhibiting vari-ations in microtopography. Across plots, the average den-sity was 0.38 points m-2
. The flagged locations in each plotwere processed to generate l-m DTMs via kriging (Goo-vaerts 1997) using 6 nearest neighbors. Alternative DTMsgenerated via inverse distance weighting with a power fac-tor of 2 and via Delaunay triangulation-derived irregularnetworks later converted to their raster equivalent via cubicconvolution compared closely with the kriging-derivedDTM. The mean absolute difference between the kriging-derived DTM and alternative methods was <2.5 cm andvisualizations of the difference surfaces showed no spatialpatterns. Hence, the alternative DTMs were not consideredfurther. The precision of the kriging-derived DTMs wasevaluated using cross-validation that excluded one groundreturn per plot each time and compared its surveyed eleva-tion to the interpolated value. The mean DTM interpolationerror across plots was 3.9 cm.
LiDAR DataLaser scanning data were acquired at leaf-on conditions
in July 2005 and leaf-off conditions in February 2006 using,in both acquisitions, an aircraft-mounted Optech 3100 sys-tem from a nominal height of 1,000 m aboveground level.The LiDAR instrument operated on a 71-kHz laser repeti-tion rate and captured a 20° scan width (10° from nadir)with adjacent flight line overlap of 50%. Laser data had amean density of 7.52 returns/m2 for the leaf-on mission and8.70 retums/m2 for the leaf-off mission. For both missionsthe spot spacing was 32 cm with nominal laser footprintdiameter of 33 cm. Pulse discretization to individual returnsenforced a minimum distance of 3 m between a first and asecond return and 2 m between subsequent returns. A max-imum of four returns could be identified from a single pulse.Compared with horizontal, impermeable surfaces surveyedwith the RTK, the laser returns had an RMSE of 2.6 emduring the leaf-on mission and 3.1 cm during the leaf-offmission. For each mission, the vendor delivered both raw(unfiltered) data and a filtered version that contained onlyreturns classified as either on-ground or aboveground. Fil-tering was performed using an adaptive triangulation irregu-lated networks model (Axelsson 1999) implemented in theTerraScan software. An initial ground surface was obtainedvia triangulation performed using only returns that featuredthe lowest elevation within rectangular, 0.1-ha regions. Sur-face densification was limited to a minimum horizontal
distance of 1.4 m between returns and angular offset of 5°Ground surfaces produced with these default filtering valueswere evaluated visually against the unfiltered return cloudfor each of the l-km2 data tiles. Where apparent filteringerrors were identified, the vendor repeated the process withmodified settings until the ground surface produced wasfree of obvious errors. We generated l-m plot DTMs usingthe filtered returns classified as representing the ground viakriging with 6 nearest neighbors.
Alternative plot DTMs were generated using the unfil-tered return cloud and the TreeVis (Weinacker et al. 2004)and TIFFs (Chen 2007) software packages. Return filteringin TreeVis is enabled by an iterative approximation algo-rithm that we executed with default settings. TIFFs appliesmorphological filtering and includes a preprocessing stepdesigned to remove artifacts (below-ground returns). PlotDTMs for combinations of algorithmic parameter thresh-olds in TIFFs were obtained. All LiDAR- and field survey-derived DTMs had the same resolution (1 m) and wereco-registered. Simultaneous three-dimensional renditions ofthe raster surfaces and unfiltered returns performed in FU-SION software (McGaughey 2009) enabled visual pair-wisecomparisons of field-surveyed and TreeVis- and TIFFs-derived DTMs. In addition, FUSION-enabled visualizationsof the return clouds for selected plots were presented to fourhuman operators who, working independently, were askedto delineate the ground surface along two, I-m wide,transects for each plot. Transects were oriented in paralleland across elevation contour lines. The task was facilitatedby custom return cloud rotation that enhanced the percep-tion of depth. In the absence of any other information orreference, manual filtering is regarded as the best possibleclassification into ground and off-ground returns (Kobler etal. 2007) and is often used to compare filtering algorithms(Sithole and Vosselman 2004).
For nearly half the plots at leaf-on conditions and ap-proximately two-thirds of the plots at leaf-off conditions,the visual comparison revealed no noticeable elevation dif-ferences between the survey- and the laser-derived DTMs asdiscrepancies were small and dispersed within the plots. Forthe remaining plots, discrepancies were typically larger forthe DTMs generated with TreeVis, which exhibited a ten-dency to generalize local terrain features. TIFFs-derivedDTMs were sensitive to even small changes in input pa-rameter values, occasionally produced surfaces with a stair-step appearance, and sometimes had substantial variabilityin accuracy within a single plot. DTMs generated using theTerraScan-filtered returns were consistently equal to ormore accurate than the alternatives, although for severalplots they contained substantial positive elevation bias. Forthe rest of the analysis, we considered only the TerraScan-derived DTMs. Their accuracy was estimated by comparingcell values to the elevation of 50, randomly chosen, sur-veyed locations within each plot.
Estimation of Tree Height, Terrain Derivatives,and Canopy Cover
To determine the heights of dominant and codominanttrees in each plot, the field-delineated crowns were first
representing lack of correspondence in the assessments withmaximum width of only 10-20 cm. Such minimal disagree-ment between independent assessments of crown perimeterconfirms the high precision of the crown delineation effort.Note that our definition of canopy cover refers to the plani-metric projection of the canopy onto the ground and thusdiffers from what would be obtained, for example, viahemispherical photography (e.g., percent sky as viewedfrom a given location on the ground) under the canopy inthat crowns are not opaque and overlapped crowns wouldtend to produce higher canopy cover estimates.
ResultsWe present results by source of tree height assessment
error (ET, EL and EDTM) and for the total height error EHsummarized at the plot level and in relation to forest type.
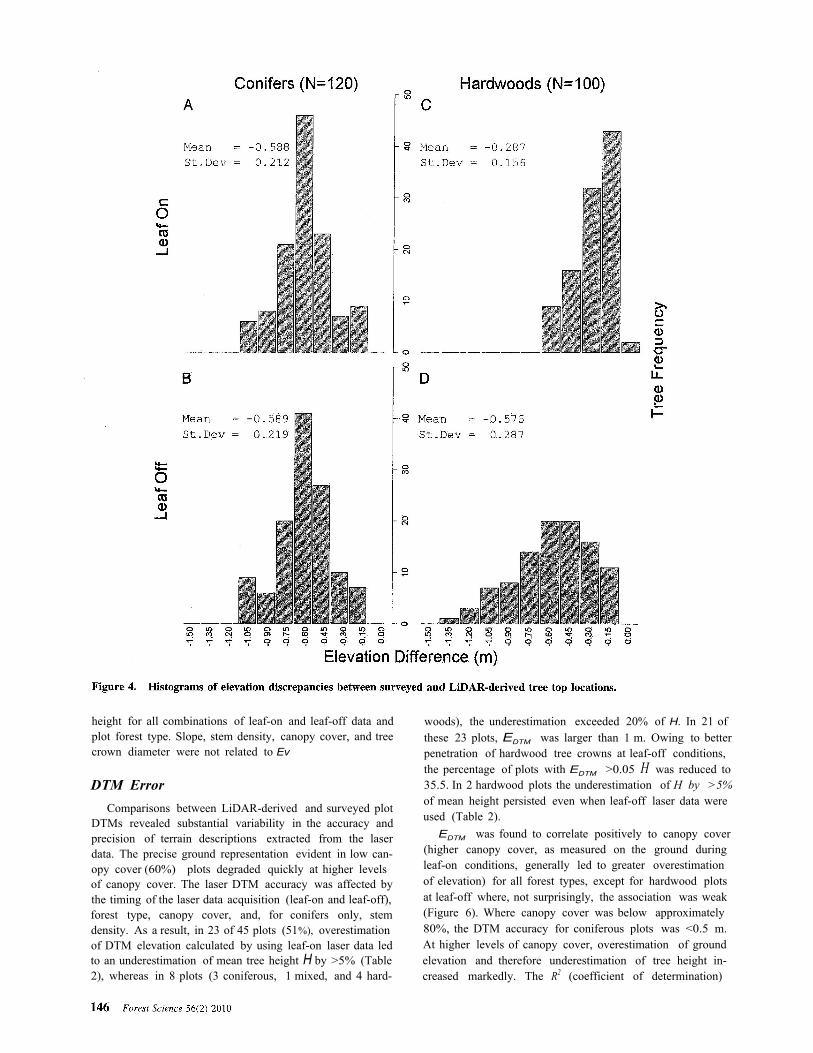
Tree Top ErrorThe tree top calibration data collected in the 23 sites
revealed a bias of -0.59 m for conifers in both acquisitions.For hardwoods the absolute magnitude of the bias increasedfrom -0.29 m at leaf-on to -0.58 m at leaf-off conditions(Figure 4). A paired t test of the elevation differencesbetween the observed and LiDAR-derived tree tops wassignificant at a = 0.05. There was no evidence in thecalibration data that the magnitude of the height bias wasrelated to the height of the tree or the size of its crown. Themean two-dimensional (horizontal) discrepancy betweensurveyed and LiDAR-identified tree tops for conifers was11 em at leaf-on and 10 cm at leaf-off conditions. Forhardwoods the discrepancy was larger: 25 em using leaf-onlaser data and 36 em with leaf-off data.
Tree Lean ErrorMost of the trees inventoried in this study were leaning.
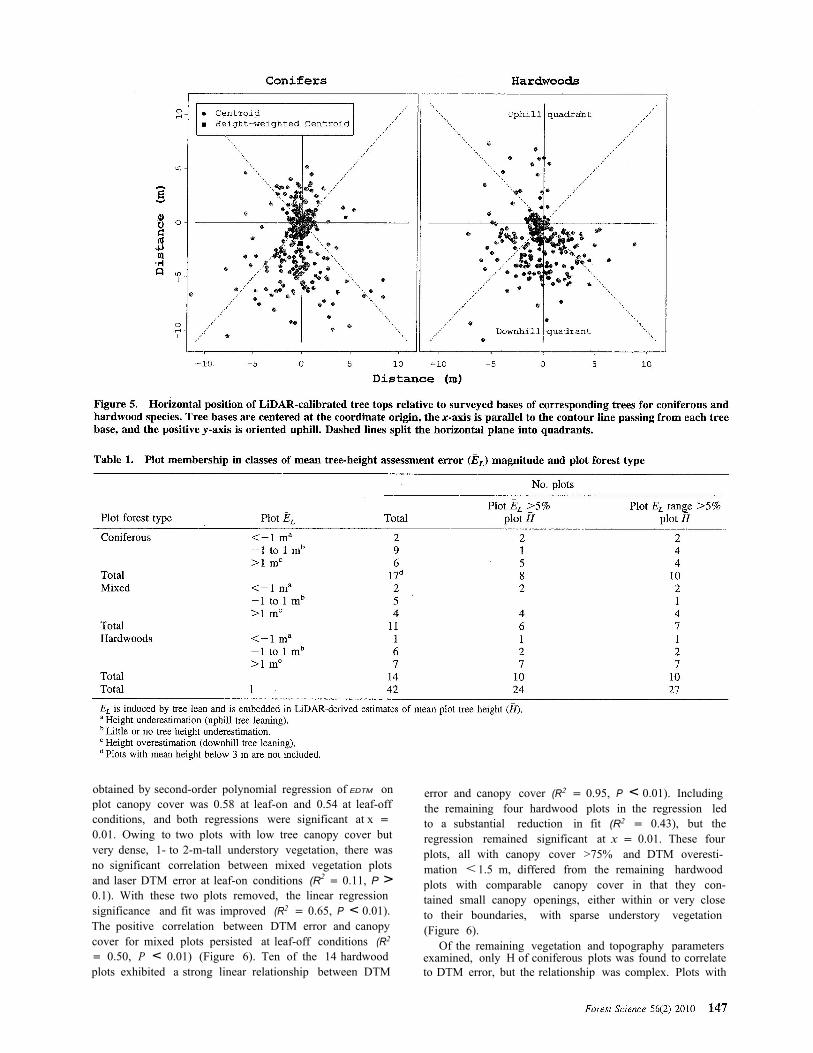
Of the 775 trees that were taller than 3 m, for only 12% wasthe horizontal location of the LiDAR-identified top within33 em (the mean width of a LiDAR pulse footprint) of thebase. The mean tree base-to-top horizontal offset was ori-ented downhill and was longer for coniferous species (1.19rn) than for hardwoods (0.95 m). Lean direction on one sixthof the trees (16.2% of conifers and 16.6% of hardwoods)was within 45° of the steepest uphill gradient, whereas on38% of conifers and 42.5% of hardwoods it was within 45°of the steepest downhill gradient (Figure 5). Variability inlean direction relative to the local aspect and the magnitudeof lean angle (/) was greater among than within plots forconifers and relatively stochastic for hardwoods.
In 22 of the 42 plots (52%) with mean calibrated treeheight (H) > 3 m, the mean per plot height error due to treelean (EL) exceeded 1 m. In 24 plots (57%) EL exceeded 5%of H. The within-plot variability in individual tree error wassubstantial for all forest types and tree sizes. In 27 plots(64%), the range of individual tree EL was larger than 5% ofH (Table 1). Although the error EL contributed in theLiDAR-assessed tree height by tree lean is a function of thecalibrated tree height H (Equation 3), scattergrams of ELand H showed no significant association between error and
overlaid with the return cloud. The elevation of the highestreturn within a crown, identified using leaf-on laser data,was recorded and subsequently adjusted to account for thebias E
Tobserved at the exposed stands. E
Twas computed as
the mean leaf-on elevation discrepancy between surveyedand LiDAR-derived tree top locations, independently forconifers and hardwoods. The heights obtained after thisadjustment are referenced here as "calibrated." The angle (!used in the computation of local ground slope was definedas the one formed between a plane p(x, y, z) fitted via leastsquares to the flagged locations present horizontally within5 m from the base of the tree and a horizontal planep(1, 1, 0). It was computed as
Tree heights and terrain derivatives (local slope and aspectat the base) were computed for a total of 1,009 trees. Thetotal height error and its components were calculated ac-cording to the error-source model presented earlier. Themagnitude of error component E was assessed via simula-tion that entailed horizontal jittering of the LiDAR-identified tops in random direction 100 times per tree,calculation of EH (Equation 1) for each jittering instance,and computation of the root mean square discrepancy to theEH of the nonjiUered tree top. The jittering distances weredrawn from distributions whose moments were forest type-and laser acquisition timing-specific and matched those ofthe corresponding distributions of horizontal discrepanciesbetween observed and LiDAR derived-tree tops in the 23plots used for tree top calibration. The maximum jitteringdistance was 0.43 m for conifers, 0.98 m for hardwoods andleaf-on data, and 1.43 m for hardwoods and leaf-off laserdata. The random relative azimuth between the LiDAR-derived and true tree tops observed in the 23 calibrationplots suggests that any height bias induced by error in thelocation of LiDAR-derived tops will probably be balancedat the plot level. Because of this observation and the factthat the magnitude of e assessed with the simulation was<1 % of H for >94% of the trees (the rest were shortsaplings growing on 80 + % slopes), the contribution of e indetermining EH (Equation 4) was deemed negligible andwas not further considered. We applied regression analysisto evaluate each of the error components in Equation 4independently and in reference to plot vegetation parame-ters such as forest type, tree size, density, canopy cover, andlocal topography.
An estimate of canopy cover for each plot was obtainedby considering the field-delineated crown projections ofdominant and codominant trees (crowns were regarded asopaque) and calculating the portion of the plot area coveredby them. To evaluate the consistency of crown delineationand therefore the accuracy of canopy cover estimates ob-tained, crown delineation was repeated several weeks afterthe initial field visit for seven plots. The estimates of canopycover obtained at the second field visit did not differ fromthose obtained at the first visit by > 2.8% (mean differencewas 2.1%). Plot overlays of the crowns delineated in eachvisit produced only sliver (thin and usually long) polygons
woods), the underestimation exceeded 20% of H. In 21 ofthese 23 plots, EDTM was larger than 1 m. Owing to betterpenetration of hardwood tree crowns at leaf-off conditions,the percentage of plots with EDTM >0.05 H was reduced to35.5. In 2 hardwood plots the underestimation of H by >5%of mean height persisted even when leaf-off laser data wereused (Table 2).
EDTM was found to correlate positively to canopy cover(higher canopy cover, as measured on the ground duringleaf-on conditions, generally led to greater overestimationof elevation) for all forest types, except for hardwood plotsat leaf-off where, not surprisingly, the association was weak(Figure 6). Where canopy cover was below approximately80%, the DTM accuracy for coniferous plots was <0.5 m.At higher levels of canopy cover, overestimation of groundelevation and therefore underestimation of tree height in-creased markedly. The R2 (coefficient of determination)
height for all combinations of leaf-on and leaf-off data andplot forest type. Slope, stem density, canopy cover, and treecrown diameter were not related to Ev
DTM ErrorComparisons between LiDAR-derived and surveyed plot
DTMs revealed substantial variability in the accuracy andprecision of terrain descriptions extracted from the laserdata. The precise ground representation evident in low can-opy cover (60%) plots degraded quickly at higher levelsof canopy cover. The laser DTM accuracy was affected bythe timing of the laser data acquisition (leaf-on and leaf-off),forest type, canopy cover, and, for conifers only, stemdensity. As a result, in 23 of 45 plots (51%), overestimationof DTM elevation calculated by using leaf-on laser data ledto an underestimation of mean tree height H by >5% (Table2), whereas in 8 plots (3 coniferous, 1 mixed, and 4 hard-
error and canopy cover (R2 = 0.95, P < 0.01). Includingthe remaining four hardwood plots in the regression ledto a substantial reduction in fit (R2 = 0.43), but theregression remained significant at x = 0.01. These fourplots, all with canopy cover >75% and DTM overesti-mation < 1.5 m, differed from the remaining hardwoodplots with comparable canopy cover in that they con-tained small canopy openings, either within or very closeto their boundaries, with sparse understory vegetation(Figure 6).
Of the remaining vegetation and topography parametersexamined, only H of coniferous plots was found to correlateto DTM error, but the relationship was complex. Plots with
obtained by second-order polynomial regression of EDTM onplot canopy cover was 0.58 at leaf-on and 0.54 at leaf-offconditions, and both regressions were significant at x =0.01. Owing to two plots with low tree canopy cover butvery dense, 1- to 2-m-tall understory vegetation, there wasno significant correlation between mixed vegetation plotsand laser DTM error at leaf-on conditions (R2 = 0.11, P >0.1). With these two plots removed, the linear regressionsignificance and fit was improved (R2 = 0.65, P < 0.01).The positive correlation between DTM error and canopycover for mixed plots persisted at leaf-off conditions (R2
= 0.50, P < 0.01) (Figure 6). Ten of the 14 hardwoodplots exhibited a strong linear relationship between DTM
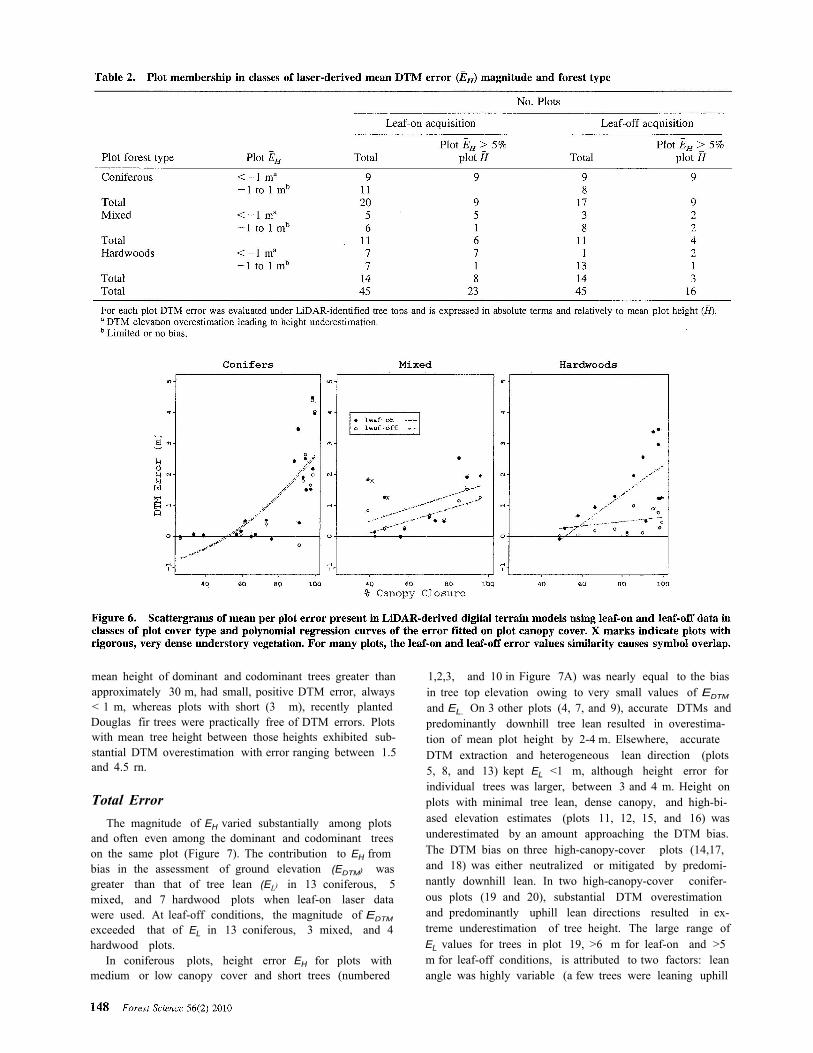
mean height of dominant and codominant trees greater thanapproximately 30 m, had small, positive DTM error, always< 1 m, whereas plots with short (3 m), recently plantedDouglas fir trees were practically free of DTM errors. Plotswith mean tree height between those heights exhibited sub-stantial DTM overestimation with error ranging between 1.5and 4.5 rn.
Total ErrorThe magnitude of EH varied substantially among plots
and often even among the dominant and codominant treeson the same plot (Figure 7). The contribution to EH frombias in the assessment of ground elevation (EDTM) wasgreater than that of tree lean (EL) in 13 coniferous, 5mixed, and 7 hardwood plots when leaf-on laser datawere used. At leaf-off conditions, the magnitude of EDTM
exceeded that of EL in 13 coniferous, 3 mixed, and 4hardwood plots.
In coniferous plots, height error EH for plots withmedium or low canopy cover and short trees (numbered
1,2,3, and 10 in Figure 7A) was nearly equal to the biasin tree top elevation owing to very small values of EDTM
and EL. On 3 other plots (4, 7, and 9), accurate DTMs andpredominantly downhill tree lean resulted in overestima-tion of mean plot height by 2-4 m. Elsewhere, accurateDTM extraction and heterogeneous lean direction (plots5, 8, and 13) kept EL <1 m, although height error forindividual trees was larger, between 3 and 4 m. Height onplots with minimal tree lean, dense canopy, and high-bi-ased elevation estimates (plots 11, 12, 15, and 16) wasunderestimated by an amount approaching the DTM bias.The DTM bias on three high-canopy-cover plots (14,17,and 18) was either neutralized or mitigated by predomi-nantly downhill lean. In two high-canopy-cover conifer-ous plots (19 and 20), substantial DTM overestimationand predominantly uphill lean directions resulted in ex-treme underestimation of tree height. The large range ofEL values for trees in plot 19, >6 m for leaf-on and >5m for leaf-off conditions, is attributed to two factors: leanangle was highly variable (a few trees were leaning uphill

rare, pulse penetration through the canopy to the groundmay be limited even at leaf-off conditions.
Within-plot variation in tree height estimation error inhardwoods was much greater than that for the other twoforest types, with a range that exceeded 4 m for one in everythree hardwood plots (Figure 7C). Where low or mediumcanopy cover permitted the extraction of DTMs accurate to< 1m (plots 32-37), the difference in EH between acquisi-tions was comparable in magnitude to the difference in thetree top elevation calibration between leaf-on and leaf-offconditions. Owing to substantial downhill tree lean, two ofthese plots (33 and 37) exhibited large height overestima-tion, whereas a third (plot 34) with trees leaning uphillexhibited height underestimation. In closed-canopy plots,the substantial underestimation of tree height caused byDTM overestimation was partially (plots 38 and 42-45),fully (plots 39 and 40), or even overcompensated for bystrong downhill lean. Variability in the magnitude of 1> andleaning azimuth angle l for trees in plots 41-43 produced alarge (5+ m) range in individual tree EH.
Excluding all trees shorter than 3 m, individual tree EHexceeded 10% of H for nearly 60% of the trees; for hard-wood trees the percentage was even higher (Table 3). Com-pared with individual trees, the percentage of plots with EH>0.1 H was lower (42.9%), mainly because of trees leaningin opposite directions, thereby reducing their EL contribu-tion to the mean plot height error EL Improvement in theDTM accuracy obtained by switching from leaf-on to leaf-off laser data reduced the percentage of hardwood trees thatexceeded the 10% height error threshold by nearly 10 pointsand the percentage of trees in mixed plots by >6 points. Theerror in one mixed and one hardwood plot was reduced to<10% of the mean plot height. Despite these improvementsin height estimation accuracy, mean height error at the plotlevel remained substantial and exceeded the 10% thresholdfor more than one in every three plots (Table 3).
Regressed linearly against leaf-on EH, plot canopy coverwas found to correlate negatively to and explained a littlemore than one-quarter of the total variability in the LiDAR-derived estimates of mean height for coniferous plots, hard-wood plots, and for all plots combined. The correlationbetween mean plot height error EH and canopy cover was
much more than others), and plot center coincided withthe inflection point of the slope's profile curvature. Theabrupt change in true local slope, absent in the laserDTMs for both acquisitions, led to more pronouncederror in laser-derived tree height estimates for trees withbases near the center of the plot.
In mixed-vegetation plots, absence of tree lean and ac-curate DTMs (plot 26) or compensation of DTM overesti-mation by moderate (plots 23, 27, and 28) or more pro-nounced (plots 21 and '29) downhill tree lean held EH to<1.5 m (Figure 7B). Accurate DTM estimation, low canopycover, and trees leaning downhill led to positive tree heightbias between 1.5 and 3 m for two plots (22 and 25), whereasdownhill tree leaning coupled with DTM overestimationcaused substantial negative height bias in two other plots(24 and 31). The laser-derived DTMs for plot 30, which ischaracterized by extended tree crown overlap of tallerDouglas fir trees and shorter but codominant hardwoods,high canopy cover, and small lean angles, retained at leaf-off conditions most (1.5 m) of the positive elevation error(2.0 m) calculated at leaf-on conditions. This observation isperhaps an indication that where the spatial arrangement ofoverlapping coniferous and hardwood crowns exhibits reg-ularity and the grouping of hardwood crowns into clumps is

laser-derived tree height is combined with ancillary andfield inventory data to assess forest productivity. Estimatesof site index obtained by using stand boundary delineationsand stand age data, LiDAR-derived tree heights, and theFIA site index formulas for the 42 plots with mean treeheight > 3 m would have assigned 12 plots at leaf-on and 11plots at leaf-off conditions to a different (and probablywrong) productivity class compared with the one assignedby using the calibrated tree heights. Note that the range ofsite productivity in the study area is narrow, as practicallyall forestland belongs to the top two classes (in a five-classsystem). If we were to assume that the 45 plots were arandom sample of the forests in the 9,500-ha study area, thetotal wood volume error calculated by using field-determined
stronger (R2 = 0.41) for mixed vegetation plots, and allregressions were significant at x.05 (Table 4). Hcorrelated positively to EH across forest types, but theassociation, although significant at x = 0.05, was weak (R2
< 0.10). The coefficient of determination increased to 0.30when coniferous plots only were considered. A similarrelationship between plot EH, H, and canopy cover wasobserved for leaf-off conditions, except that canopy coverwas not significantly related to EH (Table 4).
Discussion
The significance of our findings for laser-assisted forestinventory operations can perhaps be better realized when

downhill, many otherwise similar plots had trees that leaneduphill or not at all. This variability minimized the predictivepower of models linking tree-lean to laser-derived vegeta-tion and terrain parameters. Estimation of tree lean is astandard component of most forest inventory field datacollection protocols, including that of FIA, and it is basedon visual assessment of the horizontal displacement be-tween the observed tree top and base. Determining thelocation of the tree stem and base from laser data is achallenging task, because few if any returns represent thetree stem in most forest conditions and types. Novel analyticapproaches that accomplish this task and thus enable theassessment of EL could improve the accuracy of heightestimation from LiDAR data. The improvement would besubstantial on steep slopes, considering that a 20-m-tall treewith an uphill leaning angle of 8° (the average leaning oftrees taller than 3 m in all plots) growing on a 60% slope(the average over all plots) would incur an 8% underesti-mation of its true height, whereas the height of the same treeon flat land will be underestimated by a mere 1%. Furtherwork is needed to investigate approaches with a potential toquantify tree lean.
The large DTM errors reported for many of the plotsestablished in this study suggest that applying standardizeddiscretization procedures in situations with comparativelylow pulse energy and dense canopies can produce laserreturn clouds with unconventional characteristics. Analysisof return clouds for several plots indicated unusually low
species and dbh data, leaf-on laser tree heights versus cal-ibrated heights, and volume equations used by FlA (Brack-ett 1977, Pillsbury and Kirkley 1984) would be 480,000 m3
(436,000 m3 for Douglas fir and 34,000 m3 for hardwoods).At leaf-off conditions the error for hardwoods would be13,000 m2, At the stand level, the absolute volume errorwould range from -225 to 44 m3/ha (-42 to 9%) forconifers, -71 to 43 m3/ha (-30 to 18%) for hardwoodsusing leaf-on laser data, and -42 to 39 m3/ha (-17 to 16%)for hardwoods using leaf-off data. A volume estimationerror of this magnitude is much greater than would beexpected using traditional stand examinations in typicaltemperate rainforest conditions in the Pacific Northwest.Considering that biomass and carbon storage estimation istypically derived from volume estimates, we expect estima-tion error rate propagation for the former comparable tothose observed in this study for volume.
Predicting the magnitude of LiDAR estimated tree heighterror proved very difficult. The many factors that control theformation of tree stems and crowns (phototropism, responseto mechanical forces, direction of prevailing winds, species-specific genetic tendencies, and competition between adja-cent trees) often lead to variability in the direction andmagnitude of tree lean and complicate efforts to predict EvThe magnitude of error in laser-based estimates of heightfor individual trees is potentially much higher than that inmean height estimates assessed at the plot, stand, or man-agement unit level. Although most trees were found to lean
sity and dispersion rates of these returns. Below-groundreturns maintained in the return clouds processed by each ofthe three software packages used in this study are probablyresponsible for the elevation bias observed for many plots.The generally superior accuracy of the TerraScan-derivedDTMs compared with those obtained with TreeVis andTIFFs may be a result of greater effort invested in localtuning of the algorithmic parameters used by TerraScanduring DTM generation.
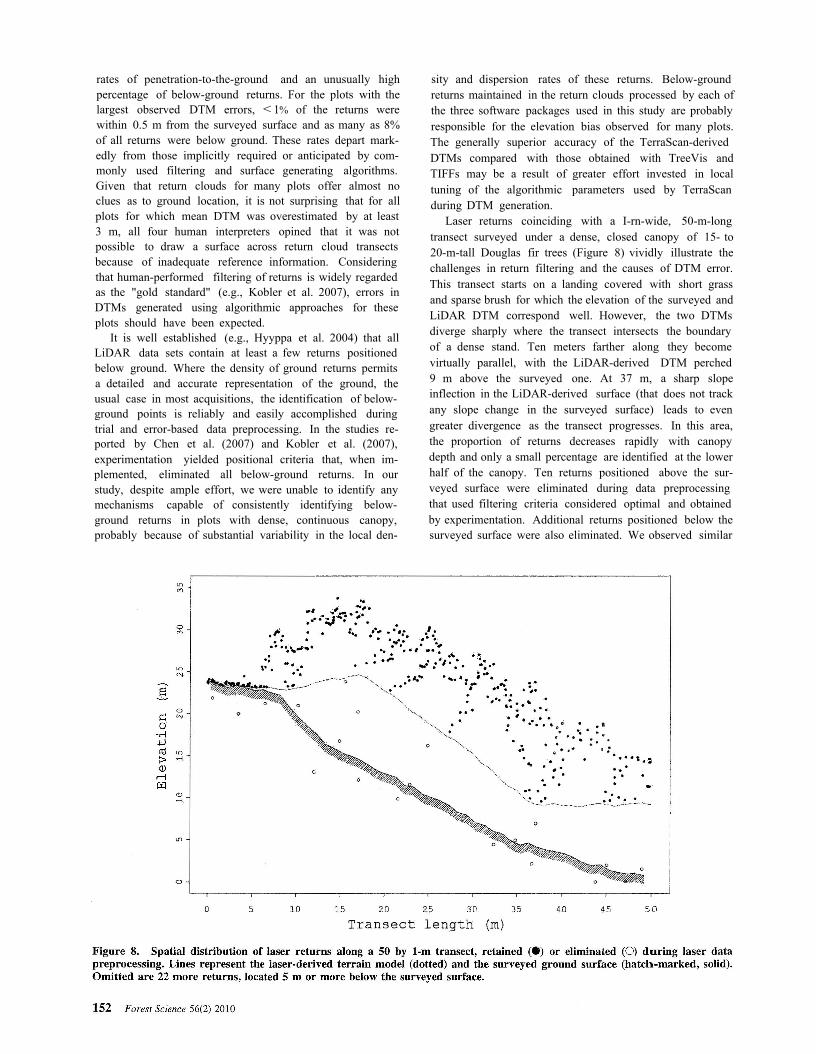
Laser returns coinciding with a I-rn-wide, 50-m-longtransect surveyed under a dense, closed canopy of 15- to20-m-tall Douglas fir trees (Figure 8) vividly illustrate thechallenges in return filtering and the causes of DTM error.This transect starts on a landing covered with short grassand sparse brush for which the elevation of the surveyed andLiDAR DTM correspond well. However, the two DTMsdiverge sharply where the transect intersects the boundaryof a dense stand. Ten meters farther along they becomevirtually parallel, with the LiDAR-derived DTM perched9 m above the surveyed one. At 37 m, a sharp slopeinflection in the LiDAR-derived surface (that does not trackany slope change in the surveyed surface) leads to evengreater divergence as the transect progresses. In this area,the proportion of returns decreases rapidly with canopydepth and only a small percentage are identified at the lowerhalf of the canopy. Ten returns positioned above the sur-veyed surface were eliminated during data preprocessingthat used filtering criteria considered optimal and obtainedby experimentation. Additional returns positioned below thesurveyed surface were also eliminated. We observed similar
rates of penetration-to-the-ground and an unusually highpercentage of below-ground returns. For the plots with thelargest observed DTM errors, < 1% of the returns werewithin 0.5 m from the surveyed surface and as many as 8%of all returns were below ground. These rates depart mark-edly from those implicitly required or anticipated by com-monly used filtering and surface generating algorithms.Given that return clouds for many plots offer almost noclues as to ground location, it is not surprising that for allplots for which mean DTM was overestimated by at least3 m, all four human interpreters opined that it was notpossible to draw a surface across return cloud transectsbecause of inadequate reference information. Consideringthat human-performed filtering of returns is widely regardedas the "gold standard" (e.g., Kobler et al. 2007), errors inDTMs generated using algorithmic approaches for theseplots should have been expected.
It is well established (e.g., Hyyppa et al. 2004) that allLiDAR data sets contain at least a few returns positionedbelow ground. Where the density of ground returns permitsa detailed and accurate representation of the ground, theusual case in most acquisitions, the identification of below-ground points is reliably and easily accomplished duringtrial and error-based data preprocessing. In the studies re-ported by Chen et al. (2007) and Kobler et al. (2007),experimentation yielded positional criteria that, when im-plemented, eliminated all below-ground returns. In ourstudy, despite ample effort, we were unable to identify anymechanisms capable of consistently identifying below-ground returns in plots with dense, continuous canopy,probably because of substantial variability in the local den-

patterns of divergence on two other surveyed transects inriparian hardwood vegetation.
In low-density stands, there appears to be sufficientspace between crowns for pulses to reach the ground exceptwhere dense understory vegetation poses an additional bar-rier. In stands characterized by uniform and many-meter-thick live foliage, typical of unthinned coniferous planta-tions such as the one depicted in Figure 8, very few pulsesreach the ground with enough energy to be ultimately back-scattered to the sensor. The overestimation of ground ele-vation in continuous canopy stands can sometimes be re-duced or even eliminated by the presence of small openingsor areas of sparse canopy. The improved pulse penetrationin such locations allows formation of ground returns thatguide the classification of returns as on-ground oraboveground, and, in tum, contribute to extraction of DTMsfree of serious errors. All four high-canopy-cover hardwoodplots with leaf-on DTM error of 1 m or less had smallcanopy breaks. Where slopes are steep, the improvement inDTM accuracy conferred by small openings or areas ofsparse canopy tends to diminish quickly with distance fromthese features.
Indirect evaluations of algorithmic performance obtainedby visual comparison of laser-derived and surveyed DTMssuggest that there is a tendency in all three algorithms testedto label as ground those returns that appear aligned, withsome tolerance for deviations, on a plane parallel to thecanopy surface. This tendency is particularly pronounced inportions of dense stands growing on steep terrain and adja-cent to roads or other sizable canopy openings. It has beenobserved to persist in other laser data sets acquired else-where in western Oregon with laser instruments differentfrom those used in this study. Algorithmic enhancementsadaptive to steep terrain and low density of ground returnswill probably improve the accuracy of DTMs and, therefore,tree height for some plots. Still, there will be cases wherereturns near the actual ground surface are too few to permitaccurate terrain descriptions, at least with the kind of laserinstrument and acquisition specifications used in this study.
DTM elevation overestimation linked to underestimationof laser-derived tree height can also be an artifact of reducedpulse energy. Modem, high-frequency LiDAR systems cangenerate high-density laser data more economically thantheir predecessors by operating onboard aircraft that flyhigher and faster. However, because the increase in systemfrequency has not been matched by a comparable increasein energy, each pulse from a high-frequency system carriesless energy and most or all of this energy becomes dissi-pated by the upper canopy layers (Chasmer et al. 2006). At71 kHz, the repetition frequency used by the Optech 3100instrument in this study, the average energy carried by asingle pulse is 83 uJ, an amount that nearly doubles (164pJ) when the instrument is operated at 33 kHz, the lowestfrequency setting available. The larger number of pulsesincreases the probability that one will propagate through asmall canopy opening or sparse/thin area of the canopy tothe ground and thus compensate for the weaker energycarried by each pulse. In most forests, pulse density andlaser instrument scanning frequency choices may be ofsecondary importance for the accuracy of tree height assess-
ment, but they can be critical in temperate or tropicalrainforests and where canopy cover limits pulse penetration.In the latter case, it might be prudent to consider using alower-frequency, higher-pulse-energy system along with ahigh-frequency laser system. The new multiple pulses in theair (MPiA) LiDAR technology, which permits a secondpulse to be emitted before the backscattering of the first isreceived, may offer a cost-effective solution to the fre-quency selection dilemma. Compared with single pulse inthe air (SPiA) LiDAR instruments, MPiA enables acquisi-tions that maintain the same return density as SPiA with useof lower-frequency, higher-energy pulses.
Because high-pulse density, narrow-beam divergenceLiDAR virtually saturates the canopy, it is unlikely that treetops are missed. Discrepancies between the assessed andtrue horizontal location of tree tops rarely exceed the pulse'sfootprint diameter with the possible exception of flat-toppedcrowns. The negative bias in the elevation of identified treetops we documented in the calibration procedure, althoughvariable among trees (especially hardwoods at leaf-off con-ditions, as in Figure 4), can be estimated reliably (5- tol0-cm estimation SE) at the plot or stand level and subse-quently used to correct tree top elevation. However, itwould be unwise to apply such corrections to laser dataacquired with lower pulse spacing, different pulse foot-prints, or instruments emitting different amounts of energyper pulse as this could lead to systematic bias in tree heightestimates. The optimal bias correction may also be affectedby the choice of discretization algorithm. The tree topelevation bias of highest returns extracted by using algo-rithms that focus on the "leading-edge" (or "front-end") ofthe pulse would probably differ from the elevation bias ofreturns extracted using "generic" or with "trailing-edge"("back-end")-focusing algorithms. These terms describediscretization algorithms that generate returns at the firstand last instance in which backscattered energy exceedsdesignated thresholds. In generic algorithms, all local back-scattered energy maxima along the pulse trajectory arereturn candidates. Because backscattering from the tip of aconifer leader or hardwood leaf (or twig) at the top of thecrown is much fainter than backscattering originating fromother upper crown parts, generic algorithms fail to identifythe very top of the crown, thereby causing tree top under-estimation. Processing selected data subsets with both lead-ing-edge and generic algorithms could provide estimates onthe magnitude of ET for cover types and crown formspresent in an area of interest.
Considering the unpredictable variation in the directionof tree lean and the nearly constant negative bias in theestimation of tree top elevation, it is not surprising thatcanopy cover, the only vegetation structure parameter foundto correlate consistently to EDTM, was also the only param-eter that correlated to EH. Despite the significance of therelationship between canopy cover and EH, the predictivepower of regression models linking them is limited, exceptwhen subsets of plots that comply with selected vegetationcharacteristics identified during field visits are used to buildthe regression models (Table 4). These models, along withthose shown in Figure 6, have been included to illustrate the

dynamics that govern the assessment of tree height fromLiDAR data, not to quantify the assessment's error budget.
Leaf-off acquisitions are often advocated as the antidoteto inadequate penetration by laser pulses for hardwoodstands. However, we found that despite the improved DTMaccuracy at leaf-off conditions for hardwood plots, the im-provement in plot estimates of tree height was marginal: foronly one hardwood and one mixed plot did the estimate ofmean height shift from the > 10% of mean height error classto the < 10% class (Table 3), mainly because the error dueto tree lean, although potentially minimal and little noticedin studies conducted on flat or gentle terrain, can be sub-stantial in high-relief landscapes such as the one used forthis study. The result that on nearly 4 in every 10 plotsacross forest types, LiDAR-derived mean height was > 10%different from actual height fails to support often-repeatedassertions on the precision and accuracy of tree heightestimates derived from high-density LiDAR data.
Our experience from this study suggests that delivery ofincomplete LiDAR data sets (in which returns have beenfiltered) should be avoided. The only possible gain fromsuch a practice is a small reduction in data storage require-ments. Unfiltered returns can be valuable in comparingDTM generation options and for return percentile andvoxel-based attribute estimation approaches. LiDAR-basedassessment of vegetation change based on acquisitions sep-arated by many years often entails reprocessing of eachlaser data set. Filtering performed at the time of the firstacquisition may be suboptimal at the time of the secondacquisition, considering the rate of evolution in LiDARtheory and data-processing techniques. Maintaining the un-filtered data guarantees that analytical tools developed afterthe acquisition could still be applied to older data sets.
ConclusionsInterest in assessing forest inventory parameters via
LiDAR technologies has grown tremendously over the pastfew years, in part as a result of reports documenting theability of laser data to quantify the vertical profile of foreststands and accurately estimate tree height. However, mostof the findings involving LiDAR-derived estimates of treeheight were based on sites with topographic and vegetationconditions that are very different and arguably more favor-able than those encountered in many regions of the world,including the steep and densely stocked forests of the USPacific Northwest. Using precise, survey-grade field dataand leaf-on and leaf-off LiDAR data from a study area inthe temperate rainforest of the Coast Range of Oregon, weevaluated the accuracy and precision of laser-derived esti-mates of tree height. Results indicate that where LiDARpenetration is poor due to continuous canopies, substantialoverestimation of ground elevation, confounded with treelean, an attribute that nearly defies prediction, results insubstantial error in tree height estimates. A major obstaclein the LiDAR-based assessment of tree height is the gener-ation of accurate digital terrain models. Experimentationwith different algorithms that process the laser data toidentify ground returns and subsequently generate the ter-rain models used in the assessment of tree height suggests
that although trial and error-based adjustment of algorithmiccomponents have yielded accurate DTMs elsewhere, suchefforts often fail in forest and terrain conditions prevalent inthe temperate rainforests present in our study area. Opti-mizing the laser data acquisition specifications to ensuremaximum pulse penetration to the ground or selecting leaf-off acquisition timing for hardwood or mixed forests wouldprobably improve DTM and ultimately tree height estima-tion accuracy. LiDAR data discretization with both leading-edge and generic algorithms offers hope for improvingestimates of tree height by quantifying tree top underesti-mation. Of the forest structure parameters that can be as-sessed via LiDAR, only canopy cover was found to becorrelated (weakly) to height error. To estimate laser-de-rived heights in temperate rainforests growing on steepslopes with an accuracy and precision comparable to what isattainable in more conducive vegetation and terrain, tech-niques would need to be developed to assess tree lean, andspecifications for operating the laser instrument would needto be modified with the aim of improving canopy penetra-tion rates.
Literature CitedALDRED, A.H., AND J.K. HALL. 1975. Application of large-scale
photography to a forest inventory. For. Chron. 51(1):7 p.ANDERSEN, H.E., R.I. MCGAUGHEY, AND S.E. REUTEBUCH. 2005.
Estimating canopy fuel parameters using airborne LIDAR data.Rem. Sens. Environ. 94:441-449.
ANDERSEN, H.E., S.E. REUTEBUCH., AND R.I. MCGAUGHEY. 2006.Rigorous assessment of tree height measurements obtainedusing airborne lidar and conventional field methods. Can. 1.Rem. Sens. 32(5):355-366.
AXELSSON, P.E. 1999. Processing of laser scanner data-Algorithms and applications. Photogramm. Rem. Sens.54(2-3):138-147.
BALTSAVIAS, E.P. 1999. A comparison of between photo gramme-try and laser scanning. Photogramm. Rem. Sens. 54:83-94.
BRACKETT, M. 1977. Notes on TARIF tree-volume computation.DNR Report 24. State of Washington, Department of NaturalResources, Olympia, WA. 132 p.
BRANDTBERG, T., T.A. WARNER, R.E. LANDENBERGER, AND J.B.MCGRAW. 2003. Detection and analysis of individual leaf-offtree crowns in small footprint, high sampling density lidar datafrom the eastern deciduous forest in North America. Rem. Sens.Environ. 85(3):290-303.
CHASMER, L., C. HOPKINSON, B. SMITH, AND P. TREITZ. 2006.Examining the influence of changing laser pulse repetitionfrequencies on conifer forest canopy returns. Photogramm.Eng. Rem. Sens. 72(12):1359-1367.
CHEN, Q. 2007. Airborne lidar data processing and informationextraction. Photogramm. Eng. Rem. Sens. 73(2):109-112.
CHEN, Q., P. GONG, D.D. BALDOCCm, AND G. XIE. 2007. Filteringairborne laser scanning with morphological methods. Photo-gramm. Eng. Rem. Sens. 73(2): 171-18l.
CLARK, M.L., D.B. CLARK, ANDD.A. ROBERTS. 2004. Small-foot-print lidar estimation of sub-canopy elevation and tree height ina tropical rain forest landscape. Rem. Sens. Environ. 91:68-89.
ELMQVlST, M., E. JUNGERT, F. LANTZ, A. PERSSON, AND U.SODERMAN. 2001. Terrain modelling and analysis using laserscanner data. Int. Arch. Photogramm. Rem. Sens. 34-3/W4:219-227.
GAVEAU, D., AND R. HILL. 2003. Quantifying canopy heightunderestimation by laser pulse penetration in small-footprint
airborne laser scanning data. Can. J. Rem. Sens. 29:650-657.GOOVAERTS, P. 1997. Geostatistics for natural resources evalua-
tion. Oxford University Press, New York, NY. 483 p.HARALICK, R.M., S.R. STERNBERG, ANDX. ZHUANG. 1987. Image
analysis using mathematical morphology. IEEE Trans. PatternAnal. Mach. Intell. PMI-9:523-550.
HINSLEY, S.A., R.A. HILL, P.E. BELLAMY, ANDH. BALTZER. 2006.The application of LiDAR in woodland bird ecology: climate,canopy structure and habitat quality, Photogramm. Eng. Rem.Sens. 72:1399-1406.
HODGSON, M.E., J.R. JENSEN, L. SCHMIDT, S. SCHILL, AND B.DAVIS. 2003. An evaluation of LIDAR- and IFSAR-deriveddigital elevation models in leaf-on conditions with USGS Level1 and Level 2 DEMs. Rem. Sens. Environ. 84:295-308.
HYYPPA, J., H. HYYPPA, P. LITKEY, X. Yu, H. HAGGREN, P.RONNHOLM, U. PYYSALO, J. PITKANEN, AND M. MALTAMO.2004. Algorithms and methods of airborne laser scanning forforest measurements. P. 82-89 in Proc. of the ISPRS laser-scanners for forest and landscape assessment, Thies, M., B.Koch, H. Spiecker, and H. Weinacker (eds.). Albert LudwigsUniversity, Freiburg, Germany.
HYYPPA, J., H. HYYPPA, M. MALTAMO, X. Yu, E. AHOKAS, ANDU.PYYSALo. 2003. Laser scanning of forest resources-Some ofthe Finnish Experience. P. 53-59 in Proc. of the ScanLaserscientific workshop on airborne laser scanning offorests, Sep-tember 3-4, Umea, Sweden.
HYYPPA, J., U. PYYSALO, H. HYYPPA, AND A. SAMBERG. 2000.Elevation accuracy of laser scanning-derived digital terrain andtarget models in forest environment. P. 139-147 in Proc. of theEARSel-SIG-workshop on LIDAR, June 16-17, 2000,Dresden/FRG.
JOHNSON, E.W. 1958. The effect of photographic scale on preci-sion of individual tree-height measurement. Photogramm. Eng.24(1):142-152.
KOBLER, A., N. PFEIFER, P. OGRlNC, L. TODOROVSKI, K. OSTIR,AND S. DZEROSKI. 2007. Repetitive interpolation: A robustalgorithm for DTM generation from aerial laser scanner data inforested terrain. Rem. Sens. Envir. 109:9-23.
KOVATS, M. 1997. A large-scale aerial photographic technique formeasuring tree heights on long-term forest installations. Pho-togramm. Eng. Rem. Sens. 63(6):741-747.
KRAUS, K., AND N. PFEIFER. 1998. Determination of terrain modelsin wooded areas with airborne laser scanner data. Photogramm.Rem. Sens. 53:193-203.
LEFSKY, M., W. COHEN, G. PARKER, ANDD. HARDING. 2002. Lidarremote sensing for ecosystem studies. Bioscience 52:19-30.
LIM, K., P. TREITZ, M. WULDER, B. ST-ONGE, AND M. FLOOD.2003. LiDAR remote sensing of forest structure. Progr. Phys.Geogr. 27(1):88-106.
LOHMANN, P., A. KOCH, AND M. SCHAEFFER. 2000. Approaches tothe filtering of laser scanner data. Int. Arch. Photogram. Rem.Sens. 33-B311 :534-541.
MALTAMO, M., K. MUSTONEN, J. HYYPPA, J. PiTKANEN, AND X.Yu, 2004. The accuracy of estimating individual tree variableswith airborne laser scanning in a boreal nature reserve. Can. J.For. Res. 34:1491-1801.
MCCOMBS, J.W., S.D. ROBERTS, ANDD.L. EVANS. 2003. Influenceof fusing Lidar and multispectral imagery on remotely sensedestimates of stand density and mean tree height in a managedLoblolly Pine plantation. For. Sci. 49(3):457-466.
MCGAUGHEY, R.J. 2009. FUSION/LDV: Softwarefor LIDAR dataanalysis and visualization. Available online at forsys.cfr.washington.edu/fusion/fusionlatest.html; last accessed Oct. 27,2009.
MEANS, J., S. ACKER, B. FITT, M. RENSLOW, L. EMERSON, ANDC.HENDRIX. 2000. Predicting forest stand characteristics withairborne scanning LIDAR. Photogramm. Eng. Rem. Sens.66:1367-1371.
NAESSET, E. 1997. Determination of mean tree height of foreststands using an airborne laser scanner data. Photogramm. Rem.Sens. 52:49-56.
NAESSET, E. 2002. Predicting forest stand characteristics withairborne laser using a practical two-stage procedure and fielddata. Rem. Sens. Envir. 80:88-99.
NILSSON, M., T. BRANDTBERG, O. HAGNER, J HOLMGREN, A.PERSSON, O. STEINVALL, H. STERNER, U. SODERMAN, AND H.OLSSON. 2003. Laser scanning of forest resources-The Swed-ish experience. P. 43-52 in Proc. of the ScanLaser scientificworkshop on airborne laser scanning of forests, September3-4, Umea, Sweden.
PERSSON, A., J. HOLMGREN, AND U. SODERMAN. 2002. Detectingand measuring individual trees using an airborne laser scanner.Photogramm. Eng. Rem. Sens. 68(9):925-932.
PILLSBURY, N.H., AND M.L. KIRKLEY. 1984. Equations for total,wood, and saw-log volume for thirteen California hardwoods.PNW Res. Note PNW-414. Pacific Northwest Res. Stn., Port-land, OR. 52 p.
POPESCU, S.C., R.H. WYNNE, AND R.F. NELSON. 2002. Estimatingplot-level tree heights with Iidar: local filtering with a canopyheight based variable window size. Comput. Electron. Agric.37:71-95.
POPESCU, S., AND K. ZHAO. 2007 A voxel-based LIDAR methodfor estimating crown base height for deciduous and pine trees.Rem. Sens. Environ. 112(3):767-781.
REUTEBUCH, S.E., R.J. MCGAUGHEY, H.E. ANDERSEN, ANDW.W. CARSON. 2003. Accuracy of a high-resolution lidar ter-rain model under a conifer forest canopy. Can. J. Rem. Sens.29(5)527-535.
SITHOLE, G. 2001. Filtering of laser altimetry data using a slopeadaptive filter. Int. Arch. Photogramm. Rem. Sens. 34-31W4:203-210.
SITHOLE, G., ANDG. VOSSELMAN. 2004. Experimental comparisonof filter algorithms for bare-earth extraction from airborne laserscanning points clouds. ISPRS J. Photogramm. Rem. Sens.59:85-101.
SOHN, G., AND I. DOWMAN. 2002. Terrain surface reconstructionby the use of tetrahedron model with the MOL criterion. Int.Arch. Photogramm. Rem. Sens. 34-3A:336-344.
VOSSELMAN, G. 2000. Slope based filtering of laser altimetry data.Int. Arch. Photogram. Rem. Sens. 33-B3/ 2:935-942.
WEINACKER, H., B. KOCH, ANDR. WEINACKER. 2004. TreeVis-Asoftware system for simultaneous 3D real time visualization ofDTM, laser raw data, multispectral data, simple tree and build-ing models. P. 95 in Proc. of the ISPRS working group VIII/2on "Laser-scanners for forest and landscape assessment, " Oct.3-, Freiburg, Germany, Vol. 90.
WULDER, M. 2003. The current status of laser scanning of forestsin Canada and Australia. P. 21-33 in Proc. of the ScanLaserScientific Workshop on Airborne Laser Scanning of Forests,Sept. 3-4, Umea, Sweden.
Yu, X., J. HYYPPA, H. KAARTINEN, AND M. MALTAMO. 2004.Automatic detection of harvested trees and determination offorest growth using airborne laser scanning. Rem. Sens. Envir.90:451-462.
ZHANG, K., S. CHEN, D. WHITMAN, M. SHYU, J. YAN, AND C.ZHANG. 2003. A progressive morphological filter for removingnonground measurements from airborne LIDAR data. IEEETrans. Geosc. Rem. Sen. 41(4):872-882.