Embed Size (px)
Citation preview

CHALLENGES IN USING THE GRAPHICS CALCULATOR IN TEACHING STATISTICS IN A MATRICULATION PROGRAM
Saras Krishnan, Institute of Graduate Studies, University Malaya, Malaysia
Noraini Idris, Faculty of Education, University Malaya, Malaysia
The teaching and learning of statistics has evolved tremendously over the years owing to the reformation in statistics education that changed the goals of statistics curriculum and the advancement of technology that revolutionized the pedagogy in statistics classrooms. On the whole, students’ knowledge acquisitions do not depend solely on the teacher anymore but students assume active roles in constructing knowledge with the correct guidance from the teacher. Moreover, with technological tools instead of concentrating on lengthy and repetitive calculations, students can focus in learning and understanding the important statistical concepts. Hand-held technologies such as the graphics calculators have paved the way for constructive and exciting learning experience. However, in developing countries such as Malaysia the use of graphics calculators in statistics classrooms poses challenges even to teachers and instructors of statistics.
INTRODUCTION
Use of technologies in mathematics classrooms basically resulted in a paradigm shift in the focus of teaching from giving importance to routine computations and procedural knowledge to giving more attention in cultivating students’ conceptual knowledge. The global advances in technologies created more opportunities to change the pedagogy of teaching mathematical subjects in terms of the methods and the materials used (Rowell, 2004). Students need not longer trouble themselves with laborious and often repetitive calculations that most of the times diminish their joy of learning mathematics. Instead, integrating technologies into the teaching and learning of mathematics enables students to direct their attention to other aspects of mathematics learning such as ‘exploration, decision making, reflection, reasoning and problem solving’ (Noraini, 2004, p.45). Although rapid technological development has greatly influenced the pedagogy of mathematics, Collins and Mittag (2005) opine that there has been few research and publications on the usage of graphics calculator in statistics classrooms. We also find that most publications highlight the advantages of using the graphics calculator in the teaching of mathematics and statistics but do not elaborate much on the problems faced by the teachers and the students alike. However, to achieve a successful teaching and learning using technology, we must also consider the setbacks encountered and constantly find ways for continual improvement.
In view of that, in this paper we would like communicate the challenges faced by teachers in using graphics calculator in teaching statistics to Malaysian students in an external Australian matriculation program in a private higher learning institution in Malaysia. Although the use of graphics calculator in the teaching and learning of mathematics in Malaysia is not made compulsory yet, educators and researchers have been showing increasing interest in investigating the use of graphics calculator in teaching various topics in mathematics and statistics mainly but not limited to the schools students in Malaysia. The reason that studies involving for instance pre-university and tertiary students are scarce probably is because the use of any technological tools in their learning, other than the scientific calculator, is governed by the requirements of the courses the students undertake. As this is a theoretical paper, instead of reporting results from data analysis, we are basically sharing our experience and observation in conducting statistics lessons with the aid of a graphics calculator. It is our hope that the experience and reflections shared will give some insights to other teachers of statistics to look back at their own classroom teaching and find strategies to incorporate the use of graphics calculator more effectively. We also hope to receive ideas and suggestions from other fellow teachers and researchers on ways to better integrate graphics calculator into classroom teaching in a developing country such as Malaysia. LITERATURE REVIEW
Graphics calculators are hand-held, battery powered devices that are equipped with functions to plot graphs, give numerical solutions to equations, perform statistical calculations,

operation on matrices and to perform more advanced mathematical functions such as algebra, geometry and advanced statistics (Kor & Lim, 2004, p.69). The graphics calculator is a powerful tool because it empowers students in solving mathematical problems by actively engaging them in doing the mathematics (Noraini et. al., 2010, p.1). Students form better understanding of the mathematics involved and are motivated to confront more complex problems (Noraini et. al., 2003). More specifically, the use of graphics calculators in classroom teaching improves ‘spatial visualization skills’, ‘critical thinking ability’ and ‘understanding of connections among graphical, tabular, numerical and algebraic representations’ (Rich, 1991 as cited in Noraini, 2004, p.46). However, to achieve these goals the teachers need to change their way of teaching. They need to form ‘working relationships’ with their students and ‘break traditional barriers’ (Noraini, 2004, p.52) to allow students to be creative and exercise their higher order thinking. In other words, a teacher’s role is not to transfer knowledge anymore but takes the role of a facilitator and guide. More importantly, teachers must make ongoing efforts to provide students with sufficient, interesting and different learning experiences to ensure successful outcomes. In short, the use of graphics calculator coupled with teacher’s instructional guidance induces active learning that improves students’ performance in mathematics (Nor’ain et. al., 2011).
Noraini (2004) who views the graphics calculator as ‘a cross between a computer and a scientific calculator’ conveyed that past research testified that the use of graphics calculators not only minimized routine calculations but also enabled students to perform computations faster and with greater accuracy. As such, because they no longer need to be pinned down with mundane calculations in large quantities, students’ learning can be diverted to the important concepts and processes which in turn will enhance students’ mathematical performance. Besides that, graphics calculators aid students’ visualization of mathematical concepts, improve students’ problem solving skills and of course provide graphical representations of the mathematical concepts. More importantly, graphics calculators help to link geometry with algebra, algebra with statistics and statistics with real-world problem situations (Noraini et. al., 2003). These factors are supported by the findings of Noraini’s (2004) research project that investigated the use of the Texas Instrument’s TI-83 Plus graphing calculator as a tool to improve students’ achievement and to develop their self confidence. This study involved both the quantitative and qualitative data collected from Form Four (Grade 11) students from two secondary schools in Malaysia. She found that students in the experimental group who learned mathematics by using the graphics calculator for five weeks showed significantly greater improvement on their mathematics achievement than students in the control group who learned mathematics in the traditional way. More importantly, a high percentage of the students from the experimental group affirmed that they enjoyed mathematics more and that they were able to better perceive the relationships between the mathematical concepts.
Positive results were also reported in the study by Nor’ain et. al. (2011). Their study investigated the effect of the use of graphics calculator as a pedagogical tool in mathematics teaching and learning of Malaysian Form Four students. This particular paper discussed the third phase of a progressive three-experiment study. The results from all three phases show that students’ performance in straight line topic was enhanced with the integration of graphics calculator compared to the use of conventional instruction. Also, it was found that students exhibited higher level of meta-cognitive awareness and spent less amount of mental effort during the learning and assessment periods. The researchers found the graphics calculator to be an effective instructional tool in facilitating mathematics learning because it reduces students’ cognitive load. In other words, students need not shift back and forth from the problem to the computations to solve the problem which among others include algebraic manipulations and drawing graphs. Instead, by focusing on the problem itself, students’ understanding of mathematical tasks is enhanced. Although the mean test performance between the group using the graphics calculator and the group taught using conventional instruction was significant, there was no significant interaction observed between the instructional strategy and the level of mathematics ability. This led to the conclusion that the use of graphics calculator is effective on both the low ability and average ability students. The study concluded that the graphics calculator is an efficient and effective instructional tool in facilitating students’ learning of mathematics.
On the other hand, the findings from the study conducted by Collins and Mittag (2005) did not register a significant increase in students’ performance after using the graphics calculator in two introductory statistics classes. The objective of their study was to investigate the relationship between graphics calculator and students’ learning of introductory statistics at the University of Texas at San Antonio. They compared the performance of students from two classes taught by the same instructor whereby one class used graphics calculators capable of inferential statistics whilst the other class used non-inferential graphics calculator. Data collected from the quiz, test and final examination on the topics hypothesis tests and confidence intervals showed that the performance of the students using the inferential graphics calculator did not differ significantly from the performance of the students using the non-inferential graphics calculator. Interestingly, both group of students seemed to have better conceptual understanding than procedural understanding. The study suggested further exploration into the use of inferential graphics calculator for student-learning in introductory statistics courses. The use of inferential calculator in an introductory statistics course would enable less time on computation and more time on analysis of real-world data.
The main objective of incorporating technology into the teaching and learning of mathematics and statistics is to increase students’ understanding of mathematical concepts and their abilities to deal with more realistic problems (Stacey, 2004). On the whole, research have proven that the use of graphics calculator in mathematics and statistics classrooms have many benefits such as improving students’ performance (e.g., Acelajado, 2004; Noraini, 2004; Nor’ain et. al., 2011) and helping students to develop more positive attitudes towards the learning of mathematics and statistics (e.g., Acelajado, 2004; Kor & Lim, 2004; Horton, et. al., 2004). However, a major drawback is that students may neglect the basic and underlying mathematical concepts by being too dependent on the graphics calculator in their problem solving (Hailiza, 2004). They may also encounter difficulties in using the graphics calculator itself due to time constraint in learning to use this technology (Acelajado, 2004). Therefore, Stacey (2004) advocated that teachers guide students to be ‘judicious users of technology’. This means students are able to determine whether using technology to solve a mathematical problem is the more efficient way and must be able to make sense of the results they get. By doing this, we can avoid having students use the graphics calculator in an unthinking and ‘button pushing’ manner which defeats the entire purpose of integrating graphics calculator into the teaching of mathematics and statistics.
GRAPHICS CALCULATOR IN MALAYSIAN EDUCATION SCENARIO
The rapid advancement of technology in the developed countries and the increasing availability to access these technologies in the developing countries had positive consequences on the use of technology as a teaching and learning tool in statistics classrooms. In specific, the use of hand-held technologies, most commonly the graphics calculators has gained ubiquitous acknowledgement as a powerful pedagogical tool to promote better learning among students (Nor’ain et. al., 2011). In Malaysia, the use of graphics calculator is still at the initial stage compared to the developed nations (Noraini, 2004). Graphics calculator was first introduced at secondary schools level in the year 2003 (Husna et. al., 2005) when the Ministry of Education together with Texas Instrument provided trainings to 500 mathematics and science teachers from 250 schools nationwide on the usage of TI-83 Plus graphing calculator. Then, from years 2004 to 2007, another 120 secondary schools in Malaysia were equipped with the TI-84 Plus model graphing calculator. Further, from year 2006, examples involving the use of graphics calculator have been included in the Form Four Mathematics and Additional Mathematics textbooks (Noraini & Chew, 2011).
More importantly, Malaysian Integrated Curriculum for Secondary Schools Mathematics places a lot of emphasis on the use of technology in the teaching and learning of mathematics. But, although the secondary school level public examinations allow the use of scientific calculators, the use of graphics calculators is not allowed. This is probably one of the main reasons for the objections encountered by those involved in the decision-makings of the education system in their attempt to incorporate and increase the use of graphics calculators in the teaching and learning of

mathematics at school levels. Nonetheless, to keep abreast with the education systems of the developed nations, many efforts have been taken by the government and other concerned parties in implementing the graphics calculator in the mathematics and sciences disciplines (Noraini et. al., 2010). Further, the annual National Conference on Graphing Calculator has been a major avenue for local educators to be exposed to the graphics calculators and incorporating them into their classroom lessons. Thus far, the use of graphics calculator in the mathematics and statistics classrooms in Malaysia has been well received and has been successful as shown by some of the studies conducted on this usage.
The study conducted by Noraini et. al. (2003) amongst others investigated school teachers’ perceptions on the use of graphics calculator in the teaching and learning of mathematics. The study involved 11 teachers and 712 students from both rural and urban schools in various states in West Malaysia. The teachers were given a four-days training on the usage of TI-83 Plus graphics calculator which has the capabilities of a scientific calculator, a programmable calculator and an interactive computer system. With TI-83 Plus students can plot graphs, manipulate symbolic expressions and perform matrix calculations. The teachers’ perceptions were investigated from four aspects which are the mathematics content, the students’ behavior, usefulness of TI-83 Plus in the mathematics teaching and learning, and the teachers’ personal attitude towards graphics calculator. One of the two mathematics content in this study was statistics. It was found that the teachers responded positively towards the use of graphics calculator in their teaching of statistics. The study reported that more than 90% of the teachers found it was easier to teach statistics with the graphics calculator whereas 72.72% said it was easier to get the students’ attention and co-operation in the classroom lessons.
Kor and Lim’s (2003, 2004) case study involved second year business studies students from a local university who has no prior experience in using graphics calculators. The main objective of the study was to explore students’ views on the use of graphics calculator in the learning of statistics and on the impact of graphics calculator on their understanding of statistics. In specific, they wanted to find out if any correlation existed between students’ attitudes and confidence level and their learning of statistics when graphics calculators are used as an intervention. Some of the documented advantages are students are found to improve their understanding of statistics because the graphics calculator not only helps students’ visualization of the statistical concepts but it enables students to explore and experiment with different values in learning different statistical concepts. As such, students indirectly build their confidence and as they find the lessons more exciting and enjoyable, their negative perceptions about statistics change. On the other hand, among the difficulties conveyed by some of the students are that they found the instructions to use the graphics calculator complicated with too many steps to follow. Therefore, the students still prefer the paper-and-pencil way of performing their statistical calculations. Moreover, some students regard usage of calculator as a form of cheating since they are not actually doing the statistical calculations involved. Although results generally showed positive relationship between students’ confidence in using the graphics calculator and their attitude towards statistics, there was no significant correlation between the two variables. Further, it was concluded that the advantages of using the graphics calculator as a teaching aid to promote conceptual understanding outweighs its disadvantages.
Generally, the studies conducted in Malaysia on the usage of graphics calculator are quantitative in nature. Nafisah’s (2007) study concerning teachers’ feedback on the use of graphic calculator in the teaching and learning mathematics used a survey descriptive research design. The research sample consisted of teachers from the secondary and primary schools in the state of Johor and who participated in a graphics calculator course conducted by the Universiti Tun Hussein Onn Malaysia. Data was collected using questionnaire divided into five main sections which are respondents’ background, implementation of graphics calculator by the school management, teachers’ skill, teachers’ acceptance and the possibility of using the graphics calculator in class. Analysis was carried out using descriptive statistics including the percentage, mean and standard deviation. More specifically, the first section was analyzed using percentage whereas the other sections were analyzed using mean and standard deviation. Research findings showed that the teachers have a high level of acceptance of the usage of the graphics calculator in class. Also, the

school management provides the teachers with information and encouragement that they need. However, the hindrance to using the graphics calculator in class would be that the teachers’ skill and knowledge are limited, and thus they have low level of confidence. In view of these findings, the researcher feels that it is important to provide trainings for the teachers and to monitor the implementation process. The study by Norazah (2010) involved secondary school teachers in the state of Selangor and their opinion on the pedagogical usability of the Geometer’s Sketchpad (GSP) in the teaching of mathematics. This study provided positive feedbacks and benefits on using this tool in the teaching and learning of mathematics but did not explore in depth the teachers’ perception and the difficulties in incorporating this tool in their teaching. Data was collected using a Likert scale questionnaire that ranged from strongly agree to strongly disagree and analyzed using the descriptive statistics.
The paradigm shift in the teaching and learning of mathematics and statistics coupled with the advancement in the technological tools compel education systems all over the world to revolutionize their pedagogy. However, changes are almost always met with barriers both internal and external. For a developing country such as Malaysia, the availability of the technological tools and the accessibility to the teaching resources is one of the main challenges particularly in the more remote or rural areas. Also, the teachers may not be skilled enough to be able to transform their way of teaching. Thus, it is imperative that these teachers are provided with trainings and support to give them the confidence in using tools such as the graphics calculator in their teaching. This will influence other concerns such as teachers’ creativity in organizing and structuring their lesson plans, managing their time to incorporate the graphics calculator in their classroom teaching and making changes in the way they assess students’ learning of mathematics and statistics. In addition, when the teachers have the knowledge, the expertise and the confidence to use the graphics calculator in their teaching, they will be more convincing in doing so. This in turn will help to encourage the students to be better learners because students will be better guided and motivated to explore the graphics calculator and their understanding of the subject matter. Consequently, as suggested by the constructivist approach, the responsibility of learning shifts from the teacher to the students. Because graphics calculator is a hands-on tool, lessons and practice exercises should be able to encourage and motivate students to use the graphics calculator in the statistical analyses besides developing and enhancing their critical thinking skills.
USE OF GRAPHICS CALCULATOR IN TEACHING STATISTICS IN A MATRICULATION PROGRAM
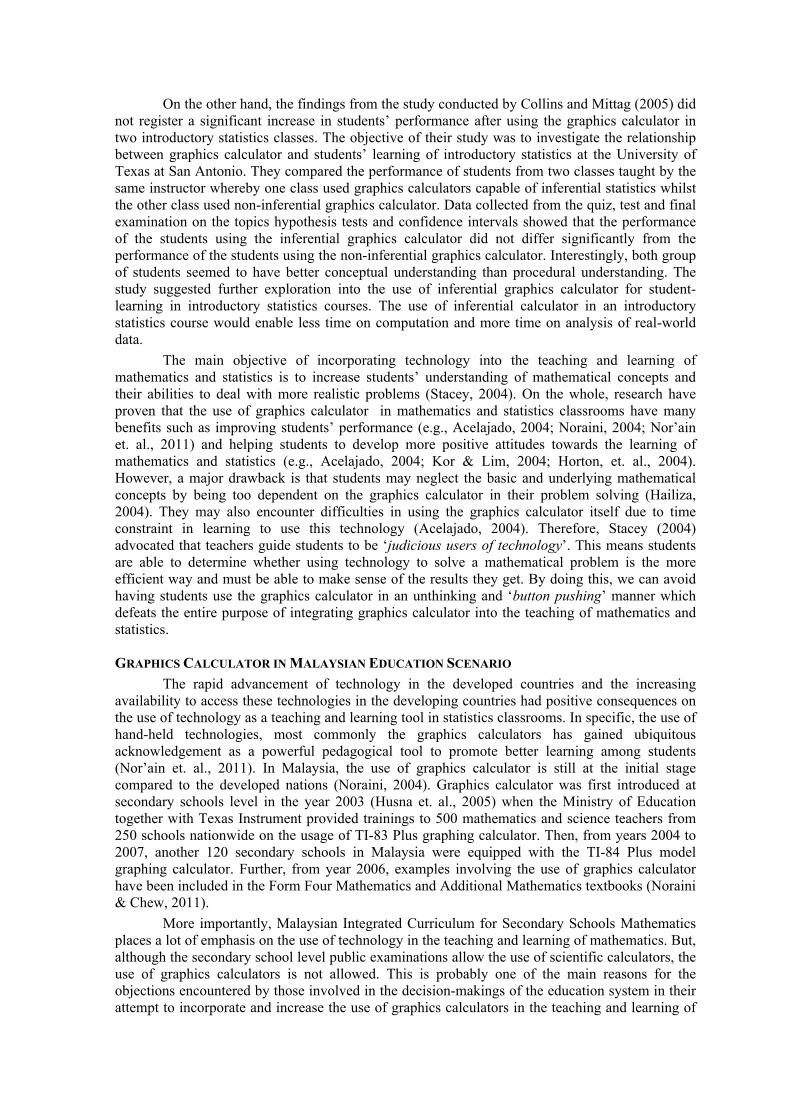
Diagram 1 Structure of the Malaysian education system

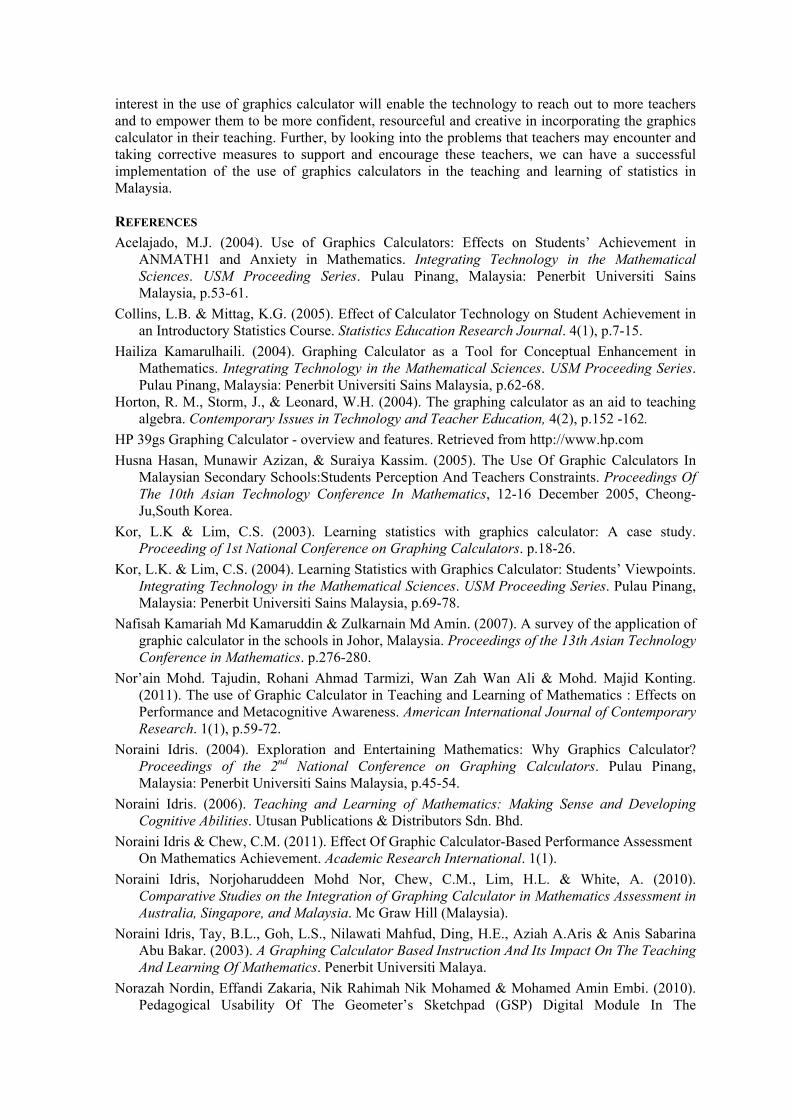
Diagram 1 above shows the structure of the Malaysian education system from the primary school level to the higher education level. The post school academic progression follows three paths which are classified as technical, academic and vocational. The matriculation program discussed here is in the higher education academic category. More specifically, Diagram 2 shows the proportion of tertiary education providers in Malaysia whereby the government provides 60% of the tertiary education and the private sector provides the remaining 40%.
Diagram 2 Malaysian tertiary education providers
It is evident then that the private education in Malaysia has a substantial importance in gearing the direction of Malaysian education. At present, there is an increasing number of students especially those from the well-off families who opt for private education because it makes them more saleable in the global employment market. In lieu of that, Malaysia has initiated many approaches in order to keep up with the current needs of the changing world. Amongst others, in the 9th Malaysian Plan from 2006 to 2010, a total of RM40.3 billion which is about 21% of the total national budget allocation was set aside for the expenditure of education and training development. Besides that, the National Higher Education Strategic Plan is responsible in shaping Malaysia to be an international centre of educational excellence by year 2020 which means it is important to build on the strength and opportunities provided by the private education sectors as a way to for the country to grow in all aspects particularly in engaging and empowering its citizens with technological knowledge and skills. In fact, the present mathematics curriculum outlines the application of technology as one of the objectives of teaching and learning of mathematics as such “…employ the latest technology to help students understand mathematical concepts in depth, meaningfully and precisely and enable them to explore mathematical ideas”.
In this paper, we discuss the challenges faced by the teachers in teaching statistics with the aid of graphics calculator in an Australian matriculation program at a private higher learning institution in Malaysia. According to Collins and Mittag (2005), scientific calculators have been used in the teaching and learning of statistics for the past two decades but the use of graphics calculators only begun fifteen years ago. Moreover, few papers discussing graphics calculator in teaching of statistics have been published since past research has not focused much on the use of calculator technology in statistics classrooms. The majority of students enrol into this program after completing their Form Five or Grade 12 education. It will be useful to note that schools in Australia incorporate teaching of mathematics using graphics calculator in their schools so the teachers teaching this course in Australia may not be facing similar challenges. On the contrary, the students in this matriculation course in Malaysia are probably using the graphics calculator for the first time in learning statistics and solving statistical problems hence are likely to face more difficulties in doing so. The graphics calculator used in this matriculation course is the Hewlett Packard HP39gs graphics calculator which is said to be an ideal classroom graphing tool especially for students from high-school through college. It has large adjustable contrast split screen that renders greater readability. The symbolic, numeric and graphing views provide greater teaching and learning opportunities whilst the intuitive algebraic data entry allows students to solve problems as if working on paper. Also, it allows students to create and store custom applets with 256KB memory.

Diagram 3 The graphics calculator HP39gs and the emulator
The picture on the left of Diagram 3 shows the graphics calculator HP39gs whilst on the right is what appears on the screen of the computer used by the teachers. This is an effective way of teaching students to use the graphics calculator because instead of attending to the students one at a time, the teacher can show the instructions on a projected screen and the entire class can follow the steps easily and clearly. It also helps to control the speed of teaching because when the teacher is actually performing the calculations on the screen instead of just providing the students with instructions, teacher and students work together at a more manageable speed instead of the students being left behind and the teachers being oblivious to it. Statistics are covered in two out of the ten chapters in these matriculation students’ mathematics course. They basically use HP39gs to calculate the mean and standard deviation of data sets and probability distributions, and to find the probability values involving normal and binomial distributions. Although not emphasized on, HP39gs can also be used to work on hypothesis test and confidence intervals. However, the assessment materials expect students to show detailed solution steps involving these two concepts. Following are the instructions to perform the mentioned computations using HP39gs.
Computing mean and standard deviation for a sample. Step 1: Click on APLET Statistics.
Step 2: Key in the data. Here, we show the example for 6 data. Step 3: Press ‘STATS’. It is the most right button.

Step 4: Read the sample mean and sample standard deviation values. For this example the sample mean is 16.42 and the sample standard deviation is 1.09 when
corrected to two decimal places.
Computing mean and standard deviation for a probability distribution. Step 1: Click on APLET Statistics. Step 2: Key in the values of random variable (commonly designated as x) in C1 and the corresponding values of probabilities (commonly designated as P(x)) in C2. Here, we show the example for 5 values of the random variable.
Step 3: Click on SYMB and change 1 to C2.
Step 4: Read the mean and standard deviation as before. For this example the sample mean is 2.98 and the sample standard deviation is 1.36 when
corrected to two decimal places.
These procedure is followed for large sets of data as well. Students will key-in the data in APLET Statistics and proceed to find the mean and standard deviation values in the same manner. Finding the probability values for a normal distribution. On the HOME view, type
UTPN(μ,σ2,X) where this instruction generates the probability of getting more than X for a normal probability distribution. However, to activate this instruction we need the APLET StatPack39 which is not in-built but can be obtained from the calculator’s homepage.

For instance, the probability of Pr (X>180) for a normal probability distribution with mean 182.3 and standard deviation 9.6 is 0.595 (correct to three significant figures) as shown below.
Finding the probability values for a binomial distribution. On the HOME view, type
BPDF(n,p,X) to find the probability of getting X or BCDFn,p,X to find the probability of getting less than or equals to X for a binomial probability distribution. For instance, to find the probability of P(X = 2) for a binomial probability distribution with n=25 and p = 0.05, students will type BPDF(25,0.05,2) whereas to find the probability of P(X ≤ 2) students will type BCDF(25,0.05,2) for the same binomial probability distribution. The results obtained using HP39gs are shown below.
The challenges that we faced in using HP39gs in teaching statistics in this matriculation course are primarily in terms of time factor, teaching pedagogy and issues concerning assessments. The mathematics syllabus for this course contains ten chapters which is taught in the duration of 10 months for students who enrol in January and in the duration of 7 months for students who enrol in March of an academic year. Both cohorts of students take their public examination in the month of November of the same year. Statistics are taught in the second semester of their two-semester study which is contained in the seventh and eight chapters of the textbook. Besides that, the mathematics syllabus covers algebra, calculus and matrices as well. Time is definitely a crucial factor because the teachers not only have to complete the ten chapters comprising of different areas of mathematics, they also have to teach and guide students in answering questions which are of different nature than their secondary school mathematics such as requiring students to reason their answers and to form conjectures. Thus, teachers are not able to maximize the use of HP39gs in their teaching and are not able to provide the students with enough opportunities to explore and discover the advantageous of using HP39gs to help them construct their understanding more successfully.
Therefore, more often the graphics calculator is used as just another calculating tool similar to the scientific calculator. In other words, students regretfully use the HP39gs in a methodical manner but are not able to extent their limited understanding of statistics to more real-life and complex problem situations. This could also be due to the factor that the assessments do not actually take into account students’ ability and resourcefulness in using the graphics calculator. On the contrary, the statistics questions in the tests and examinations are basically designed such a way that there is minimal use of HP39gs other than to calculate the mean and the standard deviation or to find the probability. In these instances, the capability of the graphics calculator is greatly compromised and reduced to those of a scientific calculator. If students have a choice not to use the graphics calculator in their assessment, then they probably will not be as keen to learn to use this technology. Instead they would probably rather use the time and energy to learn other “important things”. Therefore, as put forward by Noraini, et. al. (2010, p.28), in designing assessment tasks to

integrate the graphics calculator, the most important decision to be made is whether to “allow” graphics calculator or to “require” the graphics calculator to be used in that tasks. PEDAGOGICAL CONSIDERATIONS
As mentioned in the earlier parts of this paper and is emphasized again in the next section, teachers must change their pedagogy of teaching because they play a pivotal role in incorporating the use of graphics calculator into education systems effectively and successfully. Conventional method of delivering knowledge cannot go hand-in-hand with using graphics calculator to teach statistics. Instead, teachers must be able to synergize teaching statistics with the implementation of graphics calculator so that students can appreciate the use of graphics calculator in learning statistics and not regard it as a mere tool that speeds up calculations. Teachers must help students to explore and investigate the mathematical problems while encouraging students to learn on their own (Husna et. al., 2005, p.308). In other words, teachers solve mathematical problems in classroom with students and not for students. We find that many students do not understand how the instructions of HP39gs can be used to their benefit because they had limited exposure to the different capabilities of this technology. It is a huge and demanding not to mention time-consuming task for the teachers in concern to revise their lesson plans to allow time for both the teaching of HP39gs and for students to understand the statistical concepts. The teachers also need to be creative enough to incorporate the use of technology into their lessons plans for maximum benefits to be gained by both parties. Ideally, classroom teaching need to be set in a more constructive environment where students are given ample scope and opportunity to discover, explore, question and work with statistical problems in an explorative and innovative way to enhance learning. Teachers also need to be equally excited and motivated to learn and continuously seek new knowledge so that besides making learning more exciting for students, the teachers are well-equipped to deal with students’ queries and curiosities in using the tool.
If a student learns differently, then assessment must be done differently (Rosihan et. al., 2002, p.60). Quoting Noraini et. al. (2010), if graphics calculator were to be integrated into the statistics curriculum, then we must strive to reduce the gap between classroom conditions and assessment conditions. When assessments involve minimal or unintelligent use of graphics calculator, we would inadvertently fail to create ‘judicious users of technology’ as mentioned by Stacey (2004). Although teachers have no control over the external examination, they have enough room to be more imaginative with their assessments at the school level. Rosihan et. al. (2002) suggested letting students do projects that are designed to foster their understanding and critical thinking of statistics whereby the students consolidate their statistical concepts and principles by applying the methods and techniques learned in the process of working on their projects. Most of the times we tend to play safe by giving assessment tasks that emulates the previous assessments and expect specific answers from students instead of giving assessments that let students provide different perspectives on the same statistical problem. We can even make it more interesting by allowing the students to present their viewpoints and award marks for their efforts. In doing so, we will be shifting the nature of assessment from assessment of learning to assessment for learning. The issue of concern however is whether and to what extent teachers are in favour of the use of graphics calculator in their assessments because it raises the problem of how to set questions that are both equitable and still test the required knowledge (Noraini et. al., 2010, p.111).
Another aspect to be considered in transforming statistics pedagogy is teachers’ attitude because as stated by Noraini (2006, p.141), teachers’ attributes influence their thoughts and behaviours towards students. A teacher who is enthusiastic about using the graphics calculator in the classrooms and believes that the use of graphics calculator can help to develop better understanding among the students will inspire the students to be equally motivated and excited with their own learning. More specifically, teachers from the developing countries particularly must also take it upon themselves the responsibility of continuously developing their technological knowledge and skills besides improving their pedagogical skills. The internet for instance is a wonderful source of ideas and information whereby there are a number of websites and videos on teaching pedagogy, interesting way of teaching certain topics and assessment materials. The internet can be used as an ideal platform for teachers from all over the world to exchange ideas on teaching statistics more effectively and interestingly using the graphics calculator as a learning

tool. This will be especially useful for teachers in the developing countries because they can adopt different kind of strategies and be exposed to newer methods and technologies from their developed counterparts. Among the factors that determine students’ engagement in their work is curiosity and originality (Noraini, 2006). It is up to the teachers then to invoke the curiosity in their students’ mind and to provide the students with authentic data for statistical analysis so that the work is more meaningful for the students. The teacher cannot be a mere presenter but takes the role of a resource person because otherwise the teacher can be completely replaced by the technology. In conclusion, changing the approach of teaching and learning in a statistics classroom is crucial if successful implementation of the graphics calculator into the curriculum of statistics is to be achieved.
CONCLUSION
Technologies such as the graphics calculators ‘offer mathematics teachers with both opportunities and responsibilities’ (Noraini et. al., 2004, p.35). Graphics calculator is a useful tool and teaching aid for introductory statistics courses mainly due to its accessibility and affordability (Collins & Mittag, 2005). Nonetheless, if graphics calculator were to benefit the students in learning statistics, then the teachers have the responsibility to change their own attitude towards the integration of graphics calculator in statistics teaching and most importantly must change the pedagogy in statistics classrooms. Besides that, the teachers must be skilled and resourceful enough to take the opportunity of having this technology to develop students’ higher-level thinking skills and to provide a variety of problem-solving experiences. Noraini et. al. (2010) mentioned a number of past studies that found teachers were in favour of the use of the graphics calculator in their classroom teaching. However, the difficulties a teacher can have in incorporating the graphics calculator into their lessons especially when the students have had little exposure to using any such technology in their earlier schooling periods and the teachers themselves have limited experience in it must also be looked into. Some of these difficulties can be overcome by changing the design of the curriculum of mathematics and statistics to specifically allocate more time for teachers to create a self-motivated learning environment for the students and to design assessments that incorporate the use of graphics calculator in a more viable and useful manner instead of requiring students to use it as a mere calculation tool.
In the context of Malaysian education system, there should be more research on teachers’ perceptions and implementation of graphics calculator in their teaching so that we would be able to understand how teachers’ integration of this technology in their classroom teaching changed in the span of years since the introduction of graphics calculator until present time. This will give us a better perspective on the evolution of graphics calculator in Malaysian classrooms and deeper insights into how a more successful teaching and learning of statistics can be achieved with the support of graphics calculator. Although the use of graphics calculator in Malaysia is still at the initial stage, at present 500 out of 1500 secondary schools in the country have already adopted use of graphics calculator in their classrooms. Following the revision in the Malaysian secondary school curriculum that included the use of graphics calculator in the mathematics and statistics classrooms, the Ministry of Education (MOE) particularly the Curriculum Division Centre provides extensive trainings to mathematics and statistics teachers by working together with Texas Instruments and Statworks. They also collaborate with the Universiti Sains Malaysia (USM) in organizing the annual conference on graphics calculators whereby selected school teachers are given opportunity to attend trainings in Australia. More specifically, the Ministry of Higher Education (MOHE) makes available research grants to universities in the country to carry out research on designing instructional activities using the graphics calculators. Moreover, most public universities in Malaysia offer elective courses on the use of technology such as the graphics calculators in the teaching and learning of mathematics and statistics for teachers and postgraduate students. On the other hand, the undergraduate students can choose to pursue a degree in technology in education. Besides that, statistics’ instructors in private universities and colleges get exposed to using the graphics calculator when teaching external programs such as the one mentioned in this paper. All the efforts taken by the government whilst working together with independent organizations and institutions that have educational
interest in the use of graphics calculator will enable the technology to reach out to more teachers and to empower them to be more confident, resourceful and creative in incorporating the graphics calculator in their teaching. Further, by looking into the problems that teachers may encounter and taking corrective measures to support and encourage these teachers, we can have a successful implementation of the use of graphics calculators in the teaching and learning of statistics in Malaysia. REFERENCES Acelajado, M.J. (2004). Use of Graphics Calculators: Effects on Students’ Achievement in
ANMATH1 and Anxiety in Mathematics. Integrating Technology in the Mathematical Sciences. USM Proceeding Series. Pulau Pinang, Malaysia: Penerbit Universiti Sains Malaysia, p.53-61.
Collins, L.B. & Mittag, K.G. (2005). Effect of Calculator Technology on Student Achievement in an Introductory Statistics Course. Statistics Education Research Journal. 4(1), p.7-15.
Hailiza Kamarulhaili. (2004). Graphing Calculator as a Tool for Conceptual Enhancement in Mathematics. Integrating Technology in the Mathematical Sciences. USM Proceeding Series. Pulau Pinang, Malaysia: Penerbit Universiti Sains Malaysia, p.62-68.
Horton, R. M., Storm, J., & Leonard, W.H. (2004). The graphing calculator as an aid to teaching algebra. Contemporary Issues in Technology and Teacher Education, 4(2), p.152 -162.
HP 39gs Graphing Calculator - overview and features. Retrieved from http://www.hp.com Husna Hasan, Munawir Azizan, & Suraiya Kassim. (2005). The Use Of Graphic Calculators In
Malaysian Secondary Schools:Students Perception And Teachers Constraints. Proceedings Of The 10th Asian Technology Conference In Mathematics, 12-16 December 2005, Cheong-Ju,South Korea.
Kor, L.K & Lim, C.S. (2003). Learning statistics with graphics calculator: A case study. Proceeding of 1st National Conference on Graphing Calculators. p.18-26.
Kor, L.K. & Lim, C.S. (2004). Learning Statistics with Graphics Calculator: Students’ Viewpoints. Integrating Technology in the Mathematical Sciences. USM Proceeding Series. Pulau Pinang, Malaysia: Penerbit Universiti Sains Malaysia, p.69-78.
Nafisah Kamariah Md Kamaruddin & Zulkarnain Md Amin. (2007). A survey of the application of graphic calculator in the schools in Johor, Malaysia. Proceedings of the 13th Asian Technology Conference in Mathematics. p.276-280.
Nor’ain Mohd. Tajudin, Rohani Ahmad Tarmizi, Wan Zah Wan Ali & Mohd. Majid Konting. (2011). The use of Graphic Calculator in Teaching and Learning of Mathematics : Effects on Performance and Metacognitive Awareness. American International Journal of Contemporary Research. 1(1), p.59-72.
Noraini Idris. (2004). Exploration and Entertaining Mathematics: Why Graphics Calculator? Proceedings of the 2nd National Conference on Graphing Calculators. Pulau Pinang, Malaysia: Penerbit Universiti Sains Malaysia, p.45-54.
Noraini Idris. (2006). Teaching and Learning of Mathematics: Making Sense and Developing Cognitive Abilities. Utusan Publications & Distributors Sdn. Bhd.
Noraini Idris & Chew, C.M. (2011). Effect Of Graphic Calculator-Based Performance Assessment On Mathematics Achievement. Academic Research International. 1(1).
Noraini Idris, Norjoharuddeen Mohd Nor, Chew, C.M., Lim, H.L. & White, A. (2010). Comparative Studies on the Integration of Graphing Calculator in Mathematics Assessment in Australia, Singapore, and Malaysia. Mc Graw Hill (Malaysia).
Noraini Idris, Tay, B.L., Goh, L.S., Nilawati Mahfud, Ding, H.E., Aziah A.Aris & Anis Sabarina Abu Bakar. (2003). A Graphing Calculator Based Instruction And Its Impact On The Teaching And Learning Of Mathematics. Penerbit Universiti Malaya.
Norazah Nordin, Effandi Zakaria, Nik Rahimah Nik Mohamed & Mohamed Amin Embi. (2010). Pedagogical Usability Of The Geometer’s Sketchpad (GSP) Digital Module In The
Mathematics Teaching. TOJET: The Turkish Online Journal of Educational Technology. 9(4), p.113-117.
Rosihan M. Ali, Daniel L. Seth, Zarita Zainuddin, Suraiya Kassim, Hajar Sulaiman & Hailiza Kamarul Haili. (2002). Leaming and teaching mathematics with a graphic calculator. Bulletin Malaysian Mathematical Sciences Society. 25, p.53-82.
Rich, B. (1991). The effect of the use of graphing calculators on the learning if function concepts in precalculus mathematics. University of Iowa. Dissertation Abstracts International. 52, 3549A.
Rowell, G.H. (2004). Assessment of Using Technology for Teaching Statistics. ARTIST Roundtable Conference on Assessment in Statistics.
Stacey, K. (2004). Helping Students Learn to do Mathematics Well with Technology. Integrating Technology in the Mathematical Sciences. USM Proceeding Series. Pulau Pinang, Malaysia: Penerbit Universiti Sains Malaysia, p.3-12.
http://www.ibe.unesco.org/fileadmin/user_upload/archive/Countries/WDE/2006/ASIA_and_the_PACIFIC/Malaysia/Malaysia.htm
http://www.etawau.com/edu/Department/EducationSystem.htm