Embed Size (px)
Citation preview

CFS Retail Property Trust Group (CFX)Annual results for the year ended 30 June 201221 August 2012
Angus McNaughton Managing Director, Property Colonial First State Global Asset Management
2

We take a 360o approach to retail property investment, drawing on an integrated
investment and asset management platform
3
4 State of the market 16 Portfolio overview9 Financial highlights 20 Retail observations11 Acquisition 23 Development12 CFX stapling 31 Retail environment14 Capital management 34 Outlook
Debt costs are falling• Offshore debt markets are open• All in debt costs have fallen
Strong returns over the period• High yield is attracting investors in a risk-off
environment• AREITs continue to trade at a discount to NTA
but the gap is narrowing
Mixed conditions• Supported by steady wages and consumption
growth • Challenged by weak housing market, offshore
travel, low sentiment and internet sales growth
Capital markets
A-REIT sector
Retail environment
Economy
4
Solid growth continues• Supported by strong business investment
and low unemployment• Challenged by offshore conditions• Consumer spend up 5.7%
State of the marketHeadwinds and tailwinds persist

OverviewCFX has delivered solid long-term performance
5Note: Past performance is not indicative of future performance.1. Assuming the reinvestment of distributions.Source: UBS Australia 2012.
CFX cumulative total return1
Total cumulative returns since June 2002
CFX has outperformed the UBS Retail A-REIT Accumulation Index over one, three, five and 10-year periods
CFX has outperformed the UBS Retail A-REIT Accumulation Index over one, three, five and 10-year periods
Over 10-years, CFX has delivered a total securityholder return of 205%, or an average 11.8% per annum
Over 10-years, CFX has delivered a total securityholder return of 205%, or an average 11.8% per annum
-50%
0%
50%
100%
150%
200%
250%
FY02 FY03 FY04 FY05 FY06 FY07 FY08 FY09 FY10 FY11 FY12
Cum
ulat
ive
retu
rns
CFX UBS Retail Property 200 Accum Index S&P/ASX Property 200 Accum Index
Michael GormanCFX Fund Manager
6

Prudent capital
management
Focused on long-term,
sustainable returns for investors
Enhance value through
intensive asset
management
7
CFX invests in quality retail assets across Australia
8
Target ResultDistribution 13.0 – 13.1 cps 13.10 cps, at the upper end of guidance
Investigate additional revenue streams Successfully stapled CFX securities to allow additional revenue streams
Recycle capital
Sold a 50% interest in The Myer Centre Brisbane
Initiated an on-market buy-back for up to $150m securities and reset interest rate swaps
Progressed planning on developments where there is strong demand
Drive portfolio performance99.7% portfolio occupancy maintained
3.0% average rental increase on specialty store re-leasing
Maintain a strong balance sheet
26.6% gearing within target 25-35% range
Diversified sources of debt and lowered weighted average cost of debt
Specialty store sales growth of 3% Specialty store sales growth of 1.7% achieved
OverviewCFX delivering on strategy
x

Decline in net profit reflects lower growth in asset valuations than in prior year
Decline in net profit reflects lower growth in asset valuations than in prior year
Financial highlightsCFX remains in a solid position
9
1. Distributable income is a key financial measure used by management to assess the performance of CFX. Distributable income equals profit excluding: net gains on revaluations of investment properties, associates and derivatives; the effect of straight-lining fixed rental increases; the movement in fair-value of unrealised performance fees; non-cash convertible notes interest expense; adjustments for convertible notes buy-back expense; and adjustments for project and other items.
2. Excluding the capital distribution of 0.2 cents per unit, or $5.7m, reinvested in CFS Retail Property Trust 2, as approved by investors on 28 May 2012. This distribution enabled the initial capitalisation of CFX2.
3. Excluding flowback.4. Adjusted for changes in ownership of properties in either of the 12-month periods, excluding development impacted centres and significant
one-off Queensland land tax refunds.
Net property income growth was 2.4% on a like-for-like basis3
Net property income growth was 2.4% on a like-for-like basis3
Key metrics FY12 FY11 Change
Net profit $409.2m $532.6m (23.2)%
Distributable income1 $371.5m $350.3m 6.1%
Distribution per security2 13.1 cents 12.7 cents 3.1%
Net property income3 $547.9m $526.4m 4.1%
Total assets4 $8.4b $8.5b (0.7)%
Net tangible asset backing (NTA) per unit $2.07 $2.05 1.0%
10
Financial highlightsNet profit reconciliation
FY12$m
FY11$m
Net profit 409.2 532.6
Adjustments:
net gain from properties and associates valuations (164.3) (201.4)
net loss/(gain) from derivatives valuations 87.9 (12.9)
straight-lining rental revenue (2.8) (4.1)
movement in fair value of unrealised performance fees 3.4 0.2
non-cash convertible notes interest expense 7.0 11.3
convertible notes buy-back expense 4.9 -
project and other items 26.2 24.6
Distributable income 371.5 350.3
transfer from undistributed reserves1 - 9.4
Distribution 371.5 359.7
Distribution per security (cents) 13.10 12.70
1. Units issued in October and November 2010 ranked equally with pre-existing units and were therefore entitled to the full distribution for the half-year ended 31 December 2010. Therefore, CFX transferred an amount from undistributed reserves to deliver a distribution of 6.3 cents per unit for the half-year ended 31 December 2010.

Initiated an on-market
buy-back for up to $150m
Paid down bank debt to reinvest in
development pipeline
Reset interest rate
swaps
11
Sold a 50% interest in The Myer Centre Brisbane
12
Delivering on strategyOptimising revenues
CFSRetail Property
Trust Group (CFX)
$8,434mTotal assets
CFX1
$8,428mTotal assets
CFX2
$6mTotal assets
• Original trust• Owns shopping centres• Distributes net rental income pre-tax
• Pursues additional income streams• Initially intended for digital advertising screens• Distributes after-tax profit
• Comprises stapled securities• Created by stapling CFX1 trust
units to CFX2 trust units
CFX stapled securities structure
CFX units stapled to enable CFX to pursue new income streams
CFX units stapled to enable CFX to pursue new income streams
Digital screens will help make CFX centres more attractive to customers and retailers
Digital screens will help make CFX centres more attractive to customers and retailers

13
Our digital strategy To drive sales through our centres
Increase the experiential nature of our centres to drive foot traffic
Convert online shoppers to real time shoppers
E-commerce initiatives such as click and collect
14
Capital managementLowering the cost of debt
1. Adjusted for the drawing of debt to repay $198.5m of August 2014 convertible notes put to CFX on 21 August 2012, the commencement of the $120m USPP (12 July 2012) and $125m five-year bank debt facility (2 September 2012), the repayment of $225m of MTNs on 2 September 2012 and interest rate swaps entered into on 26 July 2012.
2. Adjusted for the issue of $300m of July 2016 convertible notes and buy-back of $300m of August 2014 convertible notes, which settled post 30 June 2011. 3. Including line fees and margins.4. Including convertible notes and fixed-rate medium term notes. 5. Gearing equals borrowings to total assets. For this calculation, total assets exclude the fair-value of derivatives and borrowings is the amount drawn down.
Total debt profile
Capital management activities have significantly reduced CFX’s weighted average interest rate
Capital management activities have significantly reduced CFX’s weighted average interest rate
30-Jun-121 30-Jun-112
Weighted average interest rate3 5.9% 7.0%
Weighted average duration of debt 3.5 years 3.5 years
Proportion of debt hedged4 84% 92%
Undrawn debt facilities $629m $360m
Long term credit rating – S&P A A
Gearing5 26.6% 27.0%
Loan to value ratio 31% 31%
Interest cover ratio 3.2x 2.8x

Capital managementMaintaining diversity and duration
15
1. Adjusted for the drawing of debt to repay $198.5m of August 2014 convertible notes put to CFX on 21 August 2012, the commencement of the $120m USPP (12 July 2012) and $125m five-year bank debt facility (2 September 2012), the repayment of $225m of MTNs on 2 September 2012 and interest rate swaps entered into on 26 July 2012.
^ The $92.3m of August 2014 convertible notes will be redeemed at their final maturity date of 21 August 2014. The $300m of July 2016 convertible notes have an investor put option in July 2014.
Debt maturity profile $m
50 150
575
300 100 125 -
38 178
158 -
92
300
-
260
100
440
0
200
400
600
800
1,000
FY13 FY14 FY15 FY16 FY17 FY18 Beyond
42%
14%
13%
3%
28%
Bank debt Convertible notes US Private Placement Short term notes Medium term notes
CFX’s debt remains well diversified with limited near-term expiries
^
Sources of debt1
Portfolio overviewKey portfolio statistics remain steady
16
Total asset values reduced due to the sale of an interest in The Myer Centre Brisbane
Total asset values reduced due to the sale of an interest in The Myer Centre Brisbane
Occupancy costs have remained stableOccupancy costs have remained stable
1. Shopping centre portfolio excludes DFO retail outlet centres.2. Comparable centres refer to those centres that are not undergoing or have not undergone substantial redevelopment in either period of comparison.
30-Jun-12 30-Jun-11
Number of retail assets 29 29
Investment properties ($m) 8,363 8,407
Weighted average capitalisation rate (%)1 6.45 6.49
Total area (‘000s, sqm) 1,404 1,419
Number of tenants 4,194 4,192
Number of vacancies 32 36
Occupancy rate (%) 99.7 99.7
Retail sales (MAT $m) 7,557 7,497
Comparable specialty MAT/sqm ($)1 9,576 9,166
Specialty occupancy costs (%)1,2 17.1 17.1

Department stores have shown improving sales in the June half
Department stores have shown improving sales in the June half
Retail specialty stores 1.7% growthRetail specialty stores 1.7% growth
Sales performance by categoryGrowth continues, but at a slower pace
171. Comparable centres refer to those centres that are not undergoing or have not undergone substantial redevelopment in either period of comparison.2. General retail comprises giftwear, pharmacy and cosmetics, pets, discount variety, florists and toys.
Category
Comparable1 Actual
MAT30-Jun-12
$m
Annualgrowth
%
MAT30-Jun-12
$m
Annualgrowth
%
Department stores 625.7 (2.5) 659.0 (2.9)
Discount department stores 708.5 (1.9) 780.0 (2.2)
Supermarkets 1,362.5 0.8 1,568.6 0.9
Mini majors 682.4 (1.7) 758.8 0.6
Retail specialty 2,547.9 1.7 2,756.0 1.8
Other retail2 453.0 6.9 494.4 7.5
Shopping centre portfolio 6,380.0 0.6 7,016.8 0.9
DFO centres 540.0 (0.8) 540.0 (0.8)
Total portfolio 6,920.0 0.5 7,556.8 0.8
18
DFOupdate
93 leasing deals
executed in FY12
Average 30% rental uplift on
new leases
Flat MAT growth due to extensive
remixing

Comparable1 Moving Annual Turnover
Retail specialty category 30-Jun-12$m
30-Jun-11$m
Annual growth
%
Food retail 170.9 160.6 6.4
Food catering 374.1 354.9 5.4
Apparel 896.7 910.7 (1.5)
Jewellery 205.2 208.0 (1.4)
Leisure 173.3 184.6 (6.1)
General retail2 220.9 220.8 0.0
Homewares 219.6 194.7 12.8
Mobile phones 101.7 94.8 7.3
Retail services 185.5 175.6 5.6
Total retail specialty 2,547.9 2,504.7 1.7
Retail specialty sales by categoryMobile phones, services, food and cafes performing strongly
19
1. Comparable centres refer to those centres that are not undergoing or have not undergone substantial redevelopment in either period of comparison.2. General retail includes cinemas and sales reporting tenancies under 400sqm including travel agents, auto accessories, Lotto and other entertainment
and non-retail stores.
Sales productivity has grown while occupancy costs have remained stable
Sales productivity has grown while occupancy costs have remained stable
Comparable1 shopping centre portfolio
Specialty occupancy
costs
Specialty sales
per sqm
Jun 2012 17.1% $9,576
Dec 2011 17.2% $9,269
Jun 2011 17.1% $9,166
Dec 2010 17.2% $8,955
Retail observations
• Despite consumer spending growth of 5.7%, retail sector remains challenging
• Demand continues from international casual and luxury retailers in larger centres
• Mid-level apparel retailers continue to experience difficulty, particularly in smaller centres
• Discretionary categories such as food catering, and new technology e.g. mobile phones and tablet devices are keeping demand strong
CFX outcomes
• Despite challenges, healthy leasing deal rate and occupancy maintained
• Achieved a 3.0% increase on retail specialty store re-leasing (renewals and replacements) with standard 5% fixed annual increases
• Actively replacing underperforming retailers
20
Healthy deal rate and occupancy despite a challenging environment

21
Portfolio overviewEntire portfolio valued through FY12
Historical valuation trendsCFX portfolio by centre type
5.0%
5.5%
6.0%
6.5%
7.0%
7.5%
8.0%
8.5%
Jun-
04
Dec
-04
Jun-
05
Dec
-05
Jun-
06
Dec
-06
Jun-
07
Dec
-07
Jun-
08
Dec
-08
Jun-
09
Dec
-09
Jun-
10
Dec
-10
Jun-
11
Dec
-11
Jun-
12
Cap
italis
atio
n ra
te
Regional Sub-regional Shopping centre portfolio
Entire portfolio was revalued in FY12, resulting in a $164.3m net valuation gain
Entire portfolio was revalued in FY12, resulting in a $164.3m net valuation gain
Shopping centre portfolio weighted average cap rate 6.45%
Shopping centre portfolio weighted average cap rate 6.45%
15.1%lower
emissions intensity4
Responsible property investment Makes good business sense
8.6%more energy
efficient4
29.4%more water
efficient4
2012 achievements
• 11 assets have certified NABERS ratings assessments
• Joint highest disclosure in 2011 CDP1 response in AU/NZ
• An Australian leader in 2011 GRESB2 survey
• Merited in APREA3 best practices awards
Focus in 2013
• Continue to improve the efficiency of the portfolio
• Continue to certify the portfolio for NABERS ratings
• Continue to benchmark against global best practice, including:– Global Reporting Initiative (GRI)– AA1000 standard (engagement of stakeholders)
22
1. Carbon Disclosure Project. 2. Global Real Estate Sustainability Benchmark. 3. Asia Pacific Real Estate Association. 4. Against base year FY08.
22

Tony GilchristHead of Development
23
24
Development updateTrack record
1. Including Myer Bourke Street project.2. Yield based on first year income after development completion.3. Excludes Emporium Melbourne.
Completions and targets
Redevelopment completions FY06 to FY121 CFX share
Number of projects completed 39
Total cost $1.7b
Weighted average initial yield2 7.6%
Average internal rate of return (IRR) 12.5%
Development targets
Total cost $1.7b
Target internal rate of return (IRR) >10%
Demonstrated track record of delivering on developments
Demonstrated track record of delivering on developments
$380m in additional value in excess of costs delivered in past seven years
$380m in additional value in excess of costs delivered in past seven years
Average notional development profit of 22% for CFX
Average notional development profit of 22% for CFX

Development updateKey development projects1 as at 30 June 2012
25
Dec-11 Jun -12 Dec-12 Jun -13 Dec -13 Jun-14 Dec -14 Beyond
Forest Hill Chase $25m
Bayside Shopping Centre $36m
Roxburgh Park $65m
Forest Hill Chase $20m
Brimbank Central $34m
DFO Homebush $100m
Eastlands $35m
Castle Plaza $130m
Emporium Melbourne $560m
1. CFX share.
Projects in progressProjects completed Projects planned (estimated timing)
Projects deferred
Chadstone (Stage 35) $260m
Progressing projects with
strong underlying
demand
Key development metrics
Total cost $1.12b
CFX share (50% interest) $560m
Target initial yield1 >6%
Target IRR >9%
Project commenced February 2011
Project to be complete Late 2013
Development updateEmporium Melbourne – progressing well
26
On target for 2013
completion
1. Yield based on forecast first year income after development completion.

Artist’s impression of Emporium Melbourne, Vic
New brand to Australia
will take 3,000 sqmover four
levels
Topshopto take
2,600 sqmstore over
three levels
Well progressed with luxury
and Australian designers
Emporium Melbourne Salvatore FerragamoMichael KorsScanlon & Theodoresass & bideZimmerman
2727
Development updateRoxburgh Park Shopping Centre – progressing well
28
Key development metrics
Total cost $65m
Target initial yield1 >8%
Target IRR >10%
Project commenced January 2012
Expected completion Early 2013
Project on track
1. Yield based on forecast first year income after development completion.
New large format
Coles + Aldiand 40 new
specialty stores
700 new car spaces
Refurb of existing centre

29
Development updateDFO Homebush – strong demand to expand the retail offer
Key development metrics
Total cost $100m
Target initial yield1 >7%
Target IRR >10%
Project to commence On planning approval
1. Yield based on forecast first year income after development completion.
500 new car spaces with
improved access
Centre refurb/remix,
new foodcourt,
luxury retailers
New bulky goods
retailers
ArmaniZegna
Michael Kors
30
Development updateChadstone Shopping Centre Stage 35 – planning milestone achieved
Key development metrics
Indicative cost1 $520m
CFX share (50% interest) $260m
Target initial yield2 >7%
Target IRR >10%
Project to commence On development approval
1. Retail component. 2. Yield based on forecast first year income after development completion.
Additional 30,000sqm of lettable
area allowed
Anchored by flagship
stores

Household consumption versus retail spendTemporarily out of sync
31
Australian retail turnover versus household consumptionAnnual growth rates, quarterly rests to March 2012
Consumer spend +5.7%1Consumer spend +5.7%1
Retail spend +2.8%2Retail spend +2.8%2
0%
2%
4%
6%
8%
10%
12%
0%
2%
4%
6%
8%
10%
12%
1992 1996 2000 2004 2008 2012
% C
hang
e Yo
Y
Mov
ing
annu
al tu
rnov
er, %
cha
nge
YoY
Australian retail turnover, MAT Household consumption (rhs)
Source: Australian Bureau of Statistics and CFSGAM Research.1. 12 months to 31 March 2012.2. 12 months to 30 June 2012.
• Positive economic outlook• Interest rates falling• Steady wages growth and low
unemployment• Strong consumption growth
• 8 million international travellers in FY12
• Savings rate is high but stable• Consumer sentiment is low• Growth in online sales
Headwinds
Tailwinds
32

33
Driving our existing asset base by remixing tenancies to optimise performance
Deliver capital management initiatives to maintain debt diversity and duration
Investing in the redevelopment pipeline and investigating asset recycling opportunities
Strategic focus for FY13
Supporting retailers by advancing online and social media strategies
While the retail property market still faces headwinds, we anticipate specialty retail sales growth of around 3% for FY13
Distribution guidance of 13.6 – 13.7 cents per security for the 12 months ending 30 June 20131
1. Assuming performance fees are payable for the full financial year and there is no unforeseen material deterioration to existing economic conditions.
Outlook34

Appendices
35
36. Property summary38. Reconciliation of net property income39. Gearing history and key debt covenants40. Hedge maturity profile41. Hedging profile
42. Development overview43. Flowback44. Diversification by income and expiry profile45. Weighted average capitalisation rates
Appendix 1Property summary 1
36
Ownership (%) Centre type1 Book
value ($m)MAT
growth (%)Spec MAT growth (%)
Spec MAT/sqm
Occ costs (%)
Occupancy (%) Cap rate (%) % of retail
portfolio
Chadstone Shopping Centre 50 Super-regional 1,612.3 1.1 4.4 $13,741 18.0 100.0 5.25 20.5
Chatswood Chase Sydney 100 Regional 810.0 (1.3) 2.3 $10,353 18.0 100.0 5.75 10.3
Bayside Shopping Centre 100 Regional 582.6 8.2 5.3 $ 6,701 19.4 98.6 6.50 7.4
QueensPlaza 100 CBD-regional 550.1 2.4 1.8 $17,389 14.6 100.0 5.75 7.0
Northland Shopping Centre 50 Regional 460.6 0.8 (0.4) $8,337 21.0 99.9 6.25 5.9
The Myer Centre Brisbane 50 CBD-regional 366.7 1.1 2.6 $11,576 19.4 99.7 6.50 4.7
Elizabeth Shopping Centre 100 Regional 366.6 (1.4) 0.4 $6,991 16.0 99.7 7.00 4.7
Broadmeadows Shopping Centre 100 Regional 330.6 (5.5) (3.3) $6,333 19.4 99.5 7.25 4.2
Forest Hill Chase 100 Regional 273.2 5.2 0.1 $6,359 13.1 99.8 7.25 3.5
Rockingham Shopping Centre 50 Regional 247.4 8.6 9.2 $8,577 15.0 100.0 6.50 3.2
Lake Haven Shopping Centre 100 Sub-regional 245.2 (1.2) 2.0 $8,924 13.3 99.6 7.50 3.1
Grand Plaza Shopping Centre 50 Regional 169.6 (0.5) (5.9) $8,754 16.5 99.7 6.75 2.1
Eastlands Shopping Centre 100 Sub-regional 168.1 (2.6) (4.8) $7,665 14.3 99.3 7.25 2.1
Clifford Gardens Shopping Centre 100 Sub-regional 157.5 (3.0) 0.6 $9,067 12.4 99.6 7.75 2.0
1. Regional and sub-regional centres classified as per Property Council of Australia definitions.
Appendix 1Property summary 2
37
Ownership (%) Centre type1 Book
value ($m)MAT
growth (%)Spec MAT
growth (%)Spec
MAT/sqmOcc costs
(%)Occupancy
(%) Cap rate (%)% of retail
portfolio
Brimbank Central Shopping Centre 100 Sub-regional 126.7 (3.9) (3.2) $5,345 17.9 100.0 7.75 1.6
Corio Shopping Centre 100 Sub-regional 120.8 (0.7) (6.6) $5,682 16.1 98.7 8.00 1.5
Runaway Bay Shopping Village 50 Sub-regional 118.3 4.7 0.2 $7,664 15.5 99.8 7.25 1.5
Rosebud Plaza Shopping Centre 100 Sub-regional 97.0 1.2 0.0 $7,216 14.1 99.3 8.00 1.2
Altona Gate Shopping Centre 100 Sub-regional 90.7 (7.1) 1.3 $6,643 15.2 99.6 8.25 1.2
Northgate Shopping Centre 100 Sub-regional 90.2 2.1 (1.7) $9,146 12.2 98.2 8.25 1.1
Post Office Square 100 Other 77.0 (6.6) 1.4 $13,610 18.0 100.0 7.75 1.0
Roxburgh Park Shopping Centre 100 Neighbourhood 61.5 0.3 (11.5) $ 6,160 12.7 100.0 8.00 0.8
The Entertainment Quarter 50 Other 35.4 6.4 29.9 $5,051 13.1 99.7 10.00 0.4
Shopping centre portfolio 7,790.4 0.9 1.8 $9,224 17.2 99.7 6.45 93.0
DFO South Wharf 50 Outlet 171.5 5.2 7.2 $6,025 13.9 99.6 7.75 2.2
DFO Homebush 100 Outlet 147.5 (3.1) (2.3) $11,076 8.3 100.0 7.75 1.9
DFO Essendon 100 Outlet 132.7 (1.0) 1.1 $7,430 10.5 100.0 7.75 1.7
DFO Moorabbin 100 Outlet 99.6 (4.2) (4.4) $5,367 11.9 99.7 8.25 1.2
Retail outlet portfolio 551.4 (0.8) 0.2 $7,133 11.0 99.8 8.13 7.0
1. Regional and sub-regional centres classified as per Property Council of Australia definitions.
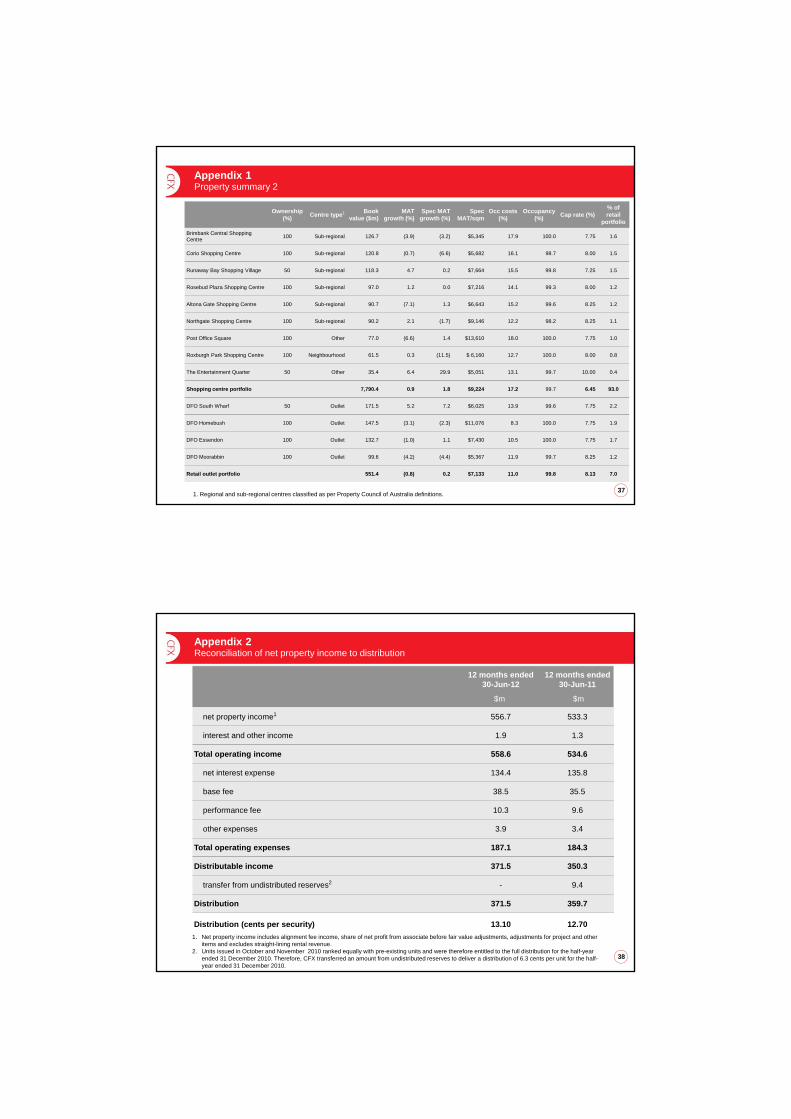
Appendix 2Reconciliation of net property income to distribution
38
12 months ended30-Jun-12
$m
12 months ended30-Jun-11
$m
net property income1 556.7 533.3
interest and other income 1.9 1.3
Total operating income 558.6 534.6
net interest expense 134.4 135.8
base fee 38.5 35.5
performance fee 10.3 9.6
other expenses 3.9 3.4
Total operating expenses 187.1 184.3
Distributable income 371.5 350.3
transfer from undistributed reserves2 - 9.4
Distribution 371.5 359.7
Distribution (cents per security) 13.10 12.701. Net property income includes alignment fee income, share of net profit from associate before fair value adjustments, adjustments for project and other
items and excludes straight-lining rental revenue.2. Units issued in October and November 2010 ranked equally with pre-existing units and were therefore entitled to the full distribution for the half-year
ended 31 December 2010. Therefore, CFX transferred an amount from undistributed reserves to deliver a distribution of 6.3 cents per unit for the half-year ended 31 December 2010.

Appendix 3Gearing history and key debt covenants
39
1.Calculated as total liabilities divided by total assets.2.Calculated as earnings before interest divided by net interest expense for CFX1. For the purposes of this calculation, earnings represents net profit
excluding all fair value adjustments, straight-lining revenue, borrowing costs and net interest expense on interest rate swaps. Interest expense is the sum of borrowing costs, net interest expense on interest rate swaps, and capitalised interest; less non-cash convertible notes interest expense and adjustments for convertible notes buy-back expense.
Threshold
As at 30 June
2012
As at 30 June
2011
Loan to value ratio (LVR)1
50% or less 31% 31%
Interest cover ratio2 1.8 times or greater
3.2 times
2.8times
20.7%
26.7%28.3%28.3%
25.0%27.3%27.3%
29.5%27.0%26.6%
0%
10%
20%
30%
40%
FY03 FY04 FY05 FY06 FY07 FY08 FY09 FY10 FY11 FY12
Gearing history Key debt covenants
Target gearing 25-35%
Hedging profile at 30 June 20121
Appendix 4Hedge maturity profile
40
1.Adjusted for the drawing of debt to repay $198.5m of August 2014 convertible notes put to CFX on 21 August 2012, the commencement of the $120m USPP (12 July 2012) and $125m five-year bank debt facility (2 September 2012), the repayment of $225 million of MTNs on 2 September 2012 and interest rate swaps entered into on 26 July 2012.
2.Adjusted for capital management activities post the period. 3.Excluding line fees and margins.
Swap rate$m
At 30 June 20121 At 30 June 20112
Proportion of debt hedged3 84% 92%
Weighted average interest rate on hedged debt3,4 5.1% 6.1%
Weighted average durationof hedged debt 3.9 years 4.5 years
3.0%
3.5%
4.0%
4.5%
5.0%
5.5%
6.0%
6.5%
7.0%
0
500
1,000
1,500
2,000
2,500
FY13 FY14 FY15 FY16 FY17 FY18 FY19
Face value of hedges Weighted average interest rate on hedged debt

Appendix 5Hedging profile1
41
FY12 FY13 FY14 FY15 FY16 FY17 FY18 FY19
Face value of hedges ($m) 1,872 1,872 1,883 1,501 765 365 266 290
Weighted average interest rate on hedged debt (%) 5.05 5.05 5.04 5.03 5.94 4.86 5.24 5.35
Average % hedged over FY 84 83 71 56 28 14 10 11
1.Adjusted for the drawing of debt to repay $198.5m of August 2014 convertible notes put to CFX on 21 August 2012, the commencement of the $120m USPP (12 July 2012) and $125m five-year bank debt facility (2 September 2012), the repayment of $225m of MTNs on 2 September 2012 and interest rate swaps entered into on 26 July 2012.
421.Yield based on first year income after development completion.2.Other projects in progress comprise Brimbank $34m, Forest Hill Chase $20m, Corio $7m and DFO South Wharf $4m (CFX share).
Appendix 6Development overview
Current projects
CFXtotal cost $m
CFXcost to
complete$m
Target yield1
%
Expected completion
date
Projects in progress
Emporium Melbourne 560 186 > 6 Late 2013
Roxburgh Park Shopping Centre 65 39 >8 Early 2013
Other projects in progress1 65 58 >7 Mid-2013
DFO Homebush 100 98 >7 TBA
Chadstone Shopping Centre 260 260 >7 TBA
Total current projects 1,050 641
Planning, concept and deferred 261 261
Total development pipeline 1,311 902

43
Appendix 7Flowback
12 months to 30 June 2012
CFSGAMProperty asset management
division CFX share
Retail assets under management $13.8b $8.4b
Development pipeline $2.4b $1.3b
Distributable income $31.2m $10.2m
Asset management division adds value to CFX portfolio and provides a share of distributable income
Asset management division adds value to CFX portfolio and provides a share of distributable income
Distribution income relating to flow-back up 29.1% on prior year due to increased development fee-related income
Distribution income relating to flow-back up 29.1% on prior year due to increased development fee-related income
44
Appendix 8Diversification by income and expiry profile
1.Including Coles, Target and Kmart and subsidiary brands.2.Including Big W, Dick Smith and subsidiary brands.
FY12
1. Wesfarmers1 7.7
2. Woolworths2 4.5
3. David Jones 3.3
4. Myer 3.2
5. Premier Investments 1.7
6. Hoyts 1.4
7. Commonwealth Bank 1.1
8. Luxottica Retail 0.9
9. Australian Pharmaceutical Industries 0.9
10. Angus & Coote 0.9
11. Speciality Fashion Group 0.9
12. Westpac 0.9
13. Country Road 0.8
14. Cotton On 0.8
15. BB Retail Capital 0.8
Top 15 29.8
22.6%
15.2%
20.9% 18.4%22.9%
0%
5%
10%
15%
20%
25%
FY13* FY14 FY15 FY16 BEYOND
Tenant (% of income)
Retail specialty store lease expiry (% gross lettable area)
4,194 retail tenants
* FY13 includes vacancies and holdovers
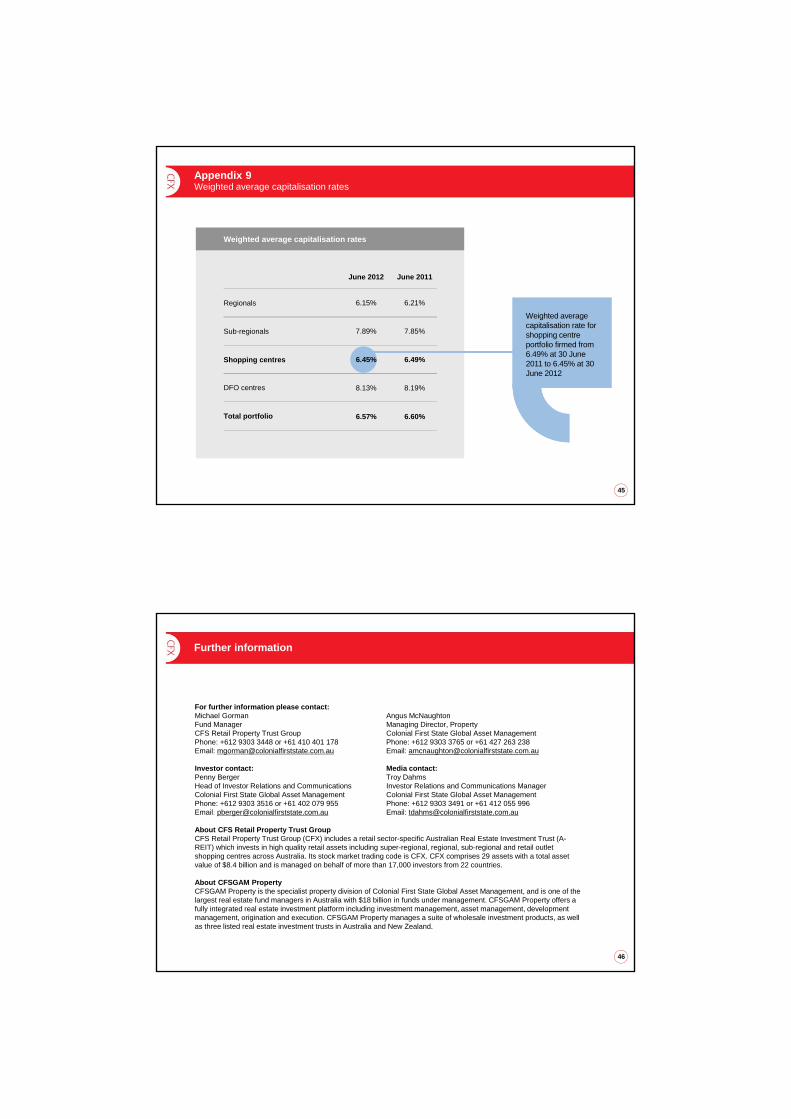
Appendix 9Weighted average capitalisation rates
45
Weighted average capitalisation rates
June 2012 June 2011
Regionals 6.15% 6.21%
Sub-regionals 7.89% 7.85%
Shopping centres 6.45% 6.49%
DFO centres 8.13% 8.19%
Total portfolio 6.57% 6.60%
Weighted average capitalisation rate for shopping centre portfolio firmed from 6.49% at 30 June 2011 to 6.45% at 30 June 2012
Weighted average capitalisation rate for shopping centre portfolio firmed from 6.49% at 30 June 2011 to 6.45% at 30 June 2012
46
Further information
For further information please contact:Michael Gorman Angus McNaughton Fund Manager Managing Director, Property CFS Retail Property Trust Group Colonial First State Global Asset ManagementPhone: +612 9303 3448 or +61 410 401 178 Phone: +612 9303 3765 or +61 427 263 238Email: [email protected] Email: [email protected]
Investor contact: Media contact: Penny Berger Troy DahmsHead of Investor Relations and Communications Investor Relations and Communications ManagerColonial First State Global Asset Management Colonial First State Global Asset ManagementPhone: +612 9303 3516 or +61 402 079 955 Phone: +612 9303 3491 or +61 412 055 996Email: [email protected] Email: [email protected]
About CFS Retail Property Trust GroupCFS Retail Property Trust Group (CFX) includes a retail sector-specific Australian Real Estate Investment Trust (A-REIT) which invests in high quality retail assets including super-regional, regional, sub-regional and retail outlet shopping centres across Australia. Its stock market trading code is CFX. CFX comprises 29 assets with a total asset value of $8.4 billion and is managed on behalf of more than 17,000 investors from 22 countries.
About CFSGAM PropertyCFSGAM Property is the specialist property division of Colonial First State Global Asset Management, and is one of the largest real estate fund managers in Australia with $18 billion in funds under management. CFSGAM Property offers a fully integrated real estate investment platform including investment management, asset management, development management, origination and execution. CFSGAM Property manages a suite of wholesale investment products, as well as three listed real estate investment trusts in Australia and New Zealand.
Neither Commonwealth Bank of Australia (the ‘Bank’) ABN 48 123 123 124 nor any of its subsidiaries guarantees or in any way stands behind the performance of the CFS Retail Property Trust 1 ARSN 090 150 280 and CFS Retail Property Trust 2 ARSN 156 647 853 (together CFS Retail Property Trust Group or ‘CFX’) or the repayment of capital by CFX. Investments in CFX are not deposits or other liabilities of the Bank or its subsidiaries, and investment-type products are subject to investment risk including possible delays in repayment and loss of income and principal invested.
The information contained in this presentation (the ‘Presentation’) is intended to provide general advice only and does not take into account your individual objectives, financial situation or needs. You should assess whether the Presentation is appropriate for you and consider talking to a financial adviser or consultant before making an investment decision.
All reasonable care has been taken in relation to the preparation and collation of the Presentation. Except for statutory liability which may not be excluded, no person, including Commonwealth Managed Investments Limited (the ‘Responsible Entity’) ABN 33 084 098 180, Colonial First State Property Retail Pty Limited ABN 19 101 384 294 or any other member of the Bank’s group of companies, accepts responsibility for any loss or damage howsoever occurring resulting from the use of or reliance on the Presentation by any person. Past performance is not indicative of future performance and no guarantee of future returns is implied or given.
Copyright and confidentialityThe copyright of this Presentation and the information contained therein is vested in the Responsible Entity, the Bank and the Bank’s group of companies. This Presentation should not be copied, reproduced or redistributed without prior consent.
Disclaimer
47