Embed Size (px)
Citation preview

Forschungsinstitut zur Zukunft der ArbeitInstitute for the Study of Labor
DI
SC
US
SI
ON
P
AP
ER
S
ER
IE
S
Centralized Admission and theStudent-College Match
IZA DP No. 10251
September 2016
Cecilia MachadoChristiane Szerman
Centralized Admission and the
Student-College Match
Cecilia Machado Getulio Vargas Foundation (EPGE-FGV)
and IZA
Christiane Szerman
CPI/PUC-Rio
Discussion Paper No. 10251 September 2016
IZA
P.O. Box 7240 53072 Bonn
Germany
Phone: +49-228-3894-0 Fax: +49-228-3894-180
E-mail: [email protected]
Any opinions expressed here are those of the author(s) and not those of IZA. Research published in this series may include views on policy, but the institute itself takes no institutional policy positions. The IZA research network is committed to the IZA Guiding Principles of Research Integrity. The Institute for the Study of Labor (IZA) in Bonn is a local and virtual international research center and a place of communication between science, politics and business. IZA is an independent nonprofit organization supported by Deutsche Post Foundation. The center is associated with the University of Bonn and offers a stimulating research environment through its international network, workshops and conferences, data service, project support, research visits and doctoral program. IZA engages in (i) original and internationally competitive research in all fields of labor economics, (ii) development of policy concepts, and (iii) dissemination of research results and concepts to the interested public. IZA Discussion Papers often represent preliminary work and are circulated to encourage discussion. Citation of such a paper should account for its provisional character. A revised version may be available directly from the author.
IZA Discussion Paper No. 10251 September 2016
ABSTRACT
Centralized Admission and the Student-College Match* Decentralized assignments in the education market have been increasingly replaced by centralized ones. However, empirical evidence on these transitions are scarce. This paper examines the adoption of centralized admissions in the Brazilian higher education market. Using rich administrative data, we exploit time variation in the adoption of a clearinghouse across institutions to investigate the impacts on student sorting, migration and enrollment. We find that institutions under the centralized assignment are able to attract students with substantially higher test scores and that geographical mobility of admitted students increases. While there are no sizable effects on final enrollment rates, the higher turnover rate of seats indicates search is intensified. Overall, our findings indicate positive impacts of centralization on the college market. JEL Classification: D47, I23, I28 Keywords: higher education, centralized matching, college admission, test scores,
migration, enrollment Corresponding author: Cecilia Machado Getulio Vargas Foundation Graduate School of Economics Praia de Botafogo 190, 11th floor Botafogo, Rio de Janeiro 22250-900 Brazil E-mail: [email protected]
* We have benefitted from discussions with Juliano Assunção, Eduardo Azevedo, Braz Camargo, Francisco Costa, Taryn Dinkelman, Fernanda Estevan, Jérémie Gignoux, Matilde Machado, Daniel Monte, Bernard Salanié, conference participants at 2015 CAEN-EPGE Meeting, 2015 LACEA, 2015 NEUDC, 2015 SBE-ANPEC, 2016 SOLE, 2016 North American Summer Meeting of the Econometric Society, 2016 SAET, 2016 European Meeting of the Econometric Society, 2nd International REAP & SBE Meetings, and seminar participants at EBAPE, FGV, INEP, IPEA and UFRJ. We thank Laura Sant’Anna for excellent research assistance. We thank Eduardo São Paulo and Instituto Nacional de Pesquisas Educacionais (INEP) for providing access to data. Any opinions and conclusions expressed herein are those of the authors and do not necessarily represent the views of INEP or FGV. All results have been reviewed to ensure that no confidential information is disclosed. All remaining errors are ours. Preliminary versions circulated under the title “The Effects of a Centralized College Admission Mechanism on Migration and College Enrollment: Evidence from Brazil”, Szerman (2015).
1 Introduction
Each year, millions of students apply to colleges through a wide variety of mechanisms.
In some countries, such as Chile, Turkey, Germany, Taiwan, and the U.K., admissions are
entirely centralized, and the allocation of students to colleges is mediated by a clearinghouse.
In other countries, such as Japan and the U.S., admissions are decentralized, in the sense
that colleges make decisions separately from each other.
In comparison to decentralized markets, it is widely believed that centralization improves
coordination, reduces congestion, increases the scope of the market, and improves welfare
and matches (Gale and Shapley, 1962; Roth and Xing, 1997; Niederle and Roth, 2003;
Abdulkadiroglu et al., 2005, 2015). These features explain why centralized clearinghouses
have long been adopted in many markets.1 Recent theoretical research has developed speci�c
frameworks for understanding decentralized markets in college admission and the welfare and
e�ciency gains of centralization (Chade et al., 2014; Hafalir et al., 2014; Che and Koh, 2016).2
Yet, empirical evidence on the bene�ts of centralized matching in higher education remains
surprisingly scarce.
This paper addresses this limitation by exploiting a unique and large-scale policy change
in Brazil to study the e�ects of centralization on college admission. Prior to 2010, each
higher education institution selected students based on its own admission exams. Students,
in turn, were allowed to apply to as many institutions as wanted, submitting speci�c degree
choices in each application. Test-score based admission policy meant that institutions o�ered
their seats to the top-scoring candidates. In 2010, the Ministry of Education created SISU, a
centralized clearinghouse that allocates students to federal and state public higher education
institutions.3 Using scores from a nationwide exam called ENEM, students could submit up
to two program choices � where a program corresponds to a degree and institution pair �
among the ones made available through the system. Final assignments were made using a
deferred acceptance algorithm based on the ENEM score.
1In the U.S., for example, a centralized clearinghouse called National Residency Match Program deter-mines the placement of medical students to residency options (Agarwal, 2015). Also, in many cities in theU.S. distinct clearinghouses have been created to assign students to schools in response to research on schoolchoice (Abdulkadiroglu and Sönmez, 2003).
2Chade et al. (2014) develop a decentralized model to understand the role of two application frictions �costly portfolio choices and admission uncertainty � in the college admissions. Hafalir et al. (2014) and Cheand Koh (2016) characterize the equilibrium outcomes under decentralized admission.
3Throughout the paper, we use the terms �public institutions� and �federal and state public institutions�interchangeably.
1

We exploit the gradual adoption of the clearinghouse across public institutions to com-
pare outcomes within programs before and after centralization, controlling for a battery
of �xed e�ects, state trends and covariates. Since adoption was not mandatory, we val-
idate our empirical strategy by showing that the timing of adoption was not driven by
institution-speci�c characteristics. Our analysis sample exploits rich information provided
by the Brazilian Higher Education Censuses and individual-level data of ENEM test takers,
linked together using restricted access identi�ers. Our �nal dataset contains information
on all �rst-year students ever registered in higher education institutions, their demographic
characteristics (including places of birth and residence), their ENEM test-scores, and the
degrees and institutions they attended.
While most demographic characteristics of admitted students remain similar after cen-
tralization, we �nd sizable e�ects of centralization on admission test scores. Institutions
under the centralized assignment system are able to recruit students that score one third of
standard deviation higher in the ENEM exam. In addition, we �nd that enrolled students
are more likely to be coming from a state or municipality that is di�erent from where their
program is located. Overall, market integration brought by centralization increases interstate
mobility by 2.5 percentage points, which correspond to a 25% percent increase in baseline
migration rate. These e�ects are robust to several alternative speci�cations. Taken together,
both �ndings indicate that centralization expands the scope of the market and improves the
student-college match by admitting students with higher scores and from di�erent regions
of the country.
At last, we investigate e�ects on enrollment. The clearinghouse leads to a higher likeli-
hood of an ever registered student not being enrolled by the end of the �rst year. Nonetheless,
this result is mainly driven by students who cancel their registration before the end of the
academic term, possibly indicating that they have opted for a preferred program elsewhere
and that the same seat was subsequently occupied by another applicant. We �nd small
e�ects of a registered student requesting leave of absence and no e�ect on the occupancy
rate of seats. We interpret these �ndings as a rise in the turnover rate of seats available in
the clearinghouse, with very little impacts on enrollments. We note this �nding is speci�c
to the Brazilian context, as will be later described.
Our work speaks to three strands in the literature. First, application costs and admission
uncertainty are important determinants of students' application decisions (Chade et al., 2014;
2
Fu, 2014). In di�erent contexts, college application has been shown to be sensitive to �nancial
aid and application assistance (Bettinger et al., 2012; Dinkelman and Martínez, 2014), to
information about colleges and programs (Carrell and Sacerdote, 2013; Hoxby and Turner,
2013; Oreopoulos and Dunn, 2013), and even to small changes in application costs (Pallais,
2015). In the setting of our study, the centralized system alleviates several costs by providing
online information on majors, campus and institutions, as well as information on admission
chances.4 Monetary costs are also considerably reduced as one application fee for taking
the ENEM exam serves the purpose of several applications. In addition, the SISU platform
is free of charge. The combined reduction of search, time, monetary and information costs
further enhances the reach of the centralized admission system under study.
Second, there is now growing evidence of both under- and overmatch between students
and colleges (Dillon and Smith, 2016). The literature has documented that low-income
high-achievers undermatch more often than their high-income counterparts because their
applications decisions are sensitive to information acquired by peers in the same geograph-
ical location (Hoxby and Avery, 2014; Hoxby and Turner, 2015). Market scope also plays
a relevant role for academic mismatch, which generally results from restricted admission
and a�rmative action policies (Arcidiacono et al., 2011; Sander and Taylor, 2012; Black
et al., 2015; Arcidiacono and Lovenheim, 2016). Our results suggest that market integration
improves the matches between students and institutions. Since college quality is strongly as-
sociated with college completion rates (Cohodes and Goodman, 2014), improvements in the
student-college match can have lasting e�ects on educational attainment and labor market
returns of the a�ected cohorts.
Third, this paper also relates to the literature that studies the e�ects of centralization
and coordination in other markets. Niederle and Roth (2003) �nd that the implementation of
a centralized clearinghouse for gastroenterologists increased mobility by widening the scope
of the market. Abdulkadiroglu et al. (2015) show that the introduction of a coordinated
centralized assignment enhances students' willingness to travel, in comparison to the old
uncoordinated mechanism, even though daily commutes are costly to school students. Our
results are the �rst to focus on the college market and, speci�cities apart, are consistent with
the existing empirical evidence.
4In a school choice context, Narita (2016) shows that demand-side frictions a�ect the gains from cen-tralization. The author suggests that information on school characteristics and updated choices can reducethese frictions.
3
This paper proceeds as follows. Section 2 describes the Brazilian higher education system
and the introduction of the new college clearinghouse. We also discuss the expected e�ects
of centralization on student sorting, migration and enrollment. Sections 3 and 4 outline
the data and the empirical strategy, respectively. Section 5 presents the main results. We
conclude in Section 6.
2 Institutional Context
2.1 Higher Education in Brazil
The Brazilian higher education system consists of 2.368 private and public institutions of
distinct characteristics and quality levels. Among them, 298 are public institutions admin-
istered by the federal (107 institutions), state (118) or municipal (73) governments. Private
institutions are either for-pro�t or non-pro�t organizations, and for-pro�t institutions ac-
count for a larger share of the market. Institutions o�er bachelor and licentiate degree
programs, which take on average 4-6 years to complete, and technological degree programs,
which last on average 2-3 years.
Public institutions do not charge tuition fees in most cases, with the exception of mu-
nicipal institutions.5 They o�er a limited number of seats and are generally perceived as
having the best and most selective programs, leading to intense competition in admission.6
Admissions to private institutions, in contrast, meet a lower standard. Tuition fees are high
on average and impose a �nancial burden to low income families.7
Similar to Chile and Norway, students in Brazil choose their majors at the application
stage. Admission is exclusively based on entrance exam scores and does not depend on
high school GPA or subjective assessments, such as recommendation letters. Each year
approximately 3 million �rst-year students are enrolled in higher education programs (2010-
2014 Higher Education Censuses).
5The Brazilian Constitution bans tuition fees in public institutions, including those administered at themunicipal level. However, some municipal public institutions still charge fees under the argument that theyare not entirely �nanced by public funds. There is an ongoing legal debate of whether tuitions can indeedbe charged by municipal institutions.
6Between 2010 and 2014, the share of seats in public institutions has ranged from 22 to 16 percent(2010-2014 Higher Education Censuses).
7Monthly tuition fees are about 645 reais, equivalent to 89% of 2014 minimum wage (Hoper Educação,2014).
4
Prior to 2010, admissions were completely decentralized. Students directly applied to each
institution and had to take an speci�c entrance examination, known as Vestibular.8 Students
could apply to as many institutions as wanted, but all applicants to a given institution would
take the Vestibular exam at the same date and time.9 Only top-scoring applicants to each
program were o�ered a seat. A single student could be admitted to several programs and be
enrolled in more than one at the same time. Any remaining vacant seats would be gradually
o�ered to wait-listed applicants according to their rank.
Aiming to improve fair access to public higher education institutions, the Ministry of
Education introduced a series of reforms starting in 2008. Most importantly, there was
the reformulation of the secondary education assessment exam (henceforth, ENEM), taking
place in the 2009 edition, followed by the creation of a centralized admission clearinghouse
(henceforth, SISU), in January of 2010.
2.2 The ENEM exam
Created in 1998, the ENEM exam was formerly conceived to be a non-mandatory one-day
exam to evaluate secondary schooling. Indeed, since its inception, the exam has been widely
used in schools' league tables to inform about the quality of secondary schools (Camargo
et al., 2014). Prior to its reformulation, the old ENEM was regarded as a problem-solving
and critical analysis assessment, rather than a rigorous curriculum-based examination. It
consisted of 63 multiple-choice questions from a range of subjects and a written essay. Per-
ceived as a less rigorous assessment than Vestibular, the old ENEM exam was virtually
irrelevant for most admission procedures in public institutions, but it was used for admission
in many private institutions.10
In addition, ENEM scores are used for granting scholarships to low-income students
8Institutions are free to design their own entrance exams. For example, some select students in tworounds, with a �rst round based on a multiple choice exam and a second round with written questions �speci�c to the chosen degree � and an essay. Others have a single-stage exam with scores weighted by majorchoice.
9The Vestibular exams are typically scheduled once a year, in the second semester of the year thatprecedes admissions. Since the academic term goes from February to December, the exams are scheduledbetween October and January. If two or more Vestibular exams are scheduled at the same day and time,only one can be taken.
10Very few public institutions adopted the ENEM scores in their admission procedures. Some notableexceptions were UNICAMP, USP, and UNIRIO. ENEM scores are part of the admisssion criteria in UNI-CAMP and USP since 2000 and 2003, respectively. Between 2007 and 2009, UNIRIO allocated half of itsseats to admissions using only ENEM scores.
5

in private institutions through the PROUNI program.11 Created in 2004, PROUNI o�ers
fellowships to top-scoring applicants. Cuto� scores depend on the number of available seats
in each program. In 2016, more than 328 thousand PROUNI scholarships were o�ered. Since
admission to public institutions is highly competitive and uncertain, the large majority of
college applicants had great incentives to take the ENEM exam even before its reformulation
in 2009.
In 2008, the Ministry of Education announced that the ENEM exam would become more
content-based and rigorous to boost its use as the only entrance examination by higher
education institutions, especially public institutions. With 180 multiple-choice questions
and a written essay, the new structure resembles the most competitive Vestibular exams.
To take the ENEM exam, applicants have to pay a registration fee of approximately USD
20 (or 68 reais in the 2016 edition). In some cases, payment exemption is allowed. The
exam is simultaneously taken once a year, at the end of the academic year, and across the
country. Item response theory is also used in the calculation of the �nal scores to allow for
comparability of ENEM scores from 2009 onwards.
Although the ENEM exam remains optional to high school students, its reach is remark-
able. In 2014, the total number of applicants reached a record high of nearly 8.7 million. The
expansion is striking when compared to only 157.221 students registered in its �rst edition
in 1998. Figure 1 illustrates the evolution in the number of test-takers and highlights two
jumps. The �rst, in 2004, is attributed to the creation of the PROUNI program. The second
jump, in 2010, is primarily driven by the implementation of the SISU system.12
2.3 The SISU System
After its reformulation, ENEM scores were gradually incorporated into the admission
criteria of many private and public institutions. To facilitate its use exclusively by public
and tuition-free institutions, the Ministry of Education created SISU (Sistema de Seleção
11In addition to taking the ENEM exam, PROUNI applicants have to comply with one of the followingcriteria: have had their entire high school education either in public high schools or in private high schoolsunder full scholarship; being disabled; or being a teacher in public schools. Full and partial scholarshipsare awarded to applicants based on their per capita monthly household income (1.5 and 3 minimum wages,respectively). Applicants submit their ENEM scores and choices through the PROUNI online platform.
12It is important to note that taking ENEM became required in �nancial aid application to FIES (Fundode Financiamento Estudantil) also in 2010. However, it was only requested for applicants graduating fromhigh school in the year of application, with no minimum score requirement. Only by 2015 does FIES requiretaking ENEM in the year of application for all applicants, and a minimum score of 450 points (out of 1000).
6
Uni�cada) in January of 2010.13 Using ENEM scores as the only metric to rank candidates,
SISU is an online platform that allocates students to public institutions.
Although SISU was available to all public tuition-free institutions, its adoption was not
compulsory. Institutions could decide whether they would o�er their seats through SISU
and how many seats would be o�ered for each degree. Some few degrees that require very
speci�c skills prior to admission (e.g. Music, Performing Arts, and Visual Arts) could still
prefer to admit their students through the traditional Vestibular exams, even when their
institutions have opted for participating in the SISU system. The Ministry of Education, in
turn, encouraged institutions to move to a centralized system by providing them additional
monetary transfers.14
The number of available seats in SISU is announced at the beginning of each edition,
about one month before the start of the academic semesters, January and July. However,
the majority of spots are o�ered in the January opening, even for programs that start in the
second semester. The registration is online and free of charge. Only candidates who had
taken the ENEM exam in the previous year are able to register in the platform in the current
year. The registration period lasts four or �ve days. Over that period, applicants can choose
up to two ranked degree-institution pairs (hereafter, programs) from the options o�ered
in the system. The platform also allows for di�erential competition (and, consequently,
di�erential admission scores) for seats reserved through a�rmative action policies.
Admission cuto� scores depend both on the number of available seats and on applicants'
preferences. Previews of cuto� scores are made available online for all candidates based on
the choices registered until the previous day. Candidates can change their choices as many
times as they wish while the system is open. Only the last con�rmed choice is valid. When
the system closes, it assigns applicants to programs through a deferred acceptance algorithm,
which has been argued to be a strategy-proof mechanism in similar contexts (Hastings et al.,
2013; Kirkeboen et al., 2016). Candidates are accepted to their most preferred program
13Another important regulation was enacted in November of 2009 and prohibited that two or more seatsin public institutions be occupied by the same student (Law 12.089). Until then, a student could be enrolledin more than one public institution at the same time. Anecdotal evidence suggests that this situation wasnot unusual. The new regulation aimed to increase the relative availability of seats in public institutions andpreceded the creation of SISU.
14In 2010, the Ministry of Education created both PNAES and PNAEST, which are programs thatguarantee resources for student assistance in state and federal public institutions, respectively. For statepublic institutions, the transfers were proportional to the number of seats made available through SISU. Forfederal public institutions, there was no such explicit condition. Since federal institutions are funded by thefederal government, alignment with the Ministry of Education is desirable.
7

for which they qualify. The result of the assignment mechanism and the list of admitted
candidates are published online. All applicants are informed about their classi�cation on the
list. Appendix I provides further details of the system.
By 2008, when the Ministry of Education announced the ENEM reformulation, many
institutions were skeptical about its new and selective content and about the practical man-
agement of an exam of such importance. However, both ENEM and SISU have built a solid
reputation over time, and more institutions increasingly joined the centralized assignment
mechanism. In the �rst year of SISU, 59 out of 178 federal and state public institutions
adopted the system. From 2010 to 2014, SISU adoption rapidly increased, both in number
of institutions and in number of available seats.15
In sum, after 2010, public institutions experienced a broader range of options to admit
students. Currently, four non-exclusive admission metrics are available: Vestibular scores
only, some combination of ENEM and Vestibular scores, ENEM scores without the SISU
platform, and ENEM scores through the SISU platform.16
2.4 Theoretical Discussion
Before turning to our empirical strategy, which exploits the gradual adoption of SISU
across public institutions in Brazil, we discuss the expected �rst-order e�ects of centralization
on students sorting (measured by test scores), migration and enrollment.
2.4.1 Test Scores
While deviations in academic assortative matching are common in higher education, stu-
dents' application and enrollment decisions are key drivers of such result. Therefore, rules,
regulations and procedures in admissions are critical to enhance competition among appli-
cants, improve the quality of the entering cohort and reduce college mismatch. Aside from
information on admission standards that are made available on SISU, the nearly universal
15Figures 6 and 7, Appendix II, depict these patterns. In 2010, approximately 25% of public institutionsjoined it. More than 64 thousand seats were o�ered in the system. In 2014, about 50% of public institutionsalready adopted SISU and almost 225 thousand seats were made available in the system.
16In 2014, for example, all federal universities used ENEM scores to select students by joining the SISUsystem, by incorporating the ENEM score into the overall grade in the Vestibular exams without SISU or byemploying the ENEM score as �rst phase or bonus for admissions through Vestibular. In January of 2015,only �ve out of sixty-three federal universities did not select students through SISU.
8
nature of ENEM-taking also informs students about their own ability and on how admissible
they are to selective institutions and degrees (Goodman, 2016).
In a theoretical framework, Che and Koh (2016) analyze the consequences of a central-
ized college admission that uses a deferred acceptance assignment. The authors show that,
although centralized admission leads to e�ciency and fairness, it does not necessarily imply
that all colleges will be better o�. Some colleges may be worse o� because they no longer
attract some goods students they used to get under the decentralized admission. In a cen-
tralized setting, students will be assigned to the best colleges for which they qualify to, with
no justi�ed envy among them. Cuto� admission scores will exhibit a monotonic pattern and
only the top-scoring students are enrolled.
In the case of SISU, the clearinghouse not only coordinates assignments across partici-
pant institutions, but also facilitates the application process for students. Search costs are
considerably reduced due to the availability of a friendly interface that gathers information
on the available majors, institutions, and campus location.17 In addition, monetary and
time costs are lowered because applicants only need to one exam serving multiple purposes,
instead of bearing many application fees and taking many admission exams.18
These combined features are expected to change application decisions and move prices
(measured by admission cuto� scores) in the direction of the aggregate and nationwide
demand. In the Brazilian case, switching to SISU is only possible for federal and state
public institutions, which are perceived as high quality institutions in the country. They
are also tuition-free, which allows them to attract students regardless of their income or
willingness to pay. Thus, centralization is expected to increase competition and the sorting
of admitted students. If seats in public institutions are in high demand, admission scores
should increase for them.
2.4.2 Migration
Before SISU, public institutions operated in local markets, serving mainly its local pop-
ulation. In most cases, exams were taken near the place in which institutions were located,
17In the U.S., the Common Application is an example of an online instrument that facilitates the searchand college application process.
18Pallais (2015) shows that students are sensitive to monetary costs in the college application decisions.When they were allowed to send an extra free application, they applied to more colleges and low-incomestudents attended more selective colleges.
9
which severely limited the geographical scope of applications. Moreover, applicants needed
to gather information about the application rules (dates and requirements) on a case-by-case
basis. With centralization, the scope of the market increases, allowing public institutions
to recruit nationally. While SISU alleviates many geographical barriers, migration in not a
foregone conclusion.
Although public institutions are tuition-free, subsistence costs, including room and board,
can be sizable in a context in which credit lines and loans are not easily available. An
additional factor is the sizable dimension of the country. We empirically investigate which
e�ect dominates.
2.4.3 Enrollment
Seats o�ered by public institutions are in �xed supply. They are only made available to
candidates ranked in the waitlist after have been declined by previous occupants both before
and after SISU. While capacity constraints are met by design, rendering subscription beyond
the target impossible, there are still concerns about undersubscription: seats left unoccupied
by the end of the academic term are still paid for by public funds.
College quality has lasting e�ects on persistence. If centralization improves matches,
enrollment rates by the end of the �rst-year could increase. In our data, however, enrollment
rates of students ever o�ered a seat are substantially high, and it is possible that SISU
does not operate on this margin. More interesting is the e�ect of centralization on the seat
turnover rate, which are measured as the likelihood of an ever existing registration being
canceled (in this case, the seat is left vacant for the next top-scoring applicant). As search
costs go down, we expect turnover to increase.
3 Data
In this paper, we use two annual administrative datasets, the Brazilian Higher Education
Census and the ENEM databases. The Higher Education Census provides a comprehensive
overview of all higher education institutions in the country, with information about their
graduation programs, technical-administrative sta� and instructors, as well as individual de-
mographic information on each student matriculated in higher education institutions. The
ENEM database contains detailed information on test-takers' scores, along with demographic
10

characteristics and questionnaires. We have gained restricted data access to students' iden-
ti�cation numbers available in both datasets, which allows us to link them.
We make the following sample restrictions in the Census. First, we limit the analysis
to the 2010-2014 Census because reliable individual information started to be reported in
2010 and the most recent available year is 2014.19 Second, we exclude private and municipal
public institutions because they cannot join SISU. Only public and tuition-free institutions
are allowed to participate in the platform. Third, we drop observations from online education
programs. Fourth, we restrict our sample to �rst-year students. Our analysis focuses on the
short-run, but �rst-order, e�ects of SISU on �rst-year students because they are still too
young to graduate by the last year of our data. After these restrictions, our �nal sample
consists of �ve cohorts of �rst-year students � with 2.167.313 individuals � admitted between
2010 and 2014 to federal and state public institutions. We refer to this sample as the Census
baseline sample.
We link Census data in a given year with ENEM data in the previous year, since these
test scores can be potentially used for college admission. Thus, the ENEM data of interest
range from 2009 to 2013. Our linking variable is the Brazilian Taxpayer Registry, a number
that is uniquely assigned to individuals in the country and used for tax collection purposes
and social security claims. The advantage of integrating both datasets is twofold. First, we
can identify ENEM test score of students enrolled in higher education institutions. Second,
while Census data recover students' place of birth, ENEM data provides information on
place of residence at the time when the exam is taken. Both locations are considered when
measuring students' mobility. We are able to match about 71% of the Census baseline sample
to the ENEM datasets.20,21 We refer this sample as the Census-ENEM matched sample.
Therefore, the Census-ENEM matched sample contains information on all �rst-year stu-
19Individual information started to be collected in 2009. Prior to that year, information is only availableat more aggregate levels. However, the Brazilian Taxpayer Registry, which is the identi�cation number weuse to link the ENEM and Census datasets, are only reported from 2010 onwards. Discussions with theINEP sta� indicate that the inclusion of the Taxpayer Registry is essential to build a reliable link betweenboth Census and ENEM datasets.
20More precisely, 1.539.008 out of 2.167.313 students. Matching rates increase over time due to growingimportance of the ENEM exam and are shown in the Appendix III. Unmatched individuals correspond toindividuals who did not take the ENEM exam, but enrolled in higher education institutions using Vestibular
scores only.21Our matching procedures indicate that we are able to recover test score information of at least one
student in 35.420 out of 37.462 (95%) program-year combinations of our sample. This allows us to infer theaverage ENEM scores for programs that do not require ENEM scores for admissions and re�ects the exam'sgrowing importance to students.
11
dents in federal and state public institutions registered in on-campus programs, along with
information about the program itself (e.g. degree, institution, geographical location, whether
and when it adopted SISU, etc.) and several demographic characteristics of students (e.g.
tests scores, place of residence before college admission, etc.).
The three outcomes of interest are generated in the following way. ENEM test scores
are standardized to have zero mean and standard deviation of one across all test takers in
each year. Migration dummies indicate whether the place of residence (or the place of birth)
is di�erent from the place where the program is located.22 We use geographical location
measured at the municipality and state levels to capture inter- and intra-state migration
patterns. Enrollment outcomes are measured among all ever registered students in the
Census, and indicate whether students have had their registration canceled or have requested
leave of absence by the end of their �rst year. We refer to them as inactive students. Since
canceled registrations likely indicate that the seat was subsequently occupied by another
student, we also consider both categories separately. Further details about how data and
variables are constructed can be found in the Appendix III.
Our research design exploits the gradual transition from decentralization to centralization
made possible by SISU. Our third data source � provided by the Ministry of Education �
consists of information on when (and if) programs and institutions joined SISU. We add this
information to our samples.
Table 1 reports annual descriptive statistics for �nal analysis sample from 2010 to 2014.
We observe two noteworthy patterns. First, less students are admitted through Vestibular
exams over time (the fraction decreases from 77% to 39%), while more students are admitted
through ENEM exams (the proportion goes from 22% to 51%). This pattern re�ects the
rapid expansion of the system over time. Second, we notice a rapid increase in the number
of �rst-year students admitted under a�rmative action policies. The share of �rst-year
students bene�ted from quota systems grows from 12% to 28%. A�rmative action policies
have grown in importance over time, and while they are likely unrelated to SISU adoption,
we will consider quota controls in our empirical strategy.23
22Information of birthplace is available in the Census datasets for nearly 70% of �rst-year students (thatis, 1.517.614 out of 2.167.313 individuals).
23Prior to 2012, a�rmative action policies relied on very few and independent initiatives of institutionsand local governments. They started taking place in 2002, when two public universities from Rio de Janeiro(UERJ and UENF) and one from Bahia (UNEB) introduced a system of quotas to admit students (Assunçãoand Ferman, 2011). It was followed by one university in Brasília (UnB) in 2004 and one university in São
12

4 Empirical Model
4.1 Empirical Strategy
To investigate how the introduction of a centralized admission system a�ects scores,
migration, and enrollment of �rst-year students, we estimate the following equation:
Yipt = c+ βSISUpt + δXit + γXpt + αp + αt + αs ∗ t+ εipt (1)
in which Yipt is the outcome of interest for student i enrolled in program p and year t,
and SISUpt indicates whether program p (partially or fully) adopted the SISU system in
year t. The regression also includes year and program �xed e�ects, αt and αp. Year �xed
e�ects control for common shocks that a�ect all students each year, whereas program �xed
e�ects control for time-invariant characteristics of programs that might be correlated with
the outcomes of interest and the decision of adopting a centralized admission. To capture
unobserved state characteristics that evolve over time, we add state linear time trends, αs*t.
Standard errors are clustered at the institution level.24
We introduce student- and program-level control variables in the baseline regression,
represented by the vectors Xit and Xpt, respectively. Individual controls include gender,
age, race, a dummy for disability, and indicator variables for a�rmative action admission
through quota policies and for whether the student receives social support.25 Program-level
characteristics barely vary over the study period. To ensure that our estimates are not driven
by supply side e�ects, we include the annual number of seats available in each program.26
Paulo (UNICAMP) in 2005 (Francis and Tannuri-Pianto, 2012; Estevan et al., 2016). In 2012, the enactmentof a federal quota law mandated that half of the seats in federal institutions to be reserved to a�rmativeaction candidates until 2016. The implementation of a�rmative action policies remains optional for otherinstitutions, including state public institutions. Ever since, many public institutions have started reservingsome of their seats for students from public schools and low-income families, including those who are Africanor indigenous descent.
24Clustering standard errors at the institution level, rather than program level, is a more conservativespeci�cation. Our �ndings remain robust to speci�cations that replace program �xed e�ects by institution�xed e�ects and consider the transition from a decentralized to a centralized admission by institutions. Wealso consider treatment intensity by interacting SISUpt with the fraction of students admitted using ENEMscores. These results are available upon request.
25Social support comprises food, housing, and material support, among others.26The expansion of the number of seats available in federal public institutions started in 2007 with REUNI
(Reestruturação e Expansão das Universidades Federais). Speci�cally designed for federal universities, thisinitiative aimed at boosting college access and retention by increasing the number of undergraduate programsand spots, building new campuses in remote areas, hiring more lecturers, and renovating existing builtstructure. In 2008, the second year of the program, nearly 98% of federal universities agreed to join this new
13
We consider the e�ects on admission scores as the primary consequence of centralization.
In recognition that any measured impact on migration and enrollment status can be mediated
by this margin of selection, we will further consider including ENEM scores as regression
controls when looking at these two outcomes.
4.2 The Adoption of SISU
Institutions were granted autonomy and �exibility on their decision to adopt the clear-
inghouse. Approval hinged on majority agreement of voting members of the institution's
council (generally composed by the dean and department chairs). In many cases, voting was
heated and tight. A common argument in favor of SISU was the fairness and e�ciency that
centralized mechanism entails to applicants, whereas a prominent argument against was the
loss of autonomy in recruiting students, neither of which were inherent to speci�c institu-
tions. The Ministry of Education, in turn, o�ered the same incentives and compensations for
institutions to join the clearinghouse. While the adoption of SISU occurred at the institution
level, each programs could still decide how many seats would be o�ered by the system.
Our empirical strategy relies on the assumption that the timing of the adoption of a new
centralized clearinghouse is exogenous with respect to the outcomes of interest, conditional
on programs and students' characteristics and program and year �xed e�ects. We note
that our baseline regression performs a within-program analysis by comparing each program
to itself before and after centralization. Thus, any concern related to �xed program (and
institution) characteristics in�uencing the decision to move to a centralized admission is fully
addressed by this empirical strategy.
Table 2 shows that adopting a centralized mechanism is not associated with the majority
of institutions' characteristics at conventional levels of signi�cance. The table compares
the characteristics of institutions that ever adopt SISU with non-adopters in our analysis
sample using Census data from 2009, the year before the creation of SISU. We notice,
however, few important di�erences. As expected, federal institutions are more likely to join
the SISU system. Unsurprisingly, they are also larger (with a higher number of students
and instructors) and more likely to have bachelor's degree programs, which are features
strongly correlated with federal public institutions. These di�erences are accounted for by the
initiative. Given that this program was largely adopted and preceded SISU, we expect this expansion to beuncorrelated with SISU adoption.
14

inclusion of program �xed e�ects. In addition, previous �ndings in Szerman (2015) suggest
that our results are not sensitive to considering federal and state institutions separately. We
also note that institutions located in the Brazilian southeast region, which is one of the �ve
administrative regions in Brazil, are less likely to adopt the SISU system. This region hosts
the largest cities and labor markets in the country. The inclusion of program �xed e�ect
also absorbs region and state �xed e�ects. Nonetheless, since evolving state conditions could
confound the e�ects of SISU adoption, we include state speci�c trends.
More worrying would be the existence of some unobservable time-varying factors that
a�ect the adoption of the clearinghouse. Indeed, in the school context, Ekmekci and Yenmez
(2014) argue that every school prefer to evade a centralized clearinghouse if all other schools
have joined it, under a setting in which leftover schools are able to attract applications from
all students. In our college setting, in Brazil, decentralized admissions generally consist of
taking speci�c examinations for each institution. Thus, it is unlikely that leftover institutions
are able to capture these other applications. In addition, increased adoption of SISU over
time corroborates that this possibility is not at play. Nonetheless, we conduct an event
study analysis to investigate time-varying determinants of adoption by including institution
and year �xed e�ects, as well as dummies indicating the time relative to SISU adoption
(generated as the current year minus year of SISU adoption: e=≤-5, -4, -3, -2, -1, 1, 2, 3and 4). We rely on aggregate information of institutions from the Higher Education Census
since 2000 and examine the few outcomes available in these data.27 Results are displayed in
Table 3. We do not �nd e�ects on institutions' characteristics before and after SISU, further
reinforcing the interpretation of a nearly random adoption of the clearinghouse across public
institutions in Brazil.
4.3 Indirect E�ects
While changes in admission standards are the expected �rst order e�ects of centralization,
tests scores could also go hand in hand with other students' characteristics. Therefore,
before turning to our main results, we examine whether the introduction of SISU changes
27The dependent variables are the total number of �rst-year students, total number of employees, shareof employees with college degree or higher, total number of professors, share of professors with PhD degree,total amount of own revenues, transfers and other revenues. These variables are consistently found between2000 and 2014 and are mostly reported at the institution level. In 2009, information on revenues or transferswere omitted. Our sample consists of institutions that ever adopted SISU between 2010 and 2014.
15
the composition of students in several observable dimensions. Table 4 reports the within-
program estimates, controlling for state trends, in which each of the students' and programs'
observable characteristics are dependent variables.
Overall, we �nd weak evidence of student selection based on observable characteristics,
with the exception of age and gender. The positive e�ect on age is expected because retaking
the ENEM exam, which takes place only once a year, is possible. As for gender, evidence
in the literature suggests that women are more risk-averse than men and perform relatively
worse under competition (Gneezy et al., 2003; Niederle and Vesterlund, 2007). The negative
coe�cient indicates that girls are more responsive to centralization. Nonetheless, both e�ects
are economically small.28 We also examine changes in program size, measured by the number
of seats o�ered by each program, Xpt. We �nd weak evidence of supply side e�ects, although
the small coe�cient is statistically signi�cant. Nonetheless, we include all these variables as
controls, but do not expect results to change with their inclusion.
Table 4 suggests that there were no systematic changes in students' and programs' ob-
servable characteristics after the introduction of SISU. Thus, any e�ect on student sorting,
migration and enrollment can be attributed to centralization rather than changes in student
composition or program characteristics along the above dimensions.
5 Results
5.1 E�ects on ENEM Scores
In Brazil, public institutions are generally perceived as having high quality programs.
Therefore, we expect them to attract better students after adopting SISU. Table 5 documents
the �ndings on student sorting. Column (1) reports the estimates for the model with no
controls and documents a positive relationship between test scores and the adoption of SISU.
Adding program and year �xed e�ects in Column (2) indicates that the within-program
comparison is stronger. Columns (3) and (4) include individual and program level controls,
28To reinforce that our results are not driven by student selection, we consider an additional set of students'characteristics, gathered from ENEM questionnaire, including parental education, family income, and lengthof school education. Table 12, Appendix IV, indicate that other observable students' characteristics are nota�ected by the implementation of SISU, except for a smaller fraction of �rst-year students with familyincome lower than one minimum wage (at the 10% level of signi�cance) and from non-urban areas. Albeitsigni�cant, these coe�cients are quantitatively negligible.
16
respectively. Results barely change, consistent with those characteristics being uncorrelated
with SISU adoption, as suggested in the previous section.
State speci�c trends are considered in Columns (5) and (6) and reduce the point estimate
by less than 10 percent. Column (5) displays the coe�cients for a speci�cation with all �xed
e�ects and state trends. Column (6) is our preferred speci�cation with all controls. We
�nd that the introduction of a centralized assignment leads to an increase by 0.302 standard
deviations of the ENEM score distribution.29
Finally, it is important to note that our sample includes all students ever enrolled as
�rst-year students, regardless of their registration situation by the end of the academic year.
Column (7) restricts the sample analysis to students that are enrolled by the end of their
�rst year. We �nd similar e�ects, indicating that dropouts are in great part high achievers
moving to preferred programs.
These �ndings are related to an empirical literature focused on understanding how ed-
ucation policies a�ect sorting, rather than their impacts on achievement (Urquiola, 2005).
The entry of private schools in the market (Epple and Romano, 1998), greater school choices
(Urquiola and Verhoogen, 2009), a�rmative action ban (Arcidiacono et al., 2014), informa-
tion on school quality (Hastings and Weinstein, 2008) and changes in admission systems
(Bordon and Fu, 2015) are some examples of policies that lead to more e�cient sorting of
students.
5.2 E�ects on Migration
We next turn to investigate the e�ects on migration. Table 6, Panel A, presents the results
for interstate migration, using the ENEM-Census matched sample. In this case, migration
is related to the place of residence when ENEM is taken. The within-program estimate
in Column (2) indicates a higher likelihood of migration after introducing a centralized
admission by 5.8 percentage points (p.p.). However, the e�ect is halved once individual level
29The overall e�ect, however, does not inform which areas of knowledge experienced a higher increase inscores. Institutions are granted �exibility to place di�erent weights on areas of knowledge to calculate thecomposite score for each program. This discretion allows programs to attract students with a better �t. Forexample, medical programs commonly set a greater weight on Natural Science and engineering programsmight value Math more heavily. When we run Equation (1) separately for each area of knowledge, we�nd that essay scores have a larger increase in scores � the estimated coe�cient is 0.359 SD. This e�ect isnoticeable when compared to the increase experienced by other areas, which ranges from 0.184 to 0.203 SD,and suggests that a substantial weight is placed to the only area without multiple choice questions. These�ndings are available upon request.
17

controls, particularly ENEM scores, are added. Column (3) reveals that individuals with
higher scores are more likely to migrate. Once we control for scores, the e�ect of SISU on
migration is reduced to 2.4 p.p. and remain stable after the inclusion of program controls
and state trends, as shown in Columns (4) and (5). In Column (6), we restrict the sample
to students who remain enrolled by the end of their �rst year. The lower coe�cient among
enrolled students (2.1 p.p.) indicates that migration e�ects are higher for the dropout sample
and highlights that migration costs are not negligible for persistence in higher education.
Table 6, Panel B, displays the results for alternative migration measures. Column (1)
repeats our preferred speci�cation in Column (5) of Panel A. We start by considering mi-
gration de�ned at the municipality level in Column (2). We �nd lower, but still positive and
signi�cant e�ect (1.4 p.p.), indicating that mobility across municipalities was common even
before SISU. Selective migration before college is also of concern, as students might already
have located near the places where they plan to live when they take the ENEM exam. There-
fore, we also examine results that rely on birth place information available in Census data.
We note, however, that birthplace information is missing for 70% of students in the Census
baseline sample. In Columns (3) and (4), we consider results using the matched ENEM-
Census sample and controlling for ENEM scores. In Columns (5) and (6), we consider the
Census baseline sample without controlling for ENEM test scores.
One striking pattern emerges. Results are nearly identical across Columns (3) and (5)
(as well as Columns (4) and (6)). Controlling for ENEM scores is mainly irrelevant for
migration related to place of birth. This evidence enhances the argument for the use of
place of birth being more exogenous. Overall, results based on place of birth indicate a
sizable and statistically signi�cant e�ect on student mobility, ranging from 2.9 p.p. to 3.1
p.p. for interstate migration and 3.3 p.p. to 3.4 p.p. for cross-municipality migration. The
implied travel distance given by Columns (2), (4) and (6) are 26.5, 28.9 and 31.2 kilometers,
respectively.30 Since migration likelihood only changes by 3 p.p., the distance incurred by
students that actually move is as large as 1.000 kilometers (or equivalently, a little less than
the distance between Rio de Janeiro and Brasília).
Our �ndings are consistent with Niederle and Roth (2003) and Abdulkadiroglu et al.
(2015). Niederle and Roth (2003) �nd that the implementation of a centralized clearinghouse
30Results are available upon request. We estimated similar speci�cations replacing the migration indicatorby distance between the centroids of the source and receiving municipality. If those were in the samemunicipality, distance was considered as zero.
18

in the gastroenterology medical market increased mobility by widening the scope of the
market. In the school choice context, Abdulkadiroglu et al. (2015) show that a centralized
assignment system enhances students' willingness to travel, in comparison to a previously
uncoordinated mechanism, even though daily commutes are costly to school students. Our
�ndings suggest that college admission is more closely related to the medical market, since
tertiary students face fewer restrictions to migrate than school students.
Furthermore, our results have relevant policy implications. Recently, many countries
have implemented policies to attract college educated workers (Guellec and Cervantes, 2002;
Groen, 2004). One recurrent argument to justify these interventions is that attending college
in a speci�c state might increase the probability of remaining in the same state after grad-
uation (Fitzpatrick and Jones (2012)). However, our �ndings show that application costs
hinder mobility in the college market and that centralized assignment helps to reduce these
frictions by mitigating geographical constraints.
5.3 E�ects on Enrollment
At last, we look at enrollment status of ever registered students by the end of the academic
year. On the one hand, improved matches between students and programs could translate
into higher persistence rates. On the other hand, admitted students are now also more likely
to be coming from more distant places. Thus, migration and subsistence costs could act as
countervailing forces.
Table 7 displays the results. Column (1) considers the likelihood of an ever registered
student being inactive either because her initial registration has been cancelled or because
she has requested leave of absence. It shows that inactivity increases by 4.3 p.p. with SISU.
In Column (2), we con�rm that the coe�cient remains robust when we consider the Census
baseline sample (and no test score control).
We note, however, that there is an important di�erence between registration cancellation
and leave of absence status. While requesting leave of absence allows students to re-enroll
at the program at a later date, a registration cancellation implies the seat is left vacant to
another student.31 We then consider the two enrollment status separately in Columns (3)
and (4). The results indicate that the previously found e�ect on inactivity is mainly driven
31Re-enrollment after a leave request is subject to internal rules de�ned by each institution. In general,students can request to be on leave only after completing one semester.
19
by canceled registrations. Since the test score e�ects of SISU on inactive students are even
higher than on enrolled students (Table 5, Columns (6) and (7)), we speculate that students
who have had their registration canceled have opted for another preferred program.32 In
Column (5), we drop canceled registrations from the sample, and the results on leave of
absence remain very small, in spite of being statistically signi�cant. Nonetheless, in Column
(6), we consider an alternative seat vacancy measure, generated as 1 minus the ratio of the
number of enrolled students by the end of the year and the total number of seats available
in the program. We �nd no e�ect on seats left vacant through this alternative measure.
In sum, centralization increases the turnover rate of seats available through the system, as
a same seat is occupied by other students beyond its last holder. Moreover, �nal enrollment
rates are not a�ected by SISU. The last �nding is unsurprising in the context of Brazil, since
public institutions are in high demand and are able to recruit candidates in a wait-list until
all seats are occupied.
5.4 Winners and Losers?
A natural extension to our results is whether and how the impacts of centralization di�er
across programs according to their di�erent levels of selectivity and �elds of study. To do so,
we combine the 2009 ENEM microdata with the 2010 Census to recover the average ENEM
scores of �rst-year students from programs listed in the 2010 Census. We divide these scores
into quartiles to obtain a proxy for programs' selectivity. Thereafter, we estimate Equation
(1) by quartile, in which �rst quartile faces the smallest and fourth quartile faces the largest
average ENEM scores.33 Table 8 presents the results. We �nd similar and homogeneous
e�ects in all quartiles, suggesting that centralization tends to yield improvements to all
programs, regardless of their selectivity.
Furthermore, we test for heterogeneous e�ects across �elds of study. Following the inter-
national classi�cation of �elds of education and training (UNESCO Normalized International
Classi�cation of Education), we categorize all degrees into eight groups: Education; Human-
ities and Arts; Social Sciences; Business and Law; Science; Engineering, Manufacturing and
Construction; Agriculture; Health and Welfare. Table 9 reports the estimates. Consistent
32A new registration is possible both within SISU (if the student was wait-listed in her �rst option), orin seats available outside SISU.
33We replicate these steps for an alternative combination of the 2013 ENEM microdata with the 2014Census, as a robustness check. The �ndings remain similar.
20
with the previous results, we �nd that the SISU adoption leads to similar impacts on test
scores, migration and enrollment status in almost all �elds.
Taken together, Tables 8 and 9 suggest that centralization does not favor speci�c pro-
grams. Switching into a centralized admission system would likely create positive impacts
for all college degrees and institutions that are able to recruit in a broader market.
6 Conclusion
In recent years, the creation of centralized clearinghouses has become a widespread edu-
cation policy under the argument that they provide a broader access to all candidates and
produce better outcomes (Hoxby, 2003; Abdulkadiroglu et al., 2015; Hat�eld et al., 2016). In
this paper, we provide some the �rst empirical evidence on the consequences of centralization
in the college market.
To do so, we exploit variation induced by the gradual introduction of a new centralized
clearinghouse across higher education institutions between 2010 and 2014 in Brazil, yielding
three primary results. First, we �nd that the adoption of a centralized mechanism largely
impacts the quality of incoming students, which is measured by their standardized test scores.
This positive e�ect corresponds to an increase by approximately one third of a standard
deviation, which can be interpreted as a result of better student-institution matches. Second,
we �nd that centralization positively a�ects students' mobility. The likelihood of attending
college in a di�erent state is increased by a sizable amount, guaranteeing fair access beyond
geography. Third, we �nd negligible e�ects of centralization on �nal enrollment rates, but
positive e�ects on the turnover rate of seats, indicating a higher search intensity by students.
Overall, we �nd positive e�ects of centralization in the college market.
The setting of our study indicates that these �ndings can be extended more broadly to
any admission or recruiting e�ort made at a large geographical scale, such as post-graduate
admission or labor market recruitment. Key features in the setting should encompass a
unique metric that ranks candidates and the absence of geographical restrictions in the
admission process. Our �ndings also underscore broader questions for further research.
Since college education is an important determinant of returns in the labor market, future
work will investigate the cumulative and long-run e�ects of college centralization.
21
References
Abdulkadiroglu, A., N. Agarwal, and P. A. Pathak (2015). The Welfare E�ects of Coordi-
nated Assignment: Evidence from the NYC HS Match. Working Paper 21046, NBER.
Abdulkadiroglu, A., P. A. Pathak, and A. E. Roth (2005). The New York City High School
Match. American Economic Review , 364�367.
Abdulkadiroglu, A. and T. Sönmez (2003). School Choice: A Mechanism Design Approach.
The American Economic Review 93 (3), 729�747.
Agarwal, N. (2015). An Empirical Model of the Medical Match. American Economic Re-
view 105 (7), 1939�78.
Arcidiacono, P., E. Aucejo, P. Coate, and V. J. Hotz (2014). A�rmative Action and Uni-
versity Fit: Evidence from Proposition 209. IZA Journal of Labor Economics 3 (1), 1.
Arcidiacono, P., E. M. Aucejo, H. Fang, and K. I. Spenner (2011). Does A�rmative Action
Lead to Mismatch? A New Test and Evidence. Quantitative Economics 2 (3), 303�333.
Arcidiacono, P. and M. Lovenheim (2016). A�rmative Action and the Quality�Fit Trade-
O�. Journal of Economic Literature 54 (1), 3�51.
Assunção, J. and B. Ferman (2011). Does A�rmative Action Enhance or Undercut Invest-
ment Incentives? Evidence from Quotas in Brazilian Public Universities. Manuscript,
Massachusetts Institute of Technology Department of Economics .
Bettinger, E. P., B. T. Long, P. Oreopoulos, and L. Sanbonmatsu (2012). The Role of
Application Assistance and Information in College Decisions: Results from the H&R Block
Fafsa Experiment. The Quarterly Journal of Economics 127 (3), 1205�1242.
Black, S. E., K. E. Cortes, and J. A. Lincove (2015). Academic Undermatching of High-
Achieving Minority Students: Evidence from Race-Neutral and Holistic Admissions Poli-
cies. The American Economic Review 105 (5), 604�610.
Bordon, P. and C. Fu (2015). College-Major Choice to College-Then-Major Choice. The
Review of Economic Studies 82 (4), 1247�1288.
22

Camargo, B., R. Camelo, S. Firpo, and V. P. Ponczek (2014). Information, Market Incentives,
and Student Performance. IZA Discussion Paper 7941 .
Carrell, S. E. and B. Sacerdote (2013). Why Do College Going Interventions Work? Working
Paper 19031, National Bureau of Economic Research.
Chade, H., G. Lewis, and L. Smith (2014). Student Portfolios and the College Admissions
Problem. The Review of Economic Studies 81 (3), 971�1002.
Che, Y.-K. and Y. Koh (2016). Decentralized College Admissions. Journal of Political
Economy 124 (5), 1295�1338.
Cohodes, S. R. and J. S. Goodman (2014). Merit Aid, College Quality, and College Com-
pletion: Massachusetts' Adams Scholarship as an In-Kind Subsidy. American Economic
Journal: Applied Economics 6 (4), 251�285.
Dillon, E. and J. Smith (2016). Determinants of the Match between Student Ability and
College Quality. Journal of Labor Economics, forthcoming .
Dinkelman, T. and C. Martínez (2014). Investing in Schooling in Chile: The Role of Informa-
tion about Financial Aid for Higher Education. Review of Economics and Statistics 96 (2),
244�257.
Ekmekci, M. and M. B. Yenmez (2014). Integrating Schools for Centralized Admissions.
Available at SSRN 2474700 .
Epple, D. and R. E. Romano (1998). Competition Between Private and Public Schools,
Vouchers, and Peer-Group E�ects. American Economic Review , 33�62.
Estevan, F., T. Gall, and L.-P. Morin (2016). Redistribution Without Distortion: Evidence
from an A�rmative Action Program at a Large Brazilian University. Technical report,
University of São Paulo (FEA-USP).
Fitzpatrick, M. D. and D. Jones (2012). Higher Education, Merit-Based Scholarships and
Post-Baccalaureate Migration. Technical report, National Bureau of Economic Research.
Francis, A. M. and M. Tannuri-Pianto (2012). Using Brazil's Racial Continuum to Examine
the Short-Term E�ects of A�rmative Action in Higher Education. Journal of Human
Resources 47 (3), 754�784.
23
Fu, C. (2014). Equilibrium Tuition, Applications, Admissions, and Enrollment in the College
Market. Journal of Political Economy 122 (2), 225�281.
Gale, D. and L. S. Shapley (1962). College Admissions and the Stability of Marriage. Amer-
ican Mathematical Monthly , 9�15.
Gneezy, U., M. Niederle, A. Rustichini, et al. (2003). Performance in Competitive Environ-
ments: Gender Di�erences. The Quarterly Journal of Economics- 118 (3), 1049�1074.
Goodman, S. (2016). Learning from the Test: Raising Selective College Enrollment by
Providing Information. The Review of Economics and Statistics 98 (4), 671�684.
Groen, J. A. (2004). The E�ect of College Location on Migration of College-Educated Labor.
Journal of Econometrics 121 (1), 125�142.
Guellec, D. and M. Cervantes (2002). International Mobility of Highly Skilled Workers: From
Statistical Analysis to Policy Formulation. In International Mobility of the Highly Skilled,
Chapter 3, pp. 71�98. OECD Publishing.
Hafalir, I. E., R. Hakimov, D. Kübler, and M. Kurino (2014). College Admissions with
Entrance Exams: Centralized versus Decentralized. No. SP II 2014-208. WZB Discussion
Paper .
Hastings, J. S., C. A. Neilson, and S. D. Zimmerman (2013). Are Some Degrees Worth
More Than Others? Evidence from College Admission Cuto�s in Chile. Technical report,
National Bureau of Economic Research.
Hastings, J. S. and J. M. Weinstein (2008). Information, School Choice, and Aca-
demic Achievement: Evidence from Two Experiments. The Quarterly Journal of Eco-
nomics 123 (4), 1373�1414.
Hat�eld, J. W., F. Kojima, and Y. Narita (2016). Improving Schools through School Choice:
A Market Design Approach. Journal of Economic Theory .
Hoper Educação (2014). Análise Setorial do Ensino Superior Privado � Brasil 2014. Hoper
Estudos de Mercado.
24

Hoxby, C. and C. Avery (2014). The Missing "One-O�s": The Hidden Supply of High-
Achieving, Low-Income Students. Brookings Papers on Economic Activity .
Hoxby, C. and S. Turner (2013). Expanding College Opportunities for High-Achieving, Low
Income Students. Stanford Institute for Economic Policy Research Discussion Paper (12-
014).
Hoxby, C. and S. Turner (2015). What High-Achieving Low-Income Students Know about
College. American Economic Review 105 (5), 514�17.
Hoxby, C. M. (2003). School Choice and School Productivity. Could School Choice Be a
Tide that Lifts all Boats? In The economics of school choice, pp. 287�342. University of
Chicago Press.
Kirkeboen, L., E. Leuven, and M. Mogstad (2016). Field of study, earnings, and self-selection.
The Quarterly Journal of Economics .
Narita, Y. (2016). Match or Mismatch: Learning and Inertia in School Choice. Working
Paper .
Niederle, M. and A. E. Roth (2003). Unraveling Reduces Mobility in a Labor Market:
Gastroenterology With and Without a Centralized Match. Journal of political Econ-
omy 111 (6), 1342�1352.
Niederle, M. and L. Vesterlund (2007). Do Women Shy Away From Competition? Do Men
Compete Too Much? The Quarterly Journal of Economics 122 (3).
Oreopoulos, P. and R. Dunn (2013). Information and College Access: Evidence from a
Randomized Field Experiment. The Scandinavian Journal of Economics 115 (1), 3�26.
Pallais, A. (2015). Small Di�erences that Matter: Mistakes in Applying to College. Journal
of Labor Economics 33, 493�520.
Roth, A. E. and X. Xing (1997). Turnaround time and bottlenecks in market clearing:
Decentralized matching in the market for clinical psychologists. Journal of Political Econ-
omy 105 (2), 284�329.
25

Sander, R. H. and S. Taylor (2012). Mismatch: How A�rmative Action Hurts Students It's
Intended to Help, and Why Universities Won't Admit It. Basic Books.
Szerman, C. (2015). The E�ects of a Centralized College Admission Mech-
anism on Migration and College Enrollment: Evidence from Brazil.
http://bibliotecadigital.fgv.br/dspace/handle/10438/13875 .
Urquiola, M. (2005). Does School Choice Lead to Sorting? Evidence from Tiebout Variation.
The American Economic Review 95 (4), 1310�1326.
Urquiola, M. and E. Verhoogen (2009). Class-Size Caps, Sorting, and the Regression-
Discontinuity Design. The American Economic Review 99 (1), 179�215.
26

Figure 1: Evolution of ENEM
Note: Graph shows, on the left axis, how the number of ENEM applicants rapidly evolved, since its �rstedition. On the right axis, graph shows the ratio of total number of applicants divided by the number ofhigh school graduates. Information on applicants are obtained from ENEM microdata. Information on highschool graduates are obtained from the annual School Census. The �rst edition, in 1998, received 157.221registrations (approximately 0.1% of the Brazilian population), while the last edition received 8.721.946registrations (roughly 4.3% of the Brazilian population), in 2014.
27

Table 1: Descriptive Statistics, Census-ENEM Matched Sample
Variables 2010 2011 2012 2013 2014
standardized ENEM scores 1.14 1.14 1.15 1.16 1.27(0.97) (0.92) (0.96) (0.99) (1.04)
% migration(municipality) 0.53 0.50 0.50 0.50 0.49(0.50) (0.50) (0.50) (0.50) (0.50)
% migration (state) 0.11 0.09 0.09 0.10 0.10(0.31) (0.29) (0.29) (0.29) (0.30)
% inactive 0.12 0.11 0.13 0.13 0.14(0.32) (0.31) (0.34) (0.33) (0.34)
% SISU* 0.23 0.37 0.44 0.51 0.62(0.42) (0.48) (0.50) (0.50) (0.48)
% vestibular 0.77 0.67 0.55 0.47 0.39(0.42) (0.47) (0.50) (0.50) (0.49)
% ENEM 0.22 0.28 0.36 0.48 0.51(0.47) (0.48) (0.50) (0.50) (0.50)
% female 0.54 0.52 0.53 0.52 0.51(0.50) (0.50) (0.50) (0.50) (0.50)
age 21.05 21.52 21.63 21.74 22.12(5.05) (5.61) (5.78) (6.00) (6.41)
% white 0.20 0.22 0.23 0.23 0.32(0.40) (0.41) (0.42) (0.42) (0.47)
% disabled 0.00 0.00 0.00 0.01 0.01(0.06) (0.06) (0.07) (0.07) (0.09)
% under social support 0.14 0.12 0.13 0.18 0.14(0.34) (0.33) (0.34) (0.38) (0.35)
% admitted through quotas 0.12 0.12 0.15 0.20 0.28(0.33) (0.33) (0.35) (0.40) (0.45)
number of seats 55.74 58.94 57.65 57.78 55.95(46.31) (50.95) (49.32) (49.37) (48.68)
Observations 237.737 293.711 319.868 334.712 352.980
Note: This table reports yearly descriptive statistics for �rst-year stu-dents enrolled in federal and state public institutions over the 2010-2014period. The sample includes all students who took ENEM exam in theprevious year. Table displays means and standard deviations in paren-thesis. Sources: 2010-2014 Higher Education Censuses and ENEM mi-crodata.* - Calculated using the Census baseline sample.
28
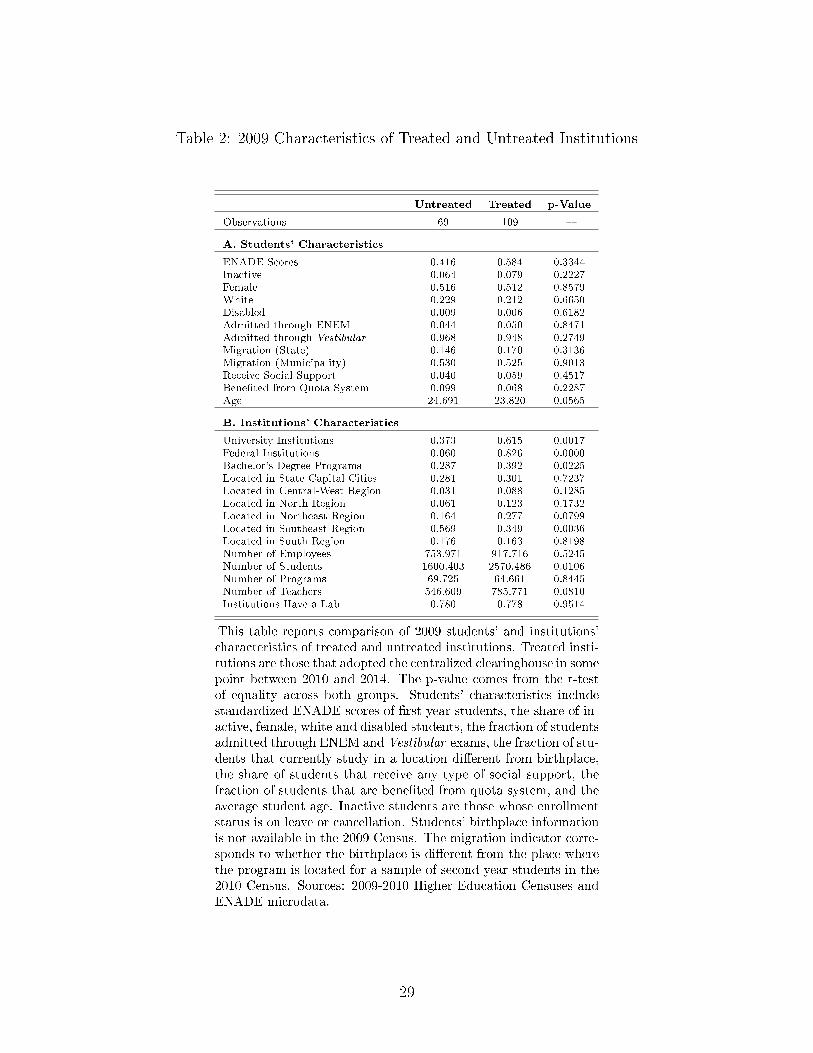
Table 2: 2009 Characteristics of Treated and Untreated Institutions
Untreated Treated p-Value
Observations 69 109 �
A. Students' Characteristics
ENADE Scores 0.416 0.584 0.3344Inactive 0.064 0.079 0.2227Female 0.516 0.512 0.8579White 0.229 0.212 0.6650Disabled 0.009 0.006 0.6182Admitted through ENEM 0.044 0.050 0.8471Admitted through Vestibular 0.968 0.948 0.2749Migration (State) 0.146 0.170 0.3136Migration (Municipality) 0.530 0.525 0.9013Receive Social Support 0.040 0.059 0.4517Bene�ted from Quota System 0.099 0.068 0.2287Age 24.691 23.820 0.0565
B. Institutions' Characteristics
University Institutions 0.373 0.615 0.0017Federal Institutions 0.060 0.826 0.0000Bachelor's Degree Programs 0.287 0.392 0.0225Located in State Capital Cities 0.281 0.301 0.7237Located in Central-West Region 0.031 0.088 0.1285Located in North Region 0.061 0.123 0.1732Located in Northeast Region 0.164 0.277 0.0799Located in Southeast Region 0.569 0.349 0.0036Located in South Region 0.176 0.163 0.8198Number of Employees 753.971 917.716 0.5245Number of Students 1600.403 2570.486 0.0106Number of Programs 69.725 64.661 0.8445Number of Teachers 546.609 785.771 0.0810Institutions Have a Lab 0.780 0.778 0.9514
This table reports comparison of 2009 students' and institutions'characteristics of treated and untreated institutions. Treated insti-tutions are those that adopted the centralized clearinghouse in somepoint between 2010 and 2014. The p-value comes from the t-testof equality across both groups. Students' characteristics includestandardized ENADE scores of �rst-year students, the share of in-active, female, white and disabled students, the fraction of studentsadmitted through ENEM and Vestibular exams, the fraction of stu-dents that currently study in a location di�erent from birthplace,the share of students that receive any type of social support, thefraction of students that are bene�ted from quota system, and theaverage student age. Inactive students are those whose enrollmentstatus is on leave or cancellation. Students' birthplace informationis not available in the 2009 Census. The migration indicator corre-sponds to whether the birthplace is di�erent from the place wherethe program is located for a sample of second-year students in the2010 Census. Sources: 2009-2010 Higher Education Censuses andENADE microdata.
29
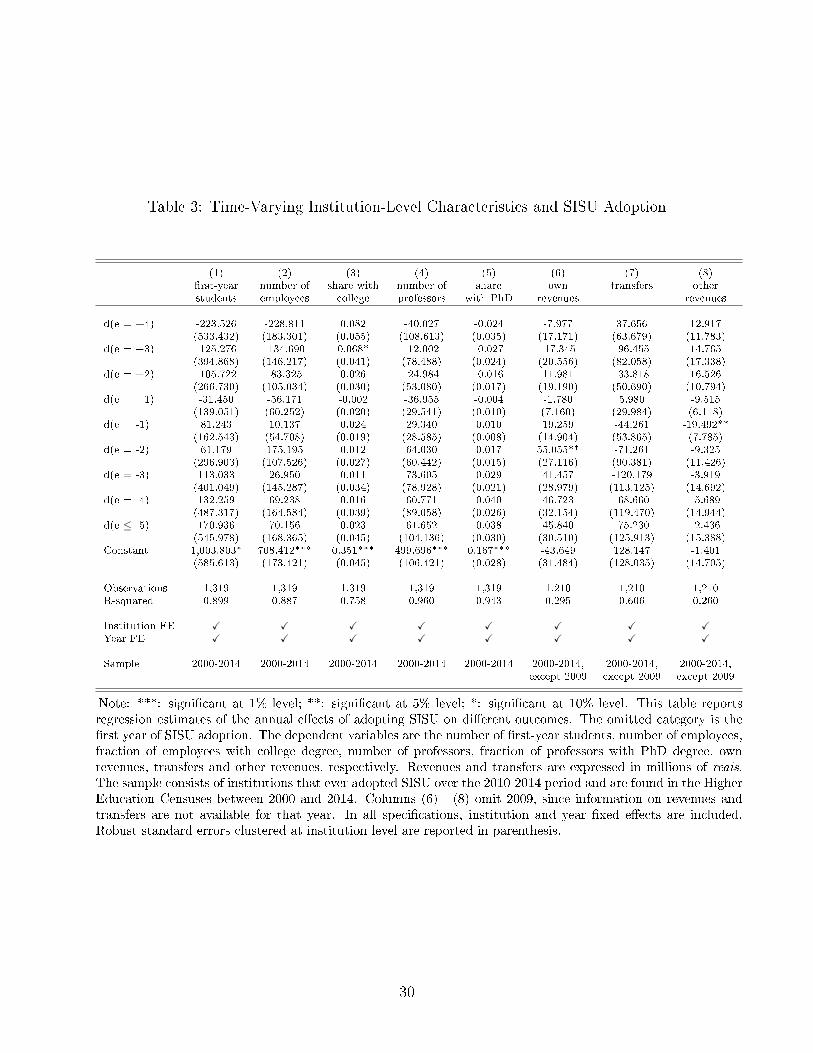
Table 3: Time-Varying Institution-Level Characteristics and SISU Adoption
(1) (2) (3) (4) (5) (6) (7) (8)�rst-year number of share with number of share own transfers otherstudents employees college professors with PhD revenues revenues
d(e = +4) -223.526 -228.811 0.082 -40.027 -0.024 -7.977 37.656 12.917(533.432) (183.301) (0.055) (108.613) (0.035) (17.171) (63.679) (11.783)
d(e = +3) -125.276 -134.690 0.068* -12.002 -0.027 -17.345 -96.455 14.765(394.868) (146.217) (0.041) (78.488) (0.024) (20.556) (82.058) (17.338)
d(e = +2) -105.722 -83.325 0.026 -24.984 -0.016 11.981 -33.818 16.526(266.730) (105.034) (0.030) (53.080) (0.017) (19.190) (50.690) (10.794)
d(e = +1) -31.450 -56.171 -0.002 -36.955 -0.004 -1.780 5.980 -9.515(139.051) (60.252) (0.020) (29.541) (0.010) (7.160) (29.984) (6.118)
d(e = -1) 81.243 10.137 0.024 29.340 0.010 19.259 -44.261 -19.492**(162.543) (54.708) (0.019) (28.585) (0.008) (14.904) (53.865) (7.785)
d(e = -2) 61.179 175.195 0.012 64.030 0.017 55.055** -71.261 -9.325(296.903) (107.526) (0.027) (60.442) (0.015) (27.116) (90.381) (11.426)
d(e = -3) 113.033 26.950 0.011 73.605 0.029 41.457 -120.179 -3.919(401.049) (145.287) (0.034) (78.928) (0.021) (28.979) (113.125) (14.692)
d(e = -4) 132.259 69.238 0.016 60.771 0.040 46.723 -68.660 -5.689(487.317) (164.584) (0.039) (89.058) (0.026) (32.154) (119.470) (14.944)
d(e ≤ -5) 170.936 70.156 0.023 61.652 0.038 45.840 -75.230 -2.436(545.978) (168.365) (0.045) (104.136) (0.030) (30.510) (125.913) (15.388)
Constant 1,003.803* 708.412*** 0.351*** 499.696*** 0.167*** -43.649 128.147 -1.401(585.613) (173.421) (0.045) (106.421) (0.028) (31.484) (128.035) (14.705)
Observations 1,319 1,319 1,319 1,319 1,319 1,210 1,210 1,210R-squared 0.899 0.887 0.758 0.960 0.943 0.295 0.606 0.260
Institution FE X X X X X X X XYear FE X X X X X X X X
Sample 2000-2014 2000-2014 2000-2014 2000-2014 2000-2014 2000-2014, 2000-2014, 2000-2014,except 2009 except 2009 except 2009
Note: ***: signi�cant at 1% level; **: signi�cant at 5% level; *: signi�cant at 10% level. This table reportsregression estimates of the annual e�ects of adopting SISU on di�erent outcomes. The omitted category is the�rst year of SISU adoption. The dependent variables are the number of �rst-year students, number of employees,fraction of employees with college degree, number of professors, fraction of professors with PhD degree, ownrevenues, transfers and other revenues, respectively. Revenues and transfers are expressed in millions of reais.The sample consists of institutions that ever adopted SISU over the 2010-2014 period and are found in the HigherEducation Censuses between 2000 and 2014. Columns (6) - (8) omit 2009, since information on revenues andtransfers are not available for that year. In all speci�cations, institution and year �xed e�ects are included.Robust standard errors clustered at institution level are reported in parenthesis.
30

Table 4: E�ects of SISU on Observable Characteristics of Students and Programs
(1) (2) (3) (4) (5) (6) (7)female age white disabled admissions social number
through quota support of seats
SISU -0.022*** 0.534*** -0.000 0.000 0.004 -0.000 1.694*(0.003) (0.076) (0.023) (0.001) (0.028) (0.016) (0.975)
Constant 0.530*** 20.922*** 0.287*** -0.010*** 0.126*** 0.121*** 56.784***(0.002) (0.062) (0.027) (0.003) (0.024) (0.013) (0.666)
Observations 1,539,008 1,539,008 1,539,008 1,539,008 1,539,008 1,539,008 35,420R-squared 0.174 0.158 0.265 0.011 0.198 0.423 0.932
Program FE X X X X X X XYear FE X X X X X X XState Trend X X X X X X X
Note: ***: signi�cant at 1% level; **: signi�cant at 5% level; *: signi�cant at 10% level. Thistable presents the e�ects of moving to SISU on students, programs and programs' characteristics,after controlling for year and program �xed e�ects, as well as state trends. The dependentvariables are indicator variable for female students, students' age, indicator variables for whiteand disabled students, students that receive social support, students that are bene�ted fromquota system, and total number of seats in each program, respectively. The independent variableSISU is an indicator for whether the program p partially or fully adopted the SISU system in theyear t. Robust standard errors clustered at institution level are reported in parenthesis. Sources:Higher Education Censuses and ENEM microdata.
31

Table 5: E�ect of SISU on ENEM Scores
(1) (2) (3) (4) (5) (6) (7)
SISU 0.157* 0.324*** 0.328*** 0.328*** 0.300*** 0.302*** 0.277***(0.087) (0.032) (0.032) (0.032) (0.031) (0.030) (0.029)
Constant 1.093*** 1.029*** 1.226*** 1.228*** 0.995*** 1.193*** 1.173***(0.080) (0.019) (0.027) (0.032) (0.021) (0.030) (0.029)
Observations 1,539,008 1,539,008 1,539,008 1,539,008 1,539,008 1,539,008 1,346,489R2 0.006 0.585 0.601 0.601 0.588 0.604 0.619
Individual Controls X X X XProgram Controls X X XProgram FE X X X X X XYear FE X X X X X XState Trend X X X
Sample 2010-2014 2010-2014 2010-2014 2010-2014 2010-2014 2010-2014 Enrolled
Note: ***: signi�cant at 1% level; **: signi�cant at 5% level; *: signi�cant at 10% level. Thistable reports the e�ects of adopting SISU on standardized ENEM score of �rst-year students.The sample consists of 1.539.008 students enrolled in federal and state public institutions over the2010-2014 period. Column (1) presents result for a simple OLS regression. Columns (2) displaysestimates after controlling for program and year �xed e�ects, while Column (3) includes a full setof observable student covariates (age, gender, race, disability, indicator for whether the studentis bene�ted from quota system and indicator for whether the student receives social support),and program and year �xed e�ects. Column (4) includes program covariates (number of seats).Column (5) only considers state trends, program and year �xed e�ects. Column (6) also includescontrols, while Column (7) excludes individuals whose enrollment status is on leave or cancellationfrom the sample. Robust standard errors clustered at institution level are reported in parenthesis.Sources: Higher Education Censuses and ENEM microdata.
32

Table 6: E�ect of SISU on Migration
(1) (2) (3) (4) (5) (6)PANEL A state state state state state state
ENEM ENEM ENEM ENEM ENEM ENEM
SISU 0.054*** 0.058*** 0.024*** 0.023*** 0.025*** 0.021***(0.013) (0.013) (0.005) (0.005) (0.005) (0.005)
Constant 0.068*** 0.153*** 0.074*** 0.066*** 0.054*** 0.051***(0.009) (0.016) (0.006) (0.007) (0.007) (0.006)
Observations 1,539,008 1,539,008 1,539,008 1,539,008 1,539,008 1,346,489R2 0.008 0.014 0.172 0.172 0.173 0.172
Individual Controls X X X XENEM Score X X X XProgram Controls X X XProgram FE X X X X XYear FE X X X X XState Trend X X
Sample 2010-2014 2010-2014 2010-2014 2010-2014 2010-2014 Active
(1) (2) (3) (4) (5) (6)PANEL B state municipality state municipality state municipality
ENEM ENEM birthplace birthplace birthplace birthplace
SISU 0.025*** 0.014** 0.029** 0.034** 0.031*** 0.033***(0.005) (0.005) (0.011) (0.016) (0.010) (0.016)
Constant 0.054*** 0.605*** 0.103*** 0.550*** 0.139*** 0.546***(0.007) (0.011) (0.015) (0.019) (0.011) (0.014)
Observations 1,539,008 1,539,008 1,049,651 1,049,651 1,517,614 1,517,614R2 0.173 0.242 0.144 0.275 0.130 0.254
Individual Controls X X X X X XENEM Score X X X XProgram Controls X X X X X XProgram FE X X X X X XYear FE X X X X X XState Trend X X X X X X
Sample 2010-2014 2010-2014 2010-2014 2010-2014 2010-2014 2010-2014
Note: ***: signi�cant at 1% level; **: signi�cant at 5% level; *: signi�cant at 10% level.Panel A reports the e�ects of adopting SISU on inter-state migration of �rst-year students.The dependent variable is an indicator for whether the state where the student resided beforeentering college is di�erent from the state where the student attends college. Column (1) presentsresult for a simple OLS regression. Columns (2) displays estimates after controlling for programand year �xed e�ects, while Column (3) includes a full set of observable student covariates(age, gender, race, disability, indicator variables for whether the student is bene�ted from quotasystem and receives social support), ENEM scores, and program and year �xed e�ects. Column(4) includes program covariates (number of seats). Column (5) also considers state trend, whileColumn (6) excludes individuals whose enrollment status is on leave or cancellation from thesample. Panel B reports the e�ects of adopting SISU on alternative measures for migration of�rst-year students. In Column (1), the dependent variable is the same as in Panel A. Column (2)presents the result for the dependent variable de�ned as indicator for whether the municipalitywhere the student resided before entering college di�ers from the municipality where the studentattends college. The dependent variable municipality birthplace (state birthplace) is an indicatorfor whether the municipality (state) of birth is di�erent from the municipality (state) where thestudent attends college. All columns consider a regression with students' characteristics, programcovariates (number of seats), program and year �xed e�ects, and state trends. Columns (1)-(4)additionally control for ENEM scores. Robust standard errors clustered at institution level arereported in parenthesis. Sources: Higher Education Censuses and ENEM microdata.
33

Table 7: E�ect of SISU on Enrollment Status
(1) (2) (3) (4) (5) (6)inactive inactive on leave cancellation on leave vacancy rate
SISU 0.043*** 0.054*** 0.008 0.046*** 0.011* 0.005(0.006) (0.008) (0.005) (0.007) (0.006) (0.018)
Constant 0.014 0.068*** -0.021 0.089*** -0.023 -0.119***(0.016) (0.023) (0.016) (0.016) (0.018) (0.036)
Observations 1,539,008 2,167,313 2,167,313 2,167,313 1,976,952 37,581R-squared 0.116 0.100 0.071 0.100 0.077 0.481
Individual Controls X X X X XENEM Score XProgram Controls X X X X X XProgram FE X X X X X XYear FE X X X X X XState Trend X X X X X X
Note: ***: signi�cant at 1% level; **: signi�cant at 5% level; *: signi�cant at 10%level. This table reports the e�ects of adopting SISU on di�erent dependent variables.In Columns (1) and (2), the dependent variable is an indicator variable for whetherstudent's enrollment status is on leave or cancellation. In Column (3), the dependentvariable is a dummy variable for whether student's enrollment status is on leave, whileColumn (4) refers to cancellation only. Column (5) excludes individuals that requestedcancellation and the dependent variable is de�ned as an indicator for whether student'senrollment status is on leave. Column (6) reports the e�ects of SISU on the 1 minus theratio between the number of enrolled students by the end of �rst year and the numberof seats. In all speci�cations, program covariates (number of seats), program and year�xed e�ects, and state trends are included. We include ENEM scores in Column (1). Wealso add students' characteristics in Columns (1) - (5). Robust standard errors clusteredat institution level are reported in parenthesis. Sources: Higher Education Censuses andENEM microdata.
34

Table8:
Heterogeneity
by2009
ENEM
Scores
(1)
(2)
(3)
(4)
(5)
(6)
(7)
(8)
(9)
(10)
(11)
(12)
Variables
score
state
inactive
score
state
inactive
score
state
inactive
score
state
inactive
SISU
0.284***
0.027***
0.048***
0.325***
0.020***
0.034***
0.332***
0.014**
0.046***
0.259***
0.035***
0.049***
(0.039)
(0.006)
(0.013)
(0.039)
(0.005)
(0.009)
(0.039)
(0.006)
(0.007)
(0.034)
(0.011)
(0.010)
Constant
0.188***
0.060***
0.054**
0.691***
0.075***
0.066***
1.234***
0.048***
0.048*
2.126***
0.035**
-0.088***
(0.023)
(0.007)
(0.022)
(0.049)
(0.010)
(0.017)
(0.039)
(0.008)
(0.026)
(0.040)
(0.015)
(0.015)
Observations
208,618
208,618
208,618
307,897
307,897
307,897
374,711
374,711
374,711
448,840
448,840
448,840
R2
0.222
0.128
0.127
0.218
0.164
0.122
0.241
0.170
0.107
0.494
0.180
0.094
IndividualControls
XX
XX
XX
XX
XX
XX
ENEM
Score
XX
XX
XX
XX
Program
Controls
XX
XX
XX
XX
XX
XX
Program
FE
XX
XX
XX
XX
XX
XX
YearFE
XX
XX
XX
XX
XX
XX
State
Trend
XX
XX
XX
XX
XX
XX
Sample
Bottom
Bottom
Bottom
2nd
2nd
2nd
3rd
3rd
3rd
Top
Top
Top
quartile
quartile
quartile
quartile
quartile
quartile
quartile
quartile
quartile
quartile
quartile
quartile
Note:***:signi�cantat1%
level;**:signi�cantat5%
level;*:signi�cantat
10%
level.
Wetest
whether
thee�ects
onscores,migration
anddrooutare
heterogeneousacross
di�erentlevelsof2009ENEM
scores.
Controllingforstudents'characteristics,number
ofseats,program
andyear�xed
e�ects,andstate
trends,werunregressionsseparatelyforfoursub-samplesofindividuals.
InColumns(2),(3),(5),(6),(8),
(9),(11)and(12),ENEM
scoresare
included
inthesetofcontrols.Byyear,thesampleisbrokeninto
quartiles
basedontheaverage2009
ENEM
scoresofstudents
enrolled
inallprogramslisted
inthe2010Census,withthebottom
quartilefacingthesm
allestaveragescoresand
thetopquartilefacingthelargestaveragescores.
Thedependentvariablesare
thesameasin
Tables4,5(Panel
A),and6(C
olumn(1)).
Robust
standard
errors
clustered
atinstitutionlevelare
reported
inparenthesis.Sources:Higher
EducationCensusesandENEM
microdata.
35
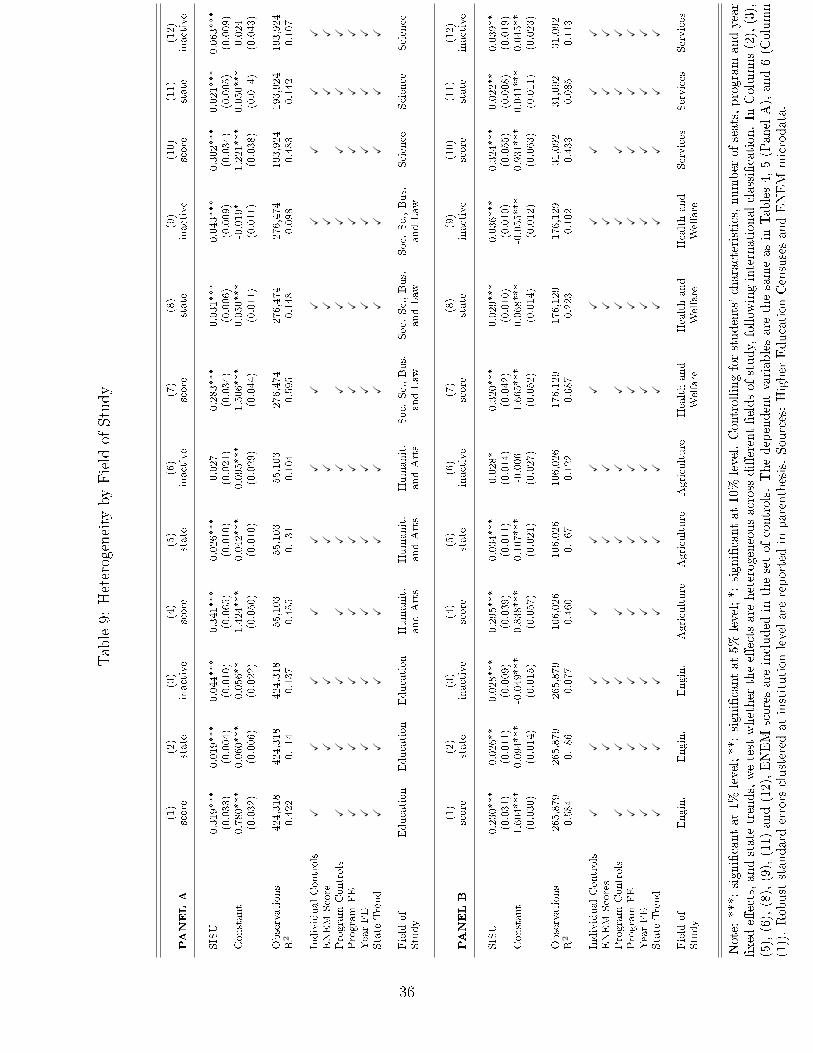
Table9:
Heterogeneity
byField
ofStudy
(1)
(2)
(3)
(4)
(5)
(6)
(7)
(8)
(9)
(10)
(11)
(12)
PANELA
score
state
inactive
score
state
inactive
score
state
inactive
score
state
inactive
SISU
0.319***
0.019***
0.044***
0.341***
0.026***
0.027
0.283***
0.031***
0.043***
0.302***
0.021***
0.063***
(0.033)
(0.004)
(0.010)
(0.065)
(0.010)
(0.021)
(0.034)
(0.006)
(0.009)
(0.034)
(0.005)
(0.009)
Constant
0.780***
0.060***
0.056**
1.424***
0.042***
0.095***
1.506***
0.050***
-0.019*
1.221***
0.050***
0.024
(0.032)
(0.006)
(0.022)
(0.050)
(0.010)
(0.029)
(0.044)
(0.011)
(0.011)
(0.038)
(0.014)
(0.043)
Observations
424,318
424,318
424,318
55,103
55,103
55,103
276,474
276,474
276,474
193,924
193,924
193,924
R2
0.422
0.114
0.137
0.455
0.131
0.104
0.595
0.148
0.098
0.483
0.142
0.107
IndividualControls
XX
XX
XX
XX
XX
XX
ENEM
Score
XX
XX
XX
XX
Program
Controls
XX
XX
XX
XX
XX
XX
Program
FE
XX
XX
XX
XX
XX
XX
YearFE
XX
XX
XX
XX
XX
XX
State
Trend
XX
XX
XX
XX
XX
XX
Field
of
Education
Education
Education
Humanit.
Humanit.
Humanit.
Soc.
Sc.,Bus.
Soc.
Sc.,Bus.
Soc.
Sc.,Bus.
Science
Science
Science
Study
andArts
andArts
andArts
andLaw
andLaw
andLaw
(1)
(2)
(3)
(4)
(5)
(6)
(7)
(8)
(9)
(10)
(11)
(12)
PANELB
score
state
inactive
score
state
inactive
score
state
inactive
score
state
inactive
SISU
0.230***
0.026**
0.028***
0.295***
0.034***
0.028*
0.320***
0.029***
0.036***
0.324***
0.022**
0.039**
(0.031)
(0.011)
(0.009)
(0.039)
(0.011)
(0.014)
(0.042)
(0.010)
(0.010)
(0.055)
(0.008)
(0.019)
Constant
1.604***
0.094***
-0.049***
0.838***
0.107***
-0.006
1.665***
0.068***
-0.055***
0.931***
0.041***
0.045**
(0.030)
(0.014)
(0.015)
(0.057)
(0.021)
(0.027)
(0.052)
(0.014)
(0.012)
(0.063)
(0.011)
(0.023)
Observations
265,879
265,879
265,879
106,026
106,026
106,026
176,129
176,129
176,129
31,092
31,092
31,092
R2
0.584
0.186
0.077
0.460
0.167
0.122
0.687
0.223
0.102
0.433
0.085
0.113
IndividualControls
XX
XX
XX
XX
XX
XX
ENEM
Scores
XX
XX
XX
XX
Program
Controls
XX
XX
XX
XX
XX
XX
Program
FE
XX
XX
XX
XX
XX
XX
YearFE
XX
XX
XX
XX
XX
XX
State
Trend
XX
XX
XX
XX
XX
XX
Field
of
Engin.
Engin.
Engin.
Agriculture
Agriculture
Agriculture
Healthand
Healthand
Healthand
Services
Services
Services
Study
Welfare
Welfare
Welfare
Note:***:signi�cantat1%
level;**:signi�cantat5%
level;*:signi�cantat10%
level.Controllingforstudents'characteristics,number
ofseats,program
andyear
�xed
e�ects,andstate
trends,wetest
whether
thee�ects
are
heterogeneousacross
di�erent�eldsofstudy,follow
inginternationalclassi�cation.In
Columns(2),(3),
(5),(6),(8),(9),(11)and(12),ENEM
scoresare
included
inthesetofcontrols.Thedependentvariablesare
thesameasin
Tables4,5(PanelA),and6(C
olumn
(1)).Robust
standard
errors
clustered
atinstitutionlevelare
reported
inparenthesis.Sources:Higher
EducationCensusesandENEM
microdata.
36

7 APPENDIX
Appendix I - SISU Application and Admission
Applicants have to take the ENEM exam to register in the SISU system. Online reg-
istration for ENEM typically takes place in May, and the registration fee costs 68 reais in
2016 (approximately USD 20). Payment exemption is automatically given to all students
graduating from public high schools. It is also allowed in two other cases: for students who
have had their entire high school education either in public high schools or in private high
schools under full scholarship and have per capita monthly family income lower than 1.5
minimum wage; and for students whose families have per capita monthly income lower than
half of the minimum wage or total family income lower than 3 minimum wages.
The new ENEM exam is a two-day test and consists of a written essay and 180 multiple-
choice questions, divided into four knowledge areas: Math, Natural Science, Human Science,
and Language and Code. In comparison to the older version (the subjects of the older ver-
sion were: Biology, Chemistry, Geography, History, Math, Physics, and Portuguese), the
new exam comprises a wider range of subjects: Human Science (Geography, History, Philos-
ophy, and Sociology), Language and Codes (Foreign Language, Literature, and Portuguese),
Math (Geometry and Math), and Natural Science (Biology, Chemistry, and Physics). All
applicants take ENEM on the same weekend, typically in late October or early November.
They receive their ENEM scores in January. Few days later, the SISU online platform
opens. Applicants subscribe to the system by submitting their ENEM subscription number.
There is no monetary cost to subscribe to SISU. All applicants have four (or �ve, depending
on the rules previously set by the Ministry of Education) days to submit a list of up to two
options of career-institution (program) pair and decide whether they will compete for seats
reserved for quota system.
Students' scores are calculated according to di�erent weights given to each of �ve knowl-
edge areas (Math, Natural Science, Languages and Codes, Human Science, and Writing
Essay). Each institution is free to determine a combination of weights for each program.
Thus, students' scores might widely vary across these career-institution combinations.
During the registration period, when the system is open, the cuto� scores for each pro-
gram are calculated at the end of each day, and this information is provided to all subscribers.
The partial classi�cation for each subscriber is also privately disclosed. Students can change
37
their options over the registration period as many times as they wish, but only the last
con�rmed choice is valid.
Figure 2 illustrates how an applicant can indicate up to two choices of career and in-
stitution combinations, and specify whether he prefers to compete for seats reserved for
a�rmative action policies. It is possible to notice di�erent composite scores given to the
same applicant because he chooses di�erent careers from the same institution. Figure 3
presents the partial classi�cation and the cuto� score for each chosen option. Figure 4 in-
dicates that the system allows an applicant to modify his assignments as many times as he
wishes until the deadline. Figure 5 shows that an applicant can search for other majors and
institutions, and also check the last updated cuto�.
When the registration period ends, students are assigned to programs through a variant
of deferred acceptance algorithm. The algorithm works in the following way: each candidate
proposes to his �rst choice. After ranking the applicants by their composite score, each
program rejects the lowest-ranking students in excess of the pre-speci�ed number of available
spots, and the remaining applicants are tentatively admitted. The applicants rejected in their
�rst alternative apply to the next most preferred program from their list. Thus, each program
considers these new applicants and the tentatively admitted applicants, and assigns its spots
to these candidates, following a priority order. The lowest-ranking students in excess of the
number of available seats are rejected.
At least one call is announced. The number of calls is previously set up for each edition;
for example, in January of 2015, SISU had a single call. During the call period, the applicants
who ranked and quali�ed for their assigned option can enroll in the program. Regardless of
having enrolled in his �rst option, if the applicant is quali�ed to his top choice, he cannot
participate in the next call. Also, regardless of having enrolled in his second alternative, the
applicant still runs to his �rst in the next call when he quali�es for his second choice, but
not for his �rst choice. After regular calls, students who did not qualify for their options
should inform to the system if they wish to be included on a wait list. In this case, only
the �rst option is considered. Thereafter, SISU provides to institutions a wait list for each
program and the progress is similar to Vestibular. Any remaining spot is �lled based on a
wait list, following the ranking of applicants.
38

Figure 2: An Example of Choices from the SISU System
Figure 3: An Example of Partial Classi�cation and Cuto� Scores
39

Figure 4: An Example of an Applicant Modifying his Options
40

Figure 5: An Example of an Applicant Searching for Other Options and Checking the LastUpdated Cuto�
41
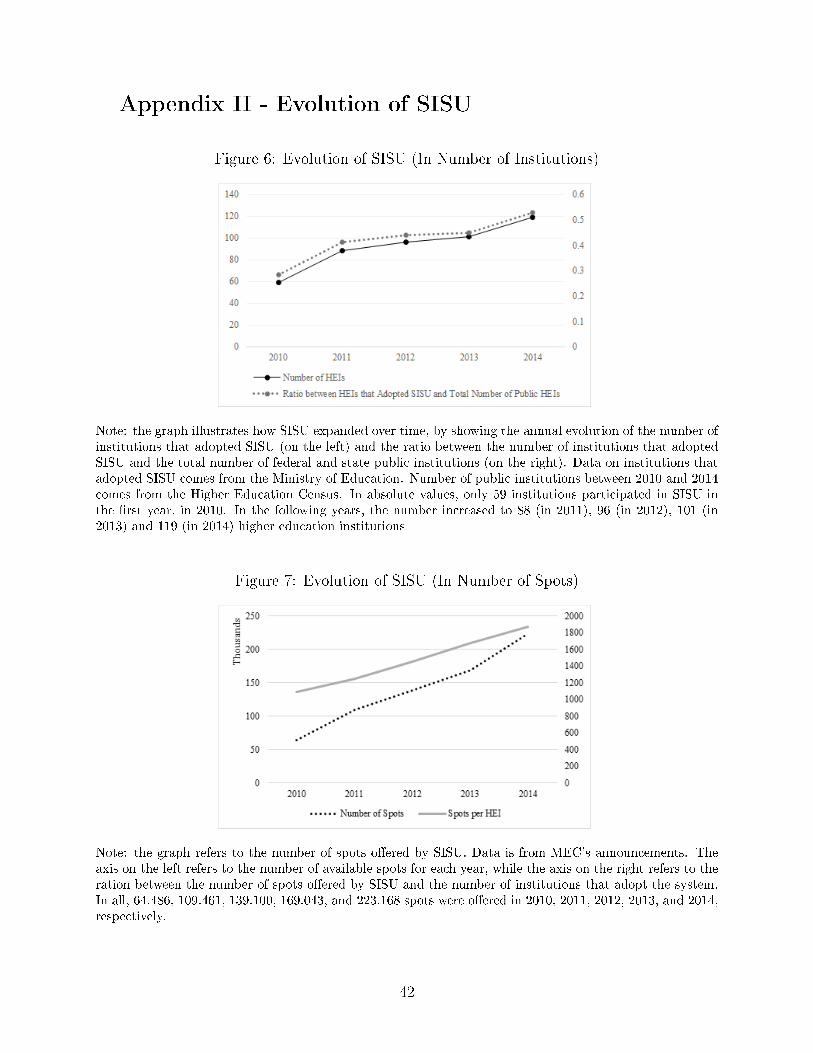
Appendix II - Evolution of SISU
Figure 6: Evolution of SISU (In Number of Institutions)
Note: the graph illustrates how SISU expanded over time, by showing the annual evolution of the number ofinstitutions that adopted SISU (on the left) and the ratio between the number of institutions that adoptedSISU and the total number of federal and state public institutions (on the right). Data on institutions thatadopted SISU comes from the Ministry of Education. Number of public institutions between 2010 and 2014comes from the Higher Education Census. In absolute values, only 59 institutions participated in SISU inthe �rst year, in 2010. In the following years, the number increased to 88 (in 2011), 96 (in 2012), 101 (in2013) and 119 (in 2014) higher education institutions
Figure 7: Evolution of SISU (In Number of Spots)
Note: the graph refers to the number of spots o�ered by SISU. Data is from MEC's announcements. Theaxis on the left refers to the number of available spots for each year, while the axis on the right refers to theration between the number of spots o�ered by SISU and the number of institutions that adopt the system.In all, 64.486, 109.461, 139.100, 169.043, and 223.168 spots were o�ered in 2010, 2011, 2012, 2013, and 2014,respectively.
42

Appendix III - Data Appendix
This appendix contains a detailed description of the data used in this paper.
7.1 Higher Education Census
7.1.1 General Information:
The Higher Education Census is annually carried out by the National Institution for
Educational Studies and Research (INEP) since 1995. Microdata at the student level is only
available from 2009 onwards. Information on each academic year t (which corresponds to
a calendar year) is collected in year t+1.34 The Census contains detailed information on
all higher institutions, programs and students enrolled at any time over year t. Reporting
is compulsory for all institutions by law. Reporting is also a requirement for many initia-
tives sponsored by the Ministry of Education, such as research grants and fellowships, and,
most importantly, for being issued a credential that allows institutions to operate in the
educational market.
Unique identi�cation numbers � the Brazilian Taxpayer Registry (Cadastro de Pessoa
Física, or CPF ) � are not reported in 2009. Thus, the 2009 Census cannot be linked to the
2008 ENEM microdata through CPF. In addition, INEP sta� discouraged us to link both
datasets because the 2009 Census was the �rst in which student-level data were collected.
Therefore, our sample analysis is restricted to the 2010-2014 Higher Education Censuses.
7.1.2 The Brazilian Higher Education Structure:
The Brazilian higher education structure is divided into six administrative categories:
special35, for-pro�t private, non-pro�t private, federal public, state public, and municipal
public institutions. Table 10 shows how institutions are distributed by administrative cate-
gories, while Table 11 depicts the total number of students in each category over the 2010-
2014 period.
34Data is collected online, through a platform called Censup, and reported by each higher educationinstitution. The system opens from February to May. Data checks are performed by INEP when the systemcloses. Inconsistencies are communicated to institutions, which in turn submit a �nal round of edits.
35Special institution is a category created in 2012 and refers to institutions created by municipal orstate law before the enactment of the Federal Constitution in 1998. Those institutions, however, are notpredominantly funded with public resources and are not tuition-free.
43

Table 10: Total Number of Institutions by Administrative Categories
Category 2010 2011 2012 2013 2014
Federal Public 99 103 103 106 107
State Public 108 110 116 119 118
Municipal Public 71 71 65 54 49
For-Pro�t Private 951 975 989 991 998
Non-Pro�t Private 1149 1106 1123 1099 1072
Special - - 20 22 24
Total 2378 2365 2416 2391 2368
Source: 2010-2014 Higher Education Censuses.
Table 11: Total Number of Students by Administrative Categories
Category 2010 2011 2012 2013 2014 Total
Federal Public 1.159.627 1.249.778 1.352.632 1.422.513 1.504.383 6.688.933
State Public 698.167 730.024 745.846 735.991 743.425 3.653.453
Municipal Public 128.191 152.405 75.758 72.081 62.414 490.849
For-Pro�t Private 2.697.869 3.026.210 3.569.232 3.854.182 4.514.593 17.662.086
Non-Pro�t Private 3.653.365 3.803.307 3.663.894 3.676.742 3.824.023 18.621.331
Special - - 158.121 167.780 145.097 470.998
Total 8.337.219 8.961.724 9.565.483 9.929.289 10.793.935 47.587.650
Source: 2010-2014 Higher Education Censuses.
7.1.3 Sample Restriction:
We make several restrictions to the sample. First, the sample is restricted to �rst-year
students, since we are interested in short-term e�ects. Second-year and more advanced
students that appear in a given institution do not include those who have dropped out
in their �rst year (and therefore are no longer linked to this institution in their second
year), but include transfers from other institutions. Eliminating �rst-year students reduces
the sample from 47.587.650 to 13.181.708 observations (more precisely, 2.196.822 in 2010,
2.359.409 in 2011, 2.756.773 in 2012, 2.749.803 in 2013, and 3.118.901 in 2014). Second, we
exclude municipal public, non-pro�t private, for-pro�t private, and special institutions from
the sample because only public and tuition-free can participate in the SISU platform. Thus,
data from federal and state public institutions are maintained. The sample shrinks from
13.181.708 to 2.473.382 observations (among these observations, 1.619.449 individuals are
44

found in federal public institutions (302.380 in 2010, 308.537 in 2011, 334.246 in 2012, 325.294
in 2013, and 348.992 in 2014), while 733.852 students are part of state public institutions
(141.413 in 2010, 146.170 in 2011, 152.724 in 2012, 142.962 in 2013, and 150.583 in 2014)).
Third, we exclude online education programs, leading to a sample of 2.167.313 students
(among these observations, 1.464.531 individuals are found in federal public institutions
(269.237 in 2010, 282.040 in 2011, 300.487 in 2012, 299.230 in 2013, and 313.537 in 2014),
while 702.782 students are part of state public institutions (134.932 in 2010, 139.111 in 2011,
144.932 in 2012, 139.744 in 2013, and 144.063 in 2014)). We refer this sample as the Census
baseline sample.
7.1.4 Variable Construction:
Student-level information include (the variables are represented in bold):
Gender, Age and Disability. These variables are directly constructed from the Census
(the original names are: IN_SEXO_ALUNO, NU_IDADE_ALUNO, and
IN_ALUNO_DEFICIENCIA) to inform whether the is female, student's age, and whether
the student has any type of disability, respectively.
Socioeconomic Status. A�rmative action policies are directed to students from low in-
come families, from certain ethnic groups, from public schools, and disabled students. We
identify students bene�ting from the quota policy if they occupy seats reserved for low
income students (the original variable is IN_RESERVA_RENDA_FAMILIAR), black, mu-
lattos, or Indian students (IN_RESERVA_ETNICO), disabled students
(IN_RESERVA_DEFICIENCIA), and/or students who have attended public schools
(IN_RESERVA_ENSINO_PUBLICO). In addition, we build a measure of whether the
student receives any type of social support (e.g., housing support, food support, material
support, etc.) from the institution (IN_APOIO_SOCIAL). We also create an indicator
variable for whether the student is white (CO_COR_RACA_ALUNO) to summarize in-
formation on race.
Enrollment Status. Students' enrollment status in a current year (CO_SITUACAO)
falls into one of the six categories: currently enrolled (cursando), leave of absence (matrícula
trancada), withdrawal/cancellation (desvinculado do curso), transferred to a new degree in
the same institution (transferido para outro curso da mesma IES ), graduated (formado), or
45

deceased (falecido). To capture changes in enrollment status in the �rst year of college after
initial matriculation, we create an indicator variable of whether the student requests leave
of absence or cancellation. This variable does not consider transfer to a new degree in the
same institution because transfer rules are very strict for �rst-year students. Also, graduated
students are not expected in our sample of �rst-year students. Students whose enrollment
status either leave of absence or withdrawal constitute the group of inactive students.
Admission Procedure. The Census provides information on entrance procedures for each
student: admission through ENEM (the original variable is IN_ING_ENEM), admission
through Vestibular (the original variable is IN_ING_VESTIBULAR) or other admission
criteria.
Migration. We describe how we construct the main measure of mobility later. We
now explain how we construct an alternative measure for migration to check the robustness
of our results: an indicator variable of whether the student's birthplace is di�erent from
her current location. Information on students' current location come from program-level
data, whereas information on students' birthplace are recovered from student-level data.
We then de�ne the interstate (or intermunicipality) mobility as an indicator variable of
whether the state (or municipality) of birth is di�erent from the state (or municipality) where
the student attended college (namely, municipality birthplace (or state birthplace)).
Because students' birthplace is directly informed by institutions, many observations present
missing information. Nearly 70% of students (more precisely, 1.517.614 out of 2.167.313
observations) have information on place of birth.
Regarding the program (institution) covariates, the following variables are constructed:
Number of Spots. This variable is directly reported by institutions and is available at
the program-level data. When no spots are reported (probably by mistake), we consider the
total number of �rst-year students as a proxy for the number of spots.
Number of Programs. The total number of programs for each institution is constructed
from the program-level data.
Number of Instructors. The total number of instructors for each institution is directly
built from the faculty-level data. We only consider active, as well partial or full-time in-
structors.
46

We explain how we construct the minor variables from Table 2:
Location. Institution-level data provide information on where the institution is located.
We create an indicator variable (located in state capital cities) of whether an institution
is based on a state capital city (the original variable is IN_CAPITAL). We also construct
indicator variables for each region where an institution is located. Brazil is divided into
�ve regions, thus �ve indicator variables are created (located in Central-West region,
located in North region, located in Northeast region, located in Southeast region,
and located in South region).
Size. We include measures for institutions' size. The total number of technical-administrative
employees (number of employess) is directly collected from the Census (the original vari-
able is QT_TEC_TOTAL). The total number of programs, number of students and
number of teachers are constructed from the program-, student- and teacher-level data,
respectively.
Other characteristics. Creating an indicator variable for federal institutions is straight-
forward (the original variable is CO_CATEGORIA_ADMINISTRATIVA). We further con-
struct an indicator variable (university institutions) of whether an institution is a univer-
sity organization (CO_ORGANIZACAO_ACADEMICA), as well as an indicator variable
(institutions have a lab) of whether an institution is equipped with a lab
(IN_UTILIZA_LABORATORIO).
7.2 ENEM Microdata
The ENEM microdata is also annually gathered by INEP. Reporting the Brazilian Tax-
payer Registry (CPF) is mandatory to register and take the ENEM exam. In this project, we
use con�dential data to link ENEM microdata to Higher Education Census through CPF,
which is also compulsorily reported in the Census datasets. To our knowledge, we are the
�rst researchers have access to these con�dential sources.
Firstly, we standardize ENEM scores, which are the average of �ve areas of knowledge
(Natural Science, Math, Human Science, Languages and Codes, and Writing Essay) for all
ENEM test-takers by year.
Using CPF as the unique student identi�cation number, we then link �ve cohorts of �rst-
year students from the Census to the ENEM microdata. That is, the 2010 Census is matched
47

to the 2009 ENEM data (58.82% of the �rst-year sample is matched), the 2011 Census to
the 2010 ENEM data (69.74%), the 2012 Census to the 2011 ENEM data (71.81%), the
2013 Census to the 2012 ENEM data (76.25%), the 2014 Census to the 2013 ENEM data
(77.14%). Overall, we are able to combine approximately 71% of college �rst-year to ENEM
datasets (1.539.008 out of 2.167.313 students). We refer this sample as the Census-ENEM
matched sample.
We notice a relatively lower matching for the 2010 Census. It can be explained by the
episode of leaked questions, which led to the postponement of the exam. Instead of taking
place in November of 2010, the 2009 ENEM exam was rescheduled to be held on December
of 2010. Thus, the absence rate from this edition was higher than the average of previous
years.
Our main variable for mobility is constructed from this Census-ENEM matched sample.
We de�ne the interstate (or intermunicipality) mobility as an indicator variable of whether
the state (or municipality) where the student resided when he took the ENEM exam is
di�erent from the state (or municipality) where the student attended college (namely, mu-
nicipality (or state)).
Our minor data source is a list of programs and institutions available in the SISU system
since its inception. Years of adoption are also included in the list, which was provided by the
Ministry of Education. Although the system opens twice a year, the Census data is annual.
To deal with this inconsistency, we group the SISU adoption by year. We coded all programs
and institutions to combine them with the Census.
48

Appendix
IV-AdditionalTables
Table12:E�ectof
SISUon
Other
ObservableCharacteristicsof
Students
(1)
(2)
(3)
(4)
(5)
(6)
(7)
(8)
(9)
(10)
(11)
mother's
father's
mother's
father's
parents'
minimum
noturban
elem
.sch.
highsch.
public
public
educHS
educHS
educcollege
educcollege
educcollege
wage
more
9yrs
more
4yrs
elem
sch
highsch
SISU
0.003
0.001
-0.004
-0.004
-0.004
-0.008*
-0.007***
-0.002
-0.006
0.005
0.014
(0.007)
(0.007)
(0.007)
(0.006)
(0.006)
(0.004)
(0.002)
(0.003)
(0.004)
(0.010)
(0.013)
Constant
0.024***
0.154***
0.579***
0.453***
0.342***
0.158***
0.139***
0.036***
0.226***
0.337***
0.450***
(0.008)
(0.009)
(0.009)
(0.011)
(0.010)
(0.009)
(0.005)
(0.007)
(0.009)
(0.014)
(0.016)
Observations
1,518,263
1,518,263
1,518,263
1,518,263
1,518,263
1,518,263
1,518,263
1,518,263
1,518,263
1,518,263
1,518,263
R-squared
0.095
0.133
0.159
0.189
0.150
0.193
0.088
0.086
0.058
0.338
0.359
IndividualControls
XX
XX
XX
XX
XX
XENEM
Score
XX
XX
XX
XX
XX
XProgram
Controls
XX
XX
XX
XX
XX
XProgram
FE
XX
XX
XX
XX
XX
XYearFE
XX
XX
XX
XX
XX
XState
Trend
XX
XX
XX
XX
XX
X
Note:***:signi�cantat1%
level;**:signi�cantat5%
level;*:signi�cantat10%
level.
Weestimate
Equation(1)foradditionalstudents'
characteristics.Thedependentvariablesare:mother'seducHS
isanindicatorvariable
ofwhether
mother'seducationisless
orequalto
high
school;father'seducHSisanindicatorvariableofwhether
father'seducationisless
orequal
tohighschool;mother'seduccollegeisanindicator
variable
ofwhether
mother'seducationiscollege;
father'seduccollegeisanindicatorvariable
forwhether
father'seducationiscollege;
parents'
educcollegeisanindicatorvariable
forwhether
both
parents
havecollegeeducation;minim
um
wageisanindicatorforwhether
familyincome
isless
thanminimum
wage;
noturbanisanindicatorforwhether
thestudentdoes
notlive
inanurbanarea;elem.sch.more
than9yrs
isan
indicatorforwhether
thestudenttookmore
than9years
to�nishelem
entary
andmiddle
school;highsch.more
than4yrs
isanindicatorfor
whether
thestudenttookmore
than4years
to�nishhighschool;publicelem
schisanindicatorforwhether
thestudenttookhiselem
entary
and
middle
educationonly
inapublicschool;publichighschisanindicatorforwhether
thestudent�nished
highschoolin
apublicschool.
Robust
standard
errors
clustered
atinstitutionlevelare
reported
inparenthesis.Sources:Higher
EducationCensusesandENEM
microdata.
49