Embed Size (px)
Citation preview
Physics of the Earth and Planetary Interiors 150 (2005) 107–122
Central Baffin electromagnetic experiment (CBEX):Mapping the North American Central Plains (NACP)
conductivity anomaly in the Canadian arctic
Shane Evansa,1, Alan G. Jonesb,∗, Jessica Sprattc,2, John Katsubed
a Department of Geological Sciences and Geological Engineering, Queen’s University,Kingston, Ont., Canada K7L 3N6
b Geological Survey of Canada, Room 218, 615 Booth St., Ottawa, Ont., Canada K1A 0E9c Department of Earth Sciences, Syracuse University, Syracuse, New York 13244, USA
d Geological Survey of Canada, 601 Booth St., Ottawa, Ont., Canada K1A 0E
Received 30 January 2003; received in revised form 6 January 2004; accepted 16 August 2004
Abstract
Over the summers of 2001 and 2002, a 45 station, 500-km-long regional magnetotelluric (MT) profile was acquired oncentral Baffin Island in the eastern Canadian arctic. This Central Baffin electromagnetic experiment (CBEX) profile traversesthe northern margin of the Paleoproterozoic Trans-Hudson Orogen (THO). In its southern segment, within the juvenile rocks
e extendsometry ofshow thatcan beenhancede highlycontrastplexes of
tle beneath
662 1333;
of the orogen, the profile lies on Paleoproterozoic meta-sedimentary strata known as the Piling Group, and the profilnorthwards onto the Archean Rae craton. The primary goal of the experiment was to determine the subsurface gemajor geological boundaries and to define regional electrical structures. Field observations and laboratory analysesone particular horizon within the Piling Group, the sulphidic–graphitic Astarte River formation, is highly conductive andmapped and used as structural proxy for the base of the Piling Group. The laboratory results imply that the source of theconductivity in the Astarte River formation is the high content of interconnected graphite, and that the host rocks aranisotropic due to bedding. Mapping this formation in depth images the base of the Piling Group basin well. There is highin electrical conductivity between the Piling Group meta-sedimentary rocks and the Archean granites and gneissic comthe Rae craton to the north. The lower crust of the Rae craton in this area is moderately conductive (some 100 s� m), in contrastto Rae lower crust observed elsewhere in Canada, and this observation is not readily explained. The lithospheric man
∗ Corresponding author. Present address: Dublin Institute for Advanced Studies, 5 Merrion Square, Dublin 2, Ireland. Tel.: +353 1fax: +353 1 662 1477.
E-mail addresses:[email protected] (S. Evans), [email protected] (A.G. Jones), [email protected] (J. Spratt),[email protected] (J. Katsube).
1 Present address: De Beers, Centurion, South Africa.2 Present address: Dublin Institute for Advanced Studies, 5 Merrion Square, Dublin 2, Ireland.
0031-9201/$ – see front matter © 2004 Published by Elsevier B.V.doi:10.1016/j.pepi.2004.08.032
108 S. Evans et al. / Physics of the Earth and Planetary Interiors 150 (2005) 107–122
the profile exhibits a strong north-to-south gradient in decreasing resistivity, suggesting resistive Archean mantle (>3000� m)subducted beneath moderately resistive Proterozoic mantle (300� m).© 2004 Published by Elsevier B.V.
Keywords: Trans-Hudson orogen; Paleoproterozoic orogeny; North American Central Plains conductivity anomaly (NACP); Electromagneticinduction; Magnetotelluric technique; Petrophysical conductivity measurements
1. Introduction
During the summers of 2001 and 2002, magne-totelluric (MT) measurements were made on BaffinIsland in northern Canada as part of the GeologicalSurvey of Canada’s multi-disciplinary Central Baf-fin project to study the northern margin of the north-eastern segment of the Trans-Hudson Orogen (THO,Corrigan et al., 2001; Scott et al., 2002, 2003). Theprimary goal of this Central Baffin electromagneticexperiment (CBEX) was to determine the subsur-
face geometry of major crustal and mantle bound-aries, particularly between rocks of the Archean RaeCraton to the north and Paleoproterozoic continen-tal margin units, the Piling Group, to the south(Jones et al., 2002b; Evans, 2003; Evans et al.,2003). Within the Piling Group lies a black shaleand sulphide-facies iron-formation unit—the AstarteRiver formation—and, given its likely high electri-cal conductivity, this formation was a particular targetfor electromagnetic imaging of crustal-scale structuralgeometries.
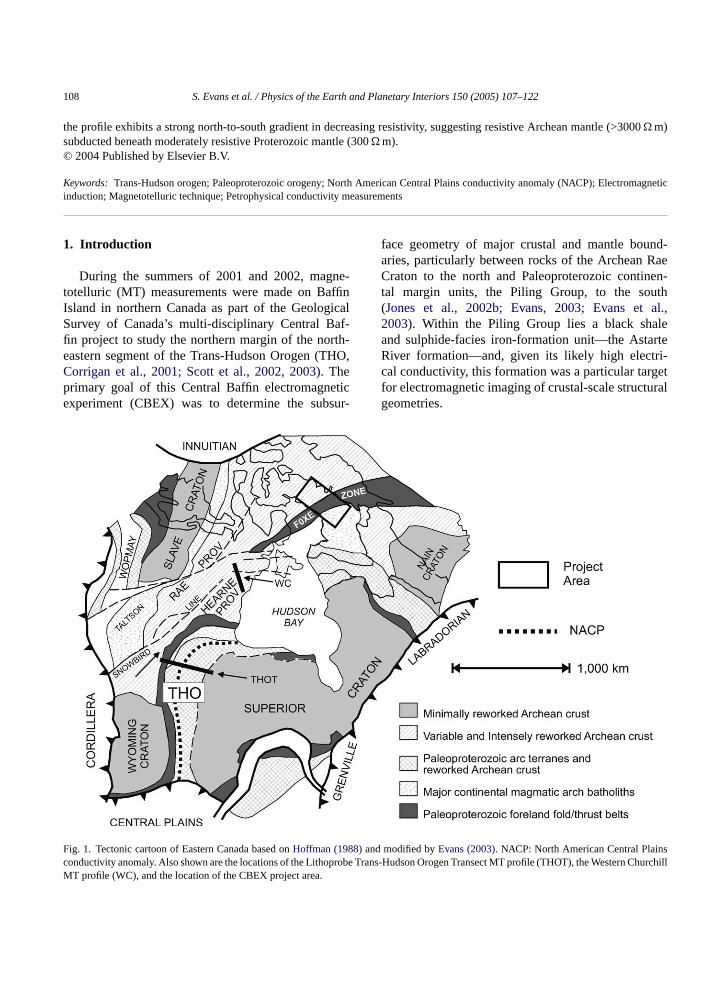
F 88)and nsc robe T ChurchillM
ig. 1. Tectonic cartoon of Eastern Canada based onHoffman (19onductivity anomaly. Also shown are the locations of the LithopT profile (WC), and the location of the CBEX project area.
modified byEvans (2003). NACP: North American Central Plairans-Hudson Orogen Transect MT profile (THOT), the Western
S. Evans et al. / Physics of the Earth and Planetary Interiors 150 (2005) 107–122 109
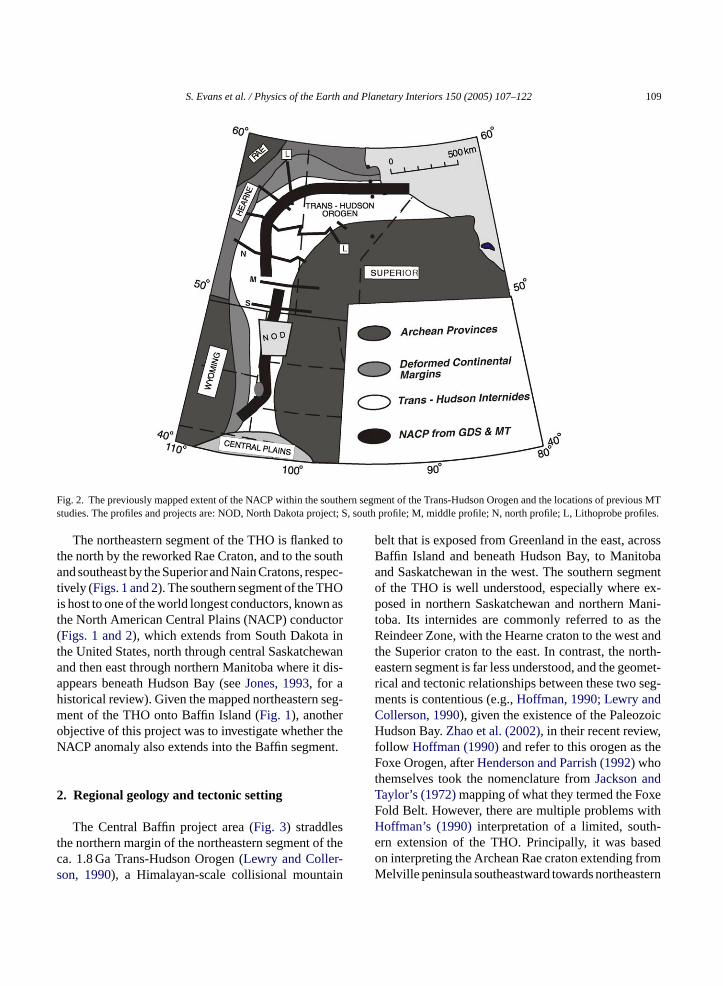
Fig. 2. The previously mapped extent of the NACP within the southern segment of the Trans-Hudson Orogen and the locations of previous MTstudies. The profiles and projects are: NOD, North Dakota project; S, south profile; M, middle profile; N, north profile; L, Lithoprobe profiles.
The northeastern segment of the THO is flanked tothe north by the reworked Rae Craton, and to the southand southeast by the Superior and Nain Cratons, respec-tively (Figs. 1 and 2). The southern segment of the THOis host to one of the world longest conductors, known asthe North American Central Plains (NACP) conductor(Figs. 1 and 2), which extends from South Dakota inthe United States, north through central Saskatchewanand then east through northern Manitoba where it dis-appears beneath Hudson Bay (seeJones, 1993, for ahistorical review). Given the mapped northeastern seg-ment of the THO onto Baffin Island (Fig. 1), anotherobjective of this project was to investigate whether theNACP anomaly also extends into the Baffin segment.
2. Regional geology and tectonic setting
The Central Baffin project area (Fig. 3) straddlesthe northern margin of the northeastern segment of theca. 1.8 Ga Trans-Hudson Orogen (Lewry and Coller-son, 1990), a Himalayan-scale collisional mountain
belt that is exposed from Greenland in the east, acrossBaffin Island and beneath Hudson Bay, to Manitobaand Saskatchewan in the west. The southern segmentof the THO is well understood, especially where ex-posed in northern Saskatchewan and northern Mani-toba. Its internides are commonly referred to as theReindeer Zone, with the Hearne craton to the west andthe Superior craton to the east. In contrast, the north-eastern segment is far less understood, and the geomet-rical and tectonic relationships between these two seg-ments is contentious (e.g.,Hoffman, 1990; Lewry andCollerson, 1990), given the existence of the PaleozoicHudson Bay.Zhao et al. (2002), in their recent review,follow Hoffman (1990)and refer to this orogen as theFoxe Orogen, afterHenderson and Parrish (1992)whothemselves took the nomenclature fromJackson andTaylor’s (1972)mapping of what they termed the FoxeFold Belt. However, there are multiple problems withHoffman’s (1990)interpretation of a limited, south-ern extension of the THO. Principally, it was basedon interpreting the Archean Rae craton extending fromMelville peninsula southeastward towards northeastern
110 S. Evans et al. / Physics of the Earth and Planetary Interiors 150 (2005) 107–122
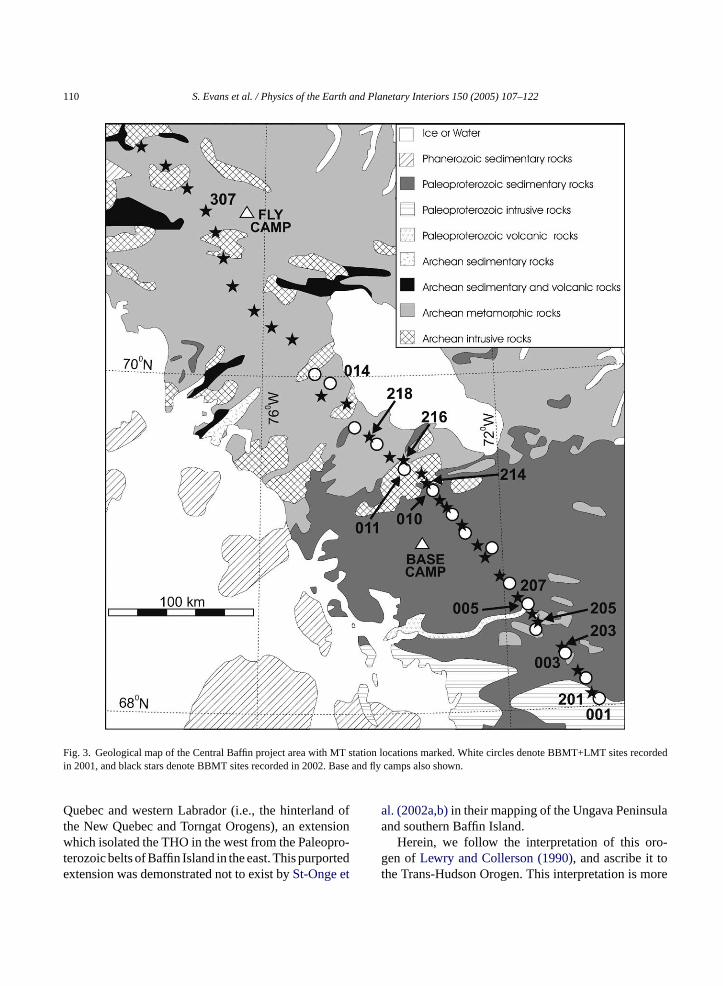
Fig. 3. Geological map of the Central Baffin project area with MT station locations marked. White circles denote BBMT+LMT sites recordedin 2001, and black stars denote BBMT sites recorded in 2002. Base and fly camps also shown.
Quebec and western Labrador (i.e., the hinterland ofthe New Quebec and Torngat Orogens), an extensionwhich isolated the THO in the west from the Paleopro-terozoic belts of Baffin Island in the east. This purportedextension was demonstrated not to exist bySt-Onge et
al. (2002a,b)in their mapping of the Ungava Peninsulaand southern Baffin Island.
Herein, we follow the interpretation of this oro-gen ofLewry and Collerson (1990), and ascribe it tothe Trans-Hudson Orogen. This interpretation is more

S. Evans et al. / Physics of the Earth and Planetary Interiors 150 (2005) 107–122 111
consistent with the thermo-metamorphic data that havebeen acquired, principally since 1990, on Baffin Island(D. Corrigan, pers. comm., 2003; M. St-Onge, pers.comm., 2003).
The northern part of the project area is underlainby various orthogneisses, metamorphosed sedimen-tary and volcanic rocks of the Mary River Group,and younger felsic plutonic rocks, all of Archeanage and ascribed to the Rae craton (Jackson, 1969;Bethune and Scammell, 1997; Corrigan et al., 2001;Scott et al., 2002, 2003). The central part of the area,known as the Foxe Fold Belt (marked as Foxe Zone inFig. 1), includes highly remobilized Archean basementand inboard miogeoclinal foredeep Paleoproterozoicsupracrustal rocks incorporating siliciclastic, carbona-ceous, and mafic volcanic rocks of the Piling Group(Morgan et al., 1975, 1976; Morgan, 1983; Hendersonet al., 1988, 1989; Henderson and Henderson, 1994;St-Onge et al., 2001, 2002a,b). The southern segmentof the project area is dominated by a suite of felsicplutonic rocks that ranges from rare tonalite, to gran-odiorite, monzogranite, and monzogranite grading intosyenogranite and has been interpreted as the northernmargin of the Cumberland batholith (Jackson and Tay-lor, 1972; Corrigan et al., 2001).
The Cumberland batholith, first mapped byJacksonand Taylor (1972), is a ca. 1.86–1.85 Ga (Scott, 1997)plutonic intrusion that covers much of south-centralBaffin Island. The batholith is interpreted to have beenintruded during the 1.86–1.82 Ga interval when theree tionza
in-e wardt ite,t -n d-i nti nicr kesa nso d asp an-i isi ad-i ns-H ugh
the emplacement of the plutonic rocks (St-Onge et al.,2003).
3. The North American Central Plains (NACP)conductivity anomaly
The North American Central Plains (NACP) con-ductivity anomaly was first discovered, completelyserendipitously, by Ian Gough and colleagues in themid-1960s from the anomalous response at one sitein western Nebraska in the corner of a magnetome-ter array across the western United States (Reitzel etal., 1970). The anomaly was further mapped in themid-West of the U.S. and into Canada in the late-1960s and early 1970s byCamfield et al. (1970)andAlabi et al. (1975). Camfield et al. (1970)initially sug-gested that the high conductivity, and the linear form,could be due to a graphitic schist body in the base-ment, noting that high conductivities had been ob-served in graphite bodies in western South Dakota(Mathisrud and Sumner, 1967). In a later highly per-ceptive but sadly little appreciated paper,Camfield andGough (1977)proposed that the NACP anomaly wasa marker that traced a Proterozoic plate boundary, of1800 km length extent, lying beneath the thick sedi-mentary strata of the Williston Basin and which sep-arated the Superior from the Wyoming cratons. Theirsuggestion ran counter to prevailing opinion at that time(Peterman, 1979; and references inDutch, 1983), buth ents usa msa n-t e tog ldedb
CPw edt dingp ta dS dC ta aryr )t n theH phic
xisted at least two distinct north-dipping subducones at the southern end of the orogen (Theriault etl., 2001).
From the centre of the Piling Group belt, mral assemblages in pelitic rocks progress south
oward the plutonic rocks from biotite–muscovo biotite–muscovite–cordierite± andalusite, sillimaite–K-feldspar± melt, and ultimately garnet–cor
erite–K-feldspar± melt. The volume of melt presen individual outcrops increases toward the plutoocks, from increasingly large pods through to dynd sills. In proximity to the batholith, accumulatiof locally generated melt material can be mappelutons of distinctive white, garnetiferous monzogr
te. This regional thermal metamorphic zonationnterpreted as the result of tectonic thickening long to relaxation of crustal isotherms during Traudson orogeny, in addition to heat advection thro
as been since proven correct primarily from basemamples in drill core (Peterman, 1981; Van Schmnd Bickford, 1981; Klasner and King, 1986; Sind Peterman, 1986). They reiterated their earlier i
erpretation that the NACP structure was likely duraphitic sheets in highly metamorphosed and foasement rocks.
The northern extension and continuity of the NAithin the southern segment of the THO was confirm
hrough the 1980s using Geomagnetic Deep Sounrofiles byHanda and Camfield (1984)andGupta el. (1985), and using MT by Pan Canadian (Jones anavage, 1986), Maidens and Paulson (1988), Jones anraven (1990), Rankin and Pascal (1990)andJones el. (1993). The NACP is hosted by meta-sedimentocks, and it has been suggested byJones et al. (1993hat the supracrustal rocks were deposited betweeearne Archean hinterland and the first, in a geogra

112 S. Evans et al. / Physics of the Earth and Planetary Interiors 150 (2005) 107–122
sense, of a series of Paleoproterozoic island arc ter-ranes. Laboratory rock property studies byJones et al.(1997)demonstrated that, where exposed in northernSaskatchewan, the mechanism for enhanced conduc-tivity of the NACP is interconnected sulphides (pyrite)not graphite.
4. MT data acquisition and quality
In 2001, broadband (BBMT) and long period (LMT)magnetotelluric data were recorded at 15 locations,sites 001–015, approximately equi-spaced along a 300-km-long northwest–southeast profile (Fig. 3, locationsmarked by white circles). In 2002, BBMT measure-ments at a further 30 locations, sites 201–220 and301–310, were made, both infilling the 2001 stationsand also extending the profile 200 km northwards ontothe Archean Rae craton and outside of the Central Baf-fin bedrock project area (Fig. 3, locations marked byblack stars). The survey line thus comprises 15 LMTstations and 45 BBMT stations with a total profilelength of approximately 500 km. Fieldwork was ac-complished in this isolated area using helicopters basedout of the main base camp and, in 2002, also out of afly camp (for the northern extension).
Fifteen GSC-designed LiMS systems acquired theLMT data simultaneously with a digitizing interval of5 s, giving responses at periods of 20–10,000 s probingthe mid-crust to upper mantle. The systems remained ate 01.A inge ntso oft es ble,t ssw sr
riodb TUV f in-v hel perm nceo icalm om-p ured
(Ex, Ey, Hx andHy). The MTU systems recorded for aperiod of 3 days (two nights) at each site. During the2002 field campaign, the four systems were poweredusing solar cells, with an RF filter in the power supplycircuit to reduce EM noise that could contaminate theobservations.
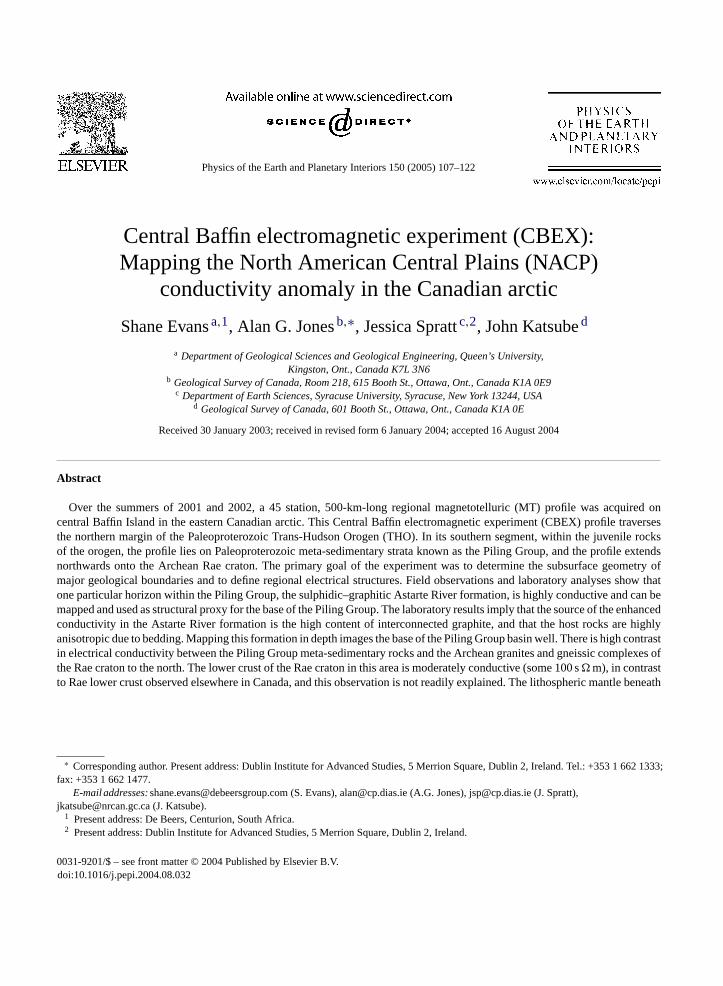
Data quality was generally good, due to lack of anycultural EM noise and high signal levels, with over100 active sunspots for both field campaigns. This re-sulted in high quality response function estimates atmost sites. Typical examples are from sites 005 and307 (Fig. 4).
One problem encountered on these surveys was veryhigh contact electrode resistance, especially at siteswith little surficial cover due the recent retreat of theBarnes Ice Cap, one of the last remaining glaciers fromthe Laurentide ice sheet which covered all of northernNorth America and Greenland 16,000 years ago. Typi-cally, in MT one strives to have resistance between theelectrodes below 10 k� to ensure good ground contact.The worst site, 001 (Fig. 3), was situated in a boulderfield, where resistances were measured at greater than2 M�. Such high contact resistances result in capac-itive coupling with the ground becoming important,with the consequence that the ground responds in amanner characteristic of a low pass RC filter to theelectric signals. This can be seen in the data from sites001 and 201 where there is a significant decrease in theapparent resistivity and phase at period less than 0.1 s(Fig. 4).
tiesw cur-r seena andr fort tor-t ino
5
ec-t riatep erepar
ach site for 4–5 weeks from July to mid-August, 20t each site, the five components of the time varylectromagnetic field, the two horizontal componef the electric field (Ex,Ey) and all three components
he magnetic field (Hx,Hy andHz), were recorded. Thites were visited whenever helicopters were availao minimize data loss due to local wildlife. Data loas an issue at sites 003 and 013 (Fig. 3), where wolve
epeatedly chewed through electrode lines.Broadband (BBMT) measurements, in the pe
and of 0.001–1000 s, were made using Phoenix M5-2000 systems. With these systems, the depth oestigation is typically from a few kilometres to tower crust and, within resistive regions, the up
antle. For the BBMT sites, the shallow occurref permafrost prevented the installation of the vertagnetic field sensor, and accordingly only four conents of the electromagnetic field were meas
Electric field distortions due to local heterogeneiere strong at some sites and can be attributed to
ent channelling. The most severe distortions aret the sites located in river valleys (003 and 205)esult in phases shifting into the wrong quadrantwo-dimensional modelling. In severe cases of dision, it may only be possible to extract informationne mode.
. Processing and analysis
The first step in processing raw MT data is spral analysis of the time series data using approprocessing codes. Both the LMT and BBMT data wrocessed with the Jones–Jodicke robust code (Jonesnd Jodicke, 1984; method 6 inJones et al., 1989). Theemote reference technique (Gamble et al., 1979) was

S. Evans et al. / Physics of the Earth and Planetary Interiors 150 (2005) 107–122 113
Fig. 4. Magnetotelluric response curves derived from data acquired at representative site baf005, baf307 and distorted sites baf201, baf003,baf205 and baf001 (seeFig. 3for locations). Red curves are the responses for currents flowing perpendicular to the profile, and the blue profilesare the responses for current flowing along the profile.
114 S. Evans et al. / Physics of the Earth and Planetary Interiors 150 (2005) 107–122
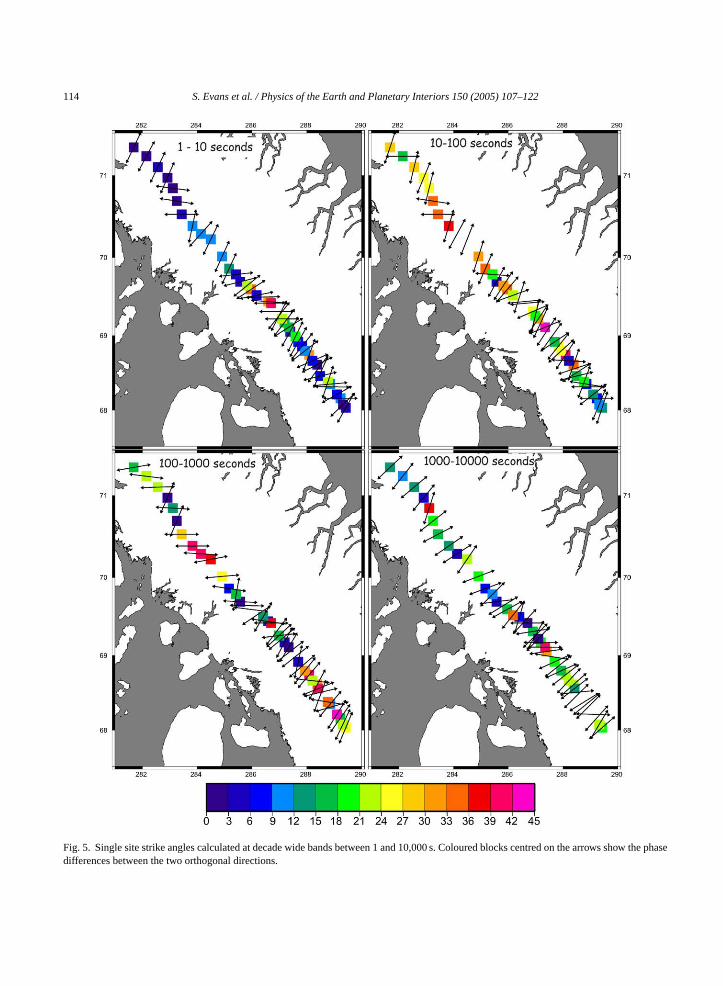
Fig. 5. Single site strike angles calculated at decade wide bands between 1 and 10,000 s. Coloured blocks centred on the arrows show the phasedifferences between the two orthogonal directions.

S. Evans et al. / Physics of the Earth and Planetary Interiors 150 (2005) 107–122 115
employed to reduce the biasing effects of noise in thedata. In the case of the LMT data, given that all 15 sitesrecorded simultaneously, multi-remote processing wasundertaken. In addition, the LMT data were analyzedfor potential non-uniform source field contaminationeffects. The survey lies at high geomagnetic latitude,77–80◦N corrected geomagnetic coordinates (CGM),and is north of the auroral oval within the polar capwhere current flow is dominantly sheet-like and uni-form from local magnetic midnight to local magneticmidday. To ensure that the MT response estimates werenot adversely affected by non-uniform source field con-tributions, the approach ofJones and Spratt (2002)wasapplied. Apart from a few exceptions, the responseswere not affected by the choice of data, indicating thateither the source field effects were negligible, or thatthe robust processing scheme successfully identifiedand removed problem sections.
The MT data were analysed for galvanic distortions,caused by small, near-surface inhomogeneities, andto determine the appropriate strike direction for two-dimensional (2-D) interpretation using theMcNeiceand Jones (2001)multi-site, multi-frequency galvanicdistortion decomposition code based on the approachof Groom and Bailey (1989). Galvanic distortions ob-served were related to local site conditions, not to anyparticular geological horizon. Perversely, the most dis-torted sites were the most picturesque; on terraces inthe deep river valleys especially where a second riverjoined the main one. Single-site strike angles, and thep fieldp es,r eb canb withc hout.G ellw ikea riatef area di-r z),d
sys-t tor-t ithf ands ted
that the data were not rotated into the interpretation ref-erence frame, as this yields inferior estimates of the re-gional 2-D MT impedance tensor estimates (Jones andGroom, 1993; McNeice and Jones, 2001), but fit with amodel of galvanic distortion that includes rotation. Thedifference between rotation and model fitting for highquality data with little distortion is small, but for noisydata suffering a high level of distortion the superiorityof fitting over rotation is evident, as shown in bothJonesand Groom (1993)and McNeice and Jones (2001).After correction for Groom-Bailey’sanisotropyterm,by coalescing the high frequency asymptotes of thetwo modes, the regional 2-D responses were importedinto both WinGLink and Geotools modelling softwarepackages to derive 2-D resistivity models.
6. Laboratory analyses
In the summer of 2001, rock samples were takenfrom the Astarte River formation for laboratory analy-sis for electrical properties. Tri-axial electrical resistivi-ties were measured at room temperatures and pressuresafter immersion in pure H2O following the techniquesoutlined inKatsube et al. (1996). Measurements weremade perpendicular (α) and parallel (β andγ) to thebedding planes, as represented by foliations.
Results of the analyses are listed inTable 1from thefive samples. Samples BAF-1, -2 and -3 were visuallygraphitic-rich, whereas samples BAF-A and -B werev t thee e tot -3).
TR m theA
S
BBBBB
ρ tion,ρ ion,α g (fo-l withb
hase differences between the two modes (electricarallel and perpendicular to strike, TE and TM modespectively), are shown inFig. 5for four decade-widands of data from 1 to 10,000 s. Strike anglese observed to vary along the profile, but regionsonsistent strike angles are distinguishable througenerally, geoelectric strike direction correlates with surface observation of geological strike. A strngle of N33E was determined to be most approp
or the decomposition when all sites at all periodsnalysed simultaneously. Misfits to this single strikeection occur particularly at high frequencies (>1 Hue to geological variation along the profile.
Having defined the most appropriate coordinateem for interpretation, the MT data were fit to a dision model with an assumed strike of N33E and wrequency-independent galvanic distortion (twisthear in Groom-Bailey parlance). It should be no
isually sulphide-rich. These analyses indicate thanhanced conductivity in these samples is likely du
he presence of graphite (samples BAF-1, -2 and
able 1esults of electrical resistivity measurements on samples frostarte formation, Baffin Island
ample ρ′ or ρ+ (� m)
α β γ
AF-1 3600 13 82AF-2 2100 48 61AF-3 390 8 36AF-A >40000 >16000 >8000AF-B >28000 2500 2300
′ = Real electrical resistivity measured after 24 h satura+ = amplitude of complex electrical resistivity after 24 h saturat= measurement made in the direction perpendicular to beddin
iation), andβ andγ = measurements made in directions paralleledding (foliation).
116 S. Evans et al. / Physics of the Earth and Planetary Interiors 150 (2005) 107–122
Although there was a significantly high pyrite sulphidecontent observed visually in samples BAF-A and -B,it is disconnected in these surface samples, and con-tributes little to the conductivity of the samples. Thegraphite samples also show high anisotropy; electricalconductivity is up to two orders of magnitude higherparallel to bedding compared to perpendicular to bed-ding. Such high anisotropy at the hand sample scalewas previously observed byKatsube et al. (1996)andJones et al. (1997)in rocks from the NACP in north-ern Saskatchewan, but in that case it was due to pyritegrains connected along strike but disconnected acrossstrike.
The analyses were undertaken at room temperaturesand pressures, and so can be considered appropriatefor the top 2–5 km of the crust, beyond which the pres-sures will close microcracks (see, e.g.,Christensen andWepfer, 1989). At deeper depths, there is possibly inter-connection of the sulphide grains. However, the modelof the responses does not show a marked significant in-crease of conductivity with depth, thus, we tentativelyconclude that indeed the graphite is the primary con-duction enhancement mechanism for the anomaly at alldepth levels.
7. Preliminary model
The effects of distortions due to the coast effectwere investigated by generic 2-D and 3-D model stud-i eri-o thep d asf ud-i fecti owsp ali-d trat-i nseso
e-s lw deo s-t romb 0 s.T finalm ver-
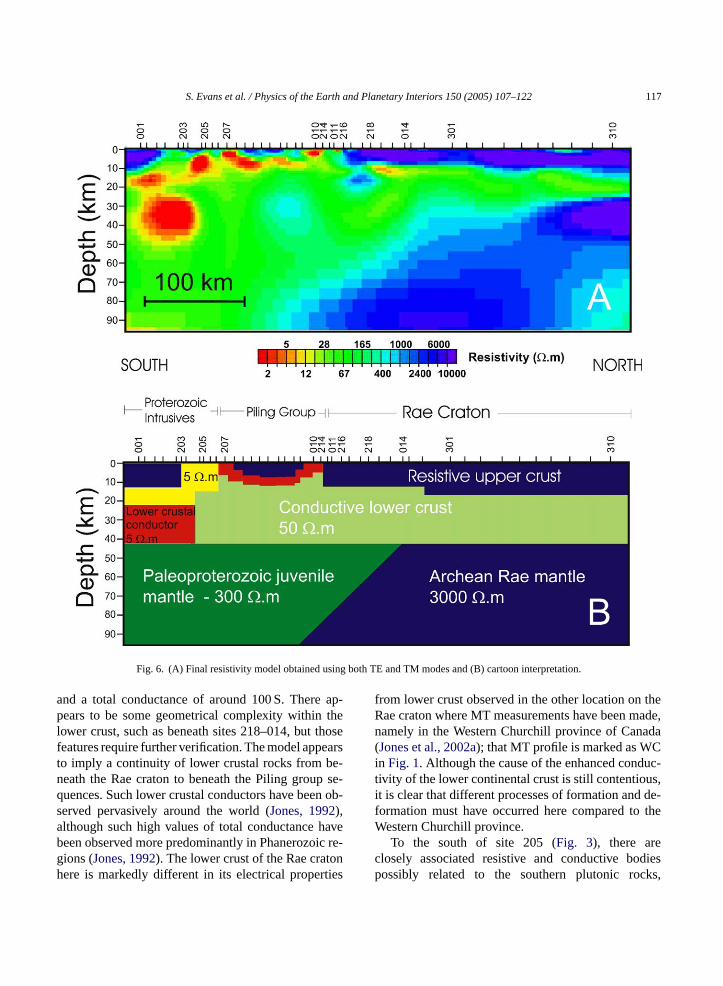
sions were undertaken with other start models and otherinversion parameters chosen, and the same five basicfeatures discussed below always appeared. The finalmodel chosen has an overall RMS misfit of 7.71, withthe misfit approximately equal for TE and TM, and isthe result of the inversion of both the TE and TM modesfrom a starting model of a half-space with a resistivityof 100� m. The model mesh consisted of 123 verticalcolumns and 46 horizontal rows. The inversion was runusing the following RLM2DI parameters:τ = 8, α = 3,β = 1, and error floors of 10% forρ and 5% equivalentfor the phase.
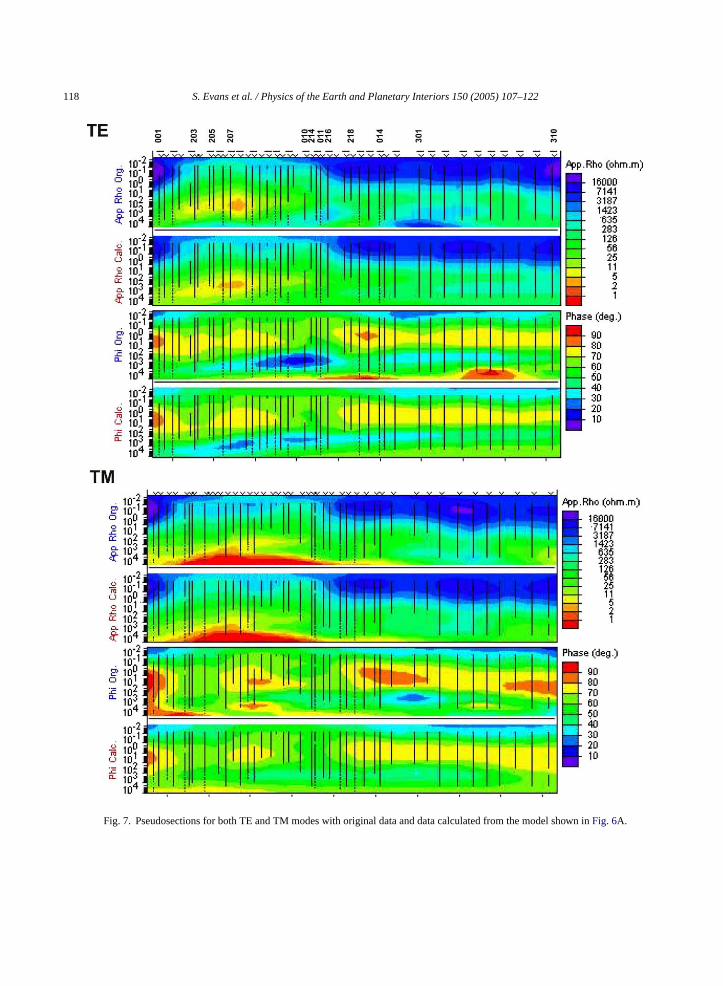
Although the RMS misfit is high, visually the the-oretical response of the final model fits most of theobservations well (Fig. 7); the majority of the misfitsoccur at the longer periods in the phases (100–1000 s).This inability to fit the observations over broad fre-quency bandwidths of many decades is not an uncom-mon occurrence when trying to model a profile with alarge number of stations, primarily due to the Earth notbeing 2-D over the vast scale lengths sensed. Nonethe-less, the smooth model procedure ensures low struc-tural complexity, and it is likely that models obtainedfrom subsequent inversions will have improved fit butwill still possess the following large scale prominentelectrical features:
A conductive layer forms a composite synformalbasinal feature between sites 207 and 214 with a max-imum depth of approximately 12–15 km. This struc-ture outcrops at sites 010 and 214, where the graphiter ace.T uralb tarys
ely1 re-s to2 eent theP kedA tive( bem ghlyr ob-s a)a
on-a
es and inspecting the induction arrows at long pds (∼1000 s, not shown). It should be noted thatrofile was chosen to be parallel to the coast, an
ar as logistically possible from it. These model stes indicated that there should be little coast efn our data. In the observations, the induction arrointed generally parallel to the profile, further vating the strike direction assumption and demons
ng that the coast effect does not affect the respobserved.
A preliminary 2-D resistivity-depth model to dcribe the observations is shown inFig. 6A. The modeas obtained with the RLM2DI smooth inversion cof Rodi and Mackie (2001), as implemented in Geosy
em’s WinGLink package, inverting the responses foth TE and TM modes in the period range 0.1–100he start model was a uniform half space, and theodel was obtained after hundreds of iterations. In
ich Astarte River formation is exposed on the surfhus, MT has imaged the geometry of the structasin containing the Piling Group meta-sedimenequences.
A distinct contrast, to a depth of approximat0 km, of greater than an order of magnitude inistivity can be seen moving north from sites 21416. This contrast is indicative of the contact betw
he Paleoproterozoic meta-sedimentary rocks ofiling Group to the south, and those of the reworrchean Rae craton to the north. The highly resis
>10,000� m) upper crustal Rae craton rocks canapped to the northern end of the profile. Such hi
esistive values for the Rae craton rocks were alsoerved in north-central Canada byJones et al. (2002long profile WC (Fig. 1).
Below the Rae craton, the lower crust is reasbly conductive, exhibiting resistivities of 30–300� m
S. Evans et al. / Physics of the Earth and Planetary Interiors 150 (2005) 107–122 117
Fig. 6. (A) Final resistivity model obtained using both TE and TM modes and (B) cartoon interpretation.
and a total conductance of around 100 S. There ap-pears to be some geometrical complexity within thelower crust, such as beneath sites 218–014, but thosefeatures require further verification. The model appearsto imply a continuity of lower crustal rocks from be-neath the Rae craton to beneath the Piling group se-quences. Such lower crustal conductors have been ob-served pervasively around the world (Jones, 1992),although such high values of total conductance havebeen observed more predominantly in Phanerozoic re-gions (Jones, 1992). The lower crust of the Rae cratonhere is markedly different in its electrical properties
from lower crust observed in the other location on theRae craton where MT measurements have been made,namely in the Western Churchill province of Canada(Jones et al., 2002a); that MT profile is marked as WCin Fig. 1. Although the cause of the enhanced conduc-tivity of the lower continental crust is still contentious,it is clear that different processes of formation and de-formation must have occurred here compared to theWestern Churchill province.
To the south of site 205 (Fig. 3), there areclosely associated resistive and conductive bodiespossibly related to the southern plutonic rocks,
118 S. Evans et al. / Physics of the Earth and Planetary Interiors 150 (2005) 107–122
Fig. 7. Pseudosections for both TE and TM modes with original data and data calculated from the model shown inFig. 6A.
S. Evans et al. / Physics of the Earth and Planetary Interiors 150 (2005) 107–122 119
including the Cumberland batholith, and a sequenceof mafic–ultramafic intrusions. The lower crust here isanomalously highly conductive, and requires explana-tion.
There is a distinct north-to-south variation in theresistivity of the upper mantle beneath the region,with highly resistive mantle to the north (>3000� m)and moderately conductive mantle to the south(∼300� m). There is the suggestion of a southwarddip to the transition, similar to that observed at the Rae-Hearne boundary to the west (Jones et al., 2002a).
8. Interpretation and conclusion
These preliminary observations give insight into thegeometry of the regional structures along the profile,both within the crust and within the mantle lithosphere.The Astarte River formation is of particular interestas it is exposed over a large area and our laboratoryanalysis implies that the dominant conducting phaseis interconnected graphite. The Astarte River forma-tion is mapped between sites 207 and 010 and can beused as proxy for the base of the Piling Group, as thePiling Group formations that lie beneath the AstarteRiver formation are at most 2 km thick (Scott et al.,2002, 2003). To the north, a high conductivity contrastbetween the Piling Group meta-sedimentary rocks andthe northern Archean Rae craton places the contact ata
ingo de-p ands pers.c artef taryr CP( Pi thew orth-e tralB then rityi ent,w weh ACPa
We recognise and appreciate that our interpreta-tion of our anomaly being related to the NACP sensustricto is, by its nature, tenuous and that there areother processes for generating conductivity anomalieswithin Paleoproterozoic orogens and other conductiv-ity anomalies within the THO.Korja (1992), in hisreview of electromagnetic studies on the Fennoscan-dian shield, discusses various conductors and con-cludes that several are due to graphite-bearing rocklayers within meta-sedimentary politic rocks whereasothers are caused by black schist layers. Similarly,Boerner et al. (1996)also discuss mechanisms for thegeneration of conductivity anomalies within Paleopro-terozoic orogens in Canada, and suggest that manyare caused by euxinic-flysch foredeep successions ofgraphitic–sulphidic shale sequences were graphitizedby metamorphism above 400◦C. Specifically for theTHO the Attapaspuskow Lake conductivity anomaly(ALCA) of Ferguson et al. (1999), in the central partof the internides of the southern segment of the THOTprofile (Fig. 1) in northern Saskatchewan, is also causedby graphitic and sulphidic rocks within pelitic andpsammitic gneisses. The eastern margin of the THOat the U.S./Canadian border exhibits a strong anomaly,named the TOBE anomaly byJones and Craven (1990)for its interpreted location in the Thompson Belt. How-ever, notwithstanding these arguments, we considerthat the evidence is in favour of our interpretation.
Below sites 001–203, is a resistive body that is spa-tially associated with the Cumberland Batholith. Be-n pperc ravoLs Thec heses be-l
ana-t theR ndi-d rustw ft on-d uldr elyc aleo-p cingm umn
pproximately site 010–214.The Astarte River formation marks the founder
f the passive margin and the initiation of turbiditeosition, which can be equated with the formation,ubsequent accretion, of arc terranes (M. St-Onge,omm., 2003). Thus, the tectonic setting of the Astormation is the same as that for the meta-sedimenocks within the La Ronge arc which host the NAJones et al., 1993, 1997). Geometrically, the NACn the southern segment of the THO is limited toestern (in the Dakotas and Saskatchewan) or nrn (in Manitoba) part of the internides, and on cenaffin Island the anomaly we have identified lies onorthern margin of the internides. Given the simila
n both geometry and tectonic setting and environme therefore conclude that the conducting featureave mapped is, by inference, an extension of the Nnomaly.
eath, and to the north of, this resistive body is an urustal conductor. Sulphides associated with the Bake formation (Stacey and Pattison, 2003) may be theource of the conducting phase within this body.ontinuity of the structures observed suggest that tulphides penetrate deeply within the crust and lieow the Cumberland Batholith.
We do not have a ready tectonic/geological explion for the lower crustal conducting layer beneathae craton in the northern part of the profile. Caates for enhancing the conductivity of the lower cere reviewed byJones (1992), and basically are o
wo types; ionic conduction in fluids or electronic cuction in metasediments. A fluid hypothesis woequire either implausible residence times or unlikontinuous recharge. Thus, we conclude that Proterozoic orogenic processes resulted in emplaeta-sedimentary rocks deep into the crustal col

120 S. Evans et al. / Physics of the Earth and Planetary Interiors 150 (2005) 107–122
for over 200 km laterally, but the appropriate tectonicscenario model needs to be developed.
Finally, the mantle lithospheric geometry suggestedby the resistivity model is one of a south-dippingstructure, suggestive of southward-directed (present-day coordinates) subduction, or possibly imbrication,or northward-directed overthrusting during THO con-vergence.
Acknowledgments
The authors wish to acknowledge Marc St-Onge,David Corrigan and David Scott, Central Baffin projectco-leaders, for their leadership, for their support of theMT component, and for providing a superb logisti-cal base camp. DeBeers Canada Exploration Inc. isthanked for providing the logistical support and base forthe 200 km northern extension onto the Rae craton. Allthe members of the Central Baffin camps for 2001 and2002, most especially Debbie, are warmly thanked fortheir good company. Marc St-Onge and David Corriganprovided key improvements to earlier versions of thispaper. Comments provided by Ian Ferguson and DeanLivelibrooks as external reviewers, and Andreas Jungein his role as Editor, also improved the paper. Geologi-cal Survey of Canada Contribution No. 200227. DublinInstitute for Advanced Studies Publication GP173.
i-43,
ea,),
tiv-(13),
ate8.ar-tern
de-ns
.D.tes,.
Corrigan, D., Scott, D.J., St-Onge, M.R., 2001. Geology of the North-ern Margin of the Trans-Hudson Orogen (Foxe Fold Belt), centralBaffin Island, Nunavut, Geological Survey of Canada, CurrentResearch 2001, C23, 17 p.
Dutch, S.I., 1983. Proterozoic structural provinces in the north-central United States. Geology 11, 478–481.
Evans, S., 2003. A Magnetotelluric Investigation of the NorthernMargin of the Trans-Hudson Orogen on Baffin Island, Nunavut,Canada. Unpubl. M.Sc. thesis, Queen’s Univ. Ontario, Canada.
Evans, S., Jones, A.G. Spratt, J., Katsube, J., 2003. Central Baffinelectromagnetic experiment (CBEX): Phase 2. Geological Sur-vey of Canada Current Research, 2003-C24.
Ferguson, I.J., Jones, A.G., Sheng, Y., Wu, X., Shiozali, I., 1999.Geoelectric response and crustal electrical-conductivity structureof the Flin Flon Belt, Trans-Hudson Orogen, Canada. Can. J.Earth Sci. 36, 1917–1938.
Gamble, T.D., Goubau, W.M., Clarke, J., 1979. Magnetotelluricswith remote reference. Geophysics 44, 53–68.
Groom, R.W., Bailey, R.C., 1989. Decomposition of magnetotelluricimpedance tensors in the presence of local three-dimensionalgalvanic distortion. J. Geophys. Res. 94, 1913–1925.
Gupta, J.C., Kurtz, R.D., Camfield, P.A., Niblett, E.R., 1985. A ge-omagnetic induction anomaly from IMS data near Hudson Bay,and its relation to crustal electrical conductivity in central NorthAmerica. Geophys. J.R. Astron. Soc. 81, 33–46.
Handa, S., Camfield, P.A., 1984. Crustal electrical conductivity innorth-central Saskatchewan: the North American Central Plainsanomaly and its relation to a Proterozoic plate margin. Can. J.Earth Sci. 21, 533–543.
Henderson, J.R., Henderson, M.N., 1994. Geology of the DewarLakes area, central Baffin Island, District of Franklin, N.W.T.(Parts of 27 B and 37 A), Geological Survey of Canada, OpenFile 2924 (scale 1:100 000).
Henderson, J.R., Grocott, J., Henderson, M.N., Falardeau, F., Hei-jke, P., 1988. Results of Field Work near Dewar Lakes, Baffin
rvey
H 1989.eltt C,
H cturalffin
ga-estns,
H ton:Ann.
H divi-son
n., pp.
J land:cal
Island, N.W.T., in Current Research, Part C, Geological Suof Canada, Paper 88-1C, pp. 101–108.
enderson, J.R., Grocott, J., Henderson, M.N., Perreault, S.,Tectonic History of the Lower Proterozoic Foxe-Rinkian Bin central Baffin Island, N.W.T., in Current Research, ParGeological Survey of Canada, Paper 89-1C, pp. 186–187.
enderson, J.R., Parrish, R.R., 1992. Geochronology and strugeology of the early Proterozoic Foxe-Rinkian Orogen, BaIsland, NWT. In: Mining, exploration and geological investitions. In: Brophy, J.A. (Ed.), Exploration Overview, NorthwTerritories. Mining, Exploration and Geological Investigatiop. 25.
offman, P., 1988. United plates of America, the birth of a craearly Proterozoic assembly and growth of Proto-Laurentia.Rev. Earth Planet. Sci. 16, 543–603.
offman, P.F., 1990. In: Lewry, J.F., Stauffer, M.R. (Eds.), Subsion of the Churchill Province and the Extent of the Trans HudOrogen. Geol. Assoc. Can. Spec. Pap. 37: Geol. Assoc. Ca15–39.
ackson, G.D., 1969. Reconnaissance of north-central Baffin Isin Report of Activities, Part A, April to October 1968, GeologiSurvey of Canada, Paper 69-01 A, pp. 186–187.
References
Alabi, A.O., Camfield, P.A., Gough, D.I., 1975. The North Amercan Central Plains anomaly. Geophys. J. Roy. Astron. Soc.815–834.
Bethune, K.M., Scammell, R.J., 1997. Geology, Koch Island ArDistrict of Franklin, Northwest Territories (Part of NTS 37 CGeological Survey of Canada, Open File 3391.
Boerner, D.E., Kurtz, R.D., Craven, J.A., 1996. Electrical conducity and Paleoproterozoic foredeeps. J. Geophys. Res. 101775–13, 789.
Camfield, P.A., Gough, D.I., 1977. A possible Proterozoic plboundary in North America. Can. J. Earth Sci. 14, 1229–123
Camfield, P.A., Gough, D.I., Porath, H., 1970. Magnetometerray studies in the northwestern United States and southwesCanada. Geophys. J.R. Astron. Soc. 22, 201–222.
Christensen, N.I., Wepfer, W.W., 1989. Laboratory techniques fortermining seismic velocities and attenuations, with applicatioto the continental lithosphere. In: Pakiser, L.C., Mooney, W(Eds.), Geophysical Framework of the Continental United Stavol. 172. Geological Society of America, Memoir, pp. 91–102
S. Evans et al. / Physics of the Earth and Planetary Interiors 150 (2005) 107–122 121
Jackson, G.D., Taylor, F.C., 1972. Correlation of major Aphebianrock units in the northeastern Canadian shield. Can. J. Earth Sci.9, 1650–1669.
Jones, A.G., 1992. Electrical conductivity of the continental lowercrust. In: Fountain, D.M., Arculus, R.J., Kay, R.W. (Eds.), Con-tinental Lower Crust. Elsevier, Amsterdam, pp. 81–143 (Chapter3).
Jones, A.G., 1993. The COPROD2 dataset: Tectonic setting,recorded MT data and comparison of models. J. Geomagn. Geo-electr. 45, 933–955.
Jones, A.G., Chave, A.D., Egbert, G., Auld, D., Bahr, K., 1989. Acomparison of techniques for magnetotelluric response functionestimation. J. Geophys. Res. 94, 201–14, 213.
Jones, A.G., Craven, J.A., 1990. The North American Central Plainsconductivity anomaly and its correlation with gravity, magnetics,seismic, and heat flow data in the Province of Saskatchewan.Phys. Earth Planet. Inter. 60, 169–194.
Jones, A.G., Craven, J.A., McNeice, G.A., Ferguson, I.J., Boyce, T.,Farquharson, C., Ellis, R.G., 1993. The North American CentralPlains conductivity anomaly within the Trans-Hudson orogen innorthern Saskatchewan. Geology 21, 1027–1030.
Jones, A.G., Groom, R.W., 1993. Strike angle determination fromthe magnetotelluric tensor in the presence of noise and local dis-tortion: rotate at your peril. Geophys. J. Int. 113, 524–534.
Jones, A.G., Jodicke, H., 1984. Magnetotelluric transfer function es-timation improvement by a coherence-based rejection technique.In: Proceedings of the 54th Society of Exploration GeophysicsAnnual General Meeting, Atlanta, Georgia, USA, December 2–6,Abstract volume pages 51–55.
Jones, A.G., Katsube, J., Schwann, P., 1997. The longest conduc-tivity anomaly in the world explained: sulphides in fold hingescausing very high electrical anisotropy. J. Geomagn. Geoelectr.49, 1619–1629.
Jones, A.G., Savage, P.J., 1986. North American Central Plains con-ductivity anomaly goes east. Geophys. Res. Lett. 13, 685–688.
J , D.smicld: a
, doi:
J uni-and
J mag-rrent
K . Elec-do-. Ge-
159–
K gy ofbrian1102.
K o-Res.
Lewry, J.F., Collerson, K.D., 1990. The Trans-Hudson Orogen: ex-tent, subdivision, and problems. In: Lewry, J.F., Stauffer, M.R.(Eds.), The Early Proterozoic Trans-Hudson Orogen of NorthAmerica, Geol. Assoc. Can. Sp. Pap., vol. 37. Geol. Assoc. Can.,pp. 1–14.
Maidens, J.M., Paulson, K.V., 1988. A magnetotelluric investigationunder the Williston Basin of south-eastern Saskatchewan. Can.J. Earth Sci. 25, 60–67.
Mathisrud, G.C., Sumner, J.S., 1967. Underground induced polari-sation survey surveying at the Homestake mine. Min. Cong. J.53, 66–69.
McNeice, G., Jones, A.G., 2001. Multisite, multifrequency tensordecomposition of magnetotelluric data. Geophysics 66, 158–173.
Morgan, W.C., 1983. Lake Gillian, District of Franklin, NorthwestTerritories, Geological Survey of Canada, Map 1560A, scale1:250 000. of the Foxe Fold Belt, Baffin Island, in Report ofActivities, Part A, Geological Survey of Canada, Paper 76-1A,pp. 387–391.
Morgan, W.C., Bourne, J., Herd, R.K., Pickett, J.W., Tippett, C.R.,1975. Geology of the Foxe Fold Belt, Baffin Island, District ofFranklin, in Report of Activities, Part A, Geological Survey ofCanada, Paper 75-1A, pp. 343–347.
Morgan, W.C., Okulitch, A.V., Thompson, P.H., 1976. Stratigraphy,Structure and Metamorphism of the west half of the Foxe FoldBelt, Baffin Island, in Report of Activities, Part A, GeologicalSurvey of Canada, Paper 76-1A, pp. 387–391.
Peterman, Z.E., 1979. Geochronology and the Archean of the UnitedStates. Econ. Geol. 74, 1544–1562.
Peterman, Z.E., 1981. Dating the Archean basement in northeasternWyoming and southern Manitoba. GSA Bull. 92, 139–146.
Rankin, D., Pascal, F., 1990. A gap in the North American Cen-tral Plains conductivity anomaly. Phys. Earth Planet. Inter. 60,132–137.
Reitzel, J.S., Gough, D.I., Porath, D.I., Anderson III, C.W., 1970.in the–235.
R al-66,
S of thethentia.
S aleo-ntralrent
S theopro-ical
S lainsates.
S ture,ake
ones, A.G., Snyder, D., Hanmer, S., Asudeh, I., WhiteEaton, D., Clarke, G., 2002a. Magnetotelluric and teleseistudy across the Snowbird Tectonic Zone, Canadian ShieNeoArchean mantle suture? Geophys. Res. Lett. 29 (17)10.1029/2002GL015359.
ones, A.G., Spratt, J., 2002. A simple method for deriving theform field MT responses in auroral zones. Earth, PlanetsSpace 54, 443–450.
ones, A.G., Spratt, J., Evans, S., 2002b. Central Baffin electronetic experiment (CBEX). Geological Survey of Canada CuResearch 2002-C19.
atsube, T.J., Jones, A.G., Scromeda, N., Schwann, P., 1996trical characteristics of rock samples from the La Rongemain of the Trans-Hudson orogen, northern Saskatchewanological Survey of Canada Current Research, 1996-E,169.
lasner, J.S., King, E.R., 1986. Precambrian basement geoloNorth and South Dakota, relationship to exposed Precamterranes, tectonic implications. Can. J. Earth Sci. 23, 1083–
orja, T., 1992. Electrical conductivity distribution of the lithsphere in the central Fennoscandian Shield. Precambrian64, 85–108.
Geomagnetic deep sounding and upper mantle structurewestern United States. Geophys. J.R. Astron. Soc. 19, 213
odi, W., Mackie, R.L., 2001. Nonlinear conjugate gradientsgorithm for 2-D magnetotelluric inversion. Geophysics174–187.
cott, D.J., 1997. Geology, U–Pb, and Pb–Pb geochronologyLake Harbour area, southern Baffin Island: implications forPaleoproterozoic tectonic evolution of northeastern LaureCan. J. Earth Sci. 34, 140–155.
cott, D.J., St-Onge, M.R., Corrigan, D., 2002. Geology of the Pproterozoic Piling Group and underlying Archean gneiss, ceBaffin Island, Nunavut, Geological Survey of Canada, CurResearch, 2002-C17, 12 pp.
cott, D.J., St-Onge, M.R., Corrigan, D., 2003. Geology ofArchean Rae craton and Mary River group, and of the Paleterozoic Piling group, central Baffin Island, Nunavut, GeologSurvey of Canada, Current Research, 2003-C26.
ims, P.K., Peterman, Z.E., 1986. Early Proterozoic Central Porogen: a major buried structure in north-central United StGeology 14, 488–491.
tacey, J., Pattison, D.R.M., 2003. The Stratigraphy, Strucand Petrology of a Representative Klippe of the Bravo L

122 S. Evans et al. / Physics of the Earth and Planetary Interiors 150 (2005) 107–122
formation, Central Baffin Island, Nunavut, Geological Surveyof Canada Current Research, 2003-C13.
St-Onge, M.R., Scott D.J, Corrigan, D., 2001. Geology, Central Baf-fin Island Area, Nunavut, Geological Survey of Canada, OpenFile D3996, 1 CD-ROM, scale 1:250000.
St-Onge, M.R., Scott, D.J., Corrigan, D., 2002a. Geology, UnuksulikLake, Nunavut, Geological Survey of Canada, Open File 4317,1 CD-ROM, scale 1:250 000.
St-Onge, M.R., Scott, D.J., Wodicka, N., 2002b. Review of crustalarchitecture and evolution in the Ungava Peninsula–Baffin Islandarea: connection to the Lithoprobe ECSOOT transect. Can. J.Earth Sci. 39, 589–610.
St-Onge, M.R., Wodicka, N., Scott, D.J., Corrigan, D., Carmichael,D.M., Dubach, K., Berniolles, F., Monday, P., Russel, I., Be-
gin, N.J., Allan, M., Pattison, D.R., 2003. Thermal architectureof the Trans-Hudson Orogen from the Superior to Rae cratons(Quebec–Baffin segment). Geol. Assoc. Canada, Program withabstracts.
Theriault, R.J., St-Onge, M.R., Scott, D.J., 2001. Nd isotopic andgeochemical signature of thePaleoproterozoic Trans-HudsonOrogen, southern Baffin Island, Canada: implications for the evo-lution of eastern Laurentia, Precambrian Res., 108, 113–138.
Van Schmus, W.R., Bickford, M.E., 1981. Proterozoic chronologyand evolution of the midcontinent region. In: Kroner, A. (Ed.),Precambrian Plate Tectonics. Elsevier, Amsterdam, pp. 261–296.
Zhao, G., Cawood, P.A., Wilde, S.A., Sun, M., 2002. Review ofglobal 2.1–1.8 Ga orogens: implications for a pre-Rodinia super-continent. Earth Sci. Rev. 59, 125–162.