Embed Size (px)
Citation preview

Crustal Structure of Taiwan Orogen
Constrained by Ambient Seismic Noises
Tzu-Ying Huang1, Yuancheng Gung1, Ban-Yuan Kuo2,
Ling-Yun Chiao3 , and Ying-Nien Chen3
1Department of Geosciences, National Taiwan University, Taiwan2Institute of Earth Sciences, Academia Sinica, Taipei, Taiwan
3Institute of Oceanography, National Taiwan University, Taipei, Taiwan

2
Science 14 August 2015: Vol. 349 no. 6249 pp. 720-723 DOI: 10.1126/science.aab1879
Surface
wave
tomography
Ambient
noise
technique
Wavelet-based
multi-scale
inversion
Crustal
anisotropy
Orogenic model

Outline
� Plate tectonics
� How mountains get made
� Why study seismic anisotropy
� Information from surface wave
� Ambient noise tomography
� Crustal structures of Taiwan
� Layered deformation in the Taiwan orogen
3
4
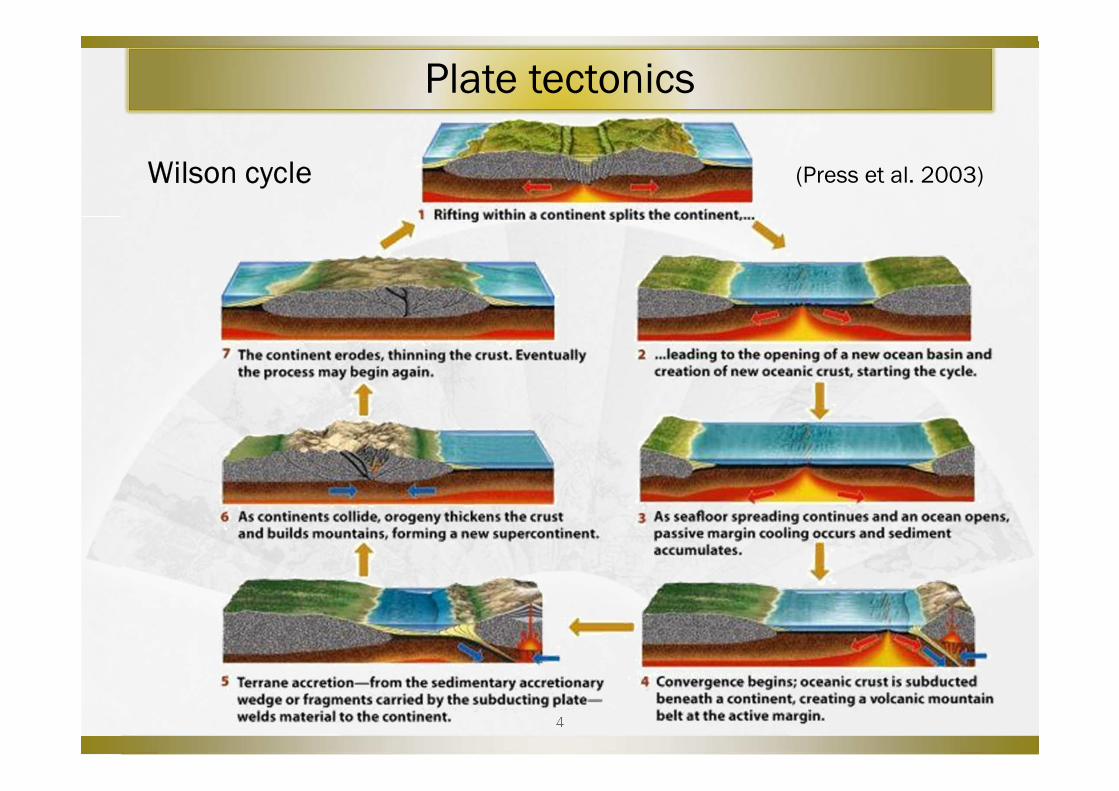
Plate tectonics
Wilson cycle (Press et al. 2003)

5
Plate tectonics
(http://media.web.britannica.com/)

6
Plate tectonics
(http://www.geologyin.com)

7
Tectonics in Taiwan
Northeast:
Ryukyu system
trench, trough,
volcanic arc
South:
Luzon systemThe mountain building
of Taiwan?
(Angelier et al, 2001 )

How mountains get made?
� Subduction or collision?
� Continental crust deforms to produce shortening
and uplift
� Thin-skinned and thick-skinned models:
How the deep crust deforms
� Décollement or mountain root ?
� Geodynamic problem
� Seismic tomography and anisotropy
8
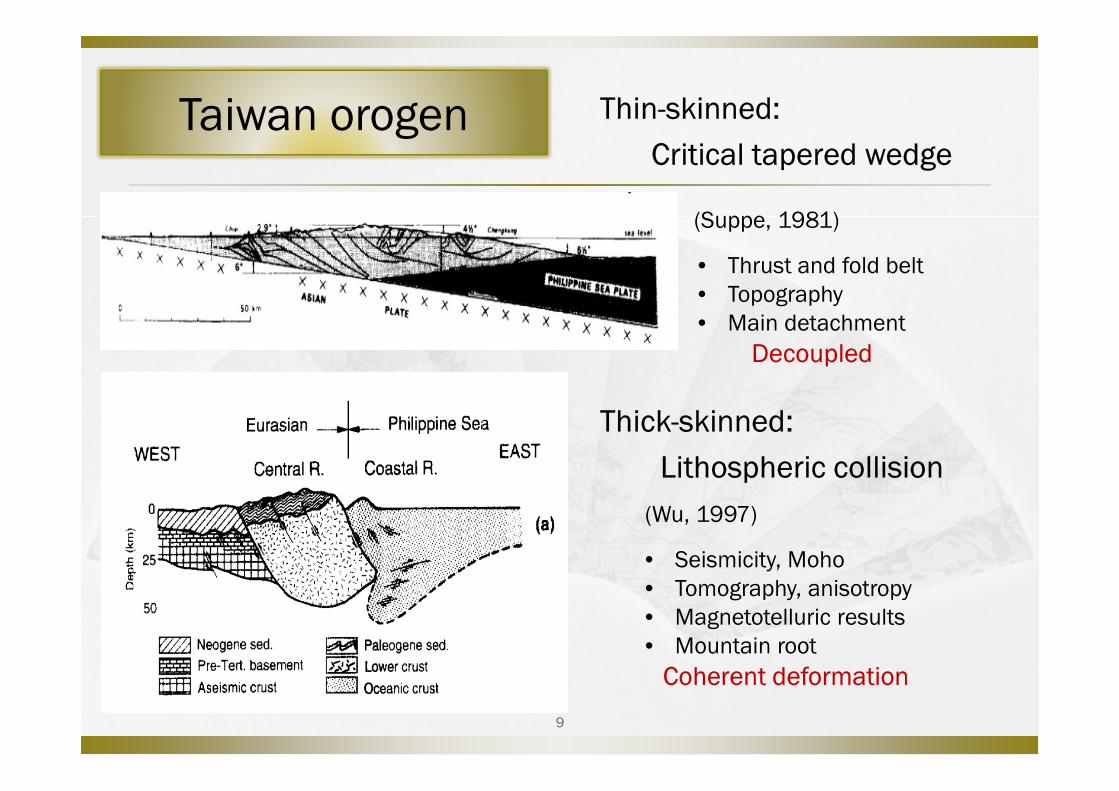
Taiwan orogen Thin-skinned:
Critical tapered wedge
Thick-skinned:
Lithospheric collision
(Suppe, 1981)
(Wu, 1997)
• Thrust and fold belt
• Topography
• Main detachment
Decoupled
• Seismicity, Moho
• Tomography, anisotropy
• Magnetotelluric results
• Mountain root
Coherent deformation
9

10
Taiwan orogen
? Low T, high P,
dense body ?
(modified from Bertrand, 2012)
root
(Suppe, Liu, NTUGeo)
Key: Décollement or mountain root?
� lower crustal deformation?
Method: seismic evidence

11
Seismic tomography
(modified from www.Landtechsa.com)
Arrive time of P & S
wave � Vp & Vs
Taiwan:
high seismicity +
dense stations
= 3-D isotropic
velocity models
• Poor resolution in
shallow crust
Information from seismic wave

(Boness, 2006)
Crustal fabrics�Deformation ?�Anisotropic elastic
property
2
1
3
Seismic anisotropy:dependence of velocity on direction
isotropic
anisotropic
(Garnero, 2010)12
Why study
seismic anisotropy?

Why study
seismic anisotropy?
Crustal anisotropy :
� SPO (shape-preferred orientation)� Stress-aligned fluid-filled
cracks, microcracks, and preferentially oriented pore space, lineations
� Layering strata (VSH > VSV)
� LPO (lattice preferred orientation)� Mica, amphibole
Crampin and Rowlands (1996)
Stress & strain
Tectodynamic
problem in Taiwan ?13

Results from shear
wave splitting (SWS)
� Fast axis - parallel to the strike of the mountain belt(NE-SW)
� (SKS) An anisotropic layer thickness of 5–180 km in the uppermost mantle, and 115–180 km beneath mountain belt.
� (S and ScS) Main source: 25-230 km depths, upper mantle anisotropy.
� Delay time –1. Largest values from the SW
foothills
2. An abrupt change in south Taiwan.
Rau et al.
(2000)
Huang et al. (2006)14
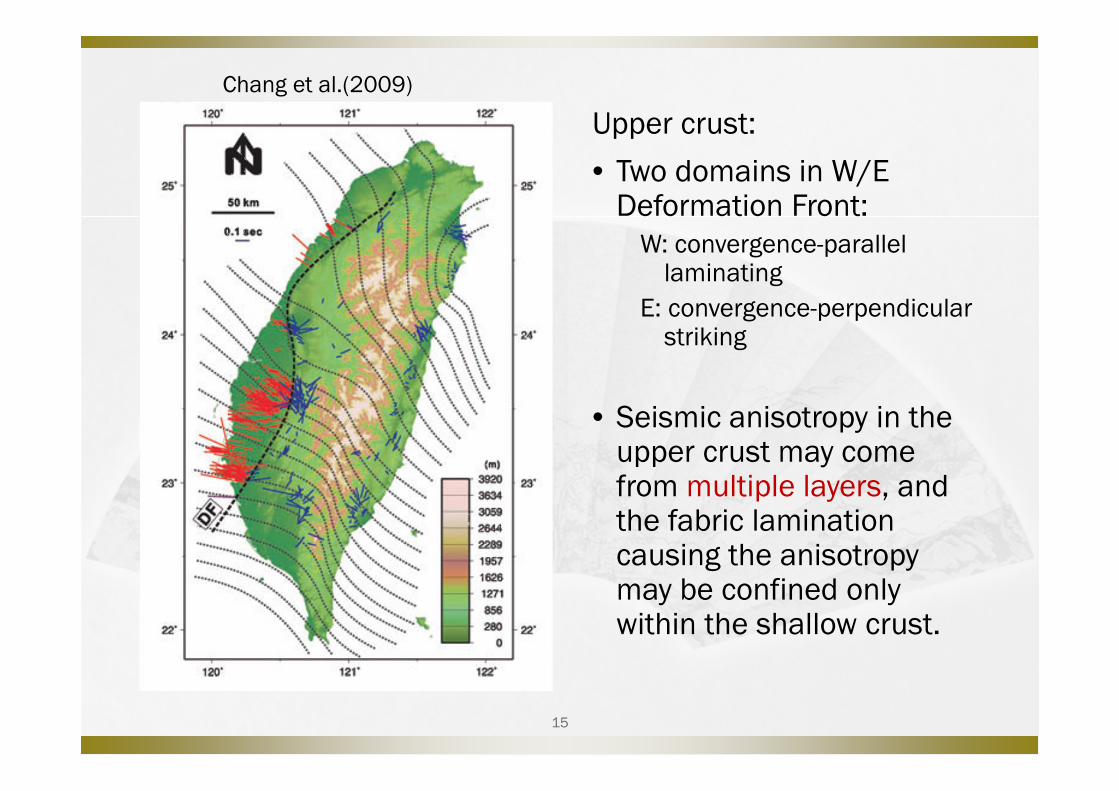
Chang et al.(2009)
15
Upper crust:
• Two domains in W/E Deformation Front:
W: convergence-parallel laminating
E: convergence-perpendicular striking
• Seismic anisotropy in the upper crust may come from multiple layers, and the fabric lamination causing the anisotropy may be confined only within the shallow crust.
16
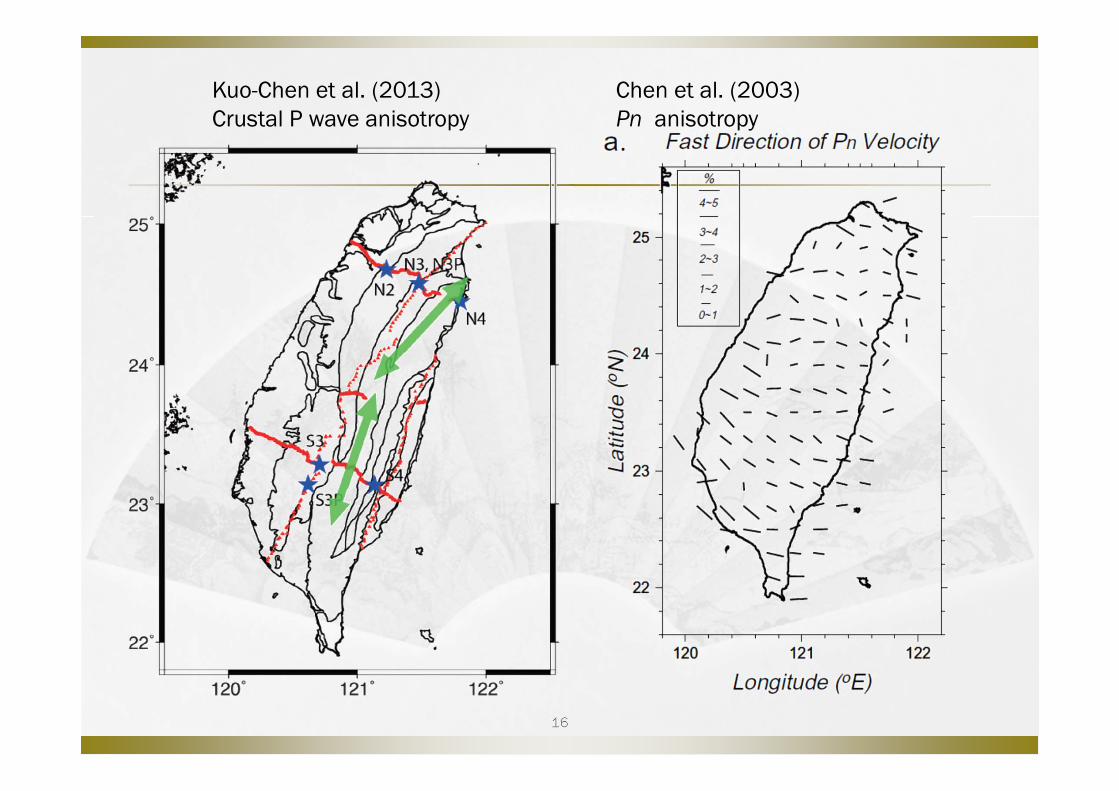
Kuo-Chen et al. (2013)
Crustal P wave anisotropy
Chen et al. (2003)
Pn anisotropy

Information from seismic wave
High seismicity and dense stations � Isotropic velocity - high resolution body
wave tomography
Kim et al. (2005), Wu et al. (2007), and
Kuo-Chen et al. (2012)
� Anisotropy – constrained mainly by
shear-wave splitting (SWS)
Kuo et al. (1994), Rau et al. (2000),
Huang et al. (2006), and Chang et al. (2009)
� SWS - poor depth resolution
� Depth constraints can be
provided by surface waves
2003-2013
M >= 3
(catalog from CWB)17

Information from surface wave
generated along any free surface in the medium
18
19
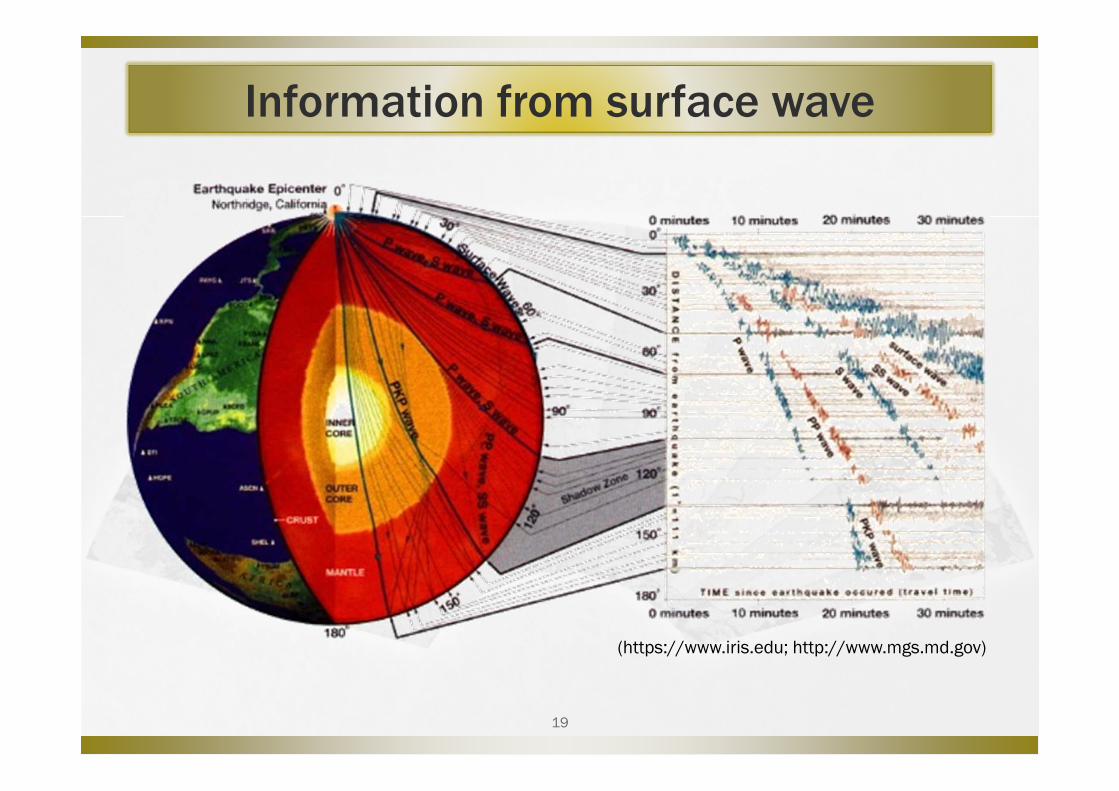
Information from surface wave
(https://www.iris.edu; http://www.mgs.md.gov)

Dispersed, arrive in wave packets � group & phase velocity
longer wavelength surface waves (higher velocities with depth) will travel
faster than those with shorter wavelengths � Depth resolution
Information from surface wave
20

� Single-station method� Source effects?� Velocity structure?
� Two-station method� Eliminate the uncertainty from source� Response function between two stations
� Surface wave velocity models of Taiwan are mainly limited by
1. Sparse distribution of moderate earthquakes
2. Short epicenter distances
Poor resolution in short-period surface-wave tomography
Information from surface wave
source
Station 1 Station 2
21
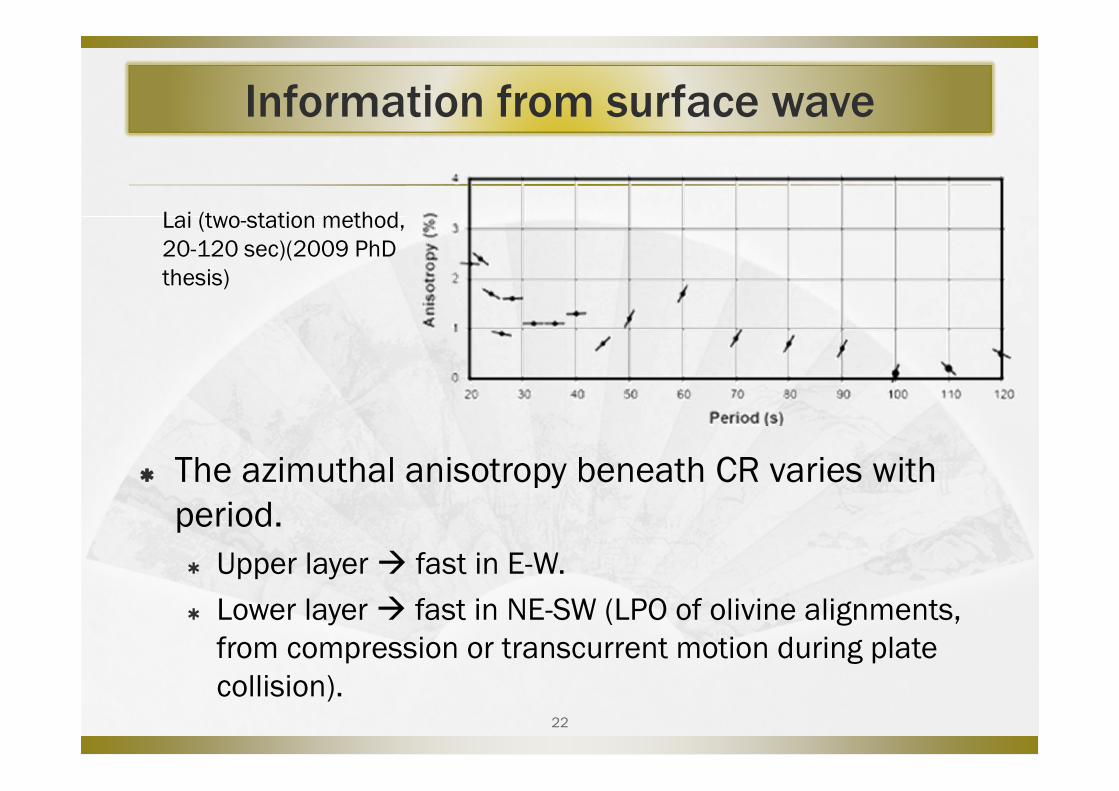
� The azimuthal anisotropy beneath CR varies with
period.
� Upper layer � fast in E-W.
� Lower layer � fast in NE-SW (LPO of olivine alignments,
from compression or transcurrent motion during plate
collision).
Lai (two-station method,
20-120 sec)(2009 PhD
thesis)
Information from surface wave
22
23
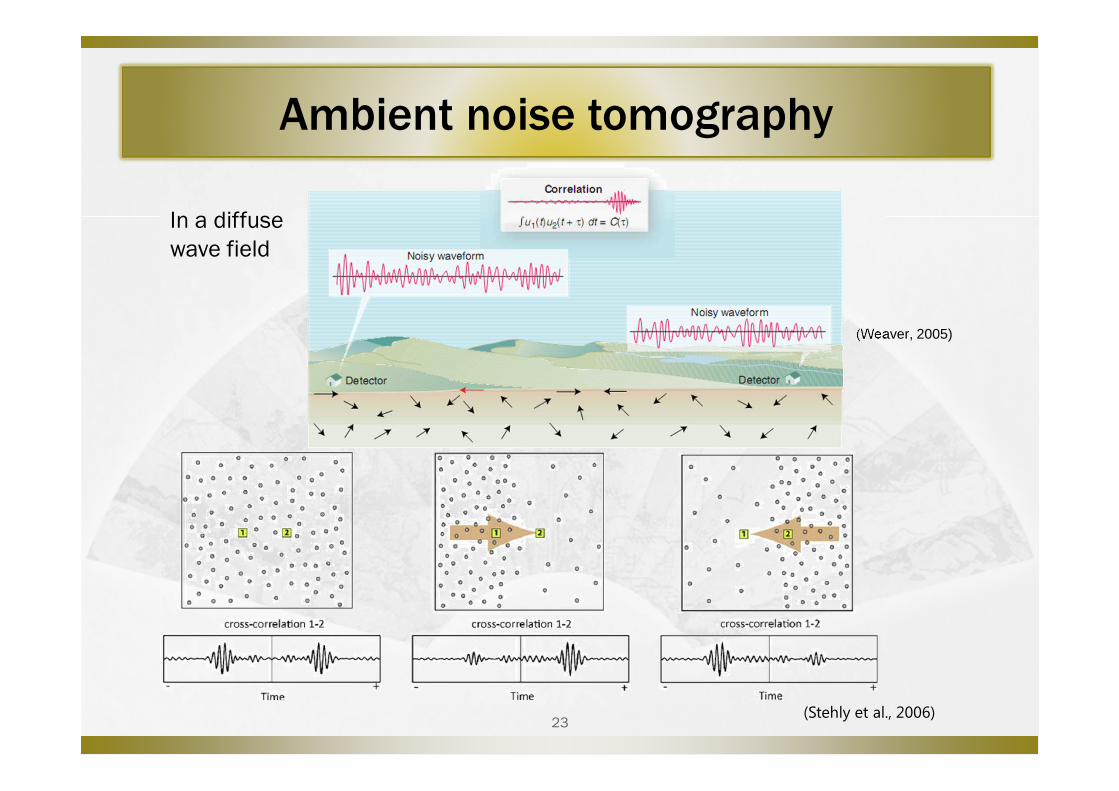
(Weaver, 2005)
(Stehly et al., 2006)
Ambient noise tomography
In a diffuse
wave field

24
Ambient noise tomography
� Ambient noise tomography
1. Seismic tomography without earthquakes
2. Robust Green’s functions of short-period surface-wave
3. Resolution depends on the inter-station paths
� Taiwan: High noise level + dense seismic networks
Broad-band Rayleigh wave tomography of Taiwan and Its
Implications on the Regional Gravity Anomalies
(Huang et al., 2012)
Cross-correlation (CCF)
Empirical Green’s
Function (EGF)

Data
BATS (IES), CWBBB, TAIGER
85 stations in 2007
Z-component
Year 2007 ● TAIGER: (red) TGN, (blue) TGC, (green) TGS
■ BATS
▲ CWBSN
● TAIGER
25

ambient noise & seismic signal
26
x
x
Ambient noise tomography

NNSB-SGSB, 2007.201
NNSB-SGSB, 282 days
Stacked and folded
Empirical Green’s
function (EGF)
Daily
cross-correlation
function (CCF)
Stacked CCF
27
Ambient noise tomography

Lapse time (s)
C200708152022A mag 6.3
evla 50.32 evlo -177.55 evdp 9.0
Ep
ice
ntr
al
dis
tan
ce (
de
gre
e)
Time (s)
Clock errors detected by phase asymmetry
28

29
Seismic signal &
Noise-derived EGF
� Event: 20073571150
� Mb = 4.2
� Depth = 7.62 km
Fundamental mode Rayleigh wave

30
Station: NNSB, 10-20 sec

31
Station: CHGB, 10-20 sec

Path coverage
翁(2006)
Traditional surface wave study
(This study)32

Path coverage density(2157 paths used in 0.25 Hz)
Stacked vertical component CCF
33

Group velocity and Phase velocity
Velocity (km/s)34

35

Phase velocity measurements
Red dots: Reference from the 3D model by Wu et al.(2007). 36

Data selection & Inversion
� Wavelet-based multi-scale tomography for Group &
Phase velocity maps from 4-20 seconds.37
Period 4 s 8 s 10 s 12 s 16 s 20 s
Number of paths
( 3 λ criterion)3822 3418 3321 3012 2565 2259
Qualified
paths
Group
velocity (Z)2157 1950 1646 1448 1165 1074
Phase
velocity (Z)3018 2802 2671 2452 2045 1658
Phase
velocity (T)2397 2221 2108 1927 1601 1292

1. Variation pattern changes gradually.
2. Good correlation to surface geology at short period.
3. Low-velocity anomaly in south–western Taiwan.38
4 sec 12.5 sec 16.7 sec
Crustal structure of Taiwan (1)
Group velocity8.3 sec
Group velocity

Recovery and Resolution

Comparison with models derived
from body-wave (longer period)Group velocity of Rayleigh
waves at Period 16 secWu et al.(2007) Kim et al.(2005)
• Variation pattern and amplitude are more consistent
• The lower velocity anomaly in SW Taiwan is also visible
in body-wave derived models.40

Wu et al.(2007) Kim et al.(2005)
Group velocity of Rayleigh
waves at Period 4 sec
Comparison with models derived
from body-wave (shorter period)
Lateral variations are generally consistent, but
weaker in body-wave derived models.41

Ambient noise tomography
� Inversion method
- wavelet-based multi-scale tomography with anisotropic components
- + iterated updated location-dependent kernels
- = 3-D models
� 12 layers from surface to 50 km depth
� Starting model: Isotropic 1-D model averaged from Wu et al. (2007) � smoothed 3-D model
� 5 iterations, with anisotropic components involved in the final iteration
42

43
Depth sensitivity kernels for surface waves
Reference 1D model – averaged model from Wu et al.(2007).
C
C= Vs Vp
V Vp
= Vs Vp
VpVs Vs
Vs
VpVs Vs
Vs
s p
s p
s p
C
s
k k
k k
k k
δ δ
δ δ
δδ δδ
δ δ
∂∂ ∂+∂ ∂
+
= +
≈ +
When reference 1D velocity
model is given:
kS
kP
(scaled to 1.75)
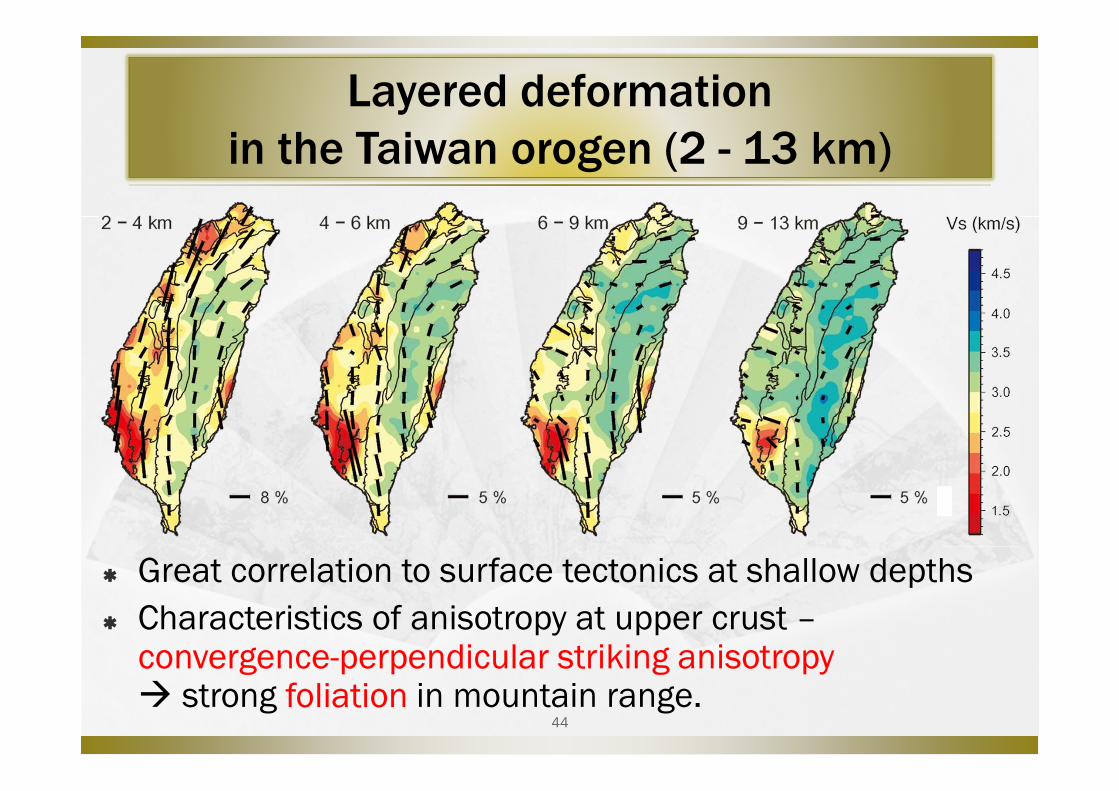
Layered deformation
in the Taiwan orogen (2 - 13 km)
� Great correlation to surface tectonics at shallow depths
� Characteristics of anisotropy at upper crust –convergence-perpendicular striking anisotropy � strong foliation in mountain range.
44

Layered deformation
in the Taiwan orogen (13 – 30 km)
� More homogeneous isotropic velocity
� Convergence-parallel E-W anisotropy in middle to lower crust
45

Orthogonal patterns of crustal anisotropy at
different depths v.s. strain field in Taiwan
(Chang et al., 2003) (Lin et al., 2012)
1. Foliation-dominated anisotropy at shallow crust (brittle) –
Orogen-parallel anisotropy (OPA)
2. Lineation-dominated anisotropy at middle crust (weak rheology) –
Convergence-parallel anisotropy (CPA)46

Anisotropy Transition Boundary (ATB)
Misfit =
atan[(Z-Z0)/dZ]/2+ Φ0- Φ (Z)
AT
ATB: no-slip boundary
condition
ATB ≠detachment(Carena et al., 2002)
47

48
Velocity profiles

Weak layer in mid-
to lower crust?
� High temperature
� Low seismicity
� 3D body wave models
� GPS observations
� Thermo-mechanical
numerical experiments
� Magnetotelluric results
Upper crust: OPA
Mid- to Lower-crust: CPA
� Shear zone
49

50
Thin-skinned ?
Thin-skinned
v shortening & uplift in the upper layer
x decoupled and no deformation
beneath décollement
Thick-skinned
v coupled, deformed lower crust
x coherent deformation
(no deformation)(shear zone)
(coherentdeformation)
Thick-skinned?
Coupled layered deformation

Summary
� Our 3D model provides complementary information to those provided by high resolution 3D body wave models in Taiwan.
� Orthogonal patterns of anisotropy at shallow and middle crust :
1. Characteristics in convergence plate boundary with a weaker lower crust.
2. This lower crustal shearing is interpreted as driven by the continuous sinking of the Eurasian mantle lithosphere when the surface of the plate is coupled with the orogen.
51

END
� Thanks for your attention
52

![Constrained potential field modeling of the crustal ...users.monash.edu.au/~weinberg/PDF_Papers/Aitken_etal_JGR09.pdf · Musgrave Province started ca. 600 Ma [Wade, et al., 2005]](https://img.dokumen.tips/doc/110x75/5b94e4cd09d3f272648baa71/constrained-potential-field-modeling-of-the-crustal-users-weinbergpdfpapersaitkenetaljgr09pdf.jpg)