Embed Size (px)
Citation preview
Census Background
Census: 100 Percent Count of Units
Survey: Sample of Units
Censuses
Decennial Census: Population and Housing
Economic Census: Business and Industry
Agriculture Census: Farms
Census of Government: Local and State
U.S. Census Bureau Surveyshttp://www.census.gov/ Decennial Census Survey: Population and
Housing American Community Survey Current Population Survey Survey of Income Participation Programs American Housing Survey
International Program Center
Part of U.S. Census Bureau Population Division
Assist in Census data collection and processing for countries throughout the world
http://www.census.gov/ipc/www/
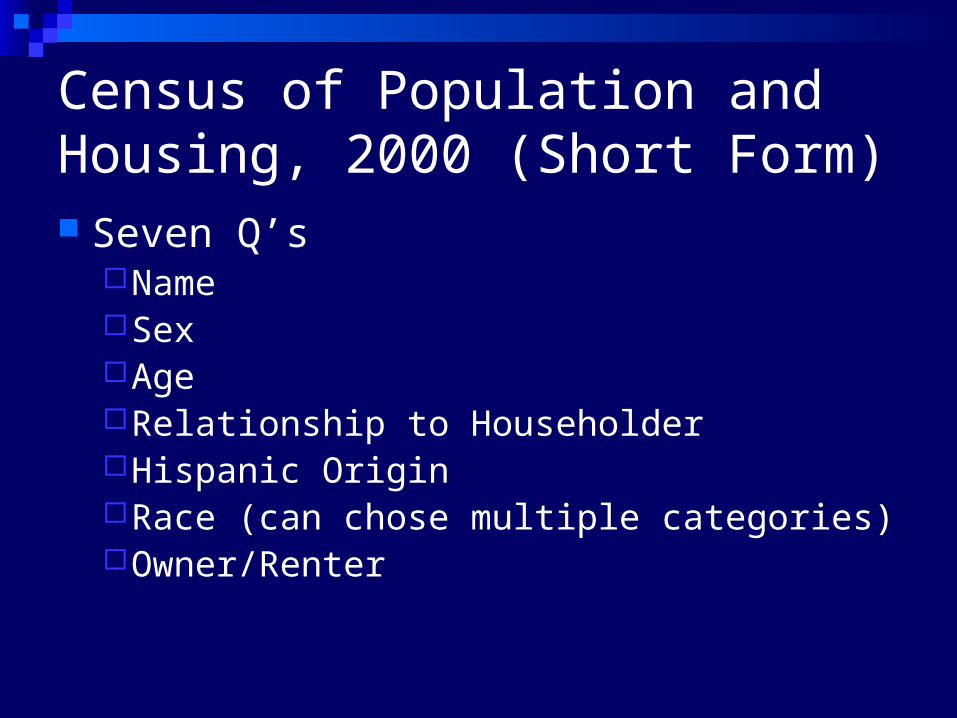
Census of Population and Housing, 2000 (Short Form) Seven Q’s
NameSex AgeRelationship to HouseholderHispanic OriginRace (can chose multiple categories)Owner/Renter
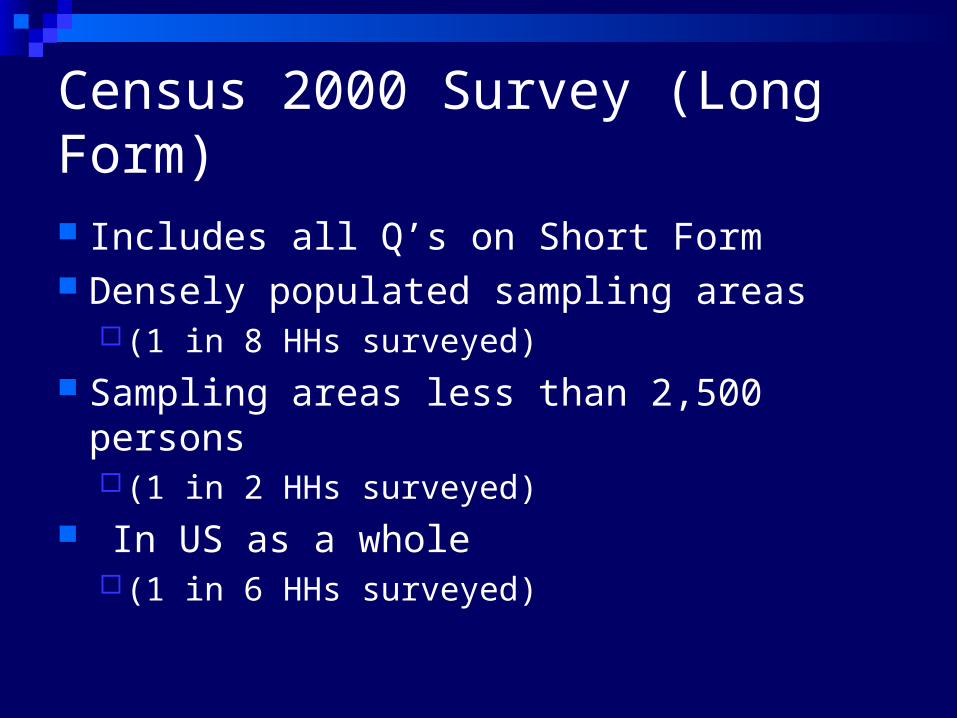
Census 2000 Survey (Long Form)
Includes all Q’s on Short Form Densely populated sampling areas
(1 in 8 HHs surveyed) Sampling areas less than 2,500 persons
(1 in 2 HHs surveyed) In US as a whole
(1 in 6 HHs surveyed)
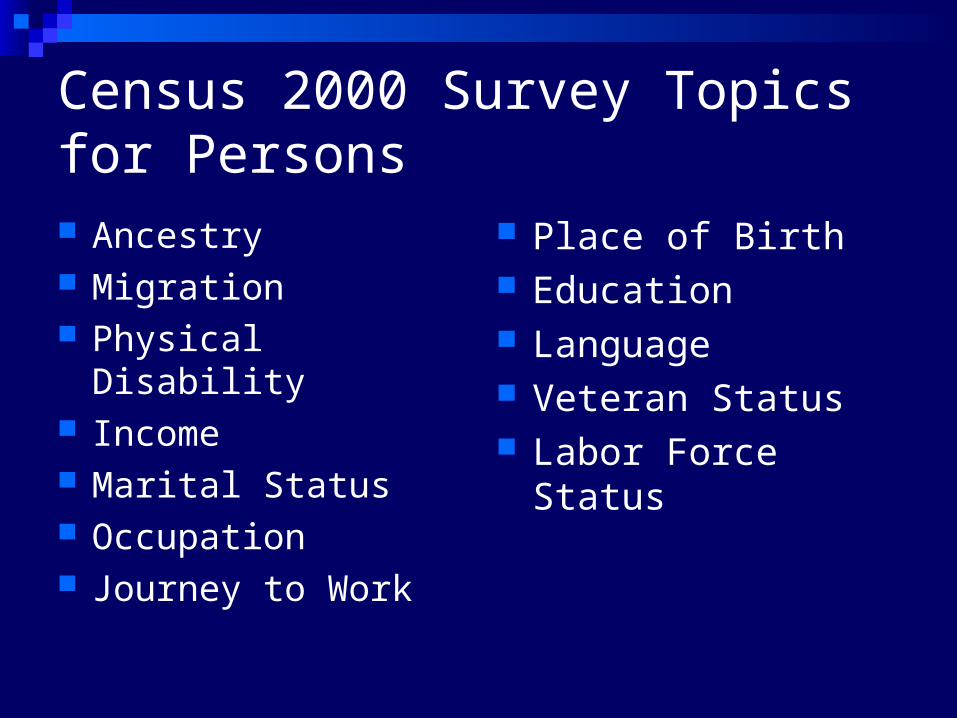
Census 2000 Survey Topics for Persons Ancestry Migration Physical Disability Income Marital Status Occupation Journey to Work
Place of Birth Education Language Veteran Status Labor Force Status
Census 2000 Survey Topics for Families Grandparents as caregivers Poverty
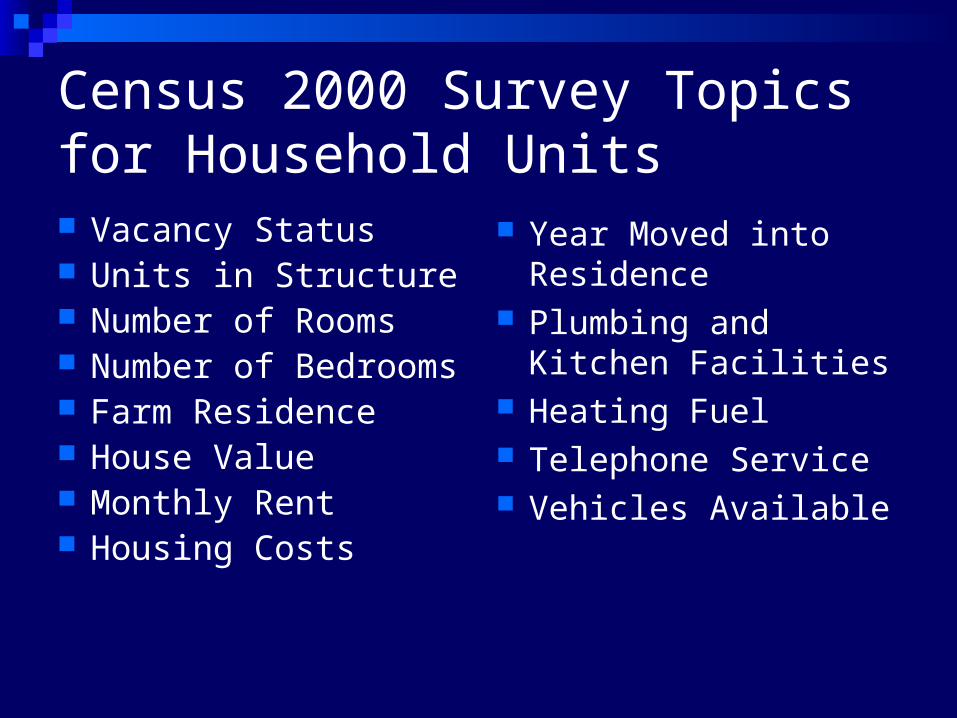
Census 2000 Survey Topics for Household Units Vacancy Status Units in Structure Number of Rooms Number of Bedrooms Farm Residence House Value Monthly Rent Housing Costs
Year Moved into Residence
Plumbing and Kitchen Facilities
Heating Fuel Telephone Service Vehicles Available
ACS Concepts, Definitions, Overview
What is the ACS?
A large, continuous demographic survey Produces annual and multi-year estimates of
characteristics of population and housing Produces information for small areas including
tracts and block groups and is updated every year
Key component of the reengineered 2010 Census of Population and Housing
ACS Background Leslie Kish’s idea for a “rolling census”,
Roger Herriot’s suggestion for decadal census program with continuous survey, Chip Alexander and others efforts for Continuous Measurement Survey
Context of early 1990s: simplify decennial census, reduce census costs, provide more timely data
ACS Sample Design
Contact about 3 million households each year, about 250,000 per month, in every U.S. county
Survey includes households in all 50 states, District of Columbia, and Puerto Rico and will include both housing units and group quarters
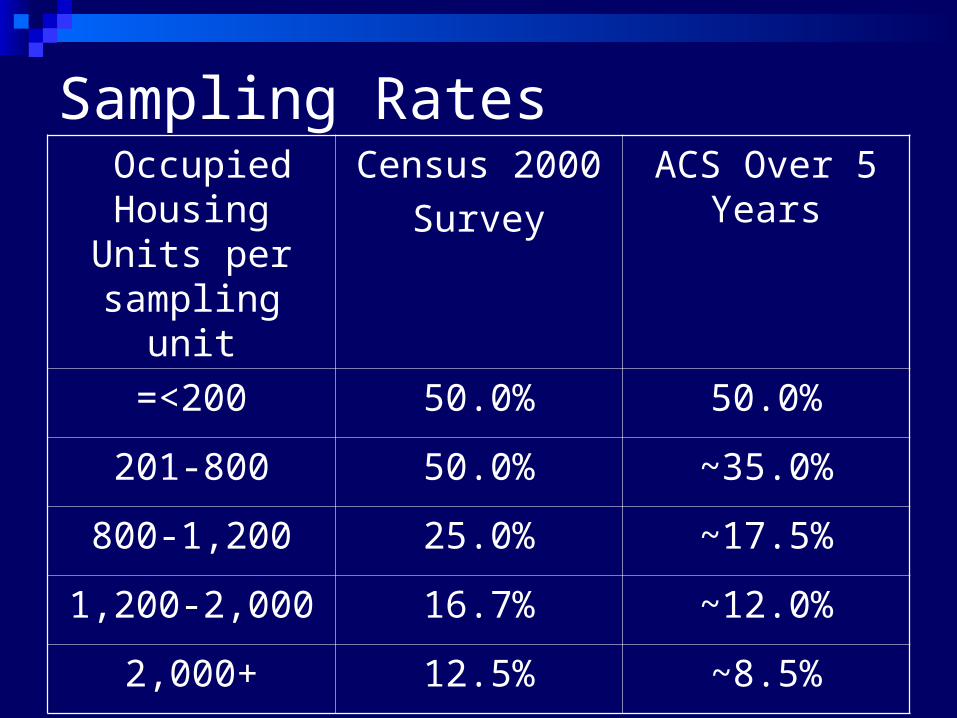
Sampling Rates Occupied
Housing Units per sampling
unit
Census 2000
Survey
ACS Over 5 Years
=<200 50.0% 50.0%
201-800 50.0% ~35.0%
800-1,200 25.0% ~17.5%
1,200-2,000 16.7% ~12.0%
2,000+ 12.5% ~8.5%
Sample Design
Accumulate sample over time to produce lowest levels of geographic detail
Annual estimates for population size of 65,000+
Three-year averages for 20,000+ Five-year averages for census tracts and
block groups
ACS Implementation Schedule
ACS testing and development: 1996-2004
ACS full implementation: Jan 2005
First full implementation data products: Summer, 2006
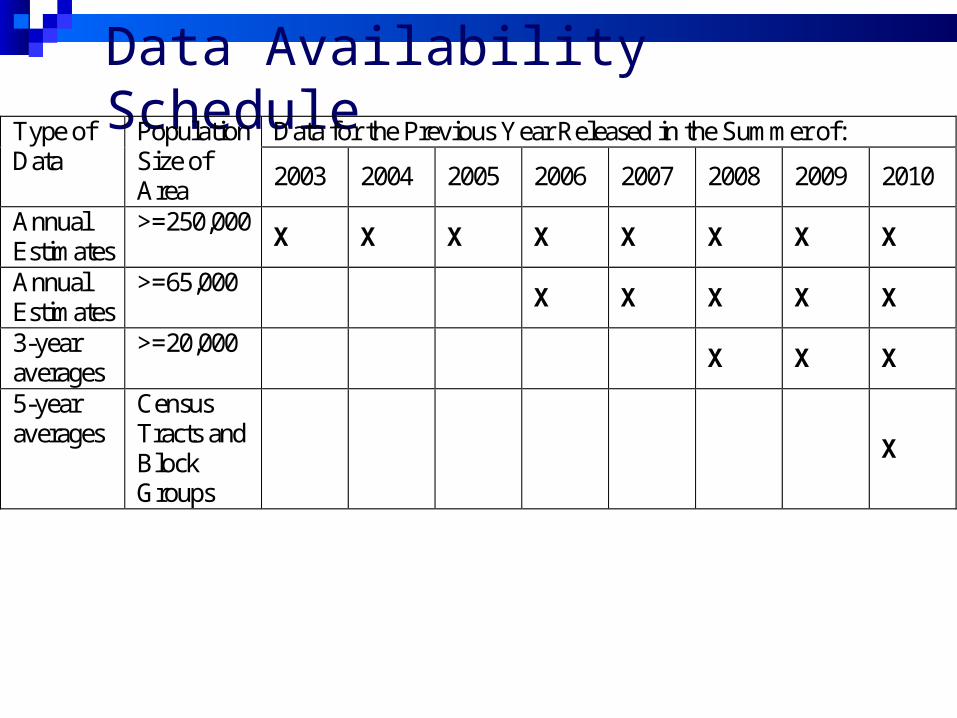
Data Availability ScheduleData for the Previous Year Released in the Summer of: Type of
Data Population Size of Area
2003 2004 2005 2006 2007 2008 2009 2010
Annual Estimates
>=250,000 X X X X X X X X
Annual Estimates
>=65,000 X X X X X
3-year averages
>=20,000 X X X
5-year averages
Census Tracts and Block Groups
X
Two Major Forms of ACS Data
1. Summary Files/Tabulations
2. Microdata samples of individual household records (PUMS)
Summary Files/Tabulations
These are tables that report summary of cases for different categories
--# persons by age and sex for a census tract--% of families with grandparent caregiver in
a county Not all possible combinations of variables can be
tabulated, so only ones of major interest are tabulated
Advantages of Summary Tabulations The major advantage is that they present
a standardized tabulation for similar geographic units
For example, one can obtain the proportion of Black households in poverty of all census tracts in a metropolitan area
Limitation of Summary Tabulations Summary tabulations are presented in a
fixed format with limited flexibility for the analysts to make adjustments
Analysts can collapse categories but there is not ability to obtain more detailed categories or to add additional variables
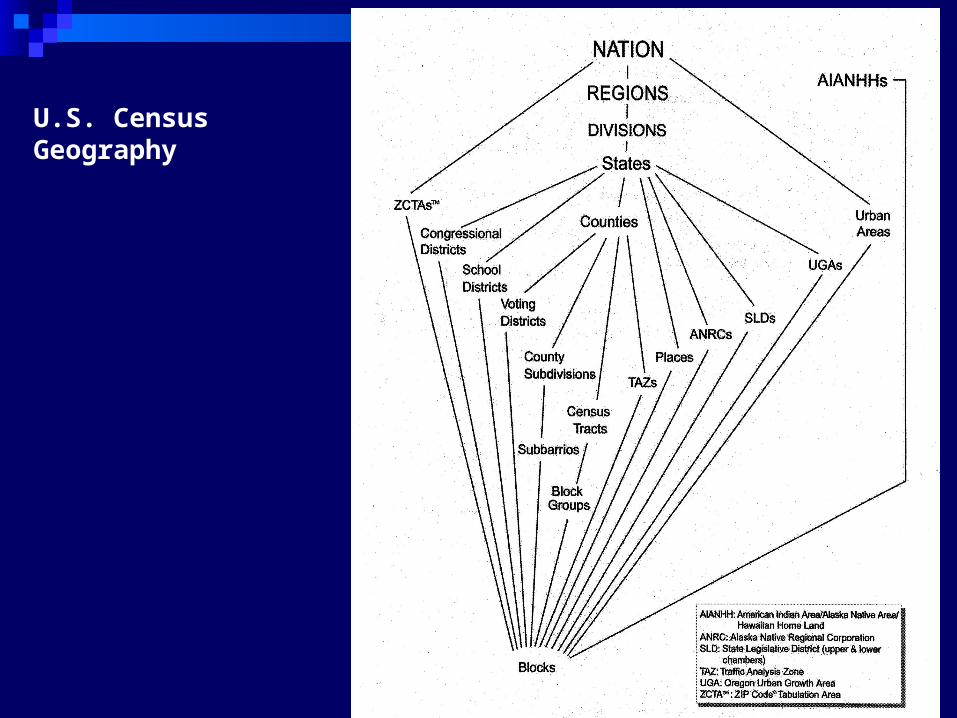
U.S. Census Geography
Geographic Concepts
Census geography is important for locating data but also because of the organization of the geographic hierarchy
Census geography is structured in a generally hierarchical fashion, ranging from larger to smaller units, with smaller units contained within the boundaries of larger units
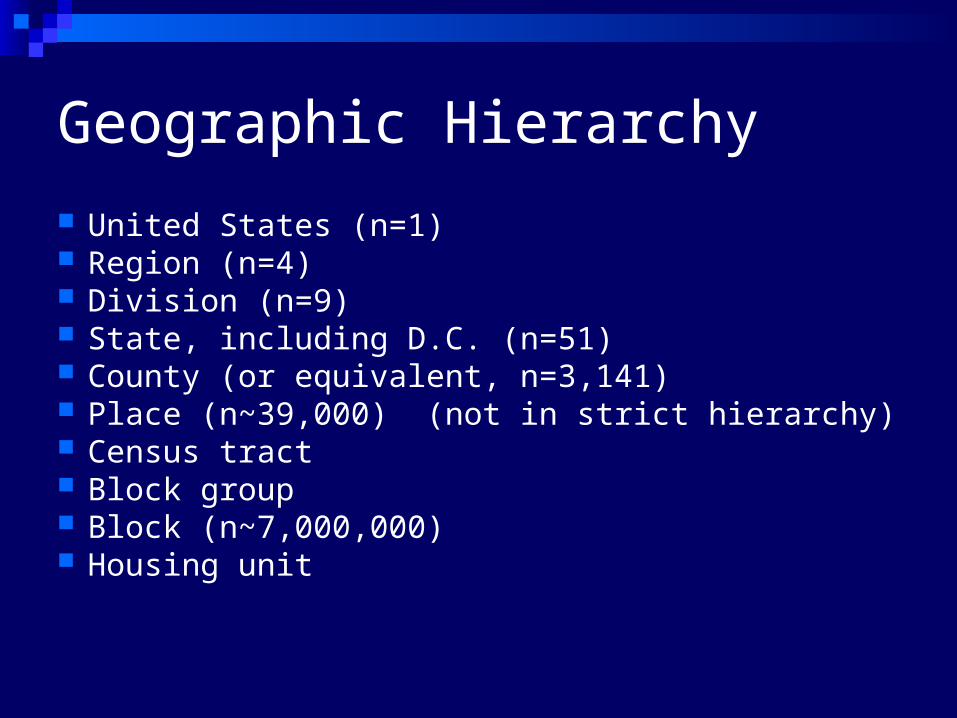
Geographic Hierarchy
United States (n=1) Region (n=4) Division (n=9) State, including D.C. (n=51) County (or equivalent, n=3,141) Place (n~39,000) (not in strict hierarchy) Census tract Block group Block (n~7,000,000) Housing unit
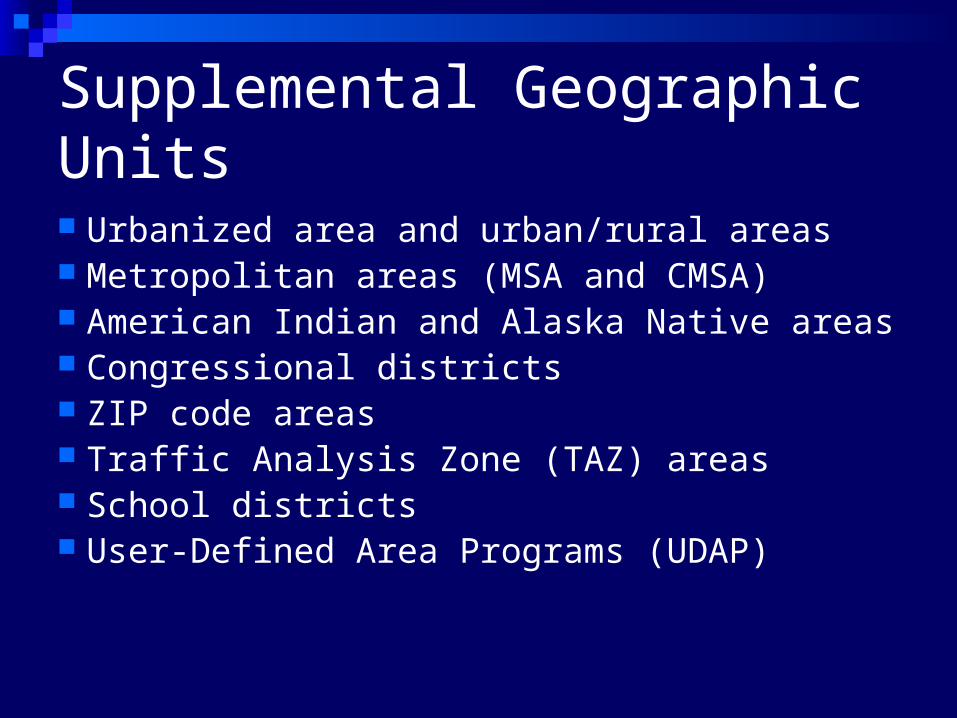
Supplemental Geographic Units
Urbanized area and urban/rural areas Metropolitan areas (MSA and CMSA) American Indian and Alaska Native areas Congressional districts ZIP code areas Traffic Analysis Zone (TAZ) areas School districts User-Defined Area Programs (UDAP)
Hierarchy of Data Availability
Corresponding to the hierarchy of geographic units is a hierarchy of the detail of census data
More detail (more variables and more categories in variables) are available for larger geographic units
Census tract data has more detailed data than blocks or block groups
Data Access The U.S. Census Bureau website offers
access online to ACS profiles and tables
http://www.census.gov/acs/www/ Users can request special tabulations for ACS
data There are several Secure Census Research
Centers that may offer specialized data access
Microdata (PUMS) The second main ACS data type closely
resembles the actual data collected in the ACS survey questionnaire
All person identifiers are removed and the microdata have limited geographic identifiers
PUMS PUMS data include original survey
variables and some derived measures Includes records for housing unit and for
each person in occupied housing units
Uses of PUMS Microdata is a flexible form of survey data Offers more specialized combinations of
data that researchers can craft for special purposes
Downside is that geographic areas are fairly large
ACS Sampling Frame
Select households from Master Address File (MAF) updated from 2000 census
Continuously update MAF through use of (a) delivery sequence files from USPS and (b) updated addresses through the U.S. Census Bureau’s community address updating system
ACS Data Collection Process
Obtain overlapping monthly samples using three data collection systems
Mail: make initial attempt at collection by mail questionnaire
Phone: telephone follow-up of incomplete mail returns from 3 CATI facilities
Personal visit: subsample incomplete returns by CAPI using laptops
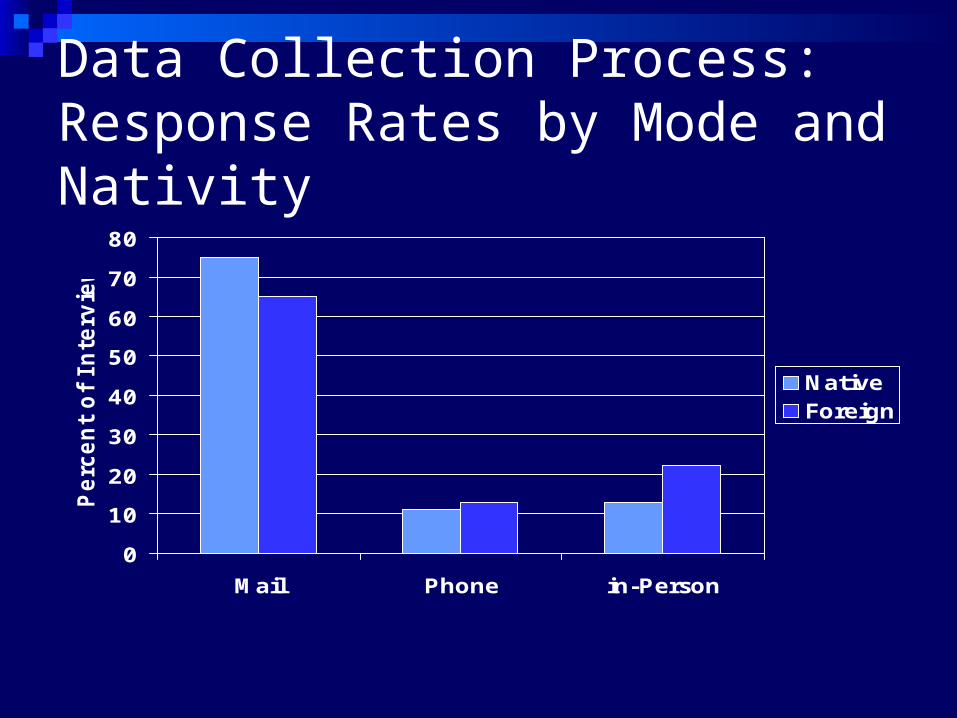
Data Collection Process: Response Rates by Mode and Nativity
0
10
20
30
40
50
60
70
80
Mail Phone in-Person
Perc
ent
of In
terv
iew
s
NativeForeign
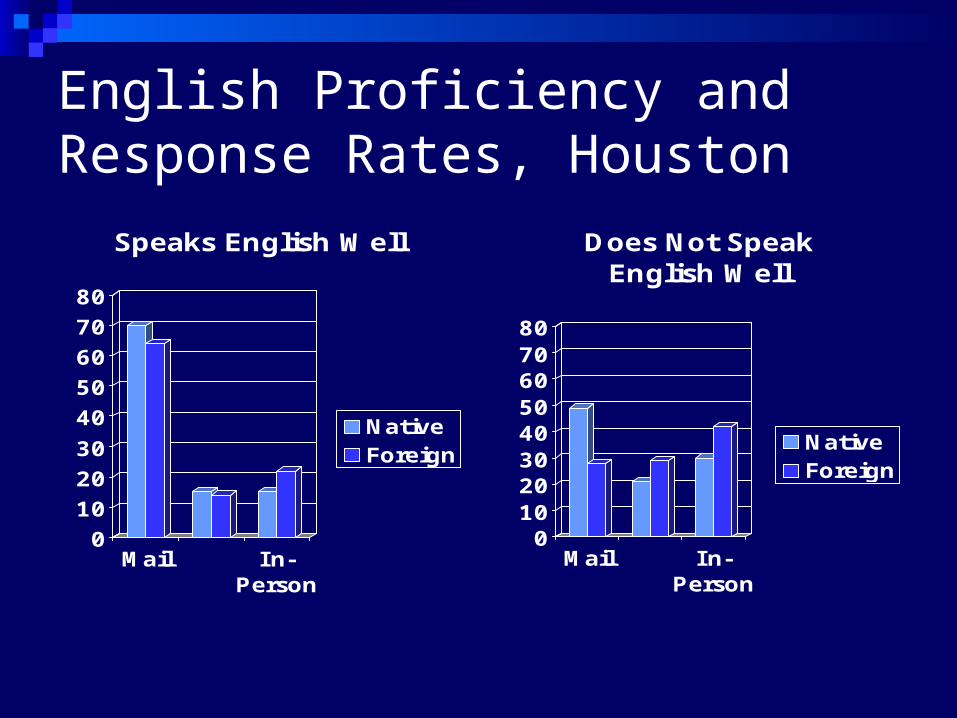
English Proficiency and Response Rates, Houston
0
10
20
30
40
50
60
70
80
Mail In-Person
Speaks English Well
NativeForeign
01020304050607080
Mail In-Person
Does Not Speak English Well
NativeForeign
Comments about Foreign-Born
Current mail questionnaire in English only, with Spanish upon request
Phone and in-person visit available in English and Spanish
But: language barriers are problem Currently, informal methods are used to
complete the interviews Need improved methods for other languages
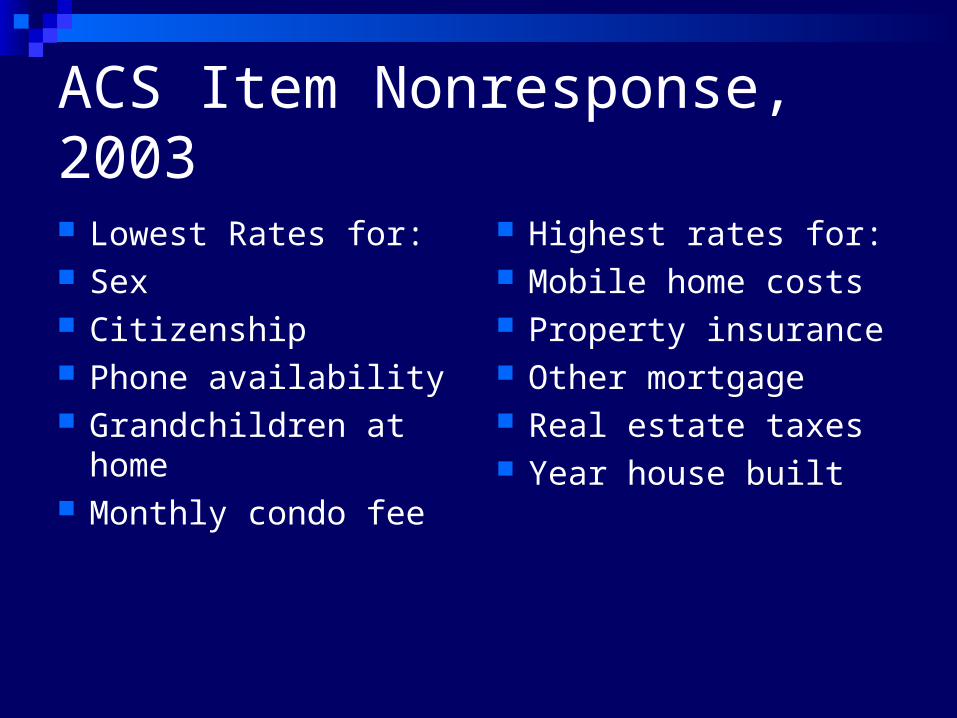
ACS Item Nonresponse, 2003
Lowest Rates for: Sex Citizenship Phone availability Grandchildren at
home Monthly condo fee
Highest rates for: Mobile home costs Property insurance Other mortgage Real estate taxes Year house built
Sample Weights
Initial weights reflect the probability of selection
Weights are adjusted for interviewed households to account for noninterviews
Weights are adjusted to independent housing unit and population estimates (i.e. population controls)
Population Control Totals
Intercensal population estimates are produced by updating previous decennial census results with administrative records
Control totals for housing units and population (by age, sex, and race/ethnicity) are made annually for counties (or group of counties)
Housing unit and population adjustment factors are applied to sample weights to derive housing and population weights consistent with population control totals
Some Key Reminders
Annual data for small areas will be moving five-year averages
Annual data for all areas involve a “margin of error” due to sampling
Differences from Traditional Census 1. Data Content The ACS survey questionnaire includes
basically the same set of data content as the survey questionnaire (the “long form”) for the decennial census 2000
Differences from Traditional Census Survey 2. Variable Definitions Many of traditional census survey questions are
asked in a slightly different form Census and earlier ACS include a racial
category for “Black, African American, or Negro”
ACS for 2003 and after includes a category for “Black or African American”
Differences from Traditional Census 3. Temporal Aggregation ACS: for larger (65,000+) population units, data
will be available annually, albeit collected throughout the year
For smaller geographic units, data will be aggregated over time, for moving 3-year and 5-year averages
Differences from Traditional Census 4. Residence Rules ACS collected data using a current residence
rule, a “two-month rule” that defines a resident who has been in the same place for at least two months
Unlike the decennial census that uses usual residence rule, collecting April 1st data on the characteristics of usual residents
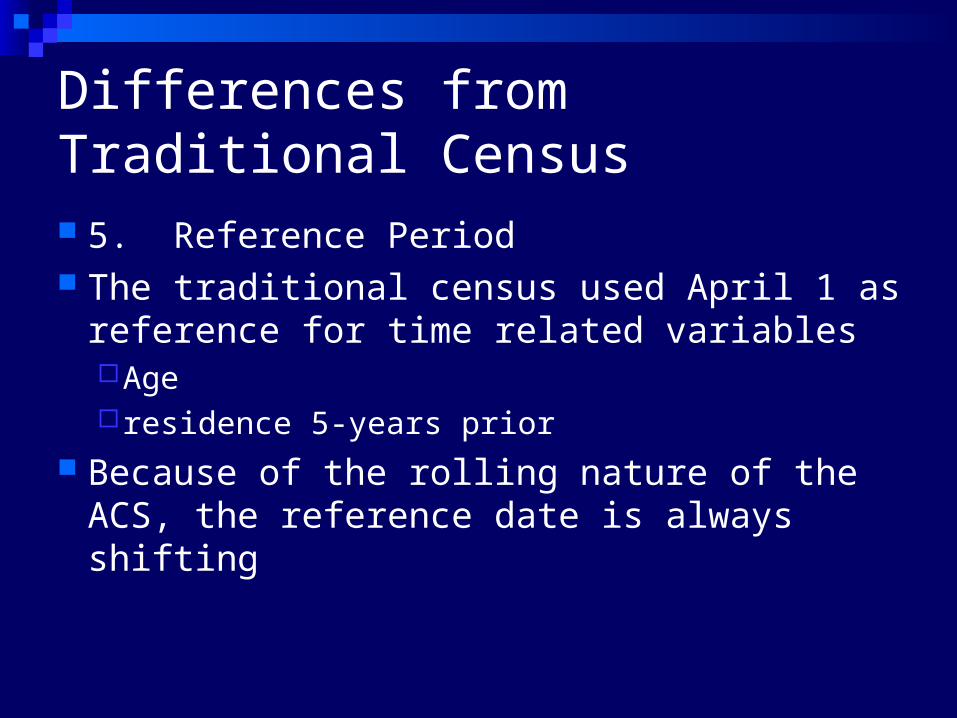
Differences from Traditional Census 5. Reference Period The traditional census used April 1 as
reference for time related variablesAgeresidence 5-years prior
Because of the rolling nature of the ACS, the reference date is always shifting
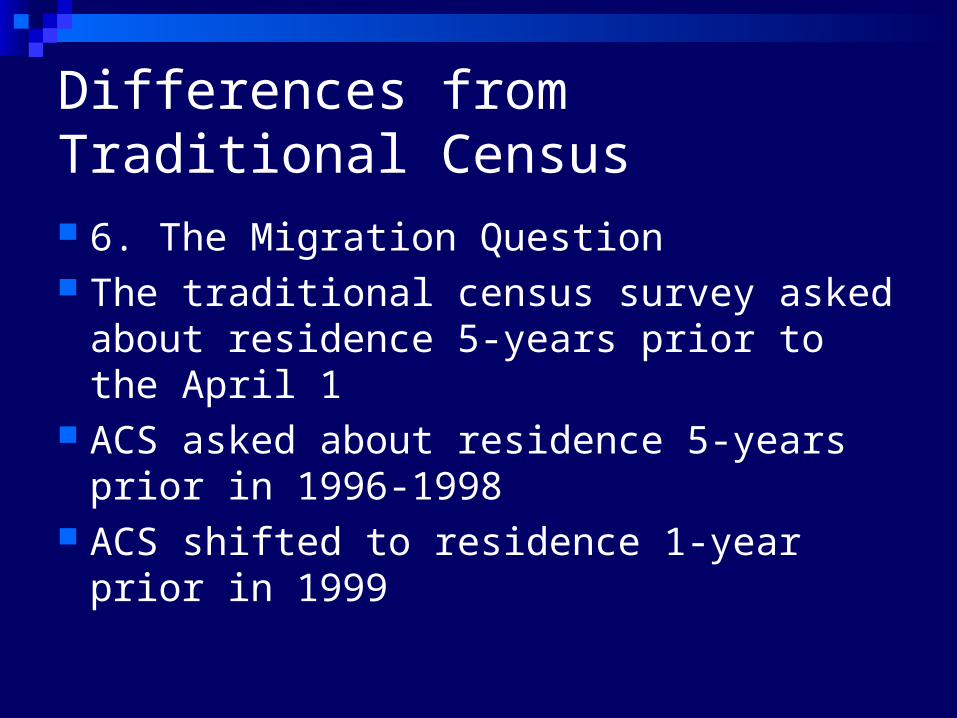
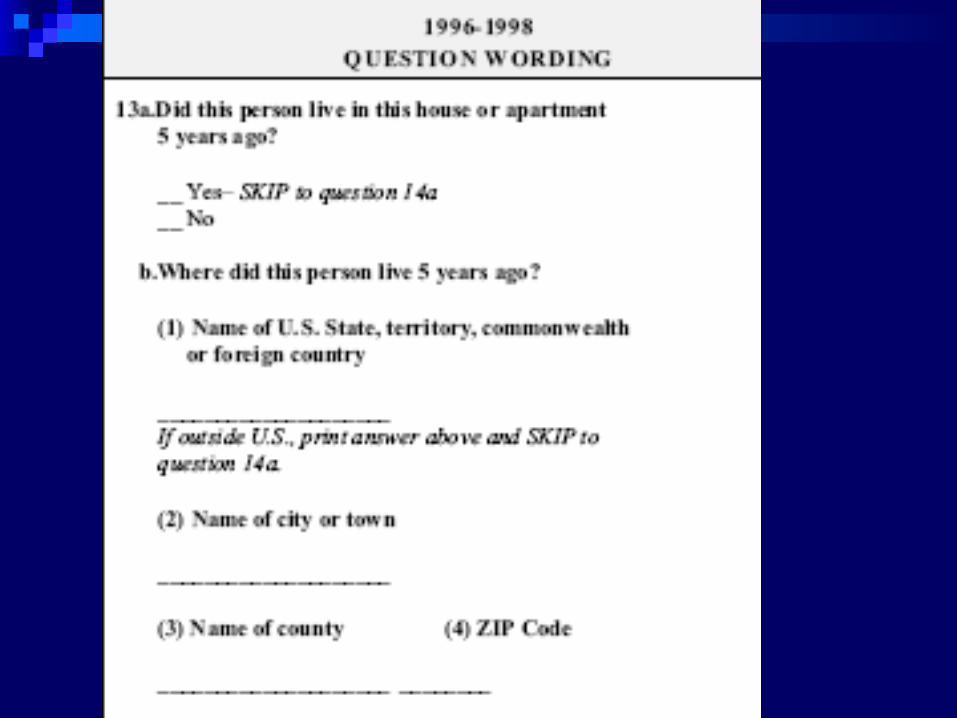
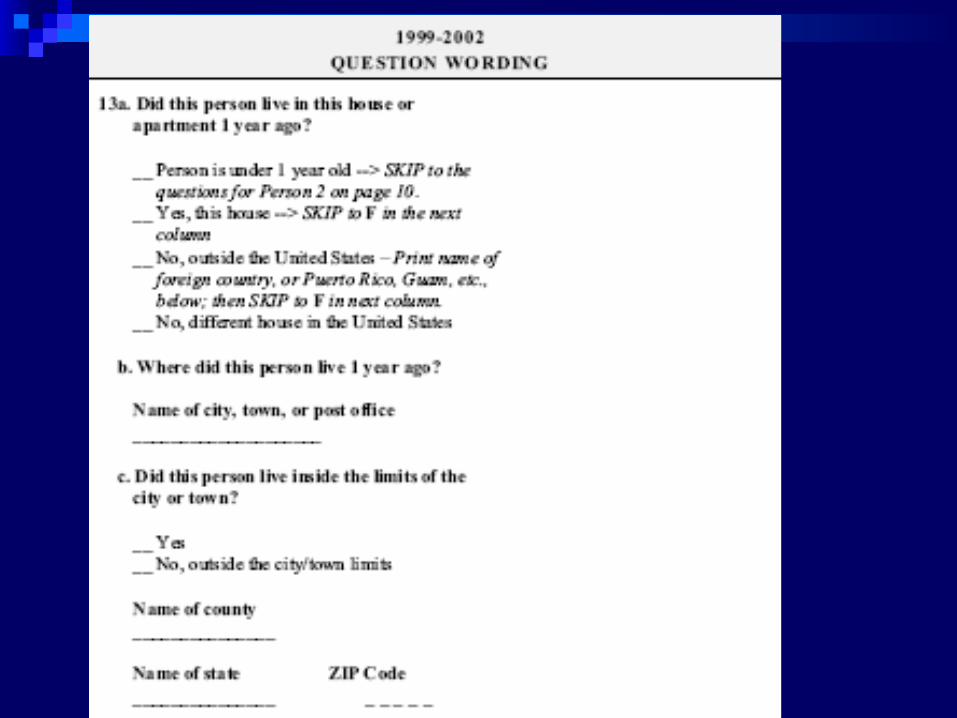
Differences from Traditional Census 6. The Migration Question The traditional census survey asked about
residence 5-years prior to the April 1 ACS asked about residence 5-years prior
in 1996-1998 ACS shifted to residence 1-year prior in
1999

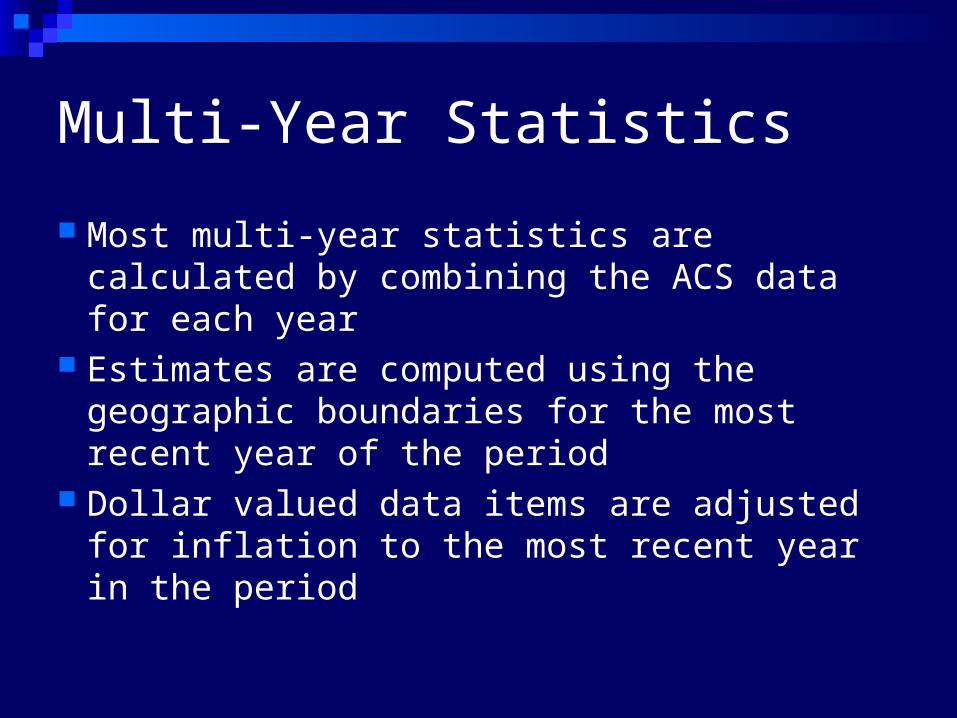
Multi-Year Statistics
Most multi-year statistics are calculated by combining the ACS data for each year
Estimates are computed using the geographic boundaries for the most recent year of the period
Dollar valued data items are adjusted for inflation to the most recent year in the period
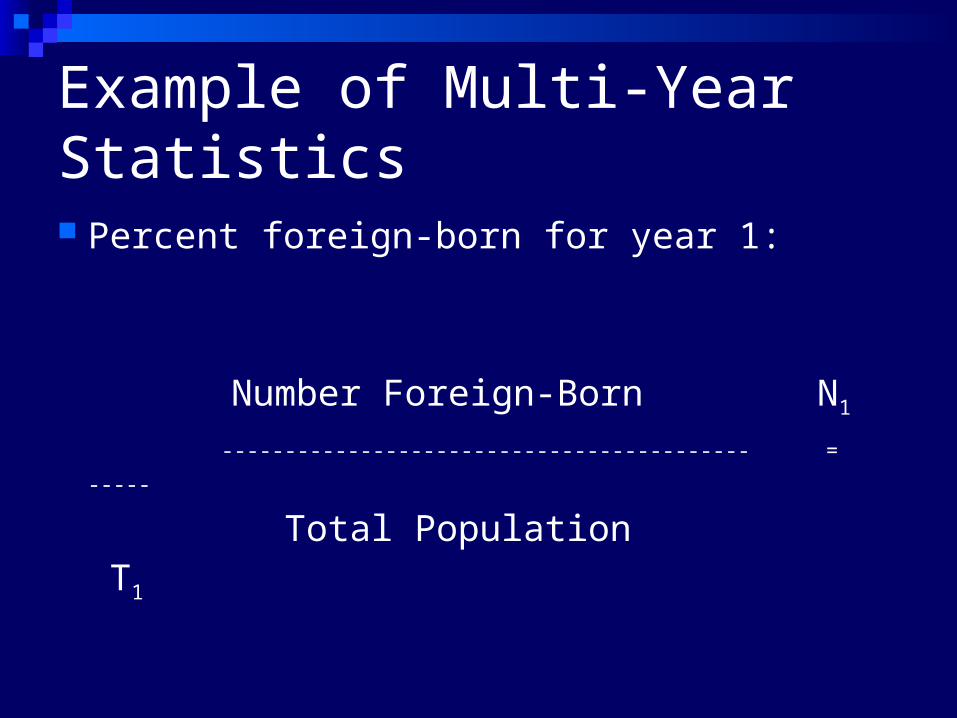
Example of Multi-Year Statistics
Percent foreign-born for year 1:
Number Foreign-Born N1
------------------------------------------ = -----
Total Population T1
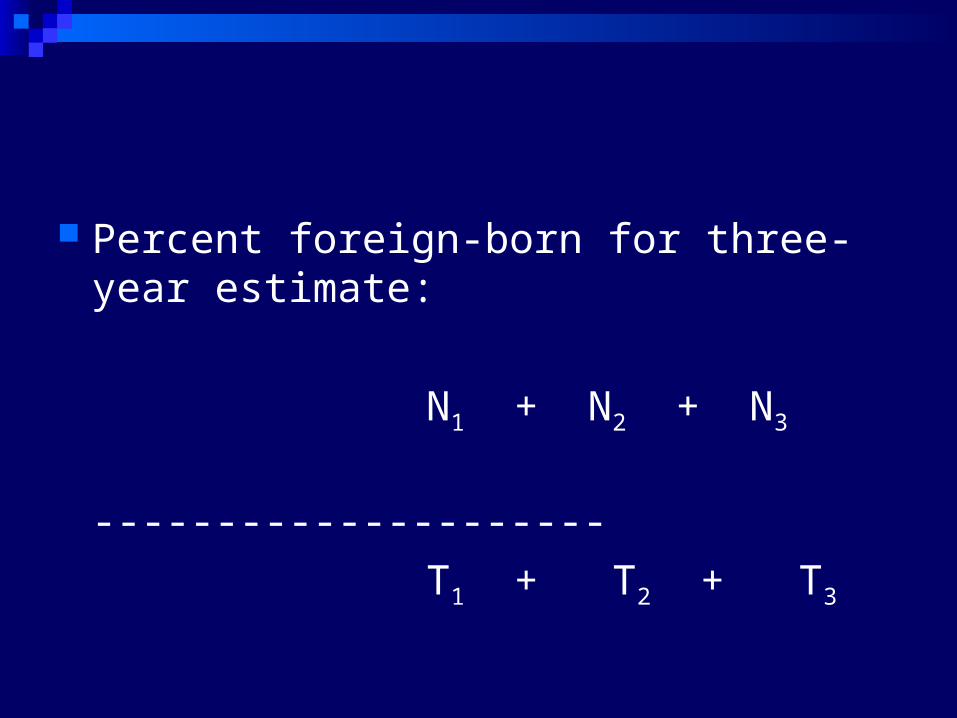
Percent foreign-born for three-year estimate:
N1 + N2 + N3
---------------------
T1 + T2 + T3
Multi-Year Estimates for Median Medians are produced using combined data for
all years Medians in ACS are not produced by taking the
average for medians for each year A 3-year median household income is
calculated by combining the household records for all 3 years, adjusted for inflation, and determining the median from the combined data
Issues with Multi-Year Statistics
Trend analysis for areas of different sizes with different multi-year statistics: single year for states and five-year statistics for census tracts
3 and 5-year statistics smooth changes over time and will not reveal the greater annual fluctuations
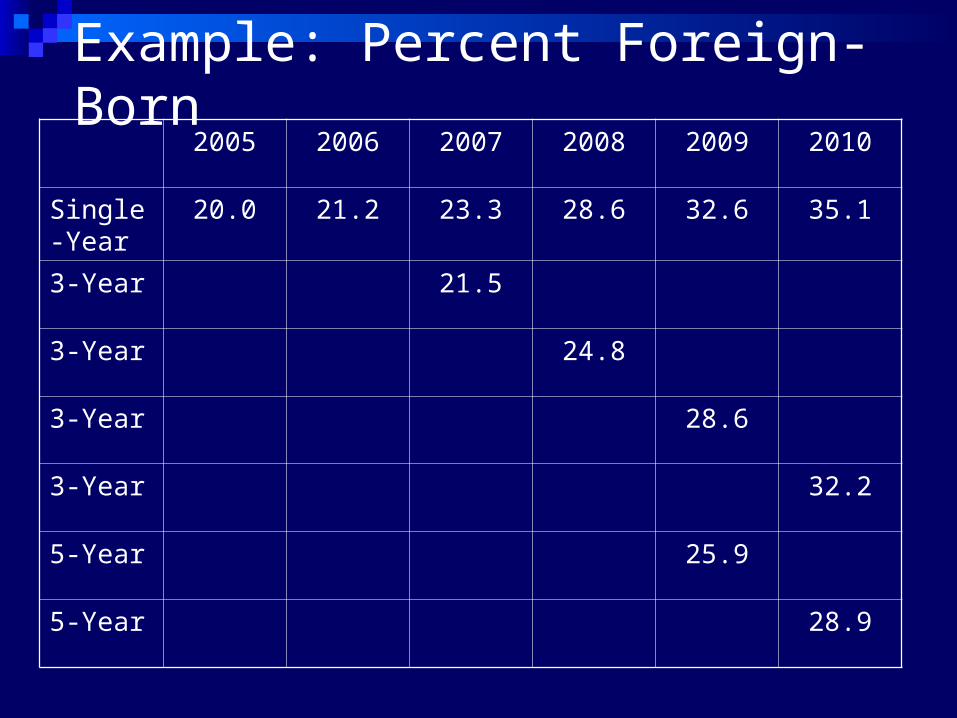
Example: Percent Foreign-Born2005 2006 2007 2008 2009 2010
Single-Year
20.0 21.2 23.3 28.6 32.6 35.1
3-Year 21.5
3-Year 24.8
3-Year 28.6
3-Year 32.2
5-Year 25.9
5-Year 28.9
Interpreting Multi-Year Statistics
Because data users have not had actual experience with multi-year statistics, there is much to learn about practical issues of interpretation
With the availability of multi-year statistics, it will be useful to accumulate case studies that illustrate the best practices for their uses and interpretation
Nonsampling Errors in ACS
Key ones to worry about include biases due to nonobservation, due to noncoverage (incomplete frame for migrant farmworkers, for example) or nonresponse (failure to complete interviews for non-English speakers, for instance)
And biases due to observations: response biases (interviewing, counting, or measuring) and processing biases (coding, tabulating, and computing)
Handling Nonsampling Errors
U.S. Census Bureau staff has long experience with large national survey
Annual report available entitled “Accuracy of the Data”
Protects against nonsampling errors by extensive evaluation
Release occasional papers reporting their studies of nonsampling errors
Concerns about Nonsampling Errors Migrant and seasonal farmworkers: have
traditionally be a very difficult group to cover in decennial census. Ongoing nature of ACS should help
Recent immigrants: often live in complex households, may have concerns about participating in survey, and often have limited English-language proficiency
Sampling Error
ACS data estimates the actual figures that would have been obtained by interviewing the entire population
Sampling error arises due to the use of probability sampling
With proper probability sampling, we can make sample estimates with measures of the deviation of the estimate due (primarily) to sampling errors
Calculation of Standard Errors
ACS website provides additional references on standard errors and their calculation for ACS data
For many users, it would be helpful to include formulas in excel for routine use
Imputation: Substitution
U.S. Census Bureau edits collected data to improve quality
Check for erroneous and missing data items Substitution includes the imputation of an entire
record for a missing housing unit or person Replacement record is usually drawn randomly
from a set of previously processed records Sometimes called “hot-deck” imputation
Imputation: Allocation
Allocations are made to filling missing or incorrect entries
Allocation for missing items is most common when a questionnaire item was left blank
Inconsistency occurs, for example, when a respondent states that they moved to the United States before they were born
Allocation Techniques
In some cases, logical imputation is used to replace a missing item with a response that is based on other items (for example, assuming that a person born in Costa Rica must be Hispanic)
Other items are replaced by random selection from a set of data for similar persons
Reporting on Allocation
ACS website has extensive documentation on the rate of allocation for geographic areas and data items
PUMS data includes allocation flags for data items that can be used for detailed analysis of allocation
With PUMS data, analysis can be replicated for items with non-allocated responses or my using Rubin’s multiple imputation techniques