Embed Size (px)
Citation preview

CELLULAR ATP – A SUPERIOR MEASURE OF ACTIVE BIOMASS FOR BIOLOGICAL WASTEWATER TREATMENT PROCESSES
P. A. Whalen*, P. J. Whalen, D. R. Tracey
LuminUltra Technologies Ltd.
440 King Street, King Tower, Suite 630 Fredericton, New Brunswick
Canada, E3B 5H8 [email protected]
ABSTRACT Biological wastewater treatment processes harness the ability of microorganisms to break down and assimilate organic compounds that, if left untreated, cause detriment to the environment. Although this process occurs naturally, engineered systems are used to accelerate the process by optimizing bioreactor conditions to promote higher-than-typical biomass concentrations, thus increasing the rate of removal of biodegradable substances. However, in part due to the lack of an effective monitoring parameter for living biomass, these systems are rarely able to maximize efficiency and can be prone to debilitating upsets. Through years of research, LuminUltra Technologies Ltd. has developed test kits based on the measurement of Adenosine Triphosphate (ATP) for rapid and accurate monitoring of the concentration and health of living biomass at any location in a biological wastewater treatment system. The focus of this paper is on the advantages of Cellular ATP (cATPTM) as a measure of living biomass concentration compared to conventional parameters such as Mixed Liquor Suspended Solids (MLSS) or Mixed Liquor Volatile Suspended Solids (MLVSS), and will identify the opportunities for improvement through having this superior information. Such opportunities include the ability to optimize Food-to-Microorganism ratios, supplement feed rates, mixing efficiency / load balancing, respirometry analyses, and more. KEYWORDS ATP, adenosine triphosphate, activated sludge, wastewater treatment, process control, biomass, dissolved ATP, total ATP, cellular ATP, biomass stress index, LuminUltraTM, tATPTM, dATPTM, cATPTM, BSITM, ABRTM, biological monitoring, aerobic, anaerobic, active. INTRODUCTION As early as thirty-five years ago, the value of monitoring ATP (adenosine triphosphate) in biological waste treatment was recognized (Paterson et al., 1970). More recently, Archibald et al (2001), in a study using a suite of respirometric tests on mixed liquor from paper mill activated sludge processes, concluded that ATP measurements provided a useful monitor of the proportion of viable cells and a toxicity indicator in an activated sludge process.
3025
WEFTEC®.06
Copyright 2006 Water Environment Foundation. All Rights Reserved©

The continuing scientific interest in ATP monitoring of biological waste treatment processes is not surprising. As the keystone of metabolic activity (Lehninger, 1982), most of the energy within microorganisms is stored and transmitted via ATP. ATP is produced as microbial food and is subsequently utilized for cell maintenance and the synthesis of new cells and biochemicals. Furthermore, ATP can be easily measured with high specificity by the firefly luciferase assay. The reaction is as follows:
lightinoxyluciferPPiAMPluciferinOATP luciferaseMg
+++⎯⎯⎯ →⎯++++
2 Where, ATP = Adenosine triphosphate AMP = Adenosine monophosphate PPi = pyrophosphate Mg++ = Magnesium ion The chemical energy produced from the breakdown of ATP is converted into light energy. Each molecule of ATP consumed in the reaction produces one photon of light. This light output can be quantified using a luminometer within a matter of seconds. Although ATP is vital to all wastewater treatment microorganisms and the measurement process described is simple, ATP has not been routinely adopted as a process parameter in operating wastewater treatment plants. Possible reasons for lack of routine use include the following: • Instability of reagents; • Ineffective or cumbersome ATP extraction techniques for wastewater treatment samples; • Lack of test protocols optimized for wastewater treatment applications; • Insufficient monitoring guidelines. Furthermore, it is frequently assumed that ATP is only found within living cells. Typically, during ATP analyses, samples from waste treatment plants are immersed into an extraction agent such as boiling buffer (Paterson et al, 1971 ), organic solvents (Lefebvre, 1988), proprietary surfactant solutions, or acid solvents (Archibald, 2001) with no separation of the microorganisms from the liquid portion of the sample. Thus, if the sample included any extracellular ATP, it would not be distinguished from ATP contained within the living cells (i.e. intracellular ATP). Archibald et al. (2001) note that pulp and paper mill wastewaters contain many non-biological solids that are poorly or non-biodegradable, which can accumulate in the floc of a biological waste treatment process. Doubtless, this occurs in other wastewater treatment systems. Therefore, conventional measurements such as mixed-liquor suspended solids (MLSS) or mixed-liquor volatile suspended solids (MLVSS) can provide misleading information about the amount of viable biomass in the reactors. Furthermore, these measurements do not distinguish between
3026
WEFTEC®.06
Copyright 2006 Water Environment Foundation. All Rights Reserved©
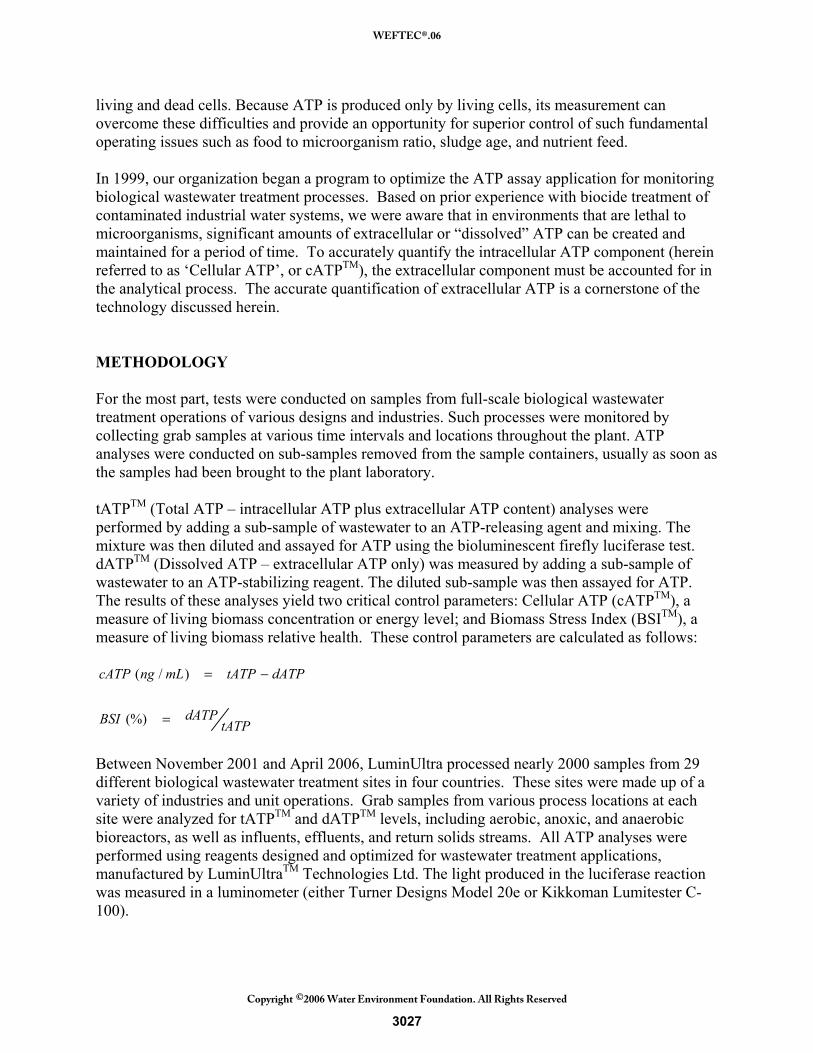
living and dead cells. Because ATP is produced only by living cells, its measurement can overcome these difficulties and provide an opportunity for superior control of such fundamental operating issues such as food to microorganism ratio, sludge age, and nutrient feed. In 1999, our organization began a program to optimize the ATP assay application for monitoring biological wastewater treatment processes. Based on prior experience with biocide treatment of contaminated industrial water systems, we were aware that in environments that are lethal to microorganisms, significant amounts of extracellular or “dissolved” ATP can be created and maintained for a period of time. To accurately quantify the intracellular ATP component (herein referred to as ‘Cellular ATP’, or cATPTM), the extracellular component must be accounted for in the analytical process. The accurate quantification of extracellular ATP is a cornerstone of the technology discussed herein. METHODOLOGY For the most part, tests were conducted on samples from full-scale biological wastewater treatment operations of various designs and industries. Such processes were monitored by collecting grab samples at various time intervals and locations throughout the plant. ATP analyses were conducted on sub-samples removed from the sample containers, usually as soon as the samples had been brought to the plant laboratory. tATPTM (Total ATP – intracellular ATP plus extracellular ATP content) analyses were performed by adding a sub-sample of wastewater to an ATP-releasing agent and mixing. The mixture was then diluted and assayed for ATP using the bioluminescent firefly luciferase test. dATPTM (Dissolved ATP – extracellular ATP only) was measured by adding a sub-sample of wastewater to an ATP-stabilizing reagent. The diluted sub-sample was then assayed for ATP. The results of these analyses yield two critical control parameters: Cellular ATP (cATPTM), a measure of living biomass concentration or energy level; and Biomass Stress Index (BSITM), a measure of living biomass relative health. These control parameters are calculated as follows:
dATPtATPmLngcATP −=)/(
tATPdATPBSI =(%)
Between November 2001 and April 2006, LuminUltra processed nearly 2000 samples from 29 different biological wastewater treatment sites in four countries. These sites were made up of a variety of industries and unit operations. Grab samples from various process locations at each site were analyzed for tATPTM and dATPTM levels, including aerobic, anoxic, and anaerobic bioreactors, as well as influents, effluents, and return solids streams. All ATP analyses were performed using reagents designed and optimized for wastewater treatment applications, manufactured by LuminUltraTM Technologies Ltd. The light produced in the luciferase reaction was measured in a luminometer (either Turner Designs Model 20e or Kikkoman Lumitester C-100).
3027
WEFTEC®.06
Copyright 2006 Water Environment Foundation. All Rights Reserved©
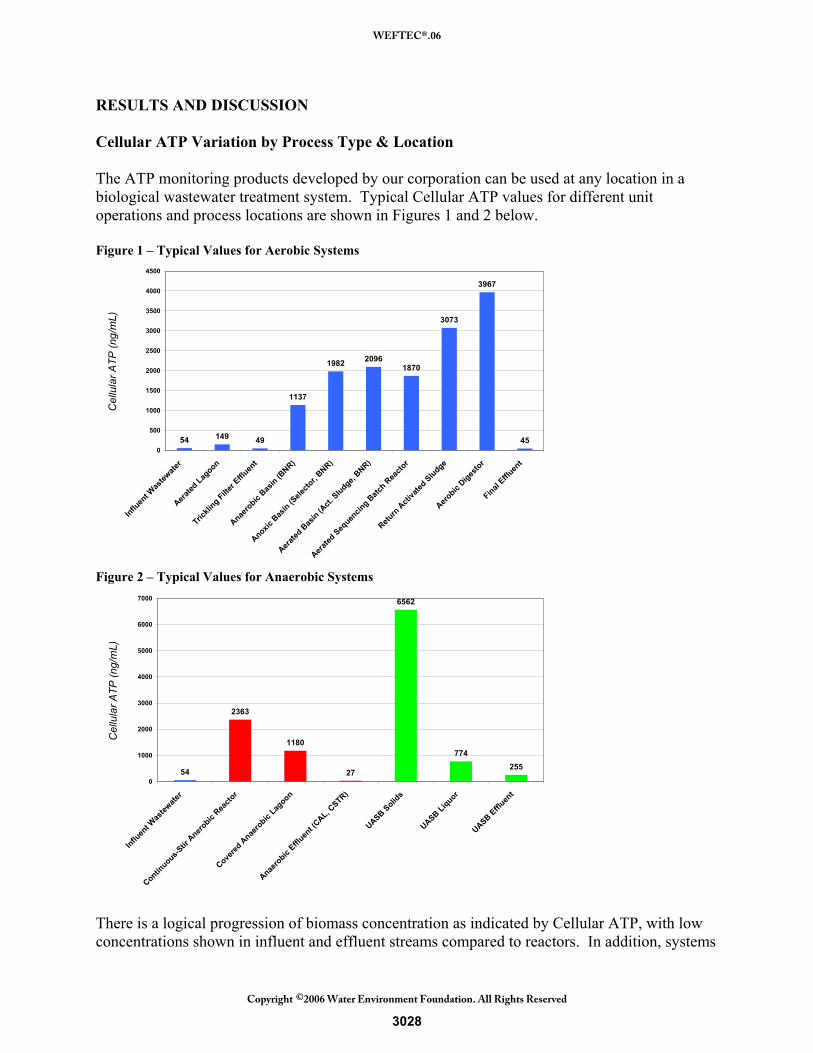
RESULTS AND DISCUSSION Cellular ATP Variation by Process Type & Location The ATP monitoring products developed by our corporation can be used at any location in a biological wastewater treatment system. Typical Cellular ATP values for different unit operations and process locations are shown in Figures 1 and 2 below. Figure 1 – Typical Values for Aerobic Systems
54 149 49
1137
1982 20961870
3073
3967
450
500
1000
1500
2000
2500
3000
3500
4000
4500
Influen
t Was
tewate
r
Aerated
Lagoon
Trickli
ng Filter E
ffluen
t
Anaero
bic Bas
in (BNR)
Anoxic B
asin (S
electo
r, BNR)
Aerated
Bas
in (Act.
Sludge, BNR)
Aerated
Sequen
cing B
atch R
eacto
r
Return
Acti
vated
Sludge
Aerobic
Digestor
Final Efflu
ent
Cel
lula
r ATP
(ng/
mL)
Figure 2 – Typical Values for Anaerobic Systems
54
2363
1180
27
6562
774255
0
1000
2000
3000
4000
5000
6000
7000
Influen
t Was
tewate
r
Continuous-S
tir A
nerobic
Reacto
r
Covered
Anae
robic
Lagoon
Anaero
bic Efflu
ent (C
AL, CSTR)
UASB Solids
UASB Liquor
UASB Effluen
t
Cel
lula
r ATP
(ng/
mL)
There is a logical progression of biomass concentration as indicated by Cellular ATP, with low concentrations shown in influent and effluent streams compared to reactors. In addition, systems
3028
WEFTEC®.06
Copyright 2006 Water Environment Foundation. All Rights Reserved©

that utilize recycle streams or other means for biomass concentration and retention have substantially higher levels than do once-through systems. Because it is not a direct indicator of living biomass, the use of MLSS for such a purpose can often lead to misleading conclusions. Figure 3 shows the progression of Cellular ATP levels through a plug-flow, series-arranged aerated lagoon system: Figure 3 – Biomass Concentration Progression through a Series-Arranged Aerated Lagoon System
Lagoon #1 Lagoon #2Influent Effluent
cATPTM = 339 ng/mL cATPTM = 276 ng/mL cATPTM = 42 ng/mL
There is a logical drop of living biomass concentration as food (BOD) becomes exhausted as the wastewater flows through the system. Figure 4 compares the food, living biomass, and total solids concentrations in the same two reactors: Figure 4 – Comparison of COD, cATPTM, and MLSS in a Series-Arranged Aerated Lagoon System
0
200
400
600
800
1000
1200
1400
Influent COD(mg/L)
cATP™ (ng/mL) MLSS (mg/L)
Mea
n Va
lue
(uni
ts)
Primary Reactor
Secondary Reactor
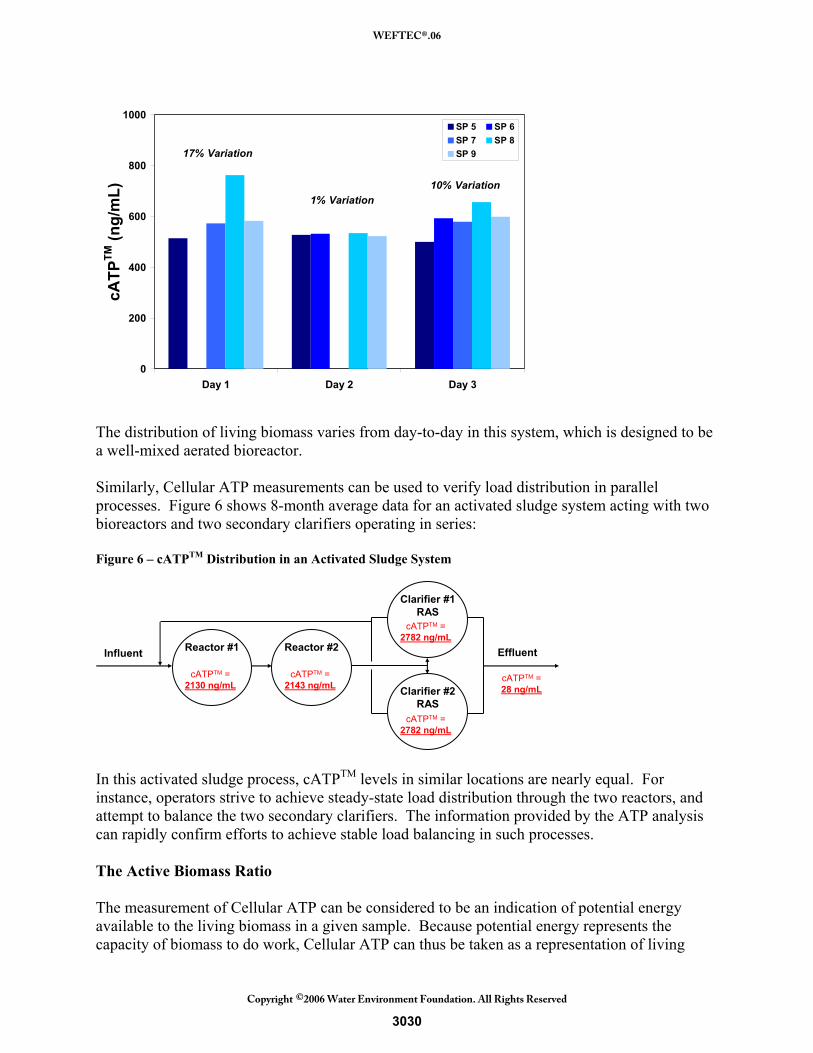
The response of Cellular ATP to the decrease in available food is logical, whereas the MLSS increase is contrary to the expected behavior. This result is due to the secondary reactor being used as a sedimentation basin, accumulating solids prior to effluent discharge. Verifying Mixing Efficacy and Load Distribution using Cellular ATP Because it is specific to living biomass, Cellular ATP measurements can be used as an interference-free tracer to evaluate the distribution of biomass in a bioreactor. Figure 5 demonstrates this function for an aerated lagoon over the course of three days at 5 sample points: Figure 5 – cATPTM Evaluation of Aerated Lagoon Mixing Efficiency
3029
WEFTEC®.06
Copyright 2006 Water Environment Foundation. All Rights Reserved©
0
200
400
600
800
1000
Day 1 Day 2 Day 3
cATP
TM (n
g/m
L)SP 5 SP 6SP 7 SP 8SP 917% Variation
1% Variation10% Variation
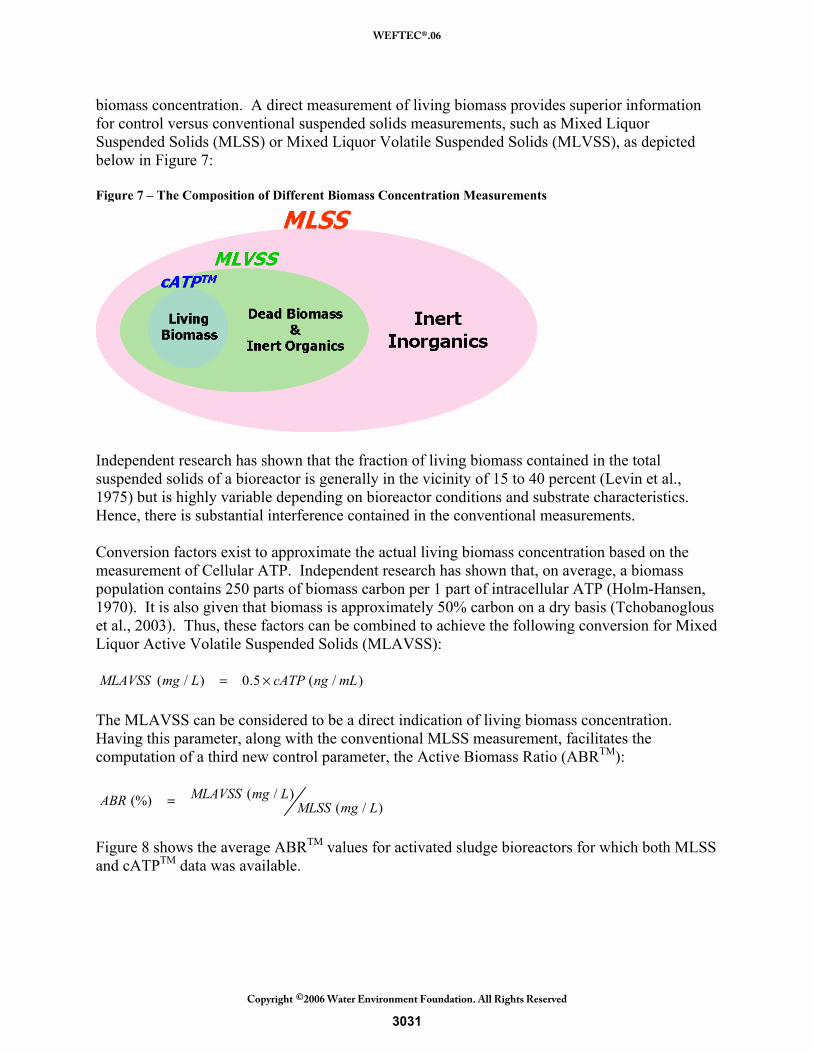
The distribution of living biomass varies from day-to-day in this system, which is designed to be a well-mixed aerated bioreactor. Similarly, Cellular ATP measurements can be used to verify load distribution in parallel processes. Figure 6 shows 8-month average data for an activated sludge system acting with two bioreactors and two secondary clarifiers operating in series: Figure 6 – cATPTM Distribution in an Activated Sludge System
Reactor #1 Reactor #2
Clarifier #1RAS
Clarifier #2RAS
Influent
cATPTM =2130 ng/mL
cATPTM =2143 ng/mL
cATPTM =2782 ng/mL
cATPTM =2782 ng/mL
Effluent
cATPTM =28 ng/mL
In this activated sludge process, cATPTM levels in similar locations are nearly equal. For instance, operators strive to achieve steady-state load distribution through the two reactors, and attempt to balance the two secondary clarifiers. The information provided by the ATP analysis can rapidly confirm efforts to achieve stable load balancing in such processes. The Active Biomass Ratio The measurement of Cellular ATP can be considered to be an indication of potential energy available to the living biomass in a given sample. Because potential energy represents the capacity of biomass to do work, Cellular ATP can thus be taken as a representation of living
3030
WEFTEC®.06
Copyright 2006 Water Environment Foundation. All Rights Reserved©
biomass concentration. A direct measurement of living biomass provides superior information for control versus conventional suspended solids measurements, such as Mixed Liquor Suspended Solids (MLSS) or Mixed Liquor Volatile Suspended Solids (MLVSS), as depicted below in Figure 7: Figure 7 – The Composition of Different Biomass Concentration Measurements
Independent research has shown that the fraction of living biomass contained in the total suspended solids of a bioreactor is generally in the vicinity of 15 to 40 percent (Levin et al., 1975) but is highly variable depending on bioreactor conditions and substrate characteristics. Hence, there is substantial interference contained in the conventional measurements. Conversion factors exist to approximate the actual living biomass concentration based on the measurement of Cellular ATP. Independent research has shown that, on average, a biomass population contains 250 parts of biomass carbon per 1 part of intracellular ATP (Holm-Hansen, 1970). It is also given that biomass is approximately 50% carbon on a dry basis (Tchobanoglous et al., 2003). Thus, these factors can be combined to achieve the following conversion for Mixed Liquor Active Volatile Suspended Solids (MLAVSS):
)/(5.0)/( mLngcATPLmgMLAVSS ×= The MLAVSS can be considered to be a direct indication of living biomass concentration. Having this parameter, along with the conventional MLSS measurement, facilitates the computation of a third new control parameter, the Active Biomass Ratio (ABRTM):
)/()/((%) LmgMLSS
LmgMLAVSSABR = Figure 8 shows the average ABRTM values for activated sludge bioreactors for which both MLSS and cATPTM data was available.
3031
WEFTEC®.06
Copyright 2006 Water Environment Foundation. All Rights Reserved©

Figure 8 – ABRTM Averages of Sites by Industry for Activated Sludge Bioreactors
27.5%
22.0%
30.1%
50.9%
34.9%
6.5%
36.7%
23.3%
52.4%
56.0%
19.7%
29.8%28.2%
32.1%
5.5%
8.0%
20.3% 20.2%
25.4%
17.7%19.7%
38.8%
29.8%
0%
10%
20%
30%
40%
50%
60%A
ctiv
e B
iom
ass
Rat
io (%
)
Food Processing Municipal Sewage Pulp & Paper
The shaded area represents the 15 to 40 percent range of living to total solids cited by the mentioned research, and it is apparent that the majority of values fall in this range. However, the most striking characteristic of this figure is the variability of the ABRTM, demonstrating the insensitivity of the MLSS as an indicator of living biomass concentration and suggesting opportunities for improvement in most facilities. For comparison purposes, Figure 9 shows that a higher MLSS number does not always ensure the predominance of high living biomass proportions: Figure 9 – ABRTM versus MLSS for Municipal Activated Sludge Operations
36.7%
23.3%
52.4%
56.0%
19.7%
29.8%28.2%
32.1%
5.5%
8.0%1000
1100
1444
1858
25002671
3600
3978
5000 5000
0%
10%
20%
30%
40%
50%
60%
Act
ive
Bio
mas
s R
atio
(%)
0
1000
2000
3000
4000
5000
6000
MLS
S (m
g/L)
Figure 10 shows the overall minimum, average, and maximum ABRTM by waste type.
3032
WEFTEC®.06
Copyright 2006 Water Environment Foundation. All Rights Reserved©

Figure 10 – Overall ABRTM Average by Waste Type
34.5%31.1%
25.9%
0.0%
10.0%
20.0%
30.0%
40.0%
50.0%
60.0%
Food Processing Effluent Municipal Sewage Pulp & Paper Effluent
Waste Type
Act
ive
Bio
mas
s R
atio
(%)
Min Average Max Because of the relative availability of soluble COD typically coupled with low levels of toxins and the relatively high proportion of biodegradable solids, it is not surprising that the average ABRTM for food processing wastewater is the highest. In practice, it is generally accepted that the most advantageous scenario for operation is to minimize the dead or inert solids contained in a bioreactor, as this ensures the greatest mass transfer efficiency for metabolic components to support the living population, as well as ensuring that inefficient digestion of dead biomass does not occur. Thus, optimum conditions are achieved with the ABRTM is at a maximum. Opportunities for Process Improvement using Cellular ATP The opportunities for process improvement by having a true indicator of living biomass are vast. Because living biomass is the engine driving biological wastewater treatment processes, their concentration and health are directly linked to process performance. Performance is usually described as the efficiency of removal of carbon-based constituents in wastewater, quantified by Chemical Oxygen Demand (COD) or Biochemical Oxygen Demand (BOD) measurements. Figure 11 compares the Cellular ATP concentration against performance over a 9-month period for one aerobic bioreactor treating pulp and paper effluent:
3033
WEFTEC®.06
Copyright 2006 Water Environment Foundation. All Rights Reserved©

Figure 11 – Comparison of cATPTM to Process Performance for an Aerobic Bioreactor
In the face of various factors that were identified as limiting over the course of the 9-months of monitoring, the Cellular ATP concentration was shown to be very closely related to performance. Changes in performance occur as a direct result of changes in biomass concentration. Thus, the operator can apply analytical techniques to identify the factors affecting the biomass and optimize the limiting factors, thus maximizing process efficiency. For a typical activated sludge process, Cellular ATP is a central process control parameter, as shown in Figure 12. Figure 12 – Activated Sludge Process Control Schematic
AerobicReactor
Air
F/M
BSIcATP
COD
F/MF/MF/M
BSIcATP
COD
Macronutrients
RawWastewater
FinalEffluent
SludgeDigester
ToBoiler
CH4/CO2
BiodegradableCarbon
RAS WAS
Clarifier
Level
RawWastewater
FinalEffluent
SludgeDigester
ToBoiler
CH4/CO2
BiodegradableCarbon
RAS WAS
Clarifier
LevelO2O2O2O2
Monitoring cATPTM and its surrogate health measurement, BSITM, facilitates accurate knowledge of living biomass characteristics and subsequent tuning of such critical operating parameters as Food-to-Microorganism control, aeration pacing, and macronutrient pacing, among other process inputs.
3034
WEFTEC®.06
Copyright 2006 Water Environment Foundation. All Rights Reserved©

Optimization of biological wastewater treatment processes can lead to improved stability, better cost efficiency, and a reduction or elimination of debilitating upsets. For example, a comparison of the ABRTM for three similar processes (activated sludge) treating similar wastewater (pulp & paper) in Figure 13 demonstrates how striving to maintain a higher fraction of living biomass corresponds to improved solids settlability: Figure 13 – Comparing ABRTM to SVI for Three Activated Sludge Pulp & Paper Facilities
18.8%
25.1%
34.0%
226
146
69
0.0%
10.0%
20.0%
30.0%
40.0%
50.0%
Quebec Mill Nova Scotia Mill New Brunswick Mill
Site
Act
ive
Bio
mas
s R
atio
(%)
0
50
100
150
200
250
Slud
ge V
olum
e In
dex
(mL/
g)ABR (%) SVI (mL/g)
Similarly, Figure 14 reveals how a shorter Solids Retention Time (SRT) can promote a more efficient and vigorous population: Figure 14 – Comparing Biomass Age & Efficiency Three Activated Sludge Pulp & Paper Facilities
9.1
10.5
11.01.77
1.66
1.23
8.0
9.0
10.0
11.0
12.0
Quebec Mill Nova Scotia Mill New Brunswick Mill
Site
Solid
s R
eten
tion
Tim
e (d
ays)
1
1.2
1.4
1.6
1.8
2
Ton
CO
D R
emov
ed p
er T
on B
iom
ass
SRT Delta COD / Biomass
3035
WEFTEC®.06
Copyright 2006 Water Environment Foundation. All Rights Reserved©

Finally, Figure 15 shows an example where the impact of an influent pH drop from 7 to 4 is immediately shown by a 40% reduction in cATPTM (i.e. biomass kill). The drop in MLSS is substantially more gradual. Figure 15 – Example of a Process Change confirmed by cATPTM and not MLSS
0
500
1000
1500
2000
2500
3000
3500
4000
28-Apr-05 5-May-05 12-May-05 19-May-05 26-May-05 2-Jun-05 9-Jun-05 16-Jun-05
cATP
TM (n
g/m
L), M
LSS
/2 (m
g/L)
0.00
1.00
2.00
3.00
4.00
5.00
6.00
7.00
8.00
pH
Degas cATP (ng/mL) Degas MLSS/2 (mg/L) Influent pH The rapid response of Cellular ATP to this event related directly to a sustained release of ammonia in the process effluent, resulting in a permit violation for the facility. The most important benefit to having an accurate measure of living biomass in biological systems is the ability to develop meaningful cause and effect relationships with key process inputs, such as:
• Aeration requirements; • Macronutrient or biostimulant supplementation requirements; • Food-to-Microorganism ratio; • Solids retention time; • Temperature; • pH; • Solids settlability.
Establishing meaningful relationships will result in opportunities for process improvement in terms of upset avoidance and cost savings, with a minimal investment. Other benefits include the provision of a more accurate normalizing parameter in respiration rate measurements (e.g. DOUR) and for load balancing in systems with multiple parallel reactors, such as advanced Biological Nutrient Removal (BNR) processes.
3036
WEFTEC®.06
Copyright 2006 Water Environment Foundation. All Rights Reserved©

CONCLUSIONS Accurate assessment of living biomass concentration is critical to stable biological wastewater treatment operations. The measurement of Total and Dissolved ATP in a biological wastewater treatment sample can tell within minutes the potential energy and health of the living biomass contained in the sample. The potential energy, as defined by Cellular ATP, can be further converted to an actual living biomass concentration, and through a ratio with the Mixed Liquor Suspended Solids, can define the percentage of living biomass contained in the total solids. Having this information allows the operator to take measures to optimize the concentration, health, and viability of the bioreactor through statistical process analyses on the data generated from such a technology, facilitating easy troubleshooting and continual process improvement. REFERENCES Patterson, J.W.; Brezonik, P.L.; Putnam, H.D. (1970) Measurement and significance of
adenosine triphosphate in activated sludge. Environ. Sci. Technol. 4(7) 569-575. Levin, G. V.; Schrot, J. R.; Hess, W. C. (1975) Methodology for application of adenosine
triphosphate determination in wastewater treatment. Environ. Sci. Technol. 9(10), 961–965.
Lehninger A. L. (1982) Principles of Biochemistry, Part II, 1011 pp. Worth Pubs. Inc., New York, USA.
Lefebrve, Y.; Coulture, P.; Couillard, D. (1988). An analytical procedure for the measurement of ATP extracted from activated sludge. Can. J. Microbiol. 34, 1275-1279.
Archibald, F.; Me´thot, M.; Young, F.; Paice, M. G. (2001). A Simple System to Rapidly Monitor Activated Sludge health and performance. Wat. Res. 35 (10) 2543 –2553.
Holm-Hansen, O. (1970). ATP Levels in Algal Cells as Influenced by Environmental Conditions. Plant and Cell Physiology.
Tchobanoglous, G.; Burton, F.; Stensel, H.; Wastewater Engineering: Treatment & Reuse. Metcalf & Eddy, 2003, P. 558.
3037
WEFTEC®.06
Copyright 2006 Water Environment Foundation. All Rights Reserved©