Embed Size (px)
Citation preview
第 41 屆海洋工程研討會論文集 國立成功大學 2019 年 11 月 Proceedings of the 41th Ocean Engineering Conference in Taiwan National Cheng Kung University, November 2019
無人機光達系統應用於沙岸與藻礁地區之波浪能量消散之研究
葉正陽 1 黃志誠 2
1國立中央大學水文與海洋研究所碩士生 2國立中央大學水文與海洋研究所副教授
摘要 波浪淺化過程中,波浪能量消散來自於碎波與底床摩擦力消散。摩擦力消散與底床粗糙度
呈正相關,許多研究發現粗糙的珊瑚礁造成的摩擦力能量消散,比碎波能量消散顯著。然而傳
統測量能量消散需要佈置多台水文儀器,且底床粗糙度不易取得。本研究使用無人機光達系統
測量藻礁區和沙岸一個潮汐高潮的能量消散,並於乾潮時量測兩者底床的粗糙度。比較無人機
與壓力計量測的誤差,水深與示性波高的均方根為 4公分與 9公分,證實無人機測量誤差小。無人機測量結果顯示,藻礁區的波浪能量消散低於 5 Wm-1,沙岸區域低於 15 Wm-1 ,且能量
消散隨著潮汐增高而減少。無人機量測藻礁的粗糙度為 19公分,沙岸的粗糙度為 5公分,參數化摩擦力能量消散後顯示,藻礁區摩擦消散占總消散能量比例大於 70%,然而沙岸區僅最高 42%,
藻礁區主要是摩擦力消散。參數化碎波能量消散顯示,藻礁區碎波能量占總消散率低於 1%,沙岸區碎波能量消散占 60%以上,沙岸區主要是碎波能量消散。本系統能量測海浪消散率與底床
粗糙度,並能獲得主要能量消散來源,相較於傳統佈置壓力計量測能量消散,無人機提供一個
快速且精準的一個方法。
關鍵詞:無人飛行載具、光達、波浪能量消散、藻礁
A UAV-RTK-Lidar System Measurements of Wave Energy Dissipation over a Sandy Beach and an Algal-
reef Area
Cheng-Yang Yeh * Zhi-Cheng Huang * Master Student, Graduate Institute of Hydroulic and Oceanic Science, National Central University
ABSTRACT
Wave energy dissipation rate is a significant factor affecting coastal hydrodynamics, morphology, and ecology. However, it is difficult to be measured since accurate and spatial-distributed measurements of sea surface elevations are required to compute this quantity. We used a UAV-RTK-Lidar system to test the possibility for measurements of wave energy dissipation rate. Two field experiments of measuring energy dissipation rates over algal-reef and sandy beach site were conducted. Nine and eight flights of UAV measurements on the algal reef and sandy beach were conducted in 8 and 7 hours for one tidal cycle. The measurements of wave properties such as the wave height, wave period, and wave energy flux by UAV were compared with those of in-situ instruments using pressure sensors. The Root Mean Square (RMS) errors for measurements of water depth and significant wave height between the two techniques are 3 cm and 9 cm over the algal reef and are 4 cm and 9 cm over the sandy beach, respectively. The results of wave energy dissipation over the algal reef are within 5 Wm-1 and are within 15Wm-1 over the sandy beach. The energy dissipation is higher at low tide, while it is lower at high tide. We also used the system to observe the bottom roughness at the two sites for quantifying the frictional dissipation. The results show that more than 70% of the total energy
-66-
dissipation is attributed to the bottom friction on the algal reef, while that is only 42% on the sandy beach. UAV-recorded images were analysed to determine the breaking conditions on the sea surface. Wave breaking occurs more frequently on the sandy beach than that on the algal reef. The UAV-lidar system provides a great potential to quantify the wave energy dissipation remotely and efficiently in fields.
Keywords: Unmanned Aerial Vehicle; Lidar; Wave Energy Dissipation; Algal Reef
1. Introduction Wave energy dissipation is a significant factor
affecting coastal hydrodynamics (Janssen and Battjes
2007), coastline morphology, wave height transformation (Thornton and Guza 1983), and the
nutrient uptake in the coral reef (Thomas and Atkinson 1997). To quantify the wave energy dissipation, several
deployments of in-situ instruments are required. However, it is difficult to deploy such spatial-
distributed instruments in the field since the deployment requires a lot of manpower and time.
Huang et al. (2012) used an airborne Light Detection and Ranging System (Lidar) to quantify the sea surface
elevation and derived the wave energy dissipation. It showed the potential of using the Lidar instrument to
observe the spatial distribution of energy flux and the energy dissipation. With the development of the
Unmanned-Aerial-Vehicle (UAV) industry, the UAV is compact, low-cost, ready-to-use, and with a wide range
of versatility. Compared to the large aircraft, UAV could be a suitable carrier for some specific field sites.
The UAV is rapid-response in the experiment, and it can fly at a very low altitude, and thus it provides great
flexibility on the arrangement. The preparation of the UAV before the experiment is more efficient than one
of the large aircraft since the application of flight permission takes a long time. Another advantage of
using a large UAV is that it can carry a small scale of Lidar. Therefore, the usage of UAV extends to the
range measurement including canopy height (Sankey et al. 2017), water level (Bandini et al. 2017), and wave
properties (Huang et al. 2018). It has been proved that the UAV-RTK-Lidar system, which is developed by
Huang et al. (2018), is qualified for the measurement of tide elevation, significant wave height, and wave
energy spectrum.
We used the UAV-RTK-Lidar system, developed by Huang et al. (2018), to measure the wave energy
dissipation in two areas on the day of 254 and 255 in 2018. One is the Guanxin Algal Reef Conservation Park
(觀新藻礁保護區), the other one is a sandy beach, which is at the 1.2 km South of the Yongan Harbor (永
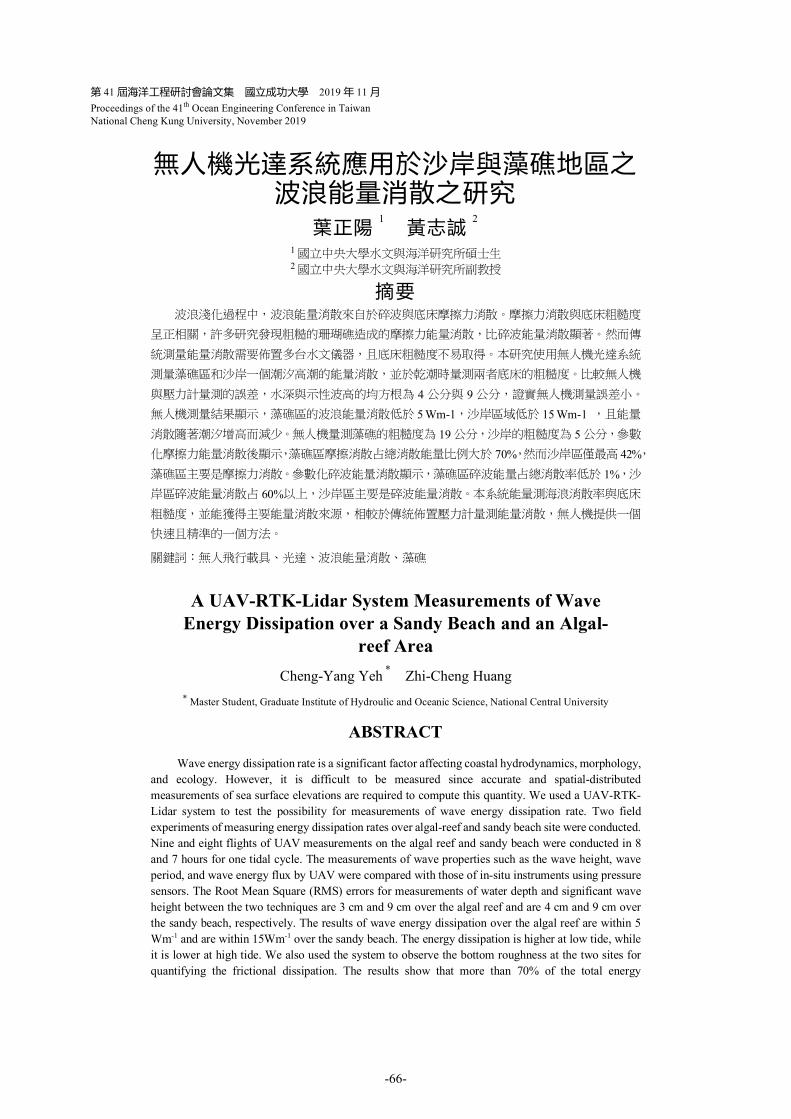
安漁港). Figure 1 is the photo of the UAV-RTK-Lidar system, and it is an assembly of Global Position System
(GPS), Inertial Measurement Unit (IMU), and Lidar.
Figure 1: The UAV-RTK-Lidar system developed by
Huang et al. (2018)
2. Methodology The wave energy dissipation 𝐷 is calculated from
the difference of the energy flux 𝑑𝐹 over the distance
between two locations 𝑑𝑥 and the wave direction 𝜃, which is shown below
𝐷 =−𝑑𝐹
𝑑𝑥 ⋅ 𝑐𝑜𝑠 𝜃.( 1 )
We used the UAV-RTK-Lidar to measure the
wave elevation and calculate the wave energy and the weighted group speed. The energy flux 𝑑𝐹 is
calculated from the wave energy and the weighted group speed. The system measured two locations in one
-67-
flight to acquire the difference of the energy flux. Therefore, we set the UAV system to measure a 3-
minutes wave elevation at the outer location first and then measure another 3-minutes wave elevation at the
inner location in one flight. Nine and eight flights of UAV measurements on the algal reef and sandy beach
were conducted in 8 and 7 hours for one tidal cycle. We used another UAV to capture the image of the wave
propagation during the measurement. Then, we observed the wave direction 𝜃 from those images.
The total energy dissipation could be defined as the summation of the frictional dissipation and the
waves breaking dissipation, which is shown below 𝐷./.01 = 𝐷2 + 𝐷4. ( 2 )
The parameterization of the frictional dissipation and the waves breaking dissipation are calculated from
the empirical equations. The frictional dissipation can be written as
𝐷2,6 =14𝜌𝑓;,6𝑢4,=𝑢4,6
> , ( 3 )
where 𝑓;,6 is the energy dissipation factor of the near-bed, and 𝑢4,= is the near-bed velocity (Madsen 1994).
The calculation of the dissipation factor relies on the iteration for each frequency component of the wave
friction factor (Zwarts 1974). The wave friction factor is affected by the roughness of the sea bed. However,
there are many definitions of the sea-bed roughness (Nielsen 1992, Mathisen and Madsen 1999), we define
it as the four times of single Root Mean Square (RMS) length of the bottom elevation.
We used the equation from Thornton and Guza (1983) to calculate the energy dissipation of wave
breaking in spectral wave conditions. The equation is shown below
𝐷4 =3√𝜋16
𝜌𝑔𝑓D𝐵F
𝛾HℎJ 𝐻=LMN , ( 4 )
where 𝐷4 is the energy dissipation due to waves
breaking from all frequency components; 𝑓D is the peak frequency in the wave energy spectrum; 𝐵 is an
empirical value of 1; 𝛾 is the fraction of significant wave height and water depth.
3. Results We quantified the error of the system by
comparing the measurements of wave properties from the UAV and the in-situ pressure sensor. We deployed
several pressure sensors on the sea bed during the experiment. The pressure sensors were set to
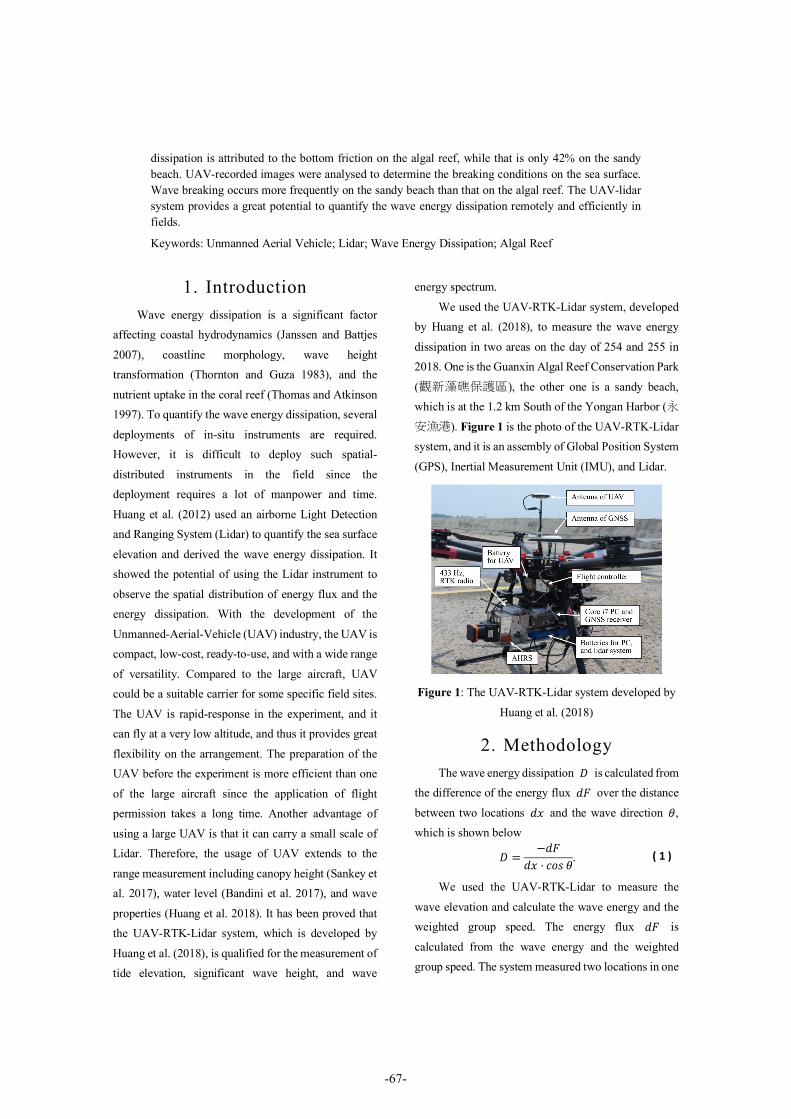
continuous-measuring mode. We listed the comparisons of the significant wave height ( 𝐻𝑠 )
between the two techniques over the sandy beach in Figure 2. The RMS error of 𝐻𝑠 over the algal-reef and
the sandy-beach area are both 9 cm. We also calculated the RMS error of the water depth between the two
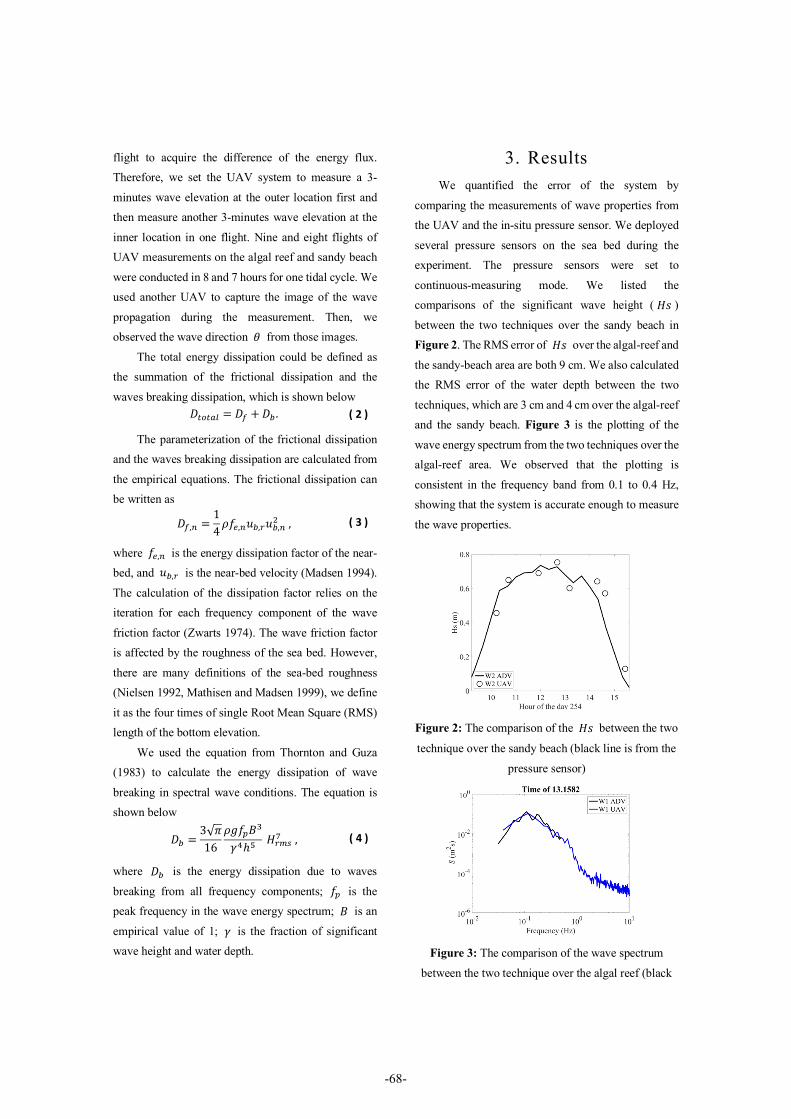
techniques, which are 3 cm and 4 cm over the algal-reef and the sandy beach. Figure 3 is the plotting of the
wave energy spectrum from the two techniques over the algal-reef area. We observed that the plotting is
consistent in the frequency band from 0.1 to 0.4 Hz, showing that the system is accurate enough to measure
the wave properties.
Figure 2: The comparison of the 𝐻𝑠 between the two
technique over the sandy beach (black line is from the
pressure sensor)
Figure 3: The comparison of the wave spectrum
between the two technique over the algal reef (black
-68-
line is from the pressure sensor)
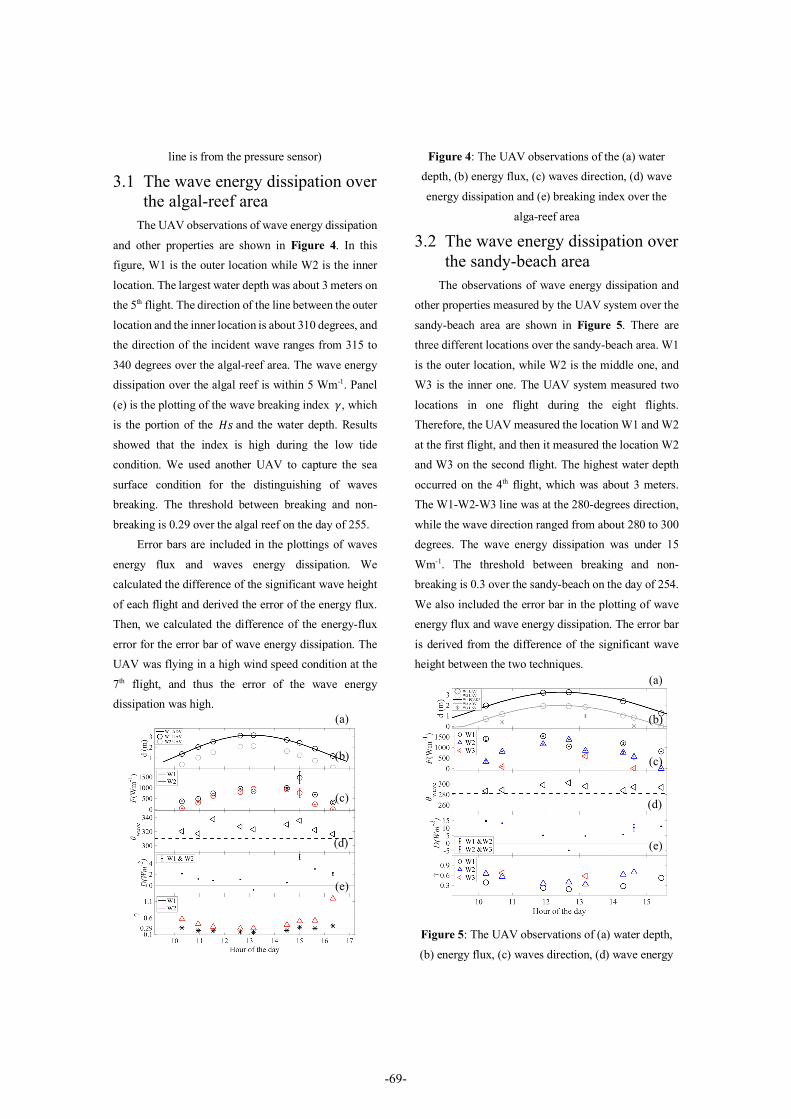
3.1 The wave energy dissipation over the algal-reef area
The UAV observations of wave energy dissipation
and other properties are shown in Figure 4. In this figure, W1 is the outer location while W2 is the inner
location. The largest water depth was about 3 meters on the 5th flight. The direction of the line between the outer
location and the inner location is about 310 degrees, and the direction of the incident wave ranges from 315 to
340 degrees over the algal-reef area. The wave energy dissipation over the algal reef is within 5 Wm-1. Panel
(e) is the plotting of the wave breaking index 𝛾, which is the portion of the 𝐻𝑠and the water depth. Results
showed that the index is high during the low tide condition. We used another UAV to capture the sea
surface condition for the distinguishing of waves breaking. The threshold between breaking and non-
breaking is 0.29 over the algal reef on the day of 255. Error bars are included in the plottings of waves
energy flux and waves energy dissipation. We calculated the difference of the significant wave height
of each flight and derived the error of the energy flux. Then, we calculated the difference of the energy-flux
error for the error bar of wave energy dissipation. The UAV was flying in a high wind speed condition at the
7th flight, and thus the error of the wave energy dissipation was high.
Figure 4: The UAV observations of the (a) water depth, (b) energy flux, (c) waves direction, (d) wave
energy dissipation and (e) breaking index over the
alga-reef area
3.2 The wave energy dissipation over the sandy-beach area
The observations of wave energy dissipation and other properties measured by the UAV system over the
sandy-beach area are shown in Figure 5. There are three different locations over the sandy-beach area. W1
is the outer location, while W2 is the middle one, and W3 is the inner one. The UAV system measured two
locations in one flight during the eight flights. Therefore, the UAV measured the location W1 and W2
at the first flight, and then it measured the location W2 and W3 on the second flight. The highest water depth
occurred on the 4th flight, which was about 3 meters. The W1-W2-W3 line was at the 280-degrees direction,
while the wave direction ranged from about 280 to 300 degrees. The wave energy dissipation was under 15
Wm-1. The threshold between breaking and non-breaking is 0.3 over the sandy-beach on the day of 254.
We also included the error bar in the plotting of wave energy flux and wave energy dissipation. The error bar
is derived from the difference of the significant wave height between the two techniques.
Figure 5: The UAV observations of (a) water depth,
(b) energy flux, (c) waves direction, (d) wave energy
(b)
(c)
(d)
(e)
(a) (b)
(c)
(d)
(e)
(a)
-69-
dissipation and (e) breaking index over the sandy-
beach site
3.3 Parametrization of the frictional dissipation
We used the equation of Madsen (1994) to calculate the frictional dissipation and used the equation
of Thornton and Guza (1983) for the calculation of waves breaking dissipation. We used the UAV to
measure the bottom roughness of the algal reef and the sandy beach for the calculation of frictional dissipation.
The bottom roughness (𝜎4) of the algal reef and the sandy surface is 0.19 and 0.05 meters.
The results of the parameterization show that more than 70% of the total energy dissipation is attributed to
the bottom friction on the algal reef, while that is only 42% on the sandy beach. The wave energy dissipation
due to breaking is over 62% of the total energy dissipation on the sandy beach, while it is only less than
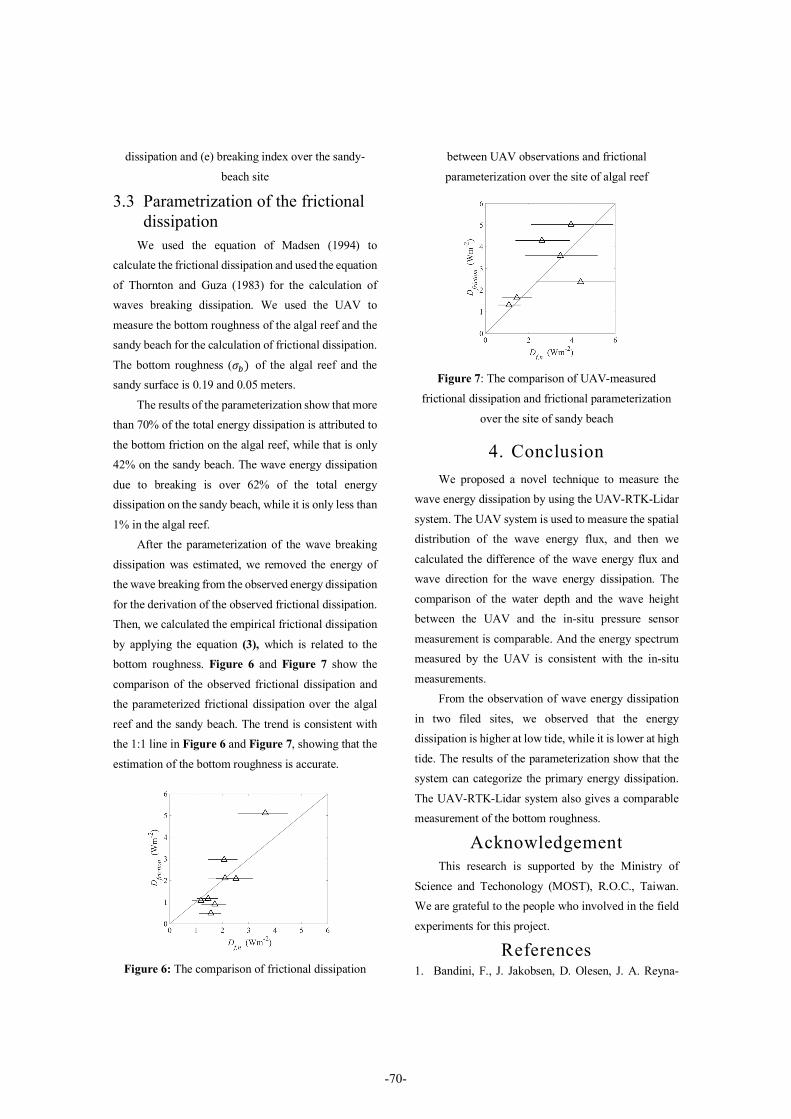
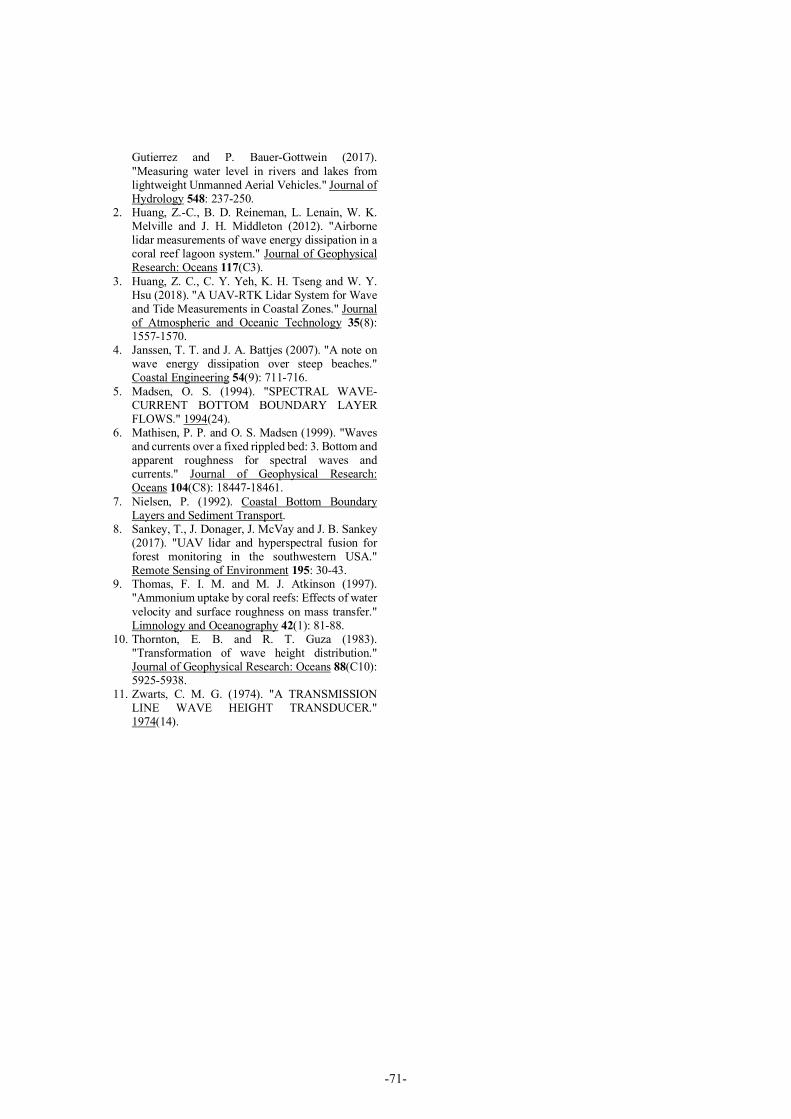
1% in the algal reef. After the parameterization of the wave breaking
dissipation was estimated, we removed the energy of the wave breaking from the observed energy dissipation
for the derivation of the observed frictional dissipation. Then, we calculated the empirical frictional dissipation
by applying the equation (3), which is related to the bottom roughness. Figure 6 and Figure 7 show the
comparison of the observed frictional dissipation and the parameterized frictional dissipation over the algal
reef and the sandy beach. The trend is consistent with the 1:1 line in Figure 6 and Figure 7, showing that the
estimation of the bottom roughness is accurate.
Figure 6: The comparison of frictional dissipation
between UAV observations and frictional
parameterization over the site of algal reef
Figure 7: The comparison of UAV-measured
frictional dissipation and frictional parameterization
over the site of sandy beach
4. Conclusion We proposed a novel technique to measure the
wave energy dissipation by using the UAV-RTK-Lidar
system. The UAV system is used to measure the spatial distribution of the wave energy flux, and then we
calculated the difference of the wave energy flux and wave direction for the wave energy dissipation. The
comparison of the water depth and the wave height between the UAV and the in-situ pressure sensor
measurement is comparable. And the energy spectrum measured by the UAV is consistent with the in-situ
measurements. From the observation of wave energy dissipation
in two filed sites, we observed that the energy dissipation is higher at low tide, while it is lower at high
tide. The results of the parameterization show that the system can categorize the primary energy dissipation.
The UAV-RTK-Lidar system also gives a comparable measurement of the bottom roughness.
Acknowledgement This research is supported by the Ministry of
Science and Techonology (MOST), R.O.C., Taiwan. We are grateful to the people who involved in the field
experiments for this project.
References 1. Bandini, F., J. Jakobsen, D. Olesen, J. A. Reyna-
-70-
Gutierrez and P. Bauer-Gottwein (2017). "Measuring water level in rivers and lakes from lightweight Unmanned Aerial Vehicles." Journal of Hydrology 548: 237-250.
2. Huang, Z.-C., B. D. Reineman, L. Lenain, W. K. Melville and J. H. Middleton (2012). "Airborne lidar measurements of wave energy dissipation in a coral reef lagoon system." Journal of Geophysical Research: Oceans 117(C3).
3. Huang, Z. C., C. Y. Yeh, K. H. Tseng and W. Y. Hsu (2018). "A UAV-RTK Lidar System for Wave and Tide Measurements in Coastal Zones." Journal of Atmospheric and Oceanic Technology 35(8): 1557-1570.
4. Janssen, T. T. and J. A. Battjes (2007). "A note on wave energy dissipation over steep beaches." Coastal Engineering 54(9): 711-716.
5. Madsen, O. S. (1994). "SPECTRAL WAVE-CURRENT BOTTOM BOUNDARY LAYER FLOWS." 1994(24).
6. Mathisen, P. P. and O. S. Madsen (1999). "Waves and currents over a fixed rippled bed: 3. Bottom and apparent roughness for spectral waves and currents." Journal of Geophysical Research: Oceans 104(C8): 18447-18461.
7. Nielsen, P. (1992). Coastal Bottom Boundary Layers and Sediment Transport.
8. Sankey, T., J. Donager, J. McVay and J. B. Sankey (2017). "UAV lidar and hyperspectral fusion for forest monitoring in the southwestern USA." Remote Sensing of Environment 195: 30-43.
9. Thomas, F. I. M. and M. J. Atkinson (1997). "Ammonium uptake by coral reefs: Effects of water velocity and surface roughness on mass transfer." Limnology and Oceanography 42(1): 81-88.
10. Thornton, E. B. and R. T. Guza (1983). "Transformation of wave height distribution." Journal of Geophysical Research: Oceans 88(C10): 5925-5938.
11. Zwarts, C. M. G. (1974). "A TRANSMISSION LINE WAVE HEIGHT TRANSDUCER." 1974(14).
-71-