Embed Size (px)
Citation preview

reti
2016
AnnualReport

(Translation from the Italian original which remains the definitive version)

CONTENTS •
1
CONTENTS
COMPANY BODIES AND OFFICERS ............................ ............................................................................................... 2
1. REPORT ON CDP RETI GROUP OPERATIONS ......................................................................................... 3
1.PRESENTATION OF THE GROUP ............................................................................................................................ 4
2.SEPARATION OF ITALGAS RETI FROM SNAM .................. .................................................................................. 10
3.SIGNIFICANT EVENTS OF THE 2016 FOR SECTORS/ COMPANIES ..... ............................................................. 12
4.ORGANISATIONAL STRUCTURE ........................... ................................................................................................ 18
5.BALANCE SHEET AND ECONOMIC PERFORMANCE OF THE GROUP ..... ......................................................... 21
6.OUTLOOK - PROSPECTS FOR 2017 ......................... ............................................................................................. 37
7.SIGNIFICANT EVENTS AFTER 31 DECEMBER 2016 ................ ............................................................................ 38
8.OTHER INFORMATION ............................................................................................................................................ 40
9.REPORT ON CORPORATE GOVERNANCE AND OWNERSHIP STRUCTURE OF C DP RETI pursuant to article 123-bis.2 b) of the consolidated law on financial i ntermediation (TUF) ............................... .................................. 43
2. 2016 CONSOLIDATED FINANCIAL STATEMENTS ......... ......................................................................... 47
CONSOLIDATED FINANCIAL STATEMENTS AT 31 DECEMBER 2016 ...... ............................................................ 49
NOTES TO THE CONSOLIDATED FINANCIAL STATEMENTS ............ .................................................................... 57
ANNEXES .................................................................................................................................................................. 119
REPORT OF THE INDEPENDENT AUDITORS ........................................................................................................ 121
CERTIFICATION OF THE CONSOLIDATED FINANCIAL STATEMENTS purs uant to article 154 – bis of legislative decree no. 58/1998 .................... ............................................................................................................. 123
3. REPORT ON CDP RETI S.P.A. OPERATIONS ........... ............................................................................. 125
1.CDP RETI S.P.A. OPERATIONAL PERFORMANCE ................. ............................................................................ 126
2.REPORT ON CORPORATE GOVERNANCE AND OWNERSHIP STRUCTURE OF C DP RETI pursuant to article 123-bis.2 b) of the consolidated law on financial i ntermediation (TUF) ............................... ................................ 132
4. 2016 FINANCIAL STATEMENTS ...................... ........................................................................................ 133
FINANCIAL STATEMENTS AT 31 DECEMBER 2016 ................. ............................................................................. 135
NOTES TO THE FINANCIAL STATEMENTS ....................... ..................................................................................... 142
PROPOSED ALLOCATION OF 2016 NET INCOME ................. ................................................................................ 182
ANNEXES .................................................................................................................................................................. 183
REPORT OF THE BOARD OF AUDITORS ...................... ......................................................................................... 189
REPORT OF THE INDIPENDENT AUDITORS .......................................................................................................... 196
CERTIFICATION OF THE SEPARATE FINANCIAL STATEMENTS pursuant to Art. 154 bis of Legislative Decree 58/1998 ....................................................................................................................................................................... 198

• 2016 ANNUAL REPORT
2
COMPANY BODIES AND OFFICERS
BOARD OF DIRECTORS (*)
Franco Bassanini Chairman
Leone Pattofatto (**) Chief Executive Officer
Cristiana Procopio (***) Director
Jun Yu Director
Yunpeng He Director
BOARD OF AUDITORS (*)
Guglielmo Marengo Chairman
Francesca Di Donato Auditor
Paolo Sebastiani Auditor
INDEPENDENT AUDITOR (****)
PricewaterhouseCoopers S.p.A.
(*)Appointed by the Shareholders' Meeting of 27 November 2014 – in office up to the date of the Shareholders' Meeting called for the approval of the financial statements for the year ended 31 December 2016. (**)Appointed by co-optation by the Board of Directors on 6 August 2015 to replace Giovanni Gorno Tempini, director and Chief Executive Officer, who submitted his resignation on 10 July 2015. The Shareholders' Meeting held on 11 January 2016 confirmed Mr. Pattofatto as a member of the Board of Directors with term of office aligned with that of the other Directors in office. (***)Appointed by co-optation by the Board of Directors on 31 March 2016 to replace Ludovica Rizzotti, director, who submitted his resignation on 25 March 2016. The Shareholders' Meeting held on 31 March 2016 confirmed Ms. Procopio as a member of the Board of Directors with term of office aligned with that of the other Directors in office. (****)Engagement granted by the Shareholders' Meeting of 24 June 2015 for the period 2015 - 2023.

REPORT ON CDP RETI GROUP OPERATIONS •
3
1. Report on CDP RETI Group Operations

• 2016 ANNUAL REPORT
4
1. PRESENTATION OF THE GROUP
1.1 ROLE AND MISSION OF THE CDP RETI GROUP
PARENT COMPANY
CDP RETI S.p.A. is an investment vehicle, established in October 2012 and converted from an Italian Law limited liability company into an Italian law joint stock company in May 2014, whose shareholders are Cassa depositi e prestiti Spa - Cdp - (59.1%), State Grid Europe Limited - SGEL - (35%), a company within the State Grid Corporation of China group, and certain Italian institutional investors (5.9%, attributable to Cassa Nazionale di Previdenza e Assistenza Forense and 33 Foundations of banking origin). The Company is subject to management and coordination by Cdp.
The share capital is €161,514.00 fully paid up and represented by 161,514 special shares (Cdp: 95,458 category A shares, SGEL: 56,530 category B shares, Others: 9,526 category C shares), without indication of par value.
The corporate purpose of CDP RETI is the holding and ordinary and extraordinary management, direct and/or indirect, of stakes in SNAM (28.98%), ITALGAS (25.08%) and TERNA (29.85%), with the Company acting as a long-term investor with the objective of supporting the development of transport, dispatching, regasification, storage and distribution infrastructures for natural gas, as well as electricity transmission.
More specifically, the Company, as a result of the provisions contained in the Italian Prime Ministerial Decree (“DPCM”) of 25 May 2012 which defined the procedures and terms for the ownership unbundling1 of SNAM S.p.A. from ENI S.p.A. (aimed at making the market more open and thus creating the conditions for greater competition), in 2012 acquired a stake in SNAM from ENI, representing 30% of the voting capital less one share, for €3.47 per share (overall purchase value of approximately €3.5 billion). Consequently to the sale, SNAM is no longer subject to the control and management and coordination of Eni and operates under ownership unbundling in compliance with the provisions of DPCM of 25 May 2012.
Subsequently, on 27 October 2014, with the objective of pooling, within the assets of one party, the stakes in the companies that manage infrastructural networks of strategic national interest, and within the context of opening the share capital of CDP RETI to third-party investors (SGEL and Italian institutional investors), CDP RETI was assigned the entire stake held by Cdp in TERNA, representing 29.851% of the share capital. The assignment of this stake, recorded by Enel S.p.A. in 2005, was carried out in accordance with the pooling of interest method, at the same carrying value (around €1.3 billion) at which it was entered on the Cdp financial statements as at 31 December 2013, enabling CDP RETI to assume the role of sub-holding of reference for the Cdp group as regards the energy infrastructure sector.
Lastly, on 7 November 2016, following the partial and proportional Demerger of the stake held by SNAM in ITALGAS and the admission to trading on the MTA (Italian Equities Market) of the ITALGAS shares2 (Beneficiary Company), CDP RETI was assigned 202,898,297 ITALGAS shares, in proportion to those already held in SNAM on the effective date of the Demerger. The assignment was one ITALGAS share for every five SNAM shares owned. Refer to the subsequent section “Separation of ITALGAS from SNAM” for more details.
1 Separation between the owner of the natural gas production and/or supply activities and the owner and/or operator of the natural gas transport activities. 2 Company incorporated on 01 June 2016 specifically to implement the Demerger, initially ITG Holding S.p.A. and then renamed ITALGAS S.p.A. on submission of the application for admission to listing of ordinary shares on the MTA. On the same date, the operating company ITALGAS S.p.A. took the name of ITALGAS Reti S.p.A..
REPORT ON CDP RETI GROUP OPERATIONS •
5
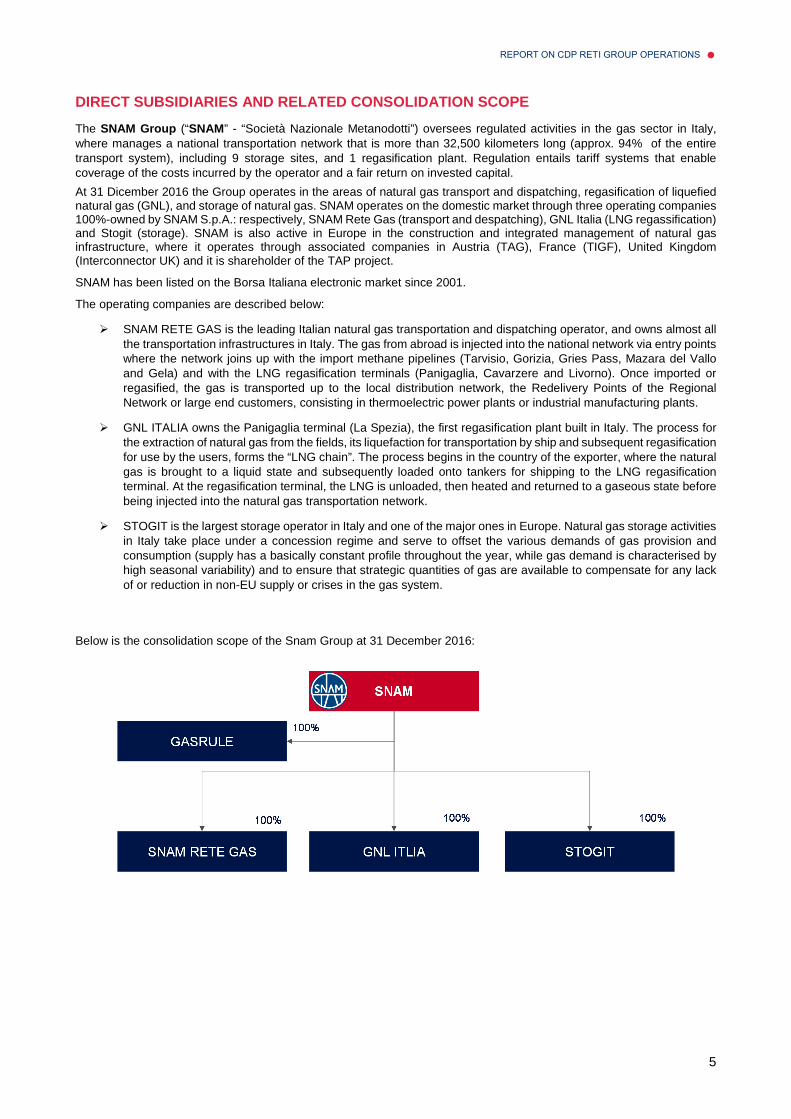
DIRECT SUBSIDIARIES AND RELATED CONSOLIDATION SCOPE
The SNAM Group (“SNAM” - “Società Nazionale Metanodotti”) oversees regulated activities in the gas sector in Italy, where manages a national transportation network that is more than 32,500 kilometers long (approx. 94% of the entire transport system), including 9 storage sites, and 1 regasification plant. Regulation entails tariff systems that enable coverage of the costs incurred by the operator and a fair return on invested capital.
At 31 Dicember 2016 the Group operates in the areas of natural gas transport and dispatching, regasification of liquefied natural gas (GNL), and storage of natural gas. SNAM operates on the domestic market through three operating companies 100%-owned by SNAM S.p.A.: respectively, SNAM Rete Gas (transport and despatching), GNL Italia (LNG regassification) and Stogit (storage). SNAM is also active in Europe in the construction and integrated management of natural gas infrastructure, where it operates through associated companies in Austria (TAG), France (TIGF), United Kingdom (Interconnector UK) and it is shareholder of the TAP project.
SNAM has been listed on the Borsa Italiana electronic market since 2001.
The operating companies are described below:
� SNAM RETE GAS is the leading Italian natural gas transportation and dispatching operator, and owns almost all the transportation infrastructures in Italy. The gas from abroad is injected into the national network via entry points where the network joins up with the import methane pipelines (Tarvisio, Gorizia, Gries Pass, Mazara del Vallo and Gela) and with the LNG regasification terminals (Panigaglia, Cavarzere and Livorno). Once imported or regasified, the gas is transported up to the local distribution network, the Redelivery Points of the Regional Network or large end customers, consisting in thermoelectric power plants or industrial manufacturing plants.
� GNL ITALIA owns the Panigaglia terminal (La Spezia), the first regasification plant built in Italy. The process for the extraction of natural gas from the fields, its liquefaction for transportation by ship and subsequent regasification for use by the users, forms the “LNG chain”. The process begins in the country of the exporter, where the natural gas is brought to a liquid state and subsequently loaded onto tankers for shipping to the LNG regasification terminal. At the regasification terminal, the LNG is unloaded, then heated and returned to a gaseous state before being injected into the natural gas transportation network.
� STOGIT is the largest storage operator in Italy and one of the major ones in Europe. Natural gas storage activities in Italy take place under a concession regime and serve to offset the various demands of gas provision and consumption (supply has a basically constant profile throughout the year, while gas demand is characterised by high seasonal variability) and to ensure that strategic quantities of gas are available to compensate for any lack of or reduction in non-EU supply or crises in the gas system.
Below is the consolidation scope of the Snam Group at 31 December 2016:

• 2016 ANNUAL REPORT
6
The shareholding structure of SNAM S.p.A. at 31 December 2016 (share capital of 3,500,638,294 shares, without par value) is provided below:
Compared to the situation at December 31, 2014, the consolidation scope of the Snam Group takes into account the exit of Italgas Reti S.p.A. (previously Italgas S.p.A.) and the companies controlled by the latter, effective as of 7 November 2016, as a result of the transaction to separate Snam from the natural gas distribution business. As a result of the transaction, which led to the transfer to Italgas S.p.A. (formerly ITG Holding S.p.A.) of 100% of Snam S.p.A.'s equity investment in Italgas Reti S.p.A., Snam S.p.A. holds a significant equity investment in Italgas S.p.A. representing 13.5% of the share capital.
The TERNA Group (“TERNA” – “Trasmissione Elettrica Rete Nazionale”) is the largest independent electricity transmission operator in Europe and one of the leading operators in the world by km of managed line (more than 72 thousand km). It is the operator and the main owner (99.6%) of the high-voltage electricity National Transmission Grid (“NTG”). The Company is responsible for the planning, construction and maintenance of the grid. It plays the role of Italian TSO (Transmission System Operator) with a government granted monopoly based on the rules and regulations defined by the Italian Regulatory Authority for Electricity Gas and Water (AEEGSI) and the Ministry for Economic Development’s guidelines.
The electrical system is composed of:
• Generation : conversion of energy obtained from primary sources into electricity. • Transmission and Dispatching : the transfer of energy generated by power plants to the areas of consumption via
high-voltage power lines, electric power and transformer stations, and of storage systems that make up the transmission grid, guaranteeing a constant balance between electricity supply and demand; through lines interconnecting with foreign countries, the transmission system allows the exchange of electricity between Italy and other Countries.
• Distribution : delivery of medium and low-voltage electricity to end users.
Therefore, Terna operates in the central segment of electricity of production and supply chain.
TERNA has been listed on the Borsa Italiana since 2004.
The Group operates in the segments: (i) Regulated Activities, Transmission and Dispatching of electricity in Italy (performed as a monopoly granted by government concession) and (ii) Unregulated Activities, which represent new business opportunities (Third-party services, initiatives with Foreign states, interconnections with international markets, energy production and transformation).
The Companies operating in the Regulatory Activities segment (Terna's traditional core business) are describe below:
• Terna Rete Italia S.p.A. is tasked with performing all Regulated Activities, ordinary and extraordinary maintenance of the section of the NTG owned, managing and performing work on developing the grid. It is also tasked with Unregulated Activities of maintenance, engineering and the sale of assets to other group companies and to third parties.
• Terna Rete Italia S.r.l. owns approximately 10.75% of the NTG infrastructure and the design, construction, management, development, running and maintenance of high-voltage electricity lines fall within its corporate purposee.
• Terna Storage S.r.l. is responsible for the design, construction, management, development, and maintenance of distributed energy-storage systems (therein including batteries), of pumping and/or of storage systems, as well as plants, equipment and infrastructures, including for grids.
• Rete S.r.l. purchased on December 23, 2015 from Ferrovie dello Stato Italiane S.p.A., owns approximately 8.71% of the NTG infrastructure
• Terna Crna Gora d.o.o. is a company under Montenegrin law that manages the activities in Montenegro related to the construction and operation of the Italy-Montenegro Interconnection.
Below is the consolidation scope of the Terna Group at 31 December 2016:
C ON SOLID A T IN G C OM P A N Y SH A R EH OLD ER S %OWN ER SH IP
SNAM S.p.A. CDP Reti S.p.A. 28.98
CDP Gas S.r.l. 1.12
SNAM S.p.A. 0.85
other shareholders 69.05

REPORT ON CDP RETI GROUP OPERATIONS •
7
The shareholding structure of TERNA S.p.A. at 31 December 2016 (share capital of 2,009,992,000 shares, with a par value of €0.22 each) is provided below:
The change in the Terna Group’s scope of consolidation compared with the situation at 31 December 2015 is related, in connection with the Unregulated Activities, to the acquisition of the Uruguayan company “Difebal S.A.” on 13 October 2016 by the Parent Company Terna. Furthermore, with reference to the associates, on 28 October 2016, subsequent to the entry of the Spanish TSO REE in the shareholding structure of CORESO S.A., Terna S.p.A. reduced its stake to 16.67%, proportionally with the other shareholders, through the transfer against consideration of a portion of its equity interest, while maintaining, however the characteristics of an associate.
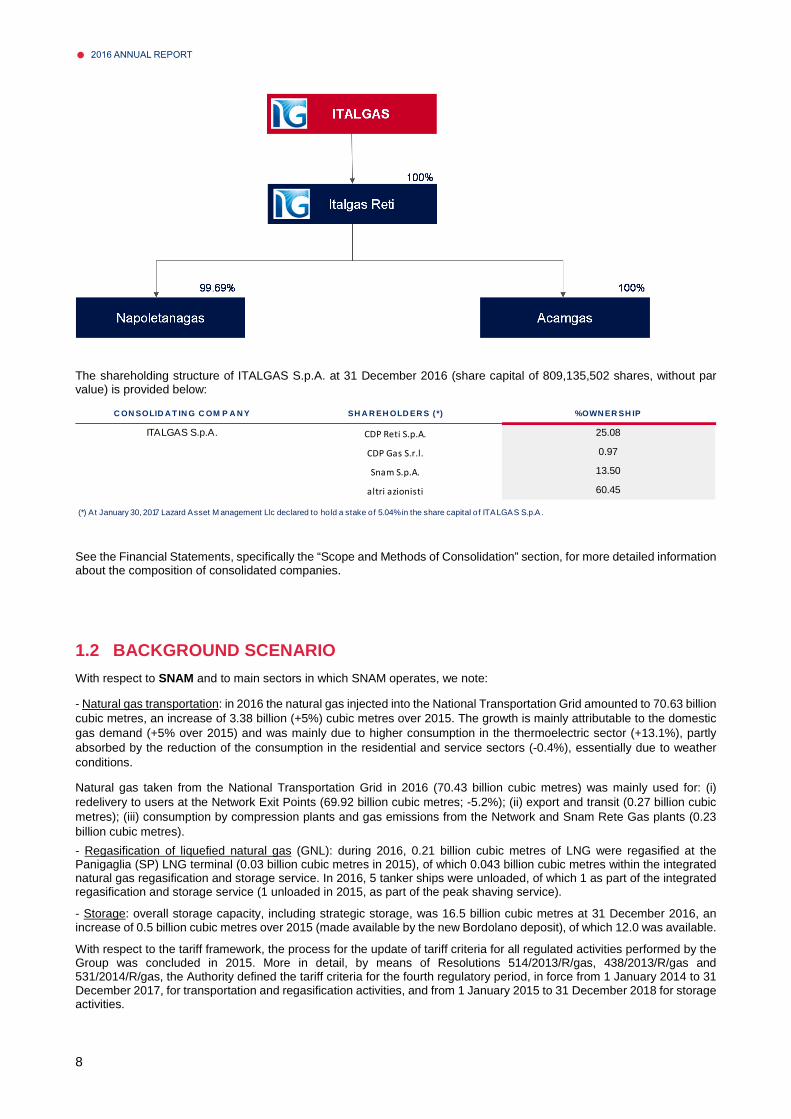
The ITALGAS Group (“ITALGAS ”), previously part of SNAM Group following the ITALGAS Reti sale by Eni as at 1 July 2009, is the leading Italian natural gas transportation and dispatching operator, and owns almost all the transportation infrastructures in Italy and the third in Europa. The natural gas distribution business operates on a concession regime through the conferral of this service by local public entities. The gas distribution service is carried out for sales companies authorised to market to end users by the transportation of the gas through city networks.
ITALGAS has been listed on the Borsa Italiana electronic market since 2016.
Below is the consolidation scope of the ITALGAS Group at 31 December 20163:
3 The shares of ITALGAS Reti were listed on the MTA of Borsa Italiana from 1900 to 2003.
C ON SOLID A T IN G C OM P A N Y SH A R EH OLD ER S %OWN ER SH IP
TERNA S.p.A. CDP Reti S.p.A. 29.85
altri azionisti 70.15
• 2016 ANNUAL REPORT
8
The shareholding structure of ITALGAS S.p.A. at 31 December 2016 (share capital of 809,135,502 shares, without par value) is provided below:
See the Financial Statements, specifically the “Scope and Methods of Consolidation” section, for more detailed information about the composition of consolidated companies.
1.2 BACKGROUND SCENARIO
With respect to SNAM and to main sectors in which SNAM operates, we note:
- Natural gas transportation: in 2016 the natural gas injected into the National Transportation Grid amounted to 70.63 billion cubic metres, an increase of 3.38 billion (+5%) cubic metres over 2015. The growth is mainly attributable to the domestic gas demand (+5% over 2015) and was mainly due to higher consumption in the thermoelectric sector (+13.1%), partly absorbed by the reduction of the consumption in the residential and service sectors (-0.4%), essentially due to weather conditions.
Natural gas taken from the National Transportation Grid in 2016 (70.43 billion cubic metres) was mainly used for: (i) redelivery to users at the Network Exit Points (69.92 billion cubic metres; -5.2%); (ii) export and transit (0.27 billion cubic metres); (iii) consumption by compression plants and gas emissions from the Network and Snam Rete Gas plants (0.23 billion cubic metres).
- Regasification of liquefied natural gas (GNL): during 2016, 0.21 billion cubic metres of LNG were regasified at the Panigaglia (SP) LNG terminal (0.03 billion cubic metres in 2015), of which 0.043 billion cubic metres within the integrated natural gas regasification and storage service. In 2016, 5 tanker ships were unloaded, of which 1 as part of the integrated regasification and storage service (1 unloaded in 2015, as part of the peak shaving service).
- Storage: overall storage capacity, including strategic storage, was 16.5 billion cubic metres at 31 December 2016, an increase of 0.5 billion cubic metres over 2015 (made available by the new Bordolano deposit), of which 12.0 was available.
With respect to the tariff framework, the process for the update of tariff criteria for all regulated activities performed by the Group was concluded in 2015. More in detail, by means of Resolutions 514/2013/R/gas, 438/2013/R/gas and 531/2014/R/gas, the Authority defined the tariff criteria for the fourth regulatory period, in force from 1 January 2014 to 31 December 2017, for transportation and regasification activities, and from 1 January 2015 to 31 December 2018 for storage activities.
C ON SOLID A T IN G C OM P A N Y SH A R EH OLD ER S (*) %OWN ER SH IP
ITALGAS S.p.A. CDP Reti S.p.A. 25.08
CDP Gas S.r.l. 0.97
Snam S.p.A. 13.50
altri azionisti 60.45
(*) At January 30, 2017 Lazard Asset M anagement Llc declared to hold a stake of 5.04% in the share capital of ITALGAS S.p.A.

REPORT ON CDP RETI GROUP OPERATIONS •
9
With regard to TERNA, domestic electricity demand in 2016 was stood at 310,252 million kWh (interim data), -2.1% compared with 2015, which ended with an increase of +2% versus the previous year. The monthly trend of domestic energy demand in 2016 compared to the previous year's data shows a higher demand for all months, with the exception of February, as a consequence of the leap year, and December.
With respect to electricity production 2016, renewable sources accounting for 34% of demand coverage. The wind (+19%), biomass (+1%) and geothermal (+1%) generation sources. Down, instead, was hydroelectric generation was down (-9%), also due to the different weather conditions recorded in the year. Also stable, although down slightly (-0.2%) was photovoltaic generation. Thermal generation increased.
With reference to ITALGAS , at 31 December 2016 the company was the holder of a concession for the gas distribution service in 1,472 Municipalities (likewise at the 31 December 2015) of which 1,422 in operation (1,401 at 31 December 2015).
During 2016, ITALGAS, currently present in 113 ATEMs (minimum territorial areas for holding tenders and awarding the gas distribution services), continued to prepare and forward the information and documentation provided for by regulations currently in force, necessary to call tenders in said areas (articles 4 and 5 of Italian Ministerial Decree 226/11) to the local entities and/or to the Contracting Authorities. Against this backdrop, the activities to determine the agreed upon reimbursement values owed to the Group companies continued.
Within the scope of the regulatory framework that establishes the awarding of gas distribution services with tenders by territorial areas (and not by individual municipality), 19 calls for tenders by Area were published (of which 5 were suspended by the Contracting Authorities, 8 were extended with respect to the initial terms and one was cancelled due to incomplete documentation at 31 December 2016).
- Gas distributed: at 31 December 2016 Italgas had distributed 7,470 million cubic metrs of gas, through 282 marketing companies.
- Distribution network: the gas distribution network at 31 December 2016 extended for 56,798 kilometres (56,717 kilometres at 31 December 2015) with an increase of 81 kilometres over 31 December 2015.
- Metres: at 31 December 2016, the metres in service c/o the re-delivery points (PdP - punti di riconsegna) amounted to 6,536 million (6.,526 at 31 December 2015).

• 2016 ANNUAL REPORT
10
2. SEPARATION OF ITALGAS RETI FROM SNAM
On 17 March 2016, SNAM informed the market of the opportunity to conduct a feasibility study in relation to a potential industrial and corporate reorganisation to separate ITALGAS Reti from SNAM, with the aim to submit the outcome of the feasibility study to the approval of the Board of Directors.
SNAM Board of Directors meeting on 28 June 2016, in the belief that the gas distribution activities present very specific characteristics that are different from the rest of the SNAM Group’s activities, has approved this industrial and corporate restructuring transaction, informing the market on 29 June 2016. More specifically, in the belief that the Italian gas distribution (carried out by the ITALGAS Group) deviates from the other activities of the SNAM group in terms of operational organisation, competitive context, regulation and investment requirements, the transfer to ITALGAS of the entire stake previously held by SNAM in ITALGAS Reti was approved.
In terms of outlook the SNAM Group will be able to concentrate on its transportation, storage and regasification activities in Italy and abroad in a bid to maximise the value of its existing asset portfolio and capitalise on new development opportunities; instead ITALAS’ role will be to manage the equity investment in ITALGAS Reti that will be involved in gas distribution service tenders at local level, as defined by industry regulations. The expected benefits for ITALGAS Group are:
• more effective use of financial debt just like the other Italian operators; • increase its market share and react more effectively if the tender timetable is brought forward; • more flexibility with regard to investments, since the restrictions that come with being part of the SNAM Group; • direct access to the capital markets, enabling ITALGAS Reti to finance its future growth.
Specifically, the Transaction as a whole, occured in a unitary and substantially simultaneous manner, includes:
a) the contribution in kind by SNAM to ITALGAS of a stake equal to 8.23% of the share capital of ITALGAS Reti (the “Contribution ”), in exchange for the allocation to SNAM of 108,957,843 newly issued shares of ITALGAS, in order to enable SNAM to hold, post-Demerger (as per point c), a stake of 13.50% in the Beneficiary Company;
b) the sale by SNAM to ITALGAS of 98,054,833 shares of ITALGAS Reti, equal to 38.87% of the share capital of ITALGAS Reti (the “Sale”), for a price of €1,503 million, together with the assumption of an equal amount of debt at the Beneficiary Company; and
c) the partial and proportional Demerger of SNAM, with the allocation to ITALGAS of an equity investment equal to the 52.90% held by the Demerged Company in ITALGAS Reti.
As anticipated, the completion of the reorganisation lastly provided for the listing (7 November 2016) of ITALGAS (Beneficiary Company) on the Italian Equities Market (MTA) of Milan. In this regard it is noted as the effectiveness of the transaction were, in any case, subject to, other than the conditions of law among which in particular the favourable vote of Snam’s Shareholders’ Meeting4, to:
• the approval by Snam’s bondholders (30 September 2016); • the issuance of Borsa Italiana’s order admitting the shares of the beneficiary company to trading on the MTA (2
November 2016); • the issuance of the judgment of equivalence by Consob (3 November 2016).
As provided for in the deed of Demerger (filed at the Business and Trade Register on 3 November 2016), this took effect from the initial date of trading, i.e. 7 November 2016.
As a result of the Demerger and the subsequent listing of ITALGAS, each SNAM shareholder have in place of a SNAM share, two different shares specifically, the SNAM share and ITALGAS share.
At the conclusion of this transaction, as provided for by the memorandum of understanding entered into on 28 June 2016 between SNAM, CDP RETI and CDP Gas, on 20 October 2016 (with effective data from the Demerger), SNAM, CDP RETI and CDP Gas entered into a shareholders’ agreement (the “ITALGAS Shareholders’ Agreement”), with a term of three
4 The Demerger was approved by the shareholders’ meetings of SNAM and ITALGAS, respectively, on 1 August 2016 and 4 August 2016.

REPORT ON CDP RETI GROUP OPERATIONS •
11
years, relating to all equity investments held in the Beneficiary Company in order to ensure a stable ownership structure, as well as to regulate the transfer, by CDP RETI, SNAM and CDP GAS of their respective stakes in ITALGAS.
In relation to the new corporate structure of the group, it was also decided to modify, effective from 7 November 2016 and expiring 26 November 2017, the shareholders’ agreement (“SGEL New Shareholders’ Agreement”) between Cdp, SGEL and State Grid International Development Limited (sole shareholder of SGEL), concluded on 27 November 2014 in relation to the transfer to SGEL of the stake of 35% of the share capital of CDP RETI, and aimed at regulating, among other things, the respective rights and obligations of the shareholders of the Company, including with regard to its governance.
In terms of consolidated financial statements, in accordance with IFRS 10, both SNAM and ITALGAS will continue, in the absence of any findings regarding the lapse of de facto control over them, to be consolidated by CDP RETI.
From an accounts point of view, the transaction, conducted between companies subject to common control (de facto control by Cdp) is excluded from the application of accounting standard IFRS-3 business combinations (which does not govern the accounting treatment of transfers of business between companies belonging to the same group) and IFRIC 17 (Distributions of Non-cash Assets to Owners). It follows that, for the purposes of the annual financial statements of CDP RETI S.p.A., following on from what was done in the past for similar transactions and in the absence of specific regulations, the transaction was processed according to the pooling of interest method. More specifically, the value of the stake in SNAM (pre-Demerger) was allocated between the stake in SNAM (post-Demerger) and the stake in ITALGAS.
In order to identify the carrying value of the ITALGAS shares received through the Demerger of SNAM, it was decided to apply a criteria for determining the ‘relative value’ consistent with the particular case subject to analysis. In particular, since this is a ‘Demerger’ of a stake for which the historical data are fully available, the ‘relative values’ have been calculated by taking into account the weight of the value that each Cash Generating Unit (CGU)5 had on the acquisition (of SNAM) and in particular based on the data processed during the Purchase Price Allocation (PPA)6.
With regard to fiscal matters, lastly, the change in the original equity investments resulting from the Demerger constitutes neither the realisation nor distribution of capital gains or losses for the Demerged Company’s shareholders (including CDP RETI). As for the temporary difference between the carrying value and tax value of the stakes in SNAM and ITALGAS, CDP RETI recognised no deferred tax liabilities, with both the conditions, laid down by international accounting standard IAS 12-Income Taxes having been satisfied, to be not accounted for.
5 The smallest group of assets which includes the asset and which generates incoming financial flows that are fully independent from the incoming financial flows obtained from other assets or groups of assets. 6 This allocation, required by IFRS 3 (International Financial Reporting Standard 3 - Business Combinations), must be carried out by the acquiring company, as part of its consolidated financial statements, in order to justify the purchase cost incurred as part of this extraordinary operation.

• 2016 ANNUAL REPORT
12
3. SIGNIFICANT EVENTS OF THE 2016 FOR SECTORS/ COMPANIES
CDP RETI With regard to dividends received (totaling €375 million) by the subsidiaries, during the reporting period €254 million was received by SNAM (2015 dividend) and €121 million by TERNA (€78 2015 final dividend and €43 2016 interim dividend). As concerns instead dividends paid to shareholders, during the year 2016 were paid out:
• almost entirely net income 2015 amounted to €358 million (€323 million in January as interim dividend7 2015 and €35 in May as final dividend);
• €253 million in November as interim dividend 20168 for a total dividend equal to €611 of which €361 million to Cdp and €214 million to State Grid Europe Limited. In more general term we note that Shareholders' Meeting held on 11 January 2016, given the end of the term of office as director of Mr. Pattofatto (co-opted to the board on 6 August 2015 in replacement of Director and CEO Giovanni Gorno Tempini, who resigned on 10 July 2015), confirmed Mr. Pattofatto as a member of the Board of Directors, with expiry of office in line with that of the other Directors in office (i.e. Shareholders' Meeting called to approve the financial statements of 2016). The Board of Directors, again during its meeting of 11 January 2016, unanimously approved to confirm Mr. Leone Pattofatto as Chief Executive Officer. In addition – and again with reference to the composition of the current Board of Directors – the Shareholders' Meeting held on 31 March 2016 confirmed Ms. Procopio as a member of the Board of Directors (appointed by co-optation by the Board of Directors on 31 March 2016 to replace Ludovica Rizzotti, director, who submitted his resignation on 25 March 2016.) with term of office aligned with that of the other Directors in office. At last, regarding the relationship with subsidiaries we note:
a) on 1 April 2016 CDP RETI submitted the lists of candidates for the positions of director and statutory auditor at SNAM, ahead of the shareholders’ meeting;
b) on April 12, 2016 the Board of Directors resolved to continue not to exercise management and co-ordination activities over subsidiaries SNAM and TERNA;
c) on June 28, 2016 the CDP RETI’s Board of Directors, considering the indications of the parent company, resolved: - to sign, on behalf of CDP RETI, the Memorandum of Understanding between SNAM, CDP RETI and CDP GAS, (preparatory to the signing of the subsequent shareholders’ agreement) in relation to the transaction to separate ITALGAS from SNAM; - to give mandate to the Managing Director, with the power to sub-delegate, to express favorable vote in the shareholders’ meeting of SNAM which has been called to resolve upon the partial and proportional demerger concerning the shareholding held by SNAM in ITALGAS.
d) on 3 August 2016, CDP RETI sent SNAM the names of the candidates for positions of director and statutory auditor at ITALGAS S.p.A. to be designated by the company in view of the ordinary shareholders' meeting of ITALGAS S.p.A. (held on 4 August 2016) to appoint its new company bodies;
e) on 20 October 2016 the parties (CDP RETI, SNAM and CDP GAS) signed the aforementioned shareholders’ agreement (“ITALGAS Shareholders’ Agreement”) concerning the equity investments held in ITALGAS;
f) on 7 November 2016 the aforementioned shareholders’ agreement was modified (“New SGEL Shareholders’ Agreement”) between Cdp, SGEL and State Grid International Development Limited;
g) on 7 November 2016 CDP RETI – on authority of its shareholders Cdp and State Grid – sent SNAM and (in CC) CDP Gas the names of the candidates for the position of member of the Consultation Committee appointed by CDP RETI9;
7The interim dividend of €1,999.73 per share (for each of the 161,514 shares) was approved based on the accounting situation of the company as at 30 September 2015 - prepared in accordance with the IFRS standards - which closed the period with net income of approx. €323 million and available reserves of approx. €3,345 million. 8 The interim dividend of €1,566.43 per share (for each of the 161,514 shares) was approved based on the accounting situation of the company as at 30 June 2016 - prepared in accordance with the IFRS standards - which closed the period with net income of approx. €320 million and available reserves of approx. €3,345 million. 9 Body authorized to make decisions, in accordance with the Italgas Shareholders’ Agreement, concerning the exercising of voting rights by the members in the ITALGAS shareholders’ meetings.

REPORT ON CDP RETI GROUP OPERATIONS •
13
h) on 7 November 2016, subsequent to the demerger and the admission to trading on the MTA of shares in ITALGAS, CDP RETI was assigned (202,898,297) shares in ITALGAS.
SNAM (TRANSPORTATION, REGASIFICATION AND GAS STORAG E SECTORS)
• Separation of Italgas Reti S.p.A. from SNAM S.p.A. : see the specific section.
• New Board of Directors: The Shareholders' Meeting of 27 April 2016 appointed a new Board of Directors, made up of nine directors who shall remain in office for three financial years, with their terms of office expiring on the date of the Shareholders' Meeting that shall be called in 2019 to approve the financial statements of 31 December 2018.
• Buyback on the market of bonds with a total nominal value of €2.75 billion: in October 2016, Snam successfully
completed a buyback on the market of bonds with a total nominal value of €2.75 billion, with an average coupon of approximately 3.3% and a remaining maturity of approximately 3 years. The total outlay was approximately €3.1 billion, financed in part by two bond issues with a total value of €1.75 billion, with an average coupon of 0.6% and an average maturity of approximately 8 years, and the remaining portion was financed by drawing down on available credit lines. The impact of this transaction on the 2016 income statement, which was basically equal to the cost resulting from the higher amount repaid to bondholders to buy back bonds on the market in relation to the amortised cost basis of said bonds, amounts to €329 million (€233 million net of the relative tax effect).
• The Board of Directors approves the renewal of the EMTN Programme to issue bonds: o n 27 September 2016
the Snam Board of Directors decided upon the annual renewal of the EMTN programme initiated in 2012, thereby reducing the maximum total value for bond issues from €12 to €10 billion. Based on outstanding bonds as of 31 December 2016, the renewal of the programme allows the issuance, by no later than 30 September 2017, of bond issuances for a maximum amount of €2.5 billion. The total nominal value of issued bonds in circulation in each instance may not exceed the maximum limit of €10 billion.
• On 7 November started the share buyback programme b ased on the resolution of the Shareholders’ Meeting
of 1 August 2016: started, as of November 7, a new share buyback programme, which in the end of 2016 led to the repurchase 28,777,930 SNAM shares on the market, representing 0.82% of the share for a total of approximately €103 million with an average price of €3.583 per share.
• Purchase of 49% minority stake in Gas Connect Austri a in a joint venture with Allianz: on 15 December 2016
Snam, in a joint venture with Allianz completed the acquisition from OMV (main oil and gas Austrian company) of 49% of Gas Connect Austria GmbH (GCA), comany which operates a transportation network of 564 km and a distribution network of 322 km in Austria and is in charge of marketing and supplying transportation capacity at border points and the transportation capacity required by domestic natural gas demand. The acquisition was completed using a jointly controlled special purpose vehicle, in which Allianz and Snam respectively hold 60% and 40% stakes, with a total outlay by Snam of €135 million, in exchange for an indirect 19.6% stake in GCA's share capital.
• Signed a Memorandum of Understanding for the develop ment of natural gas as an environmentally friendly
vehicle fuel: on 5 October 2016 Snam, FCA and IVECO signed a Memorandum of Understanding for the purpose of promoting the use of natural gas (CNG - Compressed Natural Gas) as an automotive fuel.
TERNA (DISPATCHING AND TRANSMISSION OF ELECTRICITY) • The 2016-2019 Strategic Plan was approved on 17 February 2016 (currently replaced by the 2017-2019 plan
approved on 20 February 2017).
• On 18 February 2016 the company launched a fixed-rate bond issue in Euro amounting to a total of 80 million.
• In September, it was awarded the tender contract in Uruguay called by UTE to construct three new electrical infrastructures in the country.
• In October, the company inaugurated the ground cable laying works of the Mon.Ita Project, a strategic project that
represents the first electrical connection between Italy and the Balkans.
• In October, Terna launched a bond issue for 750 million at the rate of 1% and renewed the EMTN bond issue plan .
• Furthermore, it submitted a bid to purchase 24% of the share capital of ADMIE, a Greek TSO . On 31 October

• 2016 ANNUAL REPORT
14
2016, PPC’s Board of Directors appointed State Grid as Preferred Strategic Investor.
• The merger by incorporation of subsidiaries Terna Rete Italia S.r.l. and Terna Storage S.r.l. into Terna S.p.A. was approved in December.
ITALGAS (DISTRIBUTION SECTOR): • Separation of Italgas Reti S.p.A. from SNAM S.p.A. : see the specific section.
• Debt structure : in order to acquire an autonomous financial structure and to reimburse the full exposure to SNAM,
on 28 October 2016 ITALGAS signed a financing package for an aggregate amount of 4.3 billion with a pool of leading Italian and international credit institutions.In particular, the financing package was composed of:
- a floating-rate Bridge to Bond loan, for a committed sum of 2.3 billion with a duration of 12 months (with Italgas’s right to rollover for 12 an additional months); - two revolving, floating-rate credit lines, for a committed sum of 600 million and 500 million and a duration of 3 and 5 years, respectively; - three floating-rate term loans with a duration up to 3 years for an aggregate amount of 500 million; - in addition to these loans, there are those offered by the EIB subsequent to the conclusion, on 26 October 2016, of a novation deed between Snam and Italgas, of the two EIB Italgas loans for a total of 424 million. On 11 November 2016, the Italgas Reti and subsidiaries’ debt with the former parent company Snam, amounting to 3,211 million, was repaid (the amount does not include 424 million relative to EIB loans). Subsequently, in December, a new EIB loan of 300 million was finalized (EIB Italgas Gas Smart Metering) and two of the three Term Loans were repaid for a total of 300 million.
• Assignment of Rating : On 7 and 8 November 2016, Italgas received the credit rating by Moody’s (Baa1 with stable outlook) and Fitch (BBB+ with stable outlook). On 12 December 2016, after the worsening of the credit rating assigned to the Italian Republic, Moody's confirmed the Italgas rating (Baa1), with a negative outlook.
• EMTN Programme : On 18 November 2016, in carrying out the resolutions passed by Italgas’s Board of Directors on
18 October 2016, the company finalised the first medium- and long-term issue (Euro Medium Term Notes Programme), for an aggregate amount up to 2.8 billion. The programme, valid up to 31 October 2017, envisages the issue of one or more non-convertible bond issues, to be placed with institutional investors operating in Europe, to be issued in one or more tranches. In implementing the EMTN Programme, Italgas issued bonds for a total of 2,150 million (see the specific section on Net financial debt).

REPORT ON CDP RETI GROUP OPERATIONS •
15
CONSOLIDATED FINANCIAL HIGHLIGHTS
INTRODUCTION
First of all, it should be noted that, starting from the financial year ended at 31 December 2016, CDP and CDP RETI consolidate ITALGAS directly in their respective financial statements, after ascertaining heir control over the Company, pursuant to the provisions of the international accounting principle IFRS 10 - Consolidated Financial Statements, and also taking into account the composition of the Board of Directors and the allocation of the share capital.
Having said this, as a result of the demerger from Snam concluded on 7 November 2016 (see dedicated section):
• SNAM's financial results (also) include the results of the natural gas distribution sector for the period 1 January - 6 November 2016;
• ITALGAS's financial results include Italgas S.p.A. from the date of its establishment (1 June 2016) and the consolidated companies Italgas Reti S.p.A., Napoletanagas S.p.A. and Acam Gas S.p.A. from the date of the demerger of Italgas Reti from Snam and, therefore, of the establishment of the ITALGAS Group (7 November 2016).
It follows that the contributions of individual sectors to the 2016 results of the CDP RETI Group cannot be compared like for like with the results of the previous financial year (in 2015 SNAM's results reflected the entire distribution sector); in order to understand the impact on the natural gas distribution business during the separation from gas in more detail, see the section “Operating sectors” below.

• 2016 ANNUAL REPORT
16
With respect to key management data, the following results were posted in 2016:
Total revenues of EUR 5,650 million (EUR 5,705 in 2015), down by 1% compared to the previous year.
Earnings Before Interest, Taxes, Depreciation and Amortisation (EBITDA) of EUR 4,180 million (EUR 4,331 million in 2015), accounting for 74% of revenues (76% in 2015), down by approx. EUR 150 million (-3%) versus 2015. With respect to overall margin (so-called EBITDA margin), SNAM's contribution was 45%, TERNA's 27% and ITALGAS's 2%.
Earnings Before Interest and Taxes (EBIT) amounted to EUR 2,442 million (EUR 2,644 million in 2015), accounting for 43% of revenues, vs. 46% in 2015 (so-called EBIT margin). This figure was also impacted by the depreciation and amortisation resulting from the allocation process for the purchase of SNAM's, TERNA's and ITALGAS's assets and liabilities (so-called Purchase price allocation or, in brief, PPA).
Net income totalled EUR 1,229 million (EUR 1,827 million in 2015), accounting for 22% of revenues (32% in 2015). The Parent Company's result for the year amounted to EUR 348 million (EUR 519 million in 2015).
Key financial figures
Items 31/12/2016 31/12/2015
Total revenue (millions of euros) 5,650 5,705
- of which regulated (millions of euros) 4,523 5,423
EBITDA (millions of euros) 4,180 4,331
EBITDA margin (%) 74% 76%
Operating profit (EBIT) (millions of euros) 2,442 2,644
EBIT margin (%) 43% 46%
Net income (millions of euros) 1,229 1,827
Profit margin (%) 22% 32%
Key balance sheet and cash flow figures
Items 31/12/2016 31/12/2015
Property, plant and equipment (millions of euros) 33,671 33,235
Intangible assets (millions of euros) 7,753 7,824
Long-term f inancial liabilities (millions of euros) 21,477 22,592
Equity (millions of euros) 15,167 15,575
- attributable to the parent company CDP RETI (millions of euros) 4,060 4,339
- attributable to minority interests (millions of euros) 11,107 11,236
Net financial debt (millions of euros) (24,027) (22,912)
Other key figures
Items 31/12/2016 31/12/2015
Technical investments (millions of euros) 2,132 2,375
Net cash f low for the period (millions of euros) 452 (663)
Effective Workforce (numbers) 10,326 10,074
Dividends distributed to shareholders during the period
- from SNAM (millions of euros) (875) (875)
- from TERNA (millions of euros) (406) (402)
- from ITALGAS (millions of euros) - n/a
- from CDP RETI (millions of euros) (611) (189)
Ratios
Items 31/12/2016 31/12/2015
ROE (%) 8% 12%
Net financial debt/Equity (numbers) 1.58 1.47
Net financial debt/EBIT (numbers) 9.84 8.67

REPORT ON CDP RETI GROUP OPERATIONS •
17
Net Financial Debt of EUR 24,027 million increased by EUR 1,114 million (+5%) over 31 December 2015. The total amount of around EUR 24 billion pertains to SNAM (46%), TERNA (33%) and ITALGAS (15%), and to the Parent Company CDP RETI for the remainder (6%).
Technical investments at 31 December 2016 amounted to EUR 2,132 million (EUR 2,375 million in 2015) and pertain mainly to SNAM (56%) and TERNA (40%).
Net cash flow for the period positive by approx. EUR 452 million (from EUR 821 million to EUR 1,272 million), mainly as a result of TERNA's healthy cash flows (around EUR 704 million), offset by lower cash flows generated by CDP RETI (-EUR 270 million, mainly due to higher dividends distributed compared to 2015 – EUR 611 million vs EUR 189 million). Operating activities generated financial resources of EUR 3,118 million, which, however, were absorbed by investment activities (net of disinvestment) negative by EUR 677 million and financing activities (negative by EUR 1.989 million).
ALTERNATIVE PERFORMANCE MEASURES 10 CDP RETI reviews the performance of the Group and its sector segments using certain measure not defined under IFRS. As a result, the determination criterion used may also not be similar to that used by other groups and, as a result, not comparable. Non-GAAP measures11 must be considered as supplementary and do not replace the information drafted in accordance with IFRS. As required by Consob Communication no. 0092543 of 3 December 2015 which implements the ESMA Guidelines on Alternative Performance Measures (document no. ESMA/2015/1415), the components of each of these measures are described below:
• “EBITDA”: is defined as adjusted Net Income of the following items (included in the Consolidated Financial Statements): (i) Net income from discontinued operations, (ii) Taxes for the Year, (iii) Financial Gains/Losses, (iv) Amortisation and Depreciation.
• “EBITDA margin”: EBITDA expressed as a percentage of Revenue and income. • “EBIT”: this is equal to EBITDA after deducting depreciation, amortization and impairment. • “EBIT margin”: EBIT expressed as a percentage of Revenue and income. • “ROE”: ROE (Return on equity) is calculated as the ratio between Profit/(loss) for the period (calculated on a 12-month
basis for 1 January - 31 December) and the arithmetic mean of Total Equity at the beginning and end of the reporting period.
• “Net Financial Debt”: this is calculated as current and non-current financial debt net of cash and cash equivalents, as well as the short-term financial receivables. See the specific section for further details.
• “Net Financial Debt/Net Equity” ratio: this ratio, which represents the degree of soundness and efficiency of the capital structure in terms mix between net borrowings and Shareholders’ Equity (Company's degree of dependency on external borrowing sources), is calculated as the ratio between the Net financial debt, as monitored by the Group, and Total equity.
• “Net Financial Debt/EBIT” ratio: this is calculated as the ratio between the Net financial debt, as monitored by the Group, and EBIT.
The calculation of these indicators, unchanged with respect to those used at 31 December 2015, is consistent with that recorded in the comparison period.
10 A financial measure of historical or future financial performance, financial position, or cash flows, other than a financial measure defined or specified in the applicable financial reporting framework.Alternative performance measures are usually derived from (or based on) the financial statements prepared in accordance with the applicable financial reporting framework, most of the time by adding or subtracting amounts from the figures presented in financial statements (ESMA Guidelines/2015/1415 – articles 17 and 18). 11 Generally accepted accounting principles (GAAP) are a common set of accounting principles that companies must follow when they compile their financial statements.

• 2016 ANNUAL REPORT
18
4. ORGANISATIONAL STRUCTURE
4.1 ORGANISATIONAL STRUCTURE At 31 December 2016, CDP RETI had 4 employees, in line with the organizational structure as at 31 December 2015. In particular, as from 10 August 2015, two resources were hired, while from 1 October 2015, after a period of secondment from other Cdp Group companies, two additional units were hired12. Finally, more generally, it is pointed out that the Company makes recourse to the operational support of the parent company CDP based on contractual agreements that provide the Company with all the expertise and services essential for the proper conduct of its business. Moreover, following the bond issue of 21 May 2015 listed on the Irish Stock Exchange, CDP RETI acquired the status of listed Issuer with Italy as Member State of origin and, therefore, was required, pursuant to Art. 154 – bis of the Consolidated Financial Act, to appoint a Financial Reporting Manager. The final headcounts of the SNAM13, TERNA and ITALGAS groups are detailed below:
12 On the date of drafting of this document, the Company workforce totalled 3 units following the resignation submitted at the end of January by a former employee. 13 With reference to SNAM group the change in average staff numbers was due mainly to the separation of the Italgas Group (effective November 7, 2016).
SNAM
Professional category 31/12/2016 31/12/2015 Changes
Senior Manager 101 131 (30)
Middle Managers 429 614 (185)
Off ice staff 1,594 3,356 (1,762)
Manual w orkers 726 2,112 (1,386)
Total 2,850 6,213 (3,363)
(average numbers)
TERNA
Professional category 31/12/2016 31/12/2015 Changes
Senior Manager 77 74 3
Middle Managers 560 545 15
Off ice staff 1,952 2,010 (58)
Manual w orkers 1,212 1,172 40
Total 3,801 3,801 -
(average numbers)

REPORT ON CDP RETI GROUP OPERATIONS •
19
4.2 RISK FACTORS In the normal course of its business activities, the CDP RETI Group is exposed to various, financial and non-financial, risk factors that, if they were materialised, could have an impact on the economic and financial position of the group. This section illustrates the main risks to which the CDP RETI group is exposed in the ordinary management of its business activities, as measured and managed at the level of TERNA, SNAM and ITALGAS. For the description of the financial risks, reference is made to the specific “Financial risk management” section of the consolidated and separate financial statements.
OPERATIONAL RISKS Operational risks consist mainly in malfunction and unplanned outage of the service due to accidents, failures or malfunctions of equipment or control systems, lower plant yield and extraordinary events such as explosions, fires, earthquakes, landslides or other similar events outside control. Although are taken out specific insurance policies to cover some of these risks, the related insurance cover could be insufficient to meet all the losses incurred, compensation obligations or cost increases. May experience delays in the progress of infrastructure construction work as a result of the many unforeseeable events linked to operating, economic, regulatory, authorisation and competition factors that are outside of its control. It is not possible to guarantee that the projects to upgrade and extend its network will be started, be completed or lead to the expected benefits in terms of tariffs. Additionally, the development projects may require greater investments or longer timeframes than those originally planned, affecting Group’s financial position and results. Furthermore, these operating risks include risks associated with the emissions market that fall within the scope of the European Union Directives on the sale of permits relating to carbon dioxide emissions and the rules on controlling emissions of certain atmospheric pollutants. With the start of the third regulatory period (2013-2020), the system for the authorisation to emit greenhouse gas, which was previously regulated by Legislative Decree 216/2006, was updated and revised by Legislative Decree 30 of 13 March 2013, in force since 5 April 2013. The allowances will be assigned to each plant on a gradually decreasing basis, and will no longer be constant (as in the second regulatory period), and will also depend on the actual functionality of the plants. Compliance with greenhouse gas regulations in the future may require SNAM to adjust its facilities, and to control or limit its emissions or undertake other actions that could increase the costs of complying with the regulations in force, and therefore have negative effects on the Group’s operations, results, balance sheet and cash flow. Further risks relate to environmental litigation with respect to the development and operation of generation plants and mainly linked to the damages that may result from exposure to electric and magnetic fields generated by power lines. As a matter of fact, TERNA is the defendant in a number of civil and administrative proceedings requesting the removal or change in operation methods of power lines on the basis of their alleged potential harmfulness, even if they were installed in full compliance with relevant applicable regulations.
REGULATORY RISK SNAM, TERNA and ITALGAS carry out activities in sectors subject to regulation. The regulatory risk derives from the possible change of the parameters that determine the regulated revenue, especially on the occasion of the multi-year review of the regulatory framework. The directives and regulatory provisions issued by the European Union and the Italian government and the resolutions of the Authority for Electricity, Gas and the Water System (AEEGSI) and, more generally, changes to the reference regulatory framework may have a significant impact on operations, earnings and financial stability. Considering the specific nature of its business and the context in which the subsidiaries operate, changes to the regulatory context with regard to criteria for determining reference tariffs are particularly significant.
ITALGAS
Professional category 31/12/2016 31/12/2015 Changes
Senior Manager 56 30 26
Middle Managers 237 180 57
Off ice staff 1,896 1,699 197
Manual w orkers 1,381 1,389 (8)
Total 3,570 3,298 272
(effective numbers)

• 2016 ANNUAL REPORT
20
With regard to TERNA, in the first half of 2015 around 90% of its revenues came from activities regulated by the Authority for the Electricity, Gas and the Water System. The Authority sets out, with respect to the multi-year regulatory periods, the structure and parameters for determining revenues and may intervene each year, where required, in order to update relevant parameters. Specifically, the fee for the transmission service represents the major share of regulated revenues and is calculated as the sum of three components: (i) profitability of the investment, (ii) coverage of amortization and (iii) coverage of operating costs. With Resolutions No. 583/15/R/com, No. 653/15/R/eel, No. 654/15/R/eel and No.658/15/R/eel, AEEGSI set the tariff regulation for the 2016–2023 (the fifth period) regulation period for electricity transmission, distribution, measurement and dispatching and the regulation regarding the quality of the transmission service.
A more detailed examination of the risks described and other critical aspects can be found in financial annual reports of SNAM, TERNA and ITALGAS.
REPORT ON CDP RETI GROUP OPERATIONS •
21
5. BALANCE SHEET AND ECONOMIC PERFORMANCE OF THE GROUP
In order to facilitate understanding of the results for the period, an analysis of the balance sheet and economic performance at 31 December 2016 is provided below using statements reclassified on the basis of operational criteria.
5.1 RECLASSIFIED CONSOLIDATED BALANCE SHEET
5.1.1 ASSETS The reclassified and consolidated assets of the CDP RETI Group at 31 December 2016 can be grouped into the following aggregates:
At 31 December 2016, the total assets of the CDP RETI Group amounted to EUR 49,952 million, up 2% compared to 31 December 2015, and consisted mainly of “property, plant and equipment” (approximately 67% of the assets), referred mainly to SNAM (EUR 15.5 billion, in line with 201514) and TERNA (EUR 12.4 billion against EUR 12.1 billion in 2015), as well as of the impacts from the consolidation on the item under review (around EUR 5.5 billion15). The EUR 436 million increase (+1%) over 2015 was mainly due to TERNA's variance (EUR 307 million) due to the investments for the period (EUR 813 million, EUR 774 million of which were due to Regulated Activities), net of amortisation and depreciation (EUR 449 million), write-downs/dismissals (EUR 64 million) and further variances, as well as higher investments recorded. The item “Intangible assets”, mainly ascribable to ITALGAS's service concession agreements (EUR 4.3 billion), analysed in greater detail in the Notes to the financial statements, decreased by EUR 71 million (-1%), mainly as a result of consolidation-related effects (depreciation and amortisation). This item, moreover, includes goodwill (EUR 853 million), which represents (i) the share (EUR 781 million) recorded as a result of the allocation of the difference between the purchase price of the interests and the relevant net equity and (ii) CPS Reti Group's share of the goodwills posted in TERNA's, SNAM's and ITALGAS's consolidated financial statements. “Trade receivables”, up 5% compared to 2015, refer primarily to (i) SNAM (EUR 1,271 million, net to the provision for bad debts of EUR 132 million), mainly due to the natural gas transport (EUR 988 million) and storage (EUR 218 million) sectors, and (ii) to TERNA (EUR 1,443 million, of which EUR 976 million for receivables for so-called “pass-through items” 16 pertaining to the activities performed by Terna S.p.A.)
14SNAM's balance at the end of 2016 (EUR 15,563 million) takes into account Italgas Reti's de-consolidation (EUR 225 million) resulting from the loss of control. This amount, ascribable to ITALGAS, however, is part of the overall value of the consolidated financial statements of the CDP RETI Group, which, as mentioned in the premise, de facto controls ITALGAS pursuant to IFRS 10. 15 Effects linked to the PPA (Purchase price allocation) of SNAM, TERNA and ITALGAS. 16 TERNA manages cost and revenue items linked to power sales and purchase transactions perfected with electricity market operations: these are so-called “pass-through items”, i.e. items that do not influence TERNA's profitability, as revenues are equal to costs. These items are regulated by AEEGSI's resolutions.
Assets
(million of euros)
Items 31/12/2016 31/12/2015
Property, plant and equipment 33,671 33,235
Intangible assets 7,753 7,824
Trade receivables 3,196 3,050
Other assets (1) 4,060 4,211
Cash and cash equivalents 1,272 821
TOTAL ASSETS 49,952 49,141
(*) The figures of the consolidated financial statements that are no t represented in the riclassified Assets are included in Other assets.
• 2016 ANNUAL REPORT
22
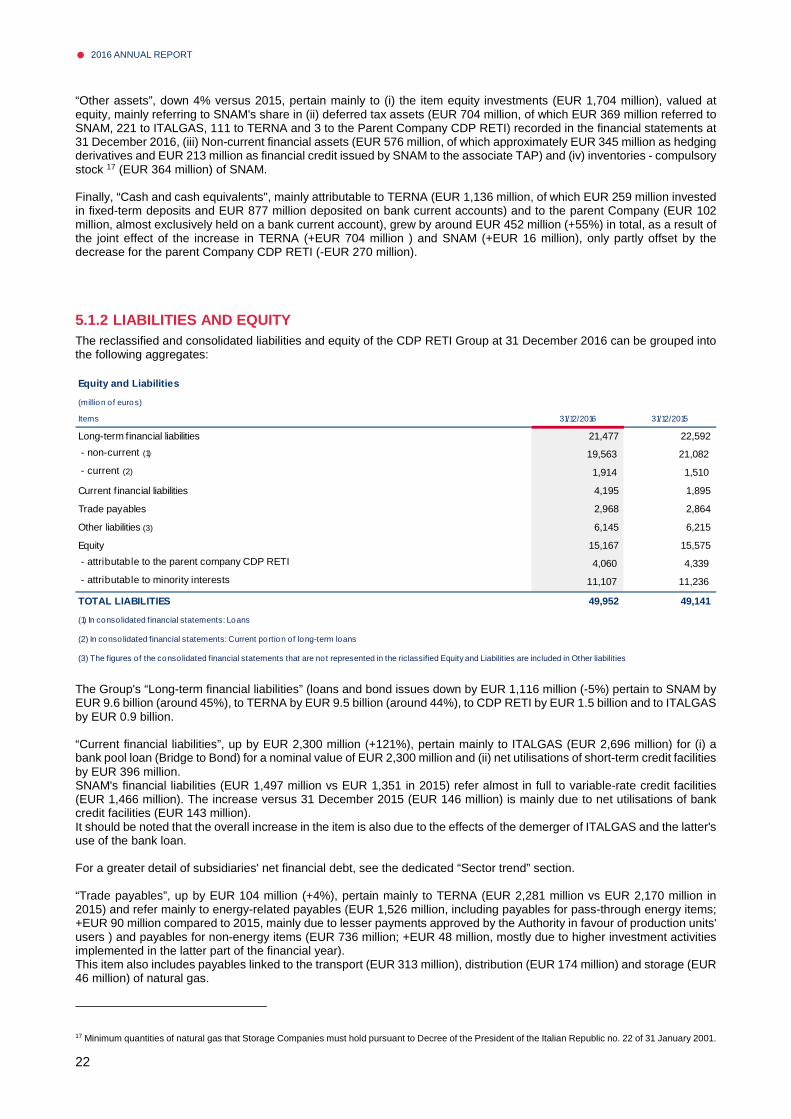
“Other assets”, down 4% versus 2015, pertain mainly to (i) the item equity investments (EUR 1,704 million), valued at equity, mainly referring to SNAM's share in (ii) deferred tax assets (EUR 704 million, of which EUR 369 million referred to SNAM, 221 to ITALGAS, 111 to TERNA and 3 to the Parent Company CDP RETI) recorded in the financial statements at 31 December 2016, (iii) Non-current financial assets (EUR 576 million, of which approximately EUR 345 million as hedging derivatives and EUR 213 million as financial credit issued by SNAM to the associate TAP) and (iv) inventories - compulsory stock 17 (EUR 364 million) of SNAM. Finally, “Cash and cash equivalents", mainly attributable to TERNA (EUR 1,136 million, of which EUR 259 million invested in fixed-term deposits and EUR 877 million deposited on bank current accounts) and to the parent Company (EUR 102 million, almost exclusively held on a bank current account), grew by around EUR 452 million (+55%) in total, as a result of the joint effect of the increase in TERNA (+EUR 704 million ) and SNAM (+EUR 16 million), only partly offset by the decrease for the parent Company CDP RETI (-EUR 270 million).
5.1.2 LIABILITIES AND EQUITY The reclassified and consolidated liabilities and equity of the CDP RETI Group at 31 December 2016 can be grouped into the following aggregates:
The Group's “Long-term financial liabilities” (loans and bond issues down by EUR 1,116 million (-5%) pertain to SNAM by EUR 9.6 billion (around 45%), to TERNA by EUR 9.5 billion (around 44%), to CDP RETI by EUR 1.5 billion and to ITALGAS by EUR 0.9 billion. “Current financial liabilities”, up by EUR 2,300 million (+121%), pertain mainly to ITALGAS (EUR 2,696 million) for (i) a bank pool loan (Bridge to Bond) for a nominal value of EUR 2,300 million and (ii) net utilisations of short-term credit facilities by EUR 396 million. SNAM's financial liabilities (EUR 1,497 million vs EUR 1,351 in 2015) refer almost in full to variable-rate credit facilities (EUR 1,466 million). The increase versus 31 December 2015 (EUR 146 million) is mainly due to net utilisations of bank credit facilities (EUR 143 million). It should be noted that the overall increase in the item is also due to the effects of the demerger of ITALGAS and the latter's use of the bank loan. For a greater detail of subsidiaries' net financial debt, see the dedicated “Sector trend” section. “Trade payables”, up by EUR 104 million (+4%), pertain mainly to TERNA (EUR 2,281 million vs EUR 2,170 million in 2015) and refer mainly to energy-related payables (EUR 1,526 million, including payables for pass-through energy items; +EUR 90 million compared to 2015, mainly due to lesser payments approved by the Authority in favour of production units' users ) and payables for non-energy items (EUR 736 million; +EUR 48 million, mostly due to higher investment activities implemented in the latter part of the financial year). This item also includes payables linked to the transport (EUR 313 million), distribution (EUR 174 million) and storage (EUR 46 million) of natural gas.
17 Minimum quantities of natural gas that Storage Companies must hold pursuant to Decree of the President of the Italian Republic no. 22 of 31 January 2001.
Equity and Liabilities
(million of euros)
Items 31/12/2016 31/12/2015
Long-term financial liabilities 21,477 22,592
- non-current (1) 19,563 21,082
- current (2) 1,914 1,510
Current financial liabilities 4,195 1,895
Trade payables 2,968 2,864
Other liabilities (3) 6,145 6,215
Equity 15,167 15,575
- attributable to the parent company CDP RETI 4,060 4,339
- attributable to minority interests 11,107 11,236
TOTAL LIABILITIES 49,952 49,141
(1) In consolidated financial statements: Loans
(2) In conso lidated financial statements: Current portion of long-term loans
(3) The figures of the consolidated financial statements that are not represented in the riclassified Equity and Liabilities are included in Other liabilities

REPORT ON CDP RETI GROUP OPERATIONS •
23
“Other liabilities”, down by EUR 70 (1%), pertain mainly to (i) deferred tax liabilities (EUR 2,978 million vs. EUR 3,110 million in 2015) posted to the financial statements at 31 December 2016, of which EUR 1,941 million from the PPA, (ii) other current liabilities (EUR 1,230 million vs. EUR 1,405 million in 2015), mainly due to SNAM (EUR 860 million), (iii) provisions for risks and charges (EUR 1,176 million vs. EUR 975 million in 2015), of which EUR 628 million (EUR 515 million in 2015) of provisions for the decommissioning and remediation of sites purchased by SNAM for anticipated charges for the removal of buildings and the remediation of storage sites (EUR 518 million ) and the transport of natural gas (EUR 105 million). “Equity”, down by around EUR 408 million (-3%), despite benefitting from the income for the period (EUR 1,229 million, of which EUR 348 million for the Parent Company), takes into account (i) the amount of the 2015 dividends distributed in the by SNAM and TERNA to third-party shareholders (around EUR 804 million in total) and by the Parent Company CDP RETI to its own shareholders (EUR 358 million), (ii) the 2016 interim dividend distributed by the Parent Company CDP RETI to its own shareholders (EUR 253 million) and by TERNA to third-party shareholders (EUR 101 million), and (iii) the increase (EUR 103 million) of the negative Provision for treasury shares in the portfolio as a result of the purchase of no. 28,777,930 SNAM shares (equal to 0.82% of the share capital) as part of the share buyback programme started on 7 November 2016. Of total equity, EUR 4 billion is attributable to the parent company (-6% compared to 2015) and around EUR 11.1 billion to minority interests.
5.1.3 RECONCILIATION OF CONSOLIDATED EQUITY AND NET INCOME
The reclassified consolidated income statement of the CDP RETI group at 31 December 2016 is composed as follows:
(million of euros)
Items Net incomeCapital and reserves
Total
PARENT COMPANY FINANCIAL STATEMENTS 354 3,084 3,438
Balance from f inancial statements of fully consolidated companies 1,419 9,698 11,117
Consolidation adjustments: (544) 1,155 611
- Carrying amount of fully consolidated equity investments - (5,080) (5,080)
- Dividends from fully consolidated companies (375) 375 -
- Purchase price allocation (179) 5,779 5,600
- Other adjustments 10 81 91
CONSOLIDATED FINANCIAL STATEMENTS 1,229 13,938 15,167
- attributable to the parent company CDP RETI 348 3,712 4,060
- attributable to minority interests 881 10,226 11,107
31/12/2016

• 2016 ANNUAL REPORT
24
5.2 RECLASSIFIED CONSOLIDATED INCOME STATEMENT
The figures below refer to the CDP RETI Group, and specifically detail the contribution - in terms of operating margins18 - of SNAM, TERNA and ITALGAS. In this regard, it should be noted that consolidation eliminations and adjustments have been highlighted separately.
The reclassified consolidated income statement of the CDP RETI group at 31 December 2016 is composed as follows:
In 2016, the CDP RETI Group, in line with the previous financial year, achieved a positive result of EUR 1,229 million (EUR 348 million pertaining to the Parent Company), even if lower than the 2015 result (a profit of EUR 1,827 million). The change in the balance is due to the reduction in operating margins (EBITDA -EUR 150 million; EBIT -EUR 202 million) and the greater impact of net financial expenses (-EUR 210 million) and taxes for the year (-EUR 179 million). With respect to sector trends, the CDP RETI Group's result was affected primarily by the lesser contribution of the gas sector as a whole (SNAM and ITALGAS) and the lesser impact of tax effects linked to the Purchase price allocation, considering that 2015 had benefited from the IRES rate reduction (from 27.5% to 24% from 1 January 2017). Finally, TERNA, which posted growing profits compared to 2015 (EUR 628 million vs. EUR 595 million; +6%), provided a positive contribution.
18 The Parent CDP RETI, as a holding company, has almost no impact on the group's operating margins.
Icome Statement
(million of euros)
Items 31/12/2016 31/12/2015
Revenues from financial statement 5,986 6,052
- Revenues recognised fo llowing application o f "IFRIC 12 Service Concession Arrangements" 337 347
Total revenues (*) 5,650 5,705
Costs from financial statement (not included Depreciation and Amortization) (1,806) (1,721)
- Costs recognised fo llowing application of "IFRIC 12 Service Concession Arrangements" (337) (347)
Operating costs (not included Depreciation and Amor tization) (*) (1,469) (1,374)
EBITDA 4,180 4,331
EBITDA margin 74% 76%
- of which SNAM 45% 49%
- of which TERNA 27% 27%
- of which ITALGAS 2% n/a
Depreciation and Amortization (1,738) (1,687)
Operating profit (EBIT) 2,442 2,644
EBIT margin 43% 46%
- of which SNAM 29% 34%
- of which TERNA 18% 18%
- of which ITALGAS 1% n/a
- of which consolidation -5% -6%
Financial income/expense (including effects by equity method) (620) (409)
Taxes (594) (415)
Profit from continuing operations 1,229 1,820
Profit from discontinued operations - 7
NET INCOME 1,229 1,827
- for parent company 348 519
- for minority interests 881 1,308
(1) In Riclassified Income Statement, pursuant to IFRIC 12 "Service Concession Arrangements" are not icluded:- regarding SNAM , revenue from the construction and upgrading of natural gas distribution infrastructure (€254 million in 2016 and €321 million in 2015);- regarding TERNA, revenue from construction of assets in concession (€21 million in 2016 and € 26 million in 2015);- regarding ITALGAS, revenue from the construction and upgrading of natural gas distribution infrastructure (€62 million in 2016);these revenues are recognised in an amount equal to the costs incurred and are shown as a direct reduction of the respective cost items.

REPORT ON CDP RETI GROUP OPERATIONS •
25
For a more detailed understanding of the variances for the two financial years at sector level, see the "Sector Trend" paragraph.
“Revenues”, down by EUR 55 million (-1%) compared to 2015, pertain mainly to SNAM by EUR 3,382 million (EUR 3,649 million in 2015) and to TERNA by EUR 2,082 million (EUR 2,056 million in 2015). Even if TERNA's revenues grew as a result of an improvement in regulated activities, the item in question was impacted by a reduction linked to the review of the WACC for the gas transport sector in 2016, whose remuneration rate decreased from 6.3% in 2015 to 5.4% in 2016.
"Operating costs" – mainly impacted by costs for services (EUR 753 million) and staff costs (EUR 640 million) – grew by about EUR 95 million compared to the previous period and refer mainly to SNAM (EUR 847 million), TERNA (EUR 541 million) and ITALGAS (EUR 104 million). The increase over 2015 was mainly due to higher costs in the distribution sector (including SNAM up to 6 November 2016) and, for the remainder, to TERNA. The “Earnings Before Interest, Taxes, Depreciation and Amortisation ” (EBITDA), characterised by lower revenues and higher operating costs for the period, as highlighted above, amounted to EUR 4,180 million compared to EUR 4,331 million in 2015, accounting for 74% of revenues (EBITDA margin), with a slight decrease over the 2015 figure (76%). SNAM contributed to this by 45%, TERNA by 27% and ITALGAS by the remainder. The trend for the Earnings Before Interest, Taxes, Depreciation and Amortisation (EBITDA) and higher depreciation and amortisation and write-downs (EUR 1,738 million vs. EUR 1,687 million in 2015; +EUR 52 million), pertain mainly to (i) the commissioning of new SNAM infrastructure and (ii) the distribution sector as a whole (inclusive of SNAM up to 6 November), as a result of the reduction in the useful life of conventional measurers after their replacement with electronic ones, even if in presence of lesser PPA effects, determined an “Earnings Before Interest and Taxes” (EBIT) of EUR 2,442 million, a reduction compared to EUR 2,644 million in 2015 (-8%) , with and EBIT margin (ratio over Total Revenues) of 43% at 31 December 2016 (46% in 2015). “Financial income (Expense)” for the year, negative by EUR 620 million (EUR 409 million in 2015; +51%), was impacted mainly by the expenses incurred by SNAM for the liability management transaction (EUR 329 million; EUR 233 million net of tax effects) concluded in October 2016, which lead to repurchase of debt securities on the market for a total book value of EUR 2.75 billion with an average coupon of around 3.3% and a residual maturity of around 3 years. Conversely, it should be noted that the item benefitted from the effects (EUR 32 million) linked to the liability management transactions executed on 20 July 2015 by TERNA. Income “taxes”, amounting to EUR 594 million (EUR 415 million in 2015; +43%) pertain mainly to SNAM, TERNA and the effects of deferred tax linked to Purchase price allocation. Compared to 2015, there was an increase of EUR 179 million, mainly due to the positive effects of the reduction in the IRES rate for 2015. “Net income” from discontinued operations was equal to 0 (EUR 7 million in 2015 due to TERNA's release of the provision for tax obligations that are considered fulfilled as a result of the expiry of the collection deadline for the Brazilian local authority). The aforementioned income and expense items enabled the company to close 2016 with a "consolidated net income " of approx. EUR 1,229 million (of which EUR 348 million attributable to CDP RETI), compared with figure of EUR 1,827 million for 2015. The net result for 2016 for CDP RETI's shareholders (a EUR 348 million profit) is ascribable to the profit of the Parent Company CDP RETI S.p.A. (EUR 354 million) and the share of the financial results achieved by SNAM (EUR 252 million profit), TERNA (EUR 189 million profit) and ITALGAS (EUR 21 million loss), net of the dividends (EUR 375 million) received by CDP RETI S.p.A. during the year from its subsidiaries and other effects (EUR 51 million) linked to the consolidation (mainly related to Purchase Price Allocation).

• 2016 ANNUAL REPORT
26
5.3 SECTOR TREND The key income statement, balance sheet and cash flow data are shown below, based on the formats used by SNAM, TERNA and ITALGAS for their financial statements. For the reconciliation of the reclassified financial statements to statutory ones see Companies’ documentation.
5.3.1 SNAM (GAS TRANSPORTATION, REGASSIFICATION AND STORAGE)
Introduction
The consolidated economic results described below mainly relate to continuing operations (natural gas transportation, regasification and storage, as well as Corporate activities) since the separation from Snam of the natural gas distribution business (as mentioned, took effect from 7 November 2016) resulted in a separate representation, as discontinued operations, of financial results and cash flows in the natural gas distribution sector for the period 1 January - 6 November 2016, in accordance with IFRS 5 “Non-Current Assets Held for Sale and Discontinued Operations”. The financial years used for comparison were reclassified in a consistent manner.
In this regard, it should be considered that the separate recording of the discontinued operations according to the criteria of IFRS 5 refers only to the relations with third parties leaving the elision of the infra-group relations. In this way, this causes a distortion in the separation of the values between continuing and discontinued operations which, at the economic level, causes a penalty to one or the other which becomes more significant as the infra-group economic relations of the discontinued sectors increase.
In particular, the separate recording of the results in the natural gas distribution sector according to the criteria discussed in IFRS 5 penalizes the continuing operations as a result of the elision of the revenue and financial yield, recorded respectively in light of the re-charge of the costs deriving from the provision of services and the loans issued at the concentrated level of Snam S.p.A. to Italgas Reti S.p.A., with the costs generated by the aforementioned re-charges remaining part of continuing operations.
In order to facilitate the assessment of the performance of continuing operations and greater comparability of data, SNAM management has prepared alternative performance measures (Non-GAAP measures) which, in addition to exclude the special items, reset the results of the continuing operations, at the level of the individual entry on the financial statement, the intercompany transactions towards discontinued operations, in order to obtain a representation of the results of the continuing operations as if the discontinued operations had been deconsolidated. Consequently, it is mainly showed the results from continuing operations.

REPORT ON CDP RETI GROUP OPERATIONS •
27
TOTAL REVENUES Total revenues at 31 December 2016 amounted to €2,560 million, a decrease of €67 million (2.6% decrease compared to 2015). Net of components offset in costs, total revenues amounted to €2,415 million, down €94 million, or 3.7% compared with 2015. The reduction in attributable mainly to the lesser revenue regulated (-€85 million; -3.6%). The latter (€2,444 million), net of components offset in costs, amounted to €2,299 million, a decrease, as mentioned, of €85 million and relate to transport (€1,855 million), storage (€426 million) and re-gasification (€18 million). The reduction essentially reflects the revision of the WACC19, for the year 2016, in the transport sector (-134 million euro), whose remuneration rate moves from 6.3% in 2015 to 5.4% in 2016. This effect was in part absorbed by the higher regulated revenue recorded in the storage sector (+48 million euro), which benefits from an improvement in the WACC for 2016, in respect to the figure established for 2015 (+20 million euro), the first year of the fourth regulation period. Excluding the effect of the WACC revision, total revenue amounted to €2,674 million, up by €47 million, or 1.8%, compared with 2015.
19 On December 2, 2015 the Authority for Electricity, Gas and Water System (AEEGSI) approved the criteria for determining and updating the rate of return on net invested capital (WACC) for the period 2016 - 2021 and set out the remuneration rates to apply to the year 2016. The resolution also provided an update mechanism of the rate at mid-term depending on the business cycle
SNAM
Items 31/12/2016 31/12/2015
Continuing operations (1)
Total revenue (2) (millions of euros) 2,560 2,627
- of which regulated (millions of euros) 2,444 2,502
Adjusted EBITDA (millions of euros) 1,987 2,057
Adjusted EBITDA margin (%) 78% 78%
Adjusted EBIT (3) (millions of euros) 1,336 1,481
Adjusted EBIT margin (%) 52% 56%
Net adjusted prof it - continuing operations (2) (3) (4) (6) (millions of euros) 826 863
Net adjusted prof it - discontinued operations (2) (3) (4) (6) (millions of euros) 190 346
Net adjusted prof it (3) (4) (6) (millions of euros) 1,016 1,209
Wlisions originating from intercompany transactions tow ards discontinued operation
(millions of euros) (80) (102)
Exclusion of special items from continuing operation net the relative tax effect
(millions of euros) (155) 29
Net reported prof it (4) (5) (millions of euros) 861 1,238
Net reported prof it - continuing operations (4) (5) (millions of euros) 591 796
Net reported prof it - discontinued operations (4) (5) (millions of euros) 270 442
Items 31/12/2016 31/12/2015
Group Equity (millions of euros) 6,497 7,585
Shareholders’ equity including minority interests (millions of euros) 6,497 7,586
Net financial debt (millions of euros) (11,056) (13,779)
Net cash flow for the period (millions of euros) 17 (57)
Technical investments (millions of euros) 1,199 1,272
(4) Entirely attributable to Snam shareholders.
(5) From the income statement in the legally required format.
(6) Net special items.
(2) The item includes the restatement o f eliminations from intercompany transactions for discontinued operations.
(3) Non-GAAP measures determined excluding special items and, for the purpose of removing the distortive effects generated by the application of IFRS 5, allocating the elimination of the costs originating from discontinued operations to continuing operations. For the definition of EBIT and adjusted net profit, as well as the reconciliation with the respective reported results, see the chapter “ ADJUSTED NET PROFIT FROM CONTINUING OPERATIONS AND NET ADJUSTED PROFIT” .
(1) The results o f the natural gas distribution segment, the business separated from Snam, were reported separately as discontinued operations on a single line in the income statement in accordance with the provisions of IFRS 5 “ Non-current Assets Held for Sale and Discontinued Operations” . Consistently, the comparison periods were restated excluding the contribution of the discontinued operations segment.

• 2016 ANNUAL REPORT
28
ADJUSTED EBIT FROM CONTINUING OPERATIONS The adjusted earnings before interest and tax amounted to €1,336 million, down by €145 million (-9.8%) compared with 2015 mainly reflects the effect of the revenues related to WACC review (-€114 million) and higher depreciation (+ €43 million) relating to all business for new infrastructure and devaluation (+€32 million) relating to the transport and re-gasification sectors. In the instance of business sectors, the reduction in adjusted EBIT reflects transportation sector results (-12.4%; -€144 million), with the effect of the WACC reduction (-134 million euro), which were partly offset by the positive performance posted by the storage sector (+8.5%; +€27 million) which benefited from an improvement in the WACC for 2016 with respect to that established for 2015, as well as the entry into operation in late 2015 of the first facilities at the Bordolano site.
ADJUSTED NET PROFIT FROM CONTINUING OPERATIONS AND NET ADJUSTED PROFIT Adjusted net profit from continuing operations was €826 million, a reduction of €37 million (-4.3%) compared with the 2015 financial year. The reduction in the adjusted EBIT (-€145 million; -9.8%) was only partly offset by the significant improvement in financial management (+€69 million, representing 20.8%), which was mainly attributable to the reduction in average debt costs, as well as lower income taxes (+€29 million; representing 7.4%) due mainly to a lower pre-tax profit and to the increase in ACE benefits (Allowance Corporate Equity) arranged for companies that strengthen their own net worth structure. The further reduction attributed to discontinued operations (-€156 million; -45.1%), determines a net adjusted profit amounted to €1,016 million, down by €193 million, or 16.0%, compared with 2015. In reference to discontinued operations, the net adjusted profit (190 million euro, in reference to the period from January 1, 2016 to November 6, 2016; 346 million euro in the fiscal year 2015), in addition to a different incidence of the profit components, which feels the influence of the lesser revenue regulated, essentially due to the mechanisms of tariff updates and, in particular, to the revision of the remuneration rate of the capital invested, which moves from 6.9% in 2015 to 6.1% in 2016 for distribution and from 7.2% in 2015 to 6.6% in 2016 for measurement.
RECONCILIATION OF NET ADJUSTED PROFIT TO THE REPORT ED NET PROFIT The income components are classified by SNAM Group under special items, if significant, when: (i) they result from non-recurring events or transactions or from transactions or events which do not occur frequently in the ordinary course of business; or (ii) they result from events or transactions which are not representative of the normal course of business. The tax rate applied to the items excluded from the calculation of adjusted net profit is determined on the basis of the nature of each revenue item subject to exclusion. The profit components of the continuing operations for the fiscal year 2016, classified as special items20 involved: (i) the finance charges deriving from the reacquisition of bonds on the market made in the realm of liability management operations (329 million euro; 233 million euro net the relative tax effect) put into effect by Snam in the month of October 2016; (ii) the financial revenue relating to the credits in existence towards the ITALGAS Group (119 million euro; 78 million euro net the relative tax effect), the object of reimbursement to SNAM as a result of the separation operation. In addition, as already illustrated in the introduction, the measures of the adjusted result, in addition to excluding the aforementioned special items, also move the elisions originating from transactions from continuing operations towards discontinued operations.
EQUITY The reduction in equity Group of €1,088 million compared to 2015, mainly reflects the effects related to separation of Italgas Reti S.p.A. from Snam S.p.A. (€983 million) and the 2015 dividend distribution (€875 million), only partially offset by net income of the period (€861 million). The reduction in equity is also affected by the increase (€103 million) related to the negative reserve for treasury shares following the acquisition of 28,777,930 Snam shares (equal to 0.82% of the share capital) carried out as part of the share buyback programme launched on 7 November 2016, as well as additional changes of the period.
NET FINANCIAL DEBT Net financial debt , which posted a decrease of €2,723 million over 2015 (€11,056 million vs €13,779 million), consisted almost entirely of:
• bonds for €7,610 million (inclusive of the current portion), down by €2,201 million, mainly as a result of the repayment of three bonds, which reached their natural maturities respectively in January, July and October 2016, with a nominal value of a total of €1,150 million and the repurchase of bonds as part of the liability management transaction concluded in October 2016 for a nominal value, net of new issues, of €1.0 billion;
20 In reference to the discontinued operations there were no revenue components in the fiscal year 2016 classified in special items.

REPORT ON CDP RETI GROUP OPERATIONS •
29
• Bank loans for €3,448 million (inclusive of current portion), down by approx. €502 million mainly attributable to Italgas’s takeover of the two loans previously disbursed by the EIB to Snam S.p.A. effective as of 7 November 2016 (-€424 million in nominal value) as well as net repayments on term loans (-€200 million in nominal value).
The net cash flow from operations (€1,627 million), along with the cash flow from divestments (€1,528 million, attributable basically to the consideration received for the disposal of the 38.87% stake in Italgas Reti S.p.A.) allowed to fully cover the financial requirements associated with investments and also generate a free cash flow21 of €1,707 million. At 31 December 2016 cash and cash equivalents amounted to €34 million (€17 at the end of 2015). On the debt side, the separation of ITALGAS, led to a reduction in SNAM's debt of approximately €3.6 billion and a cash-in for the Company of approximately €3.2 billion22, net of approximately €0.4 billion in EIB funding relating to ITALGAS projects transferred to the latter.
TECHNICAL INVESTMENTS Technical investments for the financial year amounted to €1,199 million (€1,272 million in 2015) and referred for €863 million to property, plant and equipment and for €336 to intangible assets (of which €258 for agreements for services under concession23). With regard to continuing operations the investments ammounted to €906 million (€879 million in 2015) and pertained mainly to transportation (776 million, +12% compared to 2015), and natural gas storage (177 million, -31% compared to 2015).
PROPOSED DIVIDEND
The Net Profit 2016 for the parent company Snam S.p.A. totals 761 million, a 64 million reduction, equal to 7.8%, in respect to the fiscal year 2015 mainly due to lower net revenue from shares (-44 million principally deriving from the dividends distributed by subsidiaries and total -25 million for the devaluation of the share in Gasbridge 1 B.V. and Gasbridge 2 B.V.).
The Shareholders' Meeting, convened in single call on 11 April 2017, will propose the distribution of a total dividend for 2016 of €21 cent per share (€25 cent per share in 2015), to be paid out starting from 24 May 2017.
21 The cash surplus or deficit left over after servicing capital expenditure. 22 The total refers to the receipt of intercompany financial credits towards the ITALGAS Group and to the amount received for the disposal of the 38.87% stake in Italgas Reti S.p.A.. 23 The value includes investments attributable to discontinued operations in the period 1 January - 6 November 2016.

• 2016 ANNUAL REPORT
30
5.3.2 TERNA (ELECTRICITY DISPATCHING AND TRANSMISSI ON SECTOR)
Introduction The 2016 Income Statement includes the contribution of Rete S.r.l. and of TES-Transformer Electro Service (controlled by Tamini S.r.l.), included in the comparative financial year from the time of the respective acquisitions that took place on 23 December and 30 October 2015.
TOTAL REVENUES
TERNA's total revenues at 31 December 2016 amounted to €2,103 million24 (a €21 million increase, of approx. 1%, vs 2015), mainly due to an improvement in regulated activities (+€46 million), partially offset by the decrease in unregulated activities (-€20 million mainly due for the revenues reduction in Tamini Group and the lower revenues from Terna Chile S.p.A.).
Revenues referred primarily CTR25 revenues related to the Parent Company Terna S.p.A. for €1,499 million, to the subsidiary Terna Rete Italia S.r.l. for 173 million and to Rete S.r.l. for €63 million.
Regulated revenues26 for the year, amounting to €1,895 million (approx. 90% of the total), referred mainly to the consideration for the use of the NTG (€1,735 million vs €1,706 million in 2015) and for the dispatching service received by electricity operators (€111 million vs €125 in 2015). The €46 million increase over 2015 was mainly due to the positive variance of the considerations for the transmission (+€29 million) strongly impacted by the (+ 63 million) contribution of the elision of the of NTG acquired at the end of 2015 from the Gruppo Ferrovie dello Stato Italiane, compared with the overall effects of the new 2016-2023 regulatory period (reduction of the revenues attributable to the revisions of the WACC).
EARNINGS BEFORE INTEREST AND TAXES (EBIT)
Higher revenues (+21 million), mainly due to the contribution from regulated activities and the reduction in depreciation and impairment (-8 million), allowed the company to absorb the increase (16 million) in operating costs (559 million vs 543), influenced mostly due to the maintenance costs borne towards the FSI group in relation to the electrical grid purchased at the end of 2015, and also to the allocation for exit incentives (+32 million).The reduction of depreciation and amortisation is the result of the lower write-downs for the year compared with 201527, and the higher depreciation and
24 Amount gross of the revenues from constructing assets under a concession regime (adjustments related to the application of IFRIC 12). 25 Remuneration recognized for the use of the national transmission grid by electricity distributors. 26 Determined on the basis of rules enstablished by AEEGSI through special resolutions. 27 The higher depreciations of 2015 refer to certain plants of the parent company Terna S.p.A. and of the subsidiary Terna Plus S.r.l..
TERNA
Items 31/12/2016 31/12/2015
Total revenue (millions of euros) 2,103 2,082
- of which regulated (millions of euros) 1,895 1,850
EBITDA (millions of euros) 1,545 1,539
EBITDA margin (%) 73% 74%
Operating profit (EBIT) (millions of euros) 1,036 1,022
EBIT margin (%) 49% 49%
Net income (millions of euros) 628 595
Net income of the group (millions of euros) 633 596
Items 31/12/2016 31/12/2015
Group Equity (millions of euros) 3,535 3,321
Shareholders’ equity including minority interests (millions of euros) 3,555 3,346
Net financial debt (millions of euros) (7,959) (8,003)
Net cash flow for the period (millions of euros) 704 (786)
Technical investments (millions of euros) 854 1,103

REPORT ON CDP RETI GROUP OPERATIONS •
31
amortisation expenses; the latter are relative for the most part to the subsidiary Rete S.r.l. (+25 million), also in the presence of a review of the useful life of electrical lines (passing from 40 to 45 years).
This resulted in an Earnings before interest and tax equal to €1,036 million, an increase both in absolute terms (+14 million) and in change percentage (+1.3%) with respect to 2015, with a percentage terms (so-called EBIT margin) in line with the compared period (49%).
NET INCOME
Net Income was affected positively by lower net financial expense (-€38 million) mainly due to the positive effects (+€74 million) from 2016’s general decrease in market interest rates and from the Liability Management operation completed successfully on July 20, 2015, which were only partly offset by (i) the fair-value adjustments of the bond loan issues and by the respective hedges (-14 million), (ii) the lower capitalized financial expenses (-13 million) and (iii) the lower interest revenues and other financial income .
The tax burden of the year, amounting to 305 million, increased by 19.3 million over the previous year, essentially as a result of greater profit before tax and taking into account that 2015 benefited from the positive adjustments of net deferred tax liabilities in the balance sheet28.
The Net income amounted to 628 million (of which 633 from the Group),an increase of 38 million (+6%) compared with 2015.
EQUITY The increase in equity Group for the financial year (approx. €215 million) was mainly due to the result for the year (approx. €628 million), only partially offset by the distribution of the 2015 ordinary dividend (€ 261 million) and the 2016 interim dividend (€ 145 million) authorised by the Board of Directors of Terna S.p.A. on 4 November 2016 at a rate of €0.0721 per share and paid out starting from 23 November 2016. The other changes are mainly related to comprehensive income, in particular, the effects of adjustments at fair value of the hedging derivatives (-12 million) and the recognition of the actuarial profits and losses on benefits to employees (+1 million).
NET FINANCIAL DEBT Net financial debt , down for the first time since listing of €44 million over 2015 (€7,959 million vs €8,003 million), as a result of good cash generation, consisted mainly of:
• Bonds (€7,190 million, of which 770 million with maturity by the end of 2017), an increase of approx. €784 million mainly as a result of the bonds issue for a total of €830 million net of fair values of those same instruments amortised;
• Long-term floating rate loans(€2,119 million of which 135 with a maturity by the end of 2017), a decrease of €115 million for the repayment of a portion of the the outstanding loanand mainly relating to financial payables due to EIB (approx. €1,612) and CDP (€500 million);
• Cash and cash equivalents for approx. €1,136 million (+€704 million over 2015, which had been affected by the purchase of the FSI group), €259 million of which invested in short-term, readily negotiable deposits and €877 million in bank current accounts.
TECHNICAL INVESTMENTS Technical investments for the financial year amounted to €854 million (€1,103 million in 2015) and referred for €813 million to property, plant and equipment (specifically, to transport lines for €508 million and to transformation systems for €246 million) and for €42 to intangible assets. Approximately 91% (€774 million) of total investments were investments from Regulated activities i.e. remunerated by AEEGSI. It is particularly worth noting the strategic investments related to activities in progress for the construction of the “Italy-France” and “Italy-Montenegro” electrical interconnections on the “Villanova-Gissi” and “Sorgente-Rizziconi” power lines, which came into operation in January and May 2016, respectively.
PROPOSED DIVIDEND The Parent Company Terna S.p.A. posted net income for the year of 536 million, up by €8.4 million with respect to net income for 2015 (+1.6%).
The Board of Directors will propose to the Shareholders' Meeting (i) the approval of a total dividend for the 2016 financial year of € 20.6 cents per share, in line with the policy presented to the market which provides for annual average growth of
28 As mentioned, in 2015, the Stability Law (Italian Law no. 208 of 28 December 2015) introduced the reduction of the IRES (Corporate Income Tax) rate (art. 1 paragraphs 61- 64), effective in 2017, from 27.5% to 24%.

• 2016 ANNUAL REPORT
32
3% compared to the 2015 figure, (ii) and the distribution – net of the ordinary interim dividend related to financial year 2016 of € 7.21 cents per share already payable from November 23, 2016 – of the remaining € 13.39 cents per share, before any withholdings by law, to be payable from June 21, 2017.
5.3.3 ITALGAS (GAS DISTRIBUTION)
Introduction
The spin-off of the whole Italgas Reti equity investment, which passed from SNAM to ITALGAS, was completed on 7 November 2016. Starting on 7 November ITALGAS therefore obtained direct control of Italgas Reti (100%) and indirect control of Napoletanagas (99.69%) and of ACAM Gas (100%) and, based on IFRS 10, those companies were subject to consolidation by the parent company ITALGAS. ITALGAS’s “consolidated” income statement is shown below, represented by the results achieved by Italgas S.p.A. (from the date of its incorporation on 1 June 2016 until 31 December 2016) and by the operating companies (from 7 November to 31 December 2016).
TOTAL REVENUES ITALGAS's total revenues at 31 December 2016 amounted to 196 million and refer mainly to the consideration for the natural gas distribution service (€177 million), i.e. to the transportation of natural gas for all the other commercial operators that request access to the distribution companies’ networks based on the Network Code; the most significant annual transport volumes were those relative to the activities performed for ENI S.p.A. Said revenues were determined based on Authority resolutions no. 367/2014/R/gas and 173/2016/R/gas. Regulated revenues are equal to 94% of total revenues.
ITALGAS
Items 01/06 - 31/12/2016 31/12/2015
Total revenue (a) (millions of euros) 196 n.a.
- of which regulated (millions of euros) 184 n.a.
Adjusted EBITDA ( b ) (millions of euros) 129 n.a.
Adjusted EBITDA margin (%) 66% n.a.
Adjusted EBIT (b) (millions of euros) 52 n.a.
Adjusted EBIT margin (%) 27% n.a.
Net adjusted prof it (loss) (b) (millions of euros) 30 n.a.
Group Net adjusted prof it (b) (millions of euros) 30 n.a.
Exclusion of special items net the relative tax effect (millions of euros) (102) n.a.
Net reported prof it ( c ) (millions of euros) (72) n.a.
Items 31/12/2016 07/11/2016
Group Equity (millions of euros) 1,063 1,131
Shareholders’ equity including minority interests (millions of euros) 1,064 1,132
Net financial debt (millions of euros) 3,618 3,511
Net cash flow for the period (d) (millions of euros) - n.a.
Technical investments (d) (millions of euros) 79 n.a.
(b) Alternative performance measure determined excluding special items
( c ) From the income statement in the legally required format
(d) From June to December 2016
(a) Net o f revenue from the construction and upgrading of natural gas distribution infrastructure linked to concession agreements under IFRIC 12 (€62 million) and to AEEGSI penalties (€16 million)

REPORT ON CDP RETI GROUP OPERATIONS •
33
ERNINGS BEFORE INTEREST AND TAX ADJUSTED (EBIT ADJU STED) The earnings before interest and tax for the period (90 million and the depreciation and amortisation expense of the period (77 million, which was impacted by the reduction of the useful life of traditional, metres, as a result of the plan for replacement with electronic metres), resulted in an Adjusted EBIT equal to 52 million with a percent impact on revenue (so called EBIT margin) equal to 27%.
NET INCOME ADJUSTED The net result achieved, in relation to the fraction of the year subject to consolidation, is a loss of 72 million, as a result, in particular, of the net financial expenses incurred subsequent to the settlement of the debt with the former parent company Snam that resulted in the recognition of 87 million in non-recurring financial expenses (net of tax effects), together with the costs associated with the spin-off transaction and to the listing for 5 million (net of tax effects) and to the accrual to the provision for exit incentives for 10 million (net of tax effects). Net of this non-recurring item (102 million net of tax effects ), classifiable among special items, as defined below, the net income adjusted amount to €30 million.
RECONCILIATION OF NET ADJUSTED PROFIT TO THE REPORT ED NET PROFIT
The income items are classified by the ITALGAS group among special items, if material, when: (i) they derive from non-recurring events or transactions or from those transactions or facts that are not frequently repeated in ordinary business conditions; or (ii) they derive from extraordinary business events or transactions.
The tax effects correlated with the items excluded from the calculation of adjusted net income are determined based on the nature of each excluded income item component.
The 2016 income items classified as special items included: (i) accruals the provision for exit incentives (15 million; 10 million net of tax effects); (ii) costs associated with the spin-off transaction and with the listing (8 million; 5 million net of tax effects); (iii) financial expenses deriving from the early repayment of the outstanding loans from the former parent company Snam (119 million; 87 million net of tax effects).
INCOME STATEMENT, GAS DISTRIBUTION SCOPE OF CONSOLI DATION” AND “PRO-FORMA CONSOLIDATED INCOME STATEMENT”
Since the “consolidated” values represent the results of an interim period and have no period for comparison with equivalent balances of the previous year, the ITALGAS group has prepared an (i) annual “Gas Distribution consolidated income statement”29, whose figures for 2016 can be compared with those of the previous period and (ii) an annual “2016 Pro-forma consolidated income statement” (that includes the “Gas Distribution Scope of Consolidation” and the economic results - costs and revenues - of Italgas S.p.A. from the date of its incorporation).
These income statements (for a more in-depth analysis thereof, refer to the 2016 financial statements of the ITALGAS group), were drafted by the ITALGAS group for the sole purpose of better illustrating the performance of the gas distribution activity and, since they present data that do not correspond with the final data in the 2016 Italgas consolidated financial statements30, they do not show the income situation of the ITALGAS group at the 31 December 2016 (see the “consolidated” statement in this Section); therefore, they are provided only to show the performance of the income and financial results in the terms presented above.
29 Drafted in order to better illustrate the performance of the gas distribution and metering activity and allow a comparison over time; this statement includes the income and financial data, and the consolidated operating data of Italgas Reti S.p.A., Napoletanagas S.p.A. and ACAM Gas S.p.A, thus allowing a homogeneous comparison between 2016 and 2015. 30 The “Pro-Forma consolidated income statement” and the “Gas Distribution consolidated income statement” therefore present data recorded before the spin-off of Italgas from Snam.

• 2016 ANNUAL REPORT
34
The Net Adjusted profit of the 2016“Gas Distributio n Scope of Consolidation ”, equal to 226 million, recorded a reduction of 119 million with respect to the previous financial year, as a result, not only of the drop in operating profit, but also of the decline in net income from equity investments (-9 million), partly offset by the lower income taxes for the period (+35 million). The Net Adjusted profit of the “Pro forma Consolidat ed”, equal to 221 million, mainly includes, in addition to the “Gas Distribution consolidated income statement”, €2 million of higher operating costs net of special items and 2 million of higher financial expenses accrued in Italgas S.p.A. from 7 November to 31 December 2016.
EQUITY
The equity attributable to the Group at 31 December 2016 (1,063 million) is composed mainly of share capital (1,001 million) and of the share premium account (620 million), partly reduced by the consolidation reserve31 (-316 million) and by the other reserves (-350 million32).
NET FINANCIAL DEBT Net Financial Debt, equal to 3.618 million and fully at a floating rate, is made up of:
31 Difference between the acquisition cost of stake in Italgas Reti S.p.A. (2,967 million) and the group’s net equity on the date the transaction was finalised 32 Reserve for business combination under common control recorded subsequent to the purchase by Snam S.p.a. of 38.87% of the stake in Italgas Reti S.p.A., equal to the difference between the consideration for the purchase (€1,503 million) and the carrying amounts of equity investment (continuity of carrying amounts with respect to SNAM).
ITALGAS - Consolidated scope Gas Distribution - Con solidated Pro-forma
(million o f euros)
Items
2016Consolidated scope
Gas Distribution
2015Consolidated scope
Gas Distribution
Abso lute change
2016Consolidated Pro-
forma
Gas Distribution Regulated revenue 1,052 1,071 (19) 1,052
Other revenue 28 27 1 27
Total revenue ( *) 1,080 1,098 (18) 1,079
Operating costs (*) (407) (356) (51) (417)
- of which special item 15 40 (25) 23
Operating costs net of special item (*) (392) (316) (76) (394)
Adjusted EBITDA 688 782 (94) 685
Depreciation and Amortization (326) (273) (53) (326)
Adjusted EBIT 362 509 (147) 359
Net financial expense (165) (48) (117) (167)
- of which special item 119 - 119 119
Net financial expense net of special item (46) (48) 2 (48)
Income from equity investments 20 29 (9) 20
Adjusted Earning before taxes 336 490 (154) 331
Taxes (73) (110) 37 (70)
- of which special item 37 35 2 40
Taxes net of special item (110) (145) 35 (110)
Net Adjusted profit 226 345 (119) 221
(*) Net o f IFRIC 12 "Service concession agreements" effects (€316 and €321 million respectively in 2016 and ind 2015)

REPORT ON CDP RETI GROUP OPERATIONS •
35
• current financial liabilities of 2,695 million attributable to the (i) net use of short-term bank credit lines, in the amount of 396 million and (ii) a pooled bank loan (Bridge to Bond), for a nominal value of 2,300 million33;
• long-term financial payables (923 million) essentially attributable to: (i) the payable for the loan granted by the European Investment Bank (EIB) for a total face value of 724 million and (ii) a term loan for a face value of 200 million.
At 31 December 2016, cash and cash equivalents amounted to 1 million and the unused long-term committed credit facilities were equal to 1.1 billion. Finally, on 11 November 2016, the Italgas Reti and subsidiaries’ debt with the former parent company Snam, amounting to 3,211 million, was repaid.
TECHNICAL INVESTMENTS Technical investments for the period amounted to 79 million, 4 million of which refer to property, plant, and equipment, and 75 million of which to intangible assets (55 of which related to agreements for services under a concession regime).
PROPOSED DIVIDEND
During the year, the parent company Italgas S.p.A. posted net income of 177 million, mainly as a result of dividend income (190 million) distributed in December by the subsidiary Italgas Reti S.p.A.
The Board of Directors will propose to Shareholders’ Meeting, convened on single call this upcoming 28 April, the distribution of a total dividend for 2016 equal to 20 cents per share, to be paid as from 24 May 2017.
33 On 19 January 2017, bonds were issued for a total of 2,150 million with the following characteristics: (i) 1,500 million, subdivided in two tranches, the first at 5 years and the second at 10 years, both with fixed rate, for an amount of 750 million each and an annual coupon of 0.50% and 1.625%, respectively; (ii) 650 million issued on 14 March 2017, with maturity on the 14 March 2024 and annual coupon at a fixed rate of 1.125%.

• 2016 ANNUAL REPORT
36
5.4 CONSOLIDATED NET FINANCIAL DEBT The consolidated net financial position at 31 December 2015, prepared in accordance with ESMA34/2015/1415 Guidelines on Alternative Performance Measures applicable from 3 July 2016, compared with the end of 2015, is composed as follows:
Consolidated Net Financial Debt showed a balance €24,027 attributable to SNAM for €11,056 million, to TERNA for €7,959 million, to ITALGAS for €3,618 million and to the Parent Company CDP RETI for €1,395 million. For further details about the item under review, see the Sector Trend and the Parent Company's Report on Operations.
34 European Securities and Market Authority.
CONSOLIDATED NET FINANCIAL DEBT
(million of euros)
Items 31/12/2016 31/12/2015
A. Cash (1) 1 1
B. Cash equivalent (1) 1,272 820
C. Trading securities - -
D. Liquidity (A)+(B)+(C) 1,273 821
E. Current Financial Receivable (2) 11 5
F. Current Bank debt (5) 4,183 1,738
G. Current portion of non current debt (3) 1,770 1,510
H. Other current f inancial debt (2) (5) (6) 125 89
I. Current Financial Debt (F)+(G)+(H) 6,078 3,337
J. Net Current Financial Indebtedness (I)-(E)-(D) 4,794 2,511
K. Non current Bank loans (4) 4,580 5,127
L. Bond Issued (4) 14,145 15,610
M. Other non current loans (4) (6) (7) 508 (336)
N. Non current Financial Indebtedness (K)+(L)+(M) 19,233 20,401
O. Net Financial Indebtedness (J)+(N) 24,027 22,912
In the consolidated balance sheet :
(1) Cash and cash equivalents
(2) Current financial assets
(3) Current portion of long-term loans
(4) Loans
(5) Current financial liabilities
(6) Non-current financial assets
(7) Other financial liabilities

REPORT ON CDP RETI GROUP OPERATIONS •
37
6. OUTLOOK - PROSPECTS FOR 2017
The constant monitoring of the most efficient financial structure of the parent company CDP RETI S.p.A. is confirmed for 2017 with a view to optimizing it in terms of duration and interest rate exposure. At the same time, activities associated with the implementation of a new organizational structure and with the definitive streamlining of the new configuration will continue during the year. On the management front, in the first semester 2017 will see the distribution of final dividend for 2016 by the subsidiaries SNAM, TERNA and ITALGAS, which will – among other things – pay for the financial expenses connected to the bond issue and outstanding loans, as well as the payment of the 2016 balance to the CDP RETI shareholders. In general terms, the group’s activities are expected to continue without change in the current sectors of interest (i.e. electricity and gas). Regarding SNAM, current estimates suggests that demand for natural gas in the five-year period 2017 - 2021 will remain more or less unchanged from 2016 levels. In terms of future prospects, SNAM shall invest approximately €5.0 billion over the next five years of which €4.7 billion to expand the national network and integrate it with continental markets, besides for the maintenance of infrastructure. Regarding TERNA, it is confirmed the engagement in the coming months in implementing the provisions of the 2017-2021 Strategic Plan approved by the Board on February 20, 2017. It is expected that the electrical sector in Italy and in Europe will be characterised by an increasing growth of non-programmable renewable production sources and by the gradual decommissioning of traditional generation plants. In this context, Terna has confirmed its strategic objectives with a focus on developing the grid to encourage the integration of renewable sources, improve the security of the system and, at the same time, accelerate the renewal of its assets. With specific reference to investments on the National Transmission Grid, over the next 5 years a total amount of approximately € 4 billion has been planned, an increase of approximately 30% compared to the previous Plan. Among the main electrical infrastructures under construction, we have the interconnections with Montenegro and France, which should come into operation in 2019. As regards non-domestic activity, in 2017 we expect the commencement of works for the construction of lines in Uruguay and Brazil for an overall length exceeding 700 km and capex of about 250 million in 2017 – 2019. The Net debt/RAB ratio is estimated to be below 60%. For 2017 we anticipate revenues of about 2.25 billion, of which 1.91 billion related to the transmission and dispatching tariff already approved by AEEGSI; EBITDA is expected to grow to about 1.58 billion. Earnings per share (EPS) could reach 34 cents. Regarding ITALGAS , we point out the pursuit of the strategic objectives envisaged in the 2016-2020 Plan with a focus on investments, on the rationalisation of processes and operating costs and on the optimization of the financial structure, paying constant attention to development opportunities. With specific reference to technical investments in tangible and intangible fixed assets, in 2017 Italgas forecasts increasing expenses compared with the previous year, attributable to the maintenance and development of the networks and to the metering business, which will involve the implementation of the smart meter installation programme, in line with the Authority’s resolutions, as well as the completion of new network structures. During 2017 Italgas will also continue the actions intended to streamline its group financial structure, extending the average maturity date of the debt and increasing the fixed-rate debt component, in line with its financial-structure goals. Lastly, Italgas will participate in tenders to renew concessions of strategic interest in order to pursue the development procedures meant to maintain and increase its market share in the gas distribution business in Italy.

• 2016 ANNUAL REPORT
38
7. SIGNIFICANT EVENTS AFTER 31 DECEMBER 2016
With respect to parent company, no significant events have occurred after 31 December 2016 that could affect the financial position and operating performance. SNAM
• 2017-2021 Business Plan.
Approved on 6 March 2017, 2017-2021 Business Plan which provides, moreover, an increase in by 2.5% a year in the 2016-2018 period. The 2018 dividend is a floor for the following years. Starting from 2017, an interim dividend will be introduced. The Company will propose to the Shareholder Meeting the payment of the interim dividend in January 2018, corresponding to 40% of the total 2017 dividend, with payment of the remaining 60% in June.
TERNA
• Agreement for the acquisition of two concessions fo r the construction and operation of networks in Brazil.
On 2 February 2017, through its subsidiary Terna Plus, Terna entered into an agreement with Planova, a Brazilian company engaged in the construction of civil-engineering and infrastructural works, to obtain two concessions to build and operate a total of about 500 km of electrical infrastructure in the South American country. The transaction is part of Terna’s strategy for the development of electrical grids and infrastructure abroad. The overall value of the contract is about 180 million and closing is contingent upon the occurrence of the following conditions: Planova must obtain all the permits and licences needed to construct and operate the infrastructures, the consent of the Antitrust (Cade - Conselho Administrativo de Defesa Econômica) and of the Brazilian Regulatory Authority (Aneel - Agência Nacional de Energia Elétrica).
• “Udine Ovest-Redipuglia” power line.
On 14 February 2017, the Ministry for Economic Development issued the decree authorizing the “Udine Ovest-Redipuglia” power line and associated rationalisation that closes the procedure opened at the end of 2015 and will allow the re-opening of the construction sites and will complete a work necessary for electrical safety of Friuli Venezia Giulia and already 80% built.
• 2017-2021 Business Plan.
The 2017-2021 Business Plan, which forecasts a dividend of about 3%, was approved on 20 February.
• Deed of Merger through incorporation of Terna Rete Italia S.r.l. and Terna Storage S.r.l. into Terna S.p.A ..
The deed of merger by incorporation into Terna S.p.A. of the wholly-owned subsidiaries Terna Rete Italia S.r.l. and Terna Storage S.r.l. was signed on 14 March 2017. The merger project had been approved by the competent bodies on 15 December 2016. The statutory effectiveness of the merger was set to start from 31 March 2017 or, if later, from the date of the last registration provided for by Art. 2504(2) of the Italian Civil Code.
.

REPORT ON CDP RETI GROUP OPERATIONS •
39
ITALGAS
• Reverse split transaction.
On 13 March 2017, the Shareholders' Meeting of Napoletanagas resolved to execute the reverse splitting of company shares at a ratio of one new share with par value of €100,000 each for every 100,000 shares with a par value of €1. The necessary steps are currently being carried out at the Companies’ Register. Upon conclusion of the reverse split transaction, Italgas Reti will hold the entire share capital of Napoletanagas.
• Rate adjustment.
On 16 March 2017, the Authority approved Resolution no. 145/2017/ R/gas “Determination of final reference rates for the gas distribution and metering services for 2016” with which it established the final rates for 2016. Furthermore, the Authority, during the same session, also approved Resolution no. 146/2017/ R/gas “Redetermination of reference rates for the gas distribution and metering services for 2009-2015”, with which it redetermined the final reference rates of 457 Italgas Reti sites for 2015 and of one site for 2014. The company deemed that the impact of both of the above resolutions on the revenue limit is to be considered marginal and immaterial.
• Execution of EMTN Programme.
On 19 January 2017, the company issued bond loans totalling 2,150 million. Refer to the Net financial debt section for further details.

• 2016 ANNUAL REPORT
40
8. OTHER INFORMATION
APPROVAL OF THE FINANCIAL STATEMENTS The Shareholders’ Meeting to approve the financial statements, as provided for by Article 10.4 of the bylaws of CDP RETI S.p.A., shall be called within 180 days of the close of the financial year. The use of that time limit rather than the ordinary limit of 120 days from the close of the financial year, permitted under Article 2364, paragraph 2, of the Italian Civil Code, is justified by the fact that the Company is required to prepare consolidated financial statements35.
RELATED-PARTY RELATIONS Details regarding relations with subsidiaries, associates, parents and the companies controlled by them, can be found in the consolidated accounts, and in particular to the section “Related-party transactions”. With respect to CDP RETI in particular, it should be noted that related-party transactions during the year, except for the ITALGAS Demerger (for which reference to the specific section should be made), cannot be classes neither as atypical nor unusual36, since they are part of normal operations. Such transactions are settled at market rates, taking into account the features of the services rendered. Such transactions are settled at market rates, taking into account the features of the services rendered. During 2016, the aforementioned transactions regarded mainly accounts with the parent company Cassa depositi e prestiti in relation to:
1) an interest-bearing deposit account; 2) a share custody and administration agreement; 3) service agreements for support activities; 4) a derivative contract; 5) loans; 6) commercial papers; 7) receivables and payables from tax consolidation
With specific reference to the aforementioned ITALGAS Demerger, whereas CDP RETI is a related party of SNAM and ITALGAS insofar as it exercises de facto control over both in accordance with international accounting standard IFRS 10 - consolidated financial statements, it should be noted that, as clarified by CONSOB Communication DEM/10078683 of 24 September 2010, a genuine proportional demerger whereby the assets and liabilities of a listed company (i.e. SNAM) are demerged into the beneficiary company (ITALGAS) and the shares are allocated proportionately to its shareholders (included CDP RETI), meaning that these are treated equally, does not constitute a “Related-Party Transaction”. As already stated, it should be remembered in any event how SNAM, CDP RETI and CDP GAS signed, on 20 October (valid from the Effective Date of the Demerger) the Shareholders’ Agreement concerning the stakes held in ITALGAS, equal to 13.50%, 25.08% and 0.97%, respectively.
TREASURY SHARES The Parent Company does not hold, and has not acquired and/or disposed of, shares or ownership interests in parent companies during the course of 2016, either directly or through trusts or intermediaries. At 31 December 2016, SNAM held 29,905,180 treasury shares (1,127,250 as at 31 December 2015), corresponding to 0.85% of share capital, with a book value of approximately €108 million. The acquisition of 28,777,930 Snam shares (equal to 0.82% of the share capital), for a cost of €103 million, was carried out as part of the share buyback programme launched by Snam on 7 November 2016, based on the resolution of the Shareholders’ Meeting of 1 August 2016.The market value
35 Since its debt securities are traded in a public market, CDP RETI S.p.A does not meet the requirements provided for by IFRS 10 - Consolidated Financial Statements for exemption from preparing consolidated financial statements.Moreover, CDP RETI’s Articles of Association call for the preparation and approval by the Board of Directors of consolidated financial statements (within 120 days after the reporting date) and of the half-yearly report (within 90 days after 30 June of each period). 36 In accordance with Consob Communication DEM/6064293 of 28 July 2006, atypical and/or unusual transactions means “those transactions which, through their significance/importance, the nature of the counterparties, the purposes of the transaction, the procedures for determining the transfer price and the timing of the event (proximity to the closure of the financial year) may give rise to doubts concerning: the accuracy/completeness of the information in the financial statements, conflicts of interest, protecting the company assets, protecting minority shareholders”.
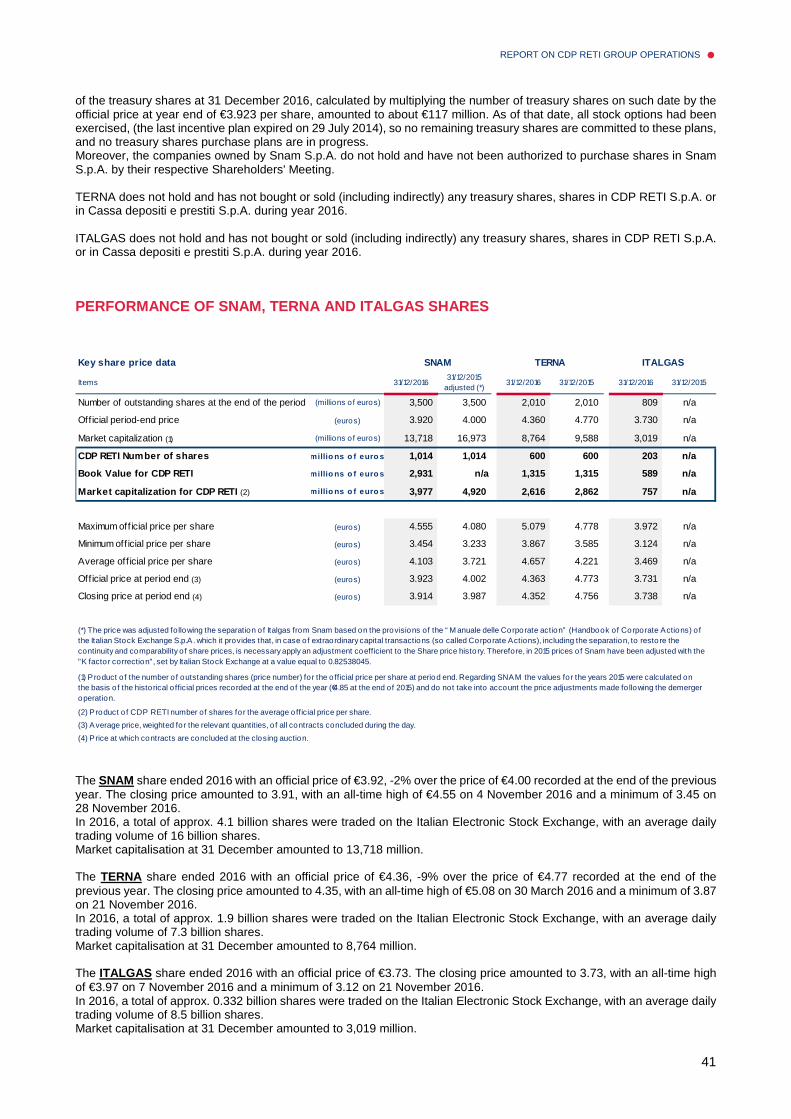
REPORT ON CDP RETI GROUP OPERATIONS •
41
of the treasury shares at 31 December 2016, calculated by multiplying the number of treasury shares on such date by the official price at year end of €3.923 per share, amounted to about €117 million. As of that date, all stock options had been exercised, (the last incentive plan expired on 29 July 2014), so no remaining treasury shares are committed to these plans, and no treasury shares purchase plans are in progress. Moreover, the companies owned by Snam S.p.A. do not hold and have not been authorized to purchase shares in Snam S.p.A. by their respective Shareholders' Meeting. TERNA does not hold and has not bought or sold (including indirectly) any treasury shares, shares in CDP RETI S.p.A. or in Cassa depositi e prestiti S.p.A. during year 2016. ITALGAS does not hold and has not bought or sold (including indirectly) any treasury shares, shares in CDP RETI S.p.A. or in Cassa depositi e prestiti S.p.A. during year 2016.
PERFORMANCE OF SNAM, TERNA AND ITALGAS SHARES
The SNAM share ended 2016 with an official price of €3.92, -2% over the price of €4.00 recorded at the end of the previous year. The closing price amounted to 3.91, with an all-time high of €4.55 on 4 November 2016 and a minimum of 3.45 on 28 November 2016. In 2016, a total of approx. 4.1 billion shares were traded on the Italian Electronic Stock Exchange, with an average daily trading volume of 16 billion shares. Market capitalisation at 31 December amounted to 13,718 million. The TERNA share ended 2016 with an official price of €4.36, -9% over the price of €4.77 recorded at the end of the previous year. The closing price amounted to 4.35, with an all-time high of €5.08 on 30 March 2016 and a minimum of 3.87 on 21 November 2016. In 2016, a total of approx. 1.9 billion shares were traded on the Italian Electronic Stock Exchange, with an average daily trading volume of 7.3 billion shares. Market capitalisation at 31 December amounted to 8,764 million. The ITALGAS share ended 2016 with an official price of €3.73. The closing price amounted to 3.73, with an all-time high of €3.97 on 7 November 2016 and a minimum of 3.12 on 21 November 2016. In 2016, a total of approx. 0.332 billion shares were traded on the Italian Electronic Stock Exchange, with an average daily trading volume of 8.5 billion shares. Market capitalisation at 31 December amounted to 3,019 million.
Key share price data
Items 31/12/201631/12/2015
adjusted (*)31/12/2016 31/12/2015 31/12/2016 31/12/2015
Number of outstanding shares at the end of the period (millions o f euros) 3,500 3,500 2,010 2,010 809 n/a
Off icial period-end price (euros) 3.920 4.000 4.360 4.770 3.730 n/a
Market capitalization (1) (millions o f euros) 13,718 16,973 8,764 9,588 3,019 n/a
CDP RETI Number of shares (millio ns o f euro s) 1,014 1,014 600 600 203 n/a
Book Value for CDP RETI (millio ns o f euro s) 2,931 n/a 1,315 1,315 589 n/a
Market capitalization for CDP RETI (2) (millio ns o f euro s) 3,977 4,920 2,616 2,862 757 n/a
Maximum off icial price per share (euros) 4.555 4.080 5.079 4.778 3.972 n/a
Minimum off icial price per share (euros) 3.454 3.233 3.867 3.585 3.124 n/a
Average off icial price per share (euros) 4.103 3.721 4.657 4.221 3.469 n/a
Off icial price at period end (3) (euros) 3.923 4.002 4.363 4.773 3.731 n/a
Closing price at period end (4) (euros) 3.914 3.987 4.352 4.756 3.738 n/a
(2) P roduct o f CDP RETI number of shares for the average o fficial price per share.
(3) Average price, weighted for the relevant quantities, o f all contracts concluded during the day.
(4) P rice at which contracts are concluded at the closing auction.
(*) The price was adjusted following the separation o f Italgas from Snam based on the provisions of the “ M anuale delle Corporate action” (Handbook of Corporate Actions) o f the Italian Stock Exchange S.p.A. which it provides that, in case o f extraordinary capital transactions (so called Corporate Actions), including the separation, to restore the continuity and comparability o f share prices, is necessary apply an adjustment coefficient to the Share price history. Therefore, in 2015 prices o f Snam have been adjusted with the "K factor correction", set by Italian Stock Exchange at a value equal to 0.82538045.
(1) P roduct o f the number o f outstanding shares (price number) fo r the o fficial price per share at period end. Regarding SNAM the values for the years 2015 were calculated onthe basis o f the historical o fficial prices recorded at the end of the year (€4.85 at the end of 2015) and do not take into account the price adjustments made fo llowing the demerger operation.
ITALGASSNAM TERNA

• 2016 ANNUAL REPORT
42
RESEARCH AND DEVELOPMENT ACTIVITIES The Parent Company, in view of the nature of the activity performed, does not carry out any R&D activity.
SECONDARY OFFICES In compliance with the provisions of Article 2428, paragraph 4, of the Italian Civil Code, it is noted that, starting from 1 July 2015, the Parent Company has had a secondary office in Via Versilia, 2 (00187 Rome).
HEALTH AND SAFETY Human Resources Health and Safety: In 2015 the company initiated the obligations imposed by Legislative Decree no. 81/2008 (Consolidated Law on Occupational Health and Safety) both to comply with legal requirements as well as for the purposes of improvement of the process of development of the company culture and knowledge and awareness of the centrality of occupational safety. In this context, the documents provided for by law were prepared, in order to map the business risks and put in place the preventive measures; to such effect, the Risk Assessment Document (RAD; this document aims to make a global and documented assessment of all risks to the health and safety related to the company) together with its annexes and the Emergency and Evacuation Plan (fire safety and risk assessment plan with regard to workplaces) were prepared. CDP RETI S.p.A., moreover, as at 31 December 2016, had all the figures required by Legislative Decree 81/2008; some of these, such as the Employer, the Workers' Safety Representative and the Emergency and First Aid Officers are in-house, whereas others, such as the Health and Safety Manager and the Company Doctor were identified outside the company. Finally, in accordance with the Consolidated Act mentioned above, staff undergo training courses. During 2016 no occupational accidents were recorded.

REPORT ON CDP RETI GROUP OPERATIONS •
43
9. REPORT ON CORPORATE GOVERNANCE AND OWNERSHIP STRUCTURE OF CDP RETI PURSUANT TO ARTICLE 123-BIS.2 B) OF THE CONSOLIDATED LAW ON FINANCIAL INTERMEDIATION (TUF)
KEY CHARACTERISTICS OF THE RISK AND INTERNAL CONTRO L MANAGEMENT SYSTEMS WITH REGARD TO THE FINANCIAL REPORTING PROCESS The CDP RETI Group is aware that financial reporting plays a central role in establishing and maintaining positive relationships between the Company and its stakeholders. The internal control system, which oversees the Company’s reporting processes, is set up – including at Group level – in such a way as to ensure that information is reliable, accurate and timely, in compliance with the applicable accounting standards. The Company’s control system is structured to comply with the model adopted in the CoSO Report37 and is subdivided into five components (control environment, risk assessment, control activity, information and communications, and monitoring) which, depending to their characteristics, operate at the organizational unit and/or operating/administrative process level. In line with the model, the controls are monitored on a periodic basis in order to assess their operational effectiveness and efficiency over time. The control model is based on an initial company-wide analysis of the control system in order to verify that the environment is, generally speaking, organised to reduce the risk of error or improper conduct with regard to the disclosure of accounting and financial information.This analysis is undertaken by verifying the presence of appropriate elements, ranging from adequate governance systems to ethical an appropriate risk management policy etc. At the process level, the approach consists of an assessment phase to identify specific risks which, if the risk event were to occur, might prevent the rapid and accurate identification, measurement, processing and representation of corporate events in the accounts. This process involves the development of risk and control association matrices that are used to analyse processes on the basis of their risk profiles and the associated control activities. The process level analysis is structured as follows:
• an initial phase identifies risks and defines control objectives in order to mitigate those risks; • a second phase regards identification and evaluation of controls by: (i) identifying the type of control; (ii) evaluating
the potential effectiveness of the control activity in risk mitigation terms; (iii) assessment/presence of control record; (iv) formulation of an overall judgement by correlating the control’s potential effectiveness and the traceability of the control; (v) identification of key controls;
• the third phase consists of identifying areas of improvement regarding the control: (i) traceability of the control; (ii) design of the control.
Monitoring the effective operation of the control system is another key component of the CoSO Report; this activity is carried out on a regular basis, addressing the periods covered by the reporting. The CDP RETI monitoring phase is structured as follows:
• sampling of items for testing; • test execution; • weighting of any anomalies detected, and an associated assessment.
Within the CDP RETI Group, the Board of Directors and Board of Auditors are periodically informed of assessments of the internal control system and on the results of tests carried out, in addition to any shortfalls emerging and the initiatives taken for their resolution. To enable the Financial Reporting Manager and the administrative bodies delegated by the Parent Company to issue the certification pursuant to Article 154-bis of the Consolidated Law on Financial Intermediation, a flow of information to the Financial Reporting Manager of the Parent Company was established, comprising the intra-Group “chain” certification system, which use the standard certification established by Consob.
37 Committee of Sponsoring Organisations of the Treadway Commission.

• 2016 ANNUAL REPORT
44
INDEPENDENT AUDITORS CDP RETI’s financial statements are audited by PricewaterhouseCoopers S.p.A. (“PwC”). During the course of the financial year, the independent auditors are responsible for verifying that the Company keeps its accounts properly and that it appropriately records events that occur during the year in the Company’s accounts. Furthermore, the independent auditors check that the individual and consolidated financial statements are consistent with the records in the accounts and audits conducted, and that these documents comply with applicable regulations. The independent auditors issue an opinion on the individual and consolidated financial statements, and on the half-year interim report. The independent auditors are appointed by the Shareholders’ Meeting in ordinary session, acting on a reasoned proposal put forward by the control body. The current independent auditors were appointed in execution of a resolution of the June 2015 Shareholders’ Meeting, which engaged that firm to audit the financial statements and accounts for the 2015 - 2023 period.
MANAGER RESPONSIBLE FOR THE PREPARATION OF THE COMP ANY’S FINANCIAL REPORTS As noted, following the bond issue in May 2015 listed on the Irish Stock Exchange, CDP RETI acquired the status of listed Issuer with Italy as Member State of origin and, therefore, was required, pursuant to Art. 154 – bis of the Consolidated Financial Act, to appoint a Financial Reporting Manager. For more information on the experience requirements and methods for appointing and substituting the Financial Reporting Manager, the provisions of Article 19.13 of CDP RETI’s Articles of Association are reported below. Article 19.13 CDP RETI Articles of Association: The board of directors appoints, subject to the prior favorable opinion of the board of statutory auditors, for a term not lower than the term of office of the same board and not higher than six fiscal years, the manager responsible for the preparation of the corporate accounting documents who shall carry out the tasks and activities provided by art. 154-bis of legislative decree 24 February 1998, n. 58. The manager responsible for the preparation of the corporate accounting documents must possess the requisites of honorability prescribed for directors and cannot hold the offices listed in Paragraph 15.11 of the By-Laws38. The manager responsible for the preparation of the corporate accounting documents must be chosen based on criteria of professionalism and competence among persons who have at least three-year experience in the administrative area of companies, consulting firms or professional firms. The manager responsible for the preparation of the corporate accounting documents may be revoked by the board of directors, subject to prior consultation with the board of statutory auditors, only for just cause. The manager responsible for the preparation of the corporate accounting documents automatically ceases from office in the absence of the requisites prescribed for the office. The forfeiture is declared by the board of directors within thirty days from the knowledge of the lack of requisites.
CODE OF CONDUCT CDP RETI, also with reference to its vision in terms of social and environmental responsibility, has adopted specific rules of conduct by transposition of the “Code of Ethics of Cassa Depositi e Prestiti S.p.A. and of Companies subject to management and coordination”. The Code of Ethics has the objective of declaring and disseminating the values and rules of conduct which the Company intends to refer to in the exercise of its business activities and governs the set of rights, duties and responsibilities that the Company expressly takes vis-a-vis the stakeholders with which it interacts in the course of its activities. The set of ethical principles and values expressed in the Code of Ethics must underlie the activity of all those who in any way act in the interests of the Company.
INTERNAL AUDIT MANAGER Having received the opinion of the Board of Statutory Auditors, upon the proposal of the CEO and in agreement with the Chairman, the Board of Directors appoints the Internal Audit Manager. The Internal Auditor Manager’s appointment is open-ended and may be revoked by the Board of Directors.
The Company’s Board of Directors, under the outsourcing of certain services agreements with CDP, including internal auditing service, has appointed on 20 March 2017 the CDP RETI Internal Audit Manager, figure belonging to the parent CDP S.p.A. Chief Audit Officer area.
38 Not entitled to hold any office in the management or control bodies, or management positions, in Eni S.p.A. and its subsidiaries, nor to have any direct or indirect relationship of a professional or economic nature with these companies.

REPORT ON CDP RETI GROUP OPERATIONS •
45
As part of CDP RETI organizational structure, the Internal Audit Manager is not responsible for any particular operational area, and has direct access to all information that is useful for carrying out his duties and performs fully independent audit activities in accordance with guidelines from the Board of Directors. His main tasks include: - the test, both on a continual basis and in relation to specific requirements the functioning and suitability of the internal control and risk management system via an audit schedule, approved by the Board of Directors; - preparation of periodic reports containing appropriate information on his work, on how risks. These reports contain an evaluation of the suitability of the internal control and risk management system; - preparation of reports on events of particular importance. The Internal Audit Manager submits the reports to the Chairpersons of the Board of Statutory Auditors and the Board of Directors, as well as to CEO and to Financial Manager. In the light of the recent appointment, no Internal Audit Manager.
ITALGAS SHAREHOLDER AGREEMENT The main provisions of the Shareholder Agreement are provided below:
• an Advisory Committee (Consultation Committee) established, comprising five members, of whom four will represent CDP RETI (3 members nominated by Cdp and 1 by SGEL) and one SNAM. The Advisory Committee will resolve through simple majority on the exercise of voting right relating to ITALGAS shares of members of the Shareholders’ Agreement. The parties to the Shareholders’ Agreement shall cast their votes, by majority vote in proportion to their shares in ITALGAS, on the basis of what is resolved by the Advisory Committee, except for the rights of SNAM relating to Reserved Matters (as defined below);
• in relation to certain resolutions of ITALGAS with an extraordinary nature (the “Reserved Matters”)39,should the Advisory Committee adopt resolutions with a vote against by the representative designated by SNAM, and the ITALGAS shareholders approve the related Reserved Matter, SNAM shall be able to: (i) sell to potential third-party purchasers its entire equity investment in ITALGAS (in this case CDP RETI shall have a pre-emption right to the equity investment and shall have a right of approval (non mero) concerning the third-party purchaser40, it being understood that the third party must enter into the Shareholders’ Agreement instead of SNAM); and (ii) if no sale of the stake occurs within 12 months, to withdraw from the Shareholders’ Agreement resulting in the cancellation of the latter;
• SNAM shall not be able to increase or sell off its equity investment in ITALGAS (the “SNAM Equity Investment”) in pieces without affecting the transfer of the entire equity investment, under certain conditions, to entities controlled by SNAM. SNAM may, at any time, sell its equity investment only in its entirety and in compliance with the following rules: (i) CDP RETI shall have a preferential purchase right to this equity investment and not only the right of approval concerning a third-party purchaser41, and (ii) the third party must enter into the Shareholders’ Agreement on the same terms and conditions as SNAM; and
• CDP RETI, CDP Gas and other parties associated with them shall not be able to acquire additional shares or other financial instruments of ITALGAS only if: (i) these actions will be conferred in the Shareholders’ Agreement, and (ii) these acquisitions would not result in the crossing of the relevant thresholds for the purposes of the rules on the obligation of a public tender offer. In addition, Cdp shall not be able to sell the ITALGAS shares that it holds, if the total equity investment attributable to the Shareholders’ Agreement would fall below 30%.
Furthermore, the Shareholders’ Agreement shall provide that CDP RETI, CDP Gas and SNAM present a joint list for appointment to the ITALGAS Board of Directors in order to ensure that SNAM designates one candidate and CDP RETI designates the remaining candidates (1 of which will be appointed by SGEL), including the CEO and the chairman, on the assumption that this list would come out first by number of votes obtained in the ITALGAS Shareholders’ Meeting. The Shareholders’ Agreement contains provisions that, subject to the Company’s admission to trading the shares, will be relevant pursuant to Art. 122(1 and 5) Consolidated finance act and, therefore, may be deemed a voting and lock-up
39 The aforementioned Reserved Matters shall be: (i) capital increases with exclusion or limitation of the option right of shareholders for a total amount exceeding 20% of the shareholders’ equity of ITALGAS; (ii) mergers or demergers for a total amount exceeding 20% of the shareholders’ equity of Italgas; (iii) wind-up or liquidation of Italgas. 40 CDP RETI will be able to reject its option solely for one of the following reasons: a) the third-party purchaser is a direct competitor of ITALGAS and/or ITALGAS RETI in the Italian territory; and/or b) the third-party purchaser is a direct competitor of ITALGAS and/or ITALGAS RETI in the Italian territory; and/or c) the third-party purchaser hails from a country against which there are restrictions on free exchange adopted by the competent international organizations; and/or d) the purchase of the SNAM equity investment by the third-party purchaser is in violation of the applicable laws; and/or e) the Third-Party Purchaser does not have specified size requirements; and/or f) conclusion of the potential transaction with the third-party purchaser or the third-party purchaser’s adoption of the Shareholders’ Agreement generates an obligation for the third-party purchaser, singly or jointly with CDP RETI and CDP GAS, to promote a mandatory initial public offering on the remaining ITALGAS shares. 41 See previous note.

• 2016 ANNUAL REPORT
46
agreement. The Shareholders Agreement will therefore be subject to the communication obligations provided for by art. 122(1) Consolidated finance act and the associated implementation provisions. The governance of ITALGAS provides that: (i) the Board of Directors, which will hold office for a period of three years from the appointment (including the year of the appointment) comprises nine members, of whom eight, including the Chairman and CEO, shall be designated by CDP RETI (one shall be designated by SGEL) and one director shall be designated by SNAM. The Board of Directors comprises four independent directors, whereas (ii) after the first renewal, the Board of Directors shall comprise nine members, of whom seven shall be drawn from the first list by number of votes and two shall be drawn from the minority lists, using a proportional mechanism (quotients). The Shareholders Agreement has a term of three years, renewable on expiry for an additional three years in the event SNAM or CDP RETI do not indicate an intention to renew with a notice period of 12 months. Where SNAM indicates its intention not to renew, CDP RETI may exercise a purchase option on the SNAM Equity Investment at fair market value within 9 (nine) months from notification of withdrawal from the Shareholders Agreement.
EFFECT ON SGEL SHAREHOLDER AGREEMENT As mentioned, Cdp, SGEL and State Grid International Development Limited42 are locked into the Shareholders’ Agreement entered into when a stake of 35% in CDP RETI was transferred to SGEL on 27 November 2014, where Cdp and SGEL made their entire equity interest partecipations in the Cdp overall representative networks of 94,10% of the share capital.
The SGEL Shareholders’ Agreement was amended on 23 December 2014 to reflect the changes to Cdp’s equity investment in SNAM following the 19 December 2014 transfer to SNAM of the stake held by Cdp (via CDP Gas) in Trans Austria Gasleitung GmbH, as part of the SNAM capital increase reserved for CDP Gas and the signing of the deed of transfer of the aforementioned equity investment by CDP Gas.
Specifically, the SGEL Shareholders’ Agreement – which has a three-year term from the date of signing and will be renewed automatically for subsequent three-year periods, unless one of the parties withdraws – grants SGEL governance rights to protect its investment in CDP RETI.
The rights and obligations of SGEL with regard to SNAM, as set out in the SGEL Shareholders’ Agreement, include in particular the following:
• as long as SGEL holds an equity investment of at least 20% in CDP RETI, it shall be entitled to appoint a candidate to be included on the list of candidates for the position of director of SNAM, which will be submitted by CDP RETI at the Shareholders’ Meeting called to appoint members of the Board of Directors;
• SGEL’s candidate must be included on the list in a position that would guarantee the candidate’s appointment to the position of director of SNAM if the CDP RETI list obtains a majority of votes at the Shareholders’ Meeting; and
• SGEL has undertaken to ensure that the director appointed by it to SNAM’s Board of Directors (if and to the extent that said director is not independent pursuant to Art. 148 of the TUF) shall abstain, to the maximum extent permitted by law, from receiving information and/or documentation from SNAM in relation to matters on which there is a conflict of interest for SGEL and/or any affiliated party, in relation to business opportunities in which SNAM, on the one hand, and SGEL and/or an affiliated party, on the other, have an interest and may be in competition. Furthermore, said director may not take part in the discussions of SNAM’s Board of Directors concerning the aforementioned matters.
In addition, the SGEL Shareholders’ Agreement entitles SGEL to withdraw if the SNAM Shareholders’ Meeting approves, inter alia, demergers where the value of the shareholders’ equity transferred to the beneficiary company is greater than 10% of SNAM’s shareholders’ equity, provided that the decisions in question have been approved by SNAM’s Shareholders’ Meeting with a favourable vote in by CDP RETI (i.e. without this vote, the resolution would not have been adopted), notwithstanding a negative vote by the SGEL-appointed members on the CDP RETI Board of Directors.
42 State Grid International Development Limited owns the entire capital of SGEL.

2016 CONSOLIDATED FINANCIAL STATEMENTS •
47
2. 2016 Consolidated Financial Statements

• 2016 ANNUAL REPORT
48
FORM AND CONTENT OF THE CONSOLIDATED FINANCIAL STATEMENTS AT 31 DECEMBER 2016
The consolidated financial statements at 31 December 2016 have been prepared in accordance with the International Financial Reporting Standards (IFRS) and consist of:
• Consolidated balance sheet • Consolidated income statement • Statement of consolidated comprehensive income • Statement of changes in consolidated equity • Statement of consolidated cash flow • Notes to consolidated financial statements
The notes to the consolidated financial statements consist of:
• Introduction • I - Basis of presentation and accounting policies • II - Notes to the consolidated statement of financial position • III - Notes to the consolidated income statement • IV - Business combinations • V - Transactions with related parties • VI - Financial risk management • VII - Share-based payments • VIII - Segment reporting • IX - Guarantees and commitments Furthermore, they are accompanied by: • Annexes • Declarations pursuant to article 154 – bis of Legislative decree no. 58/98 • Indipendent Auditors report
The “Annexes”, which are an integral part of the consolidated financial statements, include the consolidation scope.

2016 CONSOLIDATED FINANCIAL STATEMENTS •
49
CONSOLIDATED FINANCIAL STATEMENTS AT 31 DECEMBER 2016
CONSOLIDATED BALANCE SHEET
(thousands of euros)
Consolidated assets items Notes 31/12/2016 31/12/2015
NON-CURRENT ASSETS
Property, plant and equipment A1 33,671,296 33,235,235
Inventories - compulsory stock A2 362,713 362,713
Intangible assets A3 7,753,465 7,824,399
Equity investments A4 1,704,111 1,546,517
Non-current f inancial assets A5 576,306 774,709
Deferred tax assets A6 703,973 623,914
Other non-current assets A7 174,824 143,396
Total non-current assets 44,946,688 44,510,883
Non-current assets held for sale A14 24,949 24,479
CURRENT ASSETS
Current financial assets A8 42,097 72,539
Income tax receivables A9 96,445 88,078
Trade receivables A10 3,196,327 3,050,379
Inventories A11 161,035 163,968
Other current assets A12 211,994 409,918
Cash and cash equivalents A13 1,272,421 820,708
Total current assets 4,980,319 4,605,590
TOTAL ASSETS 49,951,956 49,140,952

• 2016 ANNUAL REPORT
50
CONSOLIDATED BALANCE SHEET
(thousands of euros)
Consolidated liabilities and equity items Notes 31/12/2016 31/12/2015
EQUITY P1
Share capital 162 162
Issue premium 1,315,158 1,315,158
Retained earnings 643,520 484,839
Other reserves 2,026,664 2,027,146
Valuation reserves (20,915) (7,726)
Treasury shares
Interim dividend (253,000)
Net income for the period (+/-) 348,275 518,991
Group equity 4,059,864 4,338,570
Non-controlling interests 11,106,928 11,236,673
Total Equity 15,166,792 15,575,243
NON-CURRENT LIABILITIES
Provisions P2 1,175,988 974,599
Provisions for employee benefits P3 268,293 271,647
Loans P4 19,562,974 21,081,982
Other financial liabilities P5 24,407 12,435
Deferred tax liabilities P6 2,978,417 3,110,056
Other non-current liabilities P7 451,747 416,527
Total non-current liabilities 24,461,826 25,867,246
Liabilities directly associated w ith non-current as sets held for sale P13 5,970 6,782
CURRENT LIABILITIES
Short-term loans and current portion of long-term loans P8 1,913,766 1,510,320
Trade payables P9 2,967,793 2,863,954
Income tax liabilities P10 11,169 16,787
Current financial liabilities P11 4,194,878 1,894,845
Other current liabilities P12 1,229,762 1,405,775
Total current liabilities 10,317,368 7,691,681
TOTAL LIABILITIES AND EQUITY 49,951,956 49,140,952

2016 CONSOLIDATED FINANCIAL STATEMENTS •
51
CONSOLIDATED INCOME STATEMENT
(thousands o f euros)
Conso lidated income statement items Note 31/12/2016 31/12/2015
REVENUES A
Revenues from sales and services a1 5,786,324 5,868,117
Other revenues and income a2 200,055 183,936
Total revenues 5,986,379 6,052,053
OPERATING COSTS B
Raw materials and consumables used b1 (222,950) (275,744)
Services b2 (753,261) (664,845)
Staff costs b3 (640,191) (637,995)
Amortisation, depreciation and impairment b4 (1,738,326) (1,686,523)
Other operating costs b5 (189,537) (142,801)
Total costs (3,544,265) (3,407,908)
OPERATING PROFIT A - B 2,442,114 2,644,145
FINANCIAL INCOME (EXPENSE) C
Financial income c1 92,793 117,312
Borrow ing expenses c2 (857,976) (662,302)
Portion of income (expenses) from equity investments valued w ith the equity method c3 145,596 135,610
Total financial income (expense) (619,587) (409,380)
INCOME BEFORE TAXES D 1,822,527 2,234,765
Taxes for the period E (593,562) (414,824)
NET INCOME FROM CONTINUOUS OPERATIONS F 1,228,965 1,819,941
Net income from discontinued operations G - 7,283
NET INCOME F 1,228,965 1,827,224
for
- the Group 348,275 518,991
- non-controlling interests 880,690 1,308,233

• 2016 ANNUAL REPORT
52
STATEMENT OF CONSOLIDATED COMPREHENSIVE INCOME
(thousands of euros)
Items/Figures Notes 31/12/2016 31/12/2015
1 - Net income (loss) for the period 1,228,965 1,827,224
Other comprehensive income net of taxes not transfe rred to income statement
2 - Property, plant and equipment
3 - Intangible assets
4 - Defined benefit plans P1 (529) 16,310
5 - Non-current assets held for sale
6 - Share of valuation reserves of equity investments accounted for using equity method P1 1,716
7 - Revaluation Law s
Other comprehensive income net of taxes transferred to income statement
8 - Hedging of foreign investments
9 - Exchange rate differences P1 (15,178) 6,953
10 - Cash flow hedges P1 (17,927) 18,612
11 - Financial assets available for sale
12 - Non-current assets held for sale
13 - Share of valuation reserves of equity investments accounted for using equity method 3,944
14 - Revaluation Law s
15 - Total other comprehensive income net of taxes (31,918) 45,819
16 - Comprehensive income (item 1+15) 1,197,047 1,873,043
17 - Consolidated comprehensive income attributable to non-controlling interests 861,972 1,342,230
18 - Consolidated comprehensive income attributable to shareholders of the parent company
335,075 530,813

2016 CONSOLIDATED FINANCIAL STATEMENTS •
53
STATEMENT OF CONSOLIDATED COMPREHENSIVE INCOME: PAR ENT AND NON-CONTROLLING INTERESTS
(thousands of euros)Items/Figures Notes
Pertaining to shareholders o f the
parent company
Pertaining to non-contro lling interests
TotalPertaining to
shareho lders o f the parent company
Pertaining to non-contro lling interests
Total
1 - Net income (loss) for the period 348,275 880,690 1,228,965 518,991 1,308,233 1,827,224
Other comprehensive income net of taxes not transfe rred to income statement
2 - Property, plant and equipment
3 - Intangible assets
4 - Defined benefit plans P1 (155) (374) (529) 4,842 11,468 16,310
5 - Non-current assets held for sale
6 - Share of valuation reserves of equity investments accounted for using equity method P1 502 1,214 1,716
7 - Revaluation Law s
Other comprehensive income net of taxes transferred to income statement
8 - Hedging of foreign investments
9 - Exchange rate differences P1 (4,437) (10,741) (15,178) 2,017 4,936 6,953
10 - Cash flow hedges P1 (9,109) (8,818) (17,927) 3,820 14,792 18,612
11 - Financial assets available for sale
12 - Non-current assets held for sale
13 - Share of valuation reserves of equity investments accounted for using equity method 1,143 2,801 3,944
14 - Revaluation Law s
15 - Total other comprehensive income net of taxes (13,199) (18,719) (31,918) 11,822 33,997 45,819
16 - Comprehensive income (item 1+15) 335,075 861,972 1,197,047 530,813 1,342,230 1,873,043
31/12/2016 31/12/2015

• 2016 ANNUAL REPORT
54
STATEMENT OF CHANGES IN CONSOLIDATED EQUITY: CURREN T YEAR
(thousands of euros)Items/Figures No tes
Res
erve
s
Div
iden
ds a
nd
oth
er a
lloc
atio
ns
Cha
nges
in
res
erv
es
Issu
es o
f ne
w
sha
res
Pur
chas
e o
f ow
n s
hare
s
Adv
ance
s o
n di
vide
nds
Spe
cial
div
iden
d
dist
ribut
ion
Cha
nges
in e
quit
y in
stru
men
ts
Der
iva
tives
on
own
sha
res
Sto
ck o
ptio
ns
Cha
nge
in e
qui
ty
inte
rest
s
Share capital P1 2,935,512 2,935,512 30,384 (8,886) 2,957,010 162 2,956,848
Share premium reserve 2,468,392 2,468,392 (35,529) 147,480 (3,856) 2,576,487 1,315,158 1,261,329
Reserves 8,466,505 8,466,505 601,294 (162,670) (30,141) 12,574 8,887,562 2,670,184 6,217,378
Valuation reserves P1 (20,309) (20,309) (31,918) (52,227) (20,915) (31,312)
Equity instruments - - - -
Advances on dividends (98,699) (98,699) 98,699 (354,660) (354,660) (253,000) (101,660)
Treasury shares (3,382) (3,382) (72,975) 11 (76,346) - (76,346)
Net income (loss) for the period 1,827,224 1,827,224 (699,993) (1,127,231) 1,228,965 1,228,965 348,275 880,690
Total Equity 15,575,243 15,575,243 (1,162,760) 15,19 4 (103,116) (354,660) (157) 1,197,047 15,166,792 4,059,864 11,106,928
Group equity P1 4,338,570 4,338,570 (358,327) 4,905 (30,141) (253,000) 22,782 335,075 4,059,864
Equity non-controlling interests
11,236,673 11,236,673 (804,433) 10,289 (72,975) (101,660) (22,939) 861,972 11,106,928 11,106,928
Tot
al e
quity
at
31/1
2/20
16
Gro
up e
qui
ty a
t 3
1/1
2/2
016
Equ
ity n
on-c
ontr
ollin
g in
tere
sts
at 3
1/1
2/2
016
Operazioni sul patrimonio netto
Com
preh
ensi
ve
inco
me
for
2016
Bal
ance
at
31/1
2/20
15
Cha
nge
in
re-o
peni
ng b
alan
ces
Bal
ance
at
01/0
1/20
16
Allocation o f net income fo r previous year
Changes fo r the period

2016 CONSOLIDATED FINANCIAL STATEMENTS •
55
STATEMENT OF CHANGES IN CONSOLIDATED EQUITY: PREVIO US YEAR
(thousands of euros)Items/Figures No tes
Re
serv
es
Div
iden
ds
and
ot
her
allo
catio
ns
Ch
ange
s in
re
serv
es
Iss
ues
of
new
sh
ares
Pur
chas
e of
ow
n
shar
es
Adv
anc
es o
n d
ivid
end
s
Sp
ecia
l di
vide
nd
dis
trib
utio
n
Cha
nge
s in
eq
uity
in
stru
men
ts
Der
ivat
ives
on
ow
n sh
ares
Sto
ck
optio
ns
Ch
ang
e in
eq
uity
in
tere
sts
Share capital 2,935,512 2,935,512 2,935,512 162 2,935,350
Share premium reserve 2,536,578 2,536,578 (68,186) 2,468,392 1,315,158 1,153,234
Reserves 8,161,806 8,161,806 369,919 (183,299) 92,780 25,299 8,466,505 2,511,985 5,954,520
Valuation reserves (53,051) (53,051) (13,077) 45,819 (20,309) (7,726) (12,583)
Equity instruments - - - - -
Advances on dividends (98,699) (98,699) 98,699 (98,699) (98,699) - (98,699)
Treasury shares (3,382) (3,382) (3,382) - (3,382)
Net income (loss) for the period 1,278,969 1,278,969 (468,618) (810,351) 1,827,224 1,827,224 518,991 1,308,233
Total Equity 14,757,733 - 14,757,733 - (993,650) 1 1,517 - - (98,699) - - - - 25,299 1,873,043 15,575,243 4,338,570 11,236,673
Group equity 3,986,573 - 3,986,573 - (189,097) 10, 282 - - - - - - - - 530,813 4,338,570 - -
Equity non-controlling interests
10,771,160 - 10,771,160 - (804,553) 1,235 - - (98,699) - - - - 25,299 1,342,230 11,236,673 - 11,236,673
To
tal
equ
ity a
t 31
/12/
2015
Gro
up
equ
ity
at
31/
12/2
015
Equ
ity n
on-c
ontr
olli
ng
inte
rest
s a
t 31
/12/
2015
Operazioni sul patrimonio netto
Com
preh
ensi
ve
inc
ome
for
201
5
Ba
lanc
e at
31/
12/2
014
Cha
nge
in
re-o
pen
ing
bal
anc
es
Ba
lanc
e at
01/
01/2
015 Allocation o f net income
fo r previous year
Changes fo r the period

• 2016 ANNUAL REPORT
56
STATEMENT OF CONSOLIDATED CASH FLOWS
(thousands of euros)
Items/Figures Notes 31/12/2016 31/12/2015
Net income F 1,228,965 1,827,224
Adjustments to net income to reflect cash f low from operating activities:
Amortisation and depreciation b4 1,702,762 1,671,379
Net w ritedow ns (revaluations) of property, plant and equipment and intangible assets b4 35,564 48,165
Effect of accounting using the equity method c3 (145,596) (135,610)
Net losses (gains) on disposals, cancellations and eliminations of assets 27,180 30,960
Dividends - -
Interest income (213,170) (21,489)
Interest expense 933,930 525,232
Income taxes E 593,561 414,824
Changes in w orking capital:
- Inventories 8,667 63,785
- Trade receivables (1,633) 66,224
- Trade payables (109) (80,200)
- Provisions 105,693 (24,440)
- Other assets and liabilities (105,802) 130,364
Cash flow from working capital 6,816 155,733
Change in provisions for employee benefits (26,664) (17,397)
Dividends received 148,419 140,821
Interest received 601,547 139,782
Interest paid (997,790) (682,371)
Income taxes paid net of tax credits reimbursed / income from participation in the tax consolidation mechanism
(777,249) (904,766)
Cash flow from operating activities 3,118,276 3,192,487
- with related parties 2,729,571 2,784,547
Investing activities:
- Property, plant and equipment (1,587,236) (2,523,620)
- Intangible assets (434,365) (481,994)
- Companies in the scope of consolidation and business units - (79,451)
- Equity investments (170,742) (142,905)
- Change in payables and receivables relative to investing activities (111,449) (59,092)
Cash flow from investing activities (2,303,792) (3,287,062)
Divestments:
- Property, plant and equipment 14,670 8,980
- Intangible assets 133 191
- Equity investments 4,950 146,644
- Change in payables and receivables relative to divestments 1,606,861 (398)
Cash flow from divestments 1,626,614 155,417
Net cash flow from investing activities (677,178) (3,131,645)
- with related parties 1,324,080 (173,119)
Assumption of long-term f inancial debt 3,675,206 1,046,436
Repayments of long-term f inancial debt (5,921,099) (1,619,205)
Increase (decrease) in short-term financial debt 1,877,682 699,517
(Increase) decrease of f inancial receivables for not operating purposes 216,181
Net equity capital injections (103,514) 25,697
Dividends distributed to shareholders (1,517,660) (1,092,349)
Net cash flow from financing activities (1,989,385) (723,723)
- with related parties 1,222,548 109,863
Net cash flow for the period 451,713 (662,881)
Cash and cash equivalents at start of year 820,708 1,483,589
Cash and cash equivalents at end of year A13 1,272,421 820,708

2016 CONSOLIDATED FINANCIAL STATEMENTS •
57
NOTES TO THE CONSOLIDATED FINANCIAL STATEMENTS
INTRODUCTION ............................................................................................................................................................... 59
I – BASIS OF PRESENTATION AND ACCOUNTING POLICIES ......... ...................................................................... 60
I.1. GENERAL INFORMATION ............................ ........................................................................................................ 60 I.1.1. Declaration of compliance with International Accounting Standards ............................................................... 60 I.1.2. Basis of presentation ....................................................................................................................................... 60 I.1.3. Scope and methods of consolidation............................................................................................................... 64 I.1.4. Events subsequent to the reporting date ......................................................................................................... 67 I.1.5. Other issues .................................................................................................................................................... 67
I.2. SECTION PERTAINING TO THE MAIN ITEMS OF THE CONSOLIDATED FINANCIAL STATEMENT .............. 68 I.2.1. Property, plant and equipment ........................................................................................................................ 68 I.2.2. Asset used in finance leases ........................................................................................................................... 69 I.2.3. Intangible assets ............................................................................................................................................. 69 I.2.4. Equity investments .......................................................................................................................................... 70 I.2.5. Financial assets............................................................................................................................................... 70 I.2.6. Trade receivables ............................................................................................................................................ 73 I.2.7. Inventories ....................................................................................................................................................... 74 I.2.8. Construction contracts ..................................................................................................................................... 74 I.2.9. Cash and cash equivalent ............................................................................................................................... 74 I.2.10. Current and deferred taxation ....................................................................................................................... 74 I.2.11 Provisions ....................................................................................................................................................... 75 I.2.12. Provision for employee benefit ...................................................................................................................... 75 I.2.13. Financial liabilities ......................................................................................................................................... 75 I.2.14. Revenues ...................................................................................................................................................... 75 I.2.15. Grants ........................................................................................................................................................... 75 I.2.16. Interest income and expense ........................................................................................................................ 76 I.2.17. Dividends ...................................................................................................................................................... 76 I.2.18. Share-based payments ................................................................................................................................. 76 I.2.19. Capitalised borrowing cost ............................................................................................................................ 76 I.2.20. Fair value measurement ................................................................................................................................ 76 I.2.21. Business combinations .................................................................................................................................. 77 I.2.22. Transactions with related parties ................................................................................................................... 78
II - INFORMATION ON THE CONSOLIDATED BALANCE SHEET ...... ...................................................................... 79
I. Assets ......................................... .............................................................................................................................. 79 Non-current assets ................................................................................................................................................... 79 Current assets .......................................................................................................................................................... 88
II. Liabilities ................................... .............................................................................................................................. 92 P1. Equity ................................................................................................................................................................. 92 Non-current liabilities ................................................................................................................................................ 92 Current liabilities ....................................................................................................................................................... 98
III - INFORMATION ON THE CONSOLIDATED INCOME STATEMENT . ................................................................ 101
A. Revenues ....................................... ....................................................................................................................... 101 a1. Revenues from sales and services................................................................................................................... 101 a2. Other revenues and income ............................................................................................................................. 102
B. Operating costs ................................ .................................................................................................................... 102 b1. Raw materials and consumables used ............................................................................................................. 102 b2. Services ........................................................................................................................................................... 102 b3. Staff costs ........................................................................................................................................................ 103 b4. Amortisation, depreciation and impairment ...................................................................................................... 104 b5. Other operating costs ....................................................................................................................................... 105

• 2016 ANNUAL REPORT
58
C. Financial income (expense) ..................... ........................................................................................................... 105 c1. Financial income .............................................................................................................................................. 105 c2. Financial expenses ........................................................................................................................................... 106 c3. Portion of income / (expenses) from equity investments carried at equity ........................................................ 106
E. Taxes for the year .............................. ................................................................................................................... 107
G. Net income from discontinued operations ........ ................................................................................................ 108
IV - BUSINESS COMBINATIONS ............................. ................................................................................................. 109
IV.1 Transactions carried out during the period .... ................................................................................................ 109
IV.2 Transactions carried out after the reporting da te .......................................................................................... 109
V - TRANSACTIONS WITH RELATED PARTIES .................. ................................................................................... 110
V.1 Information on the remuneration of key managemen t personnel ....................................... ........................... 110
V.2. Information on transactions with related partie s ........................................................................................... 110
VI - FINANCIAL RISK MANAGEMENT ........................ ............................................................................................. 112
VI.1. Risk of change in interest rates and risks rel ated to funding needs ............................. .............................. 112
VI.2. Exchange rate risk ........................... ................................................................................................................ 112
VI.3. Credit risk................................... ....................................................................................................................... 113
VI.4. Liquidity risk ............................... ...................................................................................................................... 113
VI.5. Default risk and debt covenants .............. ....................................................................................................... 114
VII – SHARE-BASED PAYMENTS ............................. ............................................................................................... 115
VIII – SEGMENT REPORTING .................................................................................................................................. 116
IX - GUARANTEES AND COMMITMENTS ....................... ........................................................................................ 117
IX.1 Guarantees..................................... .................................................................................................................... 117
IX.2 Commitments ................................... ................................................................................................................. 117
IX.3 Risks ......................................... .......................................................................................................................... 117
ANNEXES .................................................................................................................................................................. 119
ANNEX 1: LIST OF EQUITY INVESTMENTS ............................................................................................................ 120
REPORT OF THE INDEPENDENT AUDITORS ........................................................................................................ 121
CERTIFICATION OF THE CONSOLIDATED FINANCIAL STATEMENTS pur suant to article 154 – bis of legislative decree no. 58/1998 .................... ............................................................................................................. 123

2016 CONSOLIDATED FINANCIAL STATEMENTS •
59
INTRODUCTION
Form and content of the consolidated financial stat ements
The consolidated financial statements of the CDP RETI Group (the “Group”) have been prepared in accordance with the IFRS and comprise the consolidated statement of financial position, the consolidated income statement, the consolidated statement of comprehensive income, the consolidated statement of changes in equity, the consolidated statement of cash flows and these notes. They are also accompanied by the Directors' report on operations.
CDP RETI S.p.A. is required to prepare consolidated financial statements in accordance with the IFRS (IFRS 10). Indeed, the conditions for the exemption from the preparation of consolidated financial statements due to the fact of being the sub-holding of a holding company (Cassa depositi e prestiti S.p.A.) which, in turn, draws up consolidated financial statements, do not apply to entities that issued listed debt instruments on a regulated market.
These consolidated financial statements are clearly presented and give a true and fair view of the Group's financial position, performance and cash flows for the year.
All figures in the financial statements and in the tables in the Notes are in thousands of euro.
In the income statement, revenues are indicated without sign, while costs are shown in brackets.
The rounded amounts for the various items are the sum of the rounded balances of sub-items.
Audit of the consolidated financial statements
The consolidated financial statements of the CDP RETI Group at 31 December 2016 have been audited by PricewaterhouseCoopers S.p.A. as per the engagement assigned by the shareholders in their meeting of 24 June 2015 to carry out the legally-required audit for the 2015-2023 period.

• 2016 ANNUAL REPORT
60
I – BASIS OF PRESENTATION AND ACCOUNTING POLICIES
I.1. GENERAL INFORMATION
I.1.1. DECLARATION OF COMPLIANCE WITH INTERNATIONAL ACCOUNTING STANDARDS
These financial statements have been prepared in accordance with the International Financial Reporting Standards (IFRS) issued by the International Accounting Standards Board (IASB), as endorsed by the European Commission and in force at 31 December 2016, taking into account also the minimum reporting requirements established by the Italian Civil Code, where compatible with the standards adopted.
The IFRS also include the International Accounting Standards (IAS) and the interpretations issued by the IFRS Interpretation Committee (IFRS IC) and that are still in force, including those previously issued by the International Financial Reporting Interpretations Committee (IFRIC) and, even earlier, by the Standing Interpretations Committee (SIC).
I.1.2. BASIS OF PRESENTATION
The consolidated financial statement formats used to prepare the consolidated financial statements, which coincide with those used in the Annual Financial Report 2015, are consistent with the provisions of IAS 1 – Presentation of Financial Statements (hereinafter, IAS 1).
In particular:
• the items on the consolidated balance sheet are classified by distinguishing assets and liabilities as “current / non-current”;
• the consolidated income statement has been prepared by classifying costs by their nature, insofar as this form of presentation is deemed the most appropriate for representing the actual situation of the Company, and is consistent with the consolidated practice of firms operating on international markets;
• the statement of consolidated comprehensive income shows income inclusive of the revenues and costs that are recognised directly in equity pursuant to IFRS;
• the statement of changes in consolidated equity presents the total income (loss) for the year, the transactions with shareholders and other changes in equity;
• the consolidated cash flow statement is drafted by using the “indirect” method, adjusting net income for the effects of non-cash transactions.
It is believed that these statements present an adequate view of the Group's financial position and performance of operations.
The financial statements have been prepared in accordance with the IFRS issued by the IASB (including the SIC and IFRIC interpretations) and endorsed by the European Commission pursuant to Regulation (EC) 1606 of 19 July 2002.
For the purposes of interpretation and to provide support in applying these standards, the following documents have also been considered, although they have not been endorsed by the European Commission:
• the Framework for the Preparation and Presentation of Financial Statements (issued by the International Accounting Standards Board in 2001);
• Implementation Guidance, Basis for Conclusions, IFRIC interpretations, and any other documentation prepared by the IASB or IFRIC to supplement the IFRS;
• Interpretation documents concerning the application of the IFRS in Italy, prepared by the Organismo Italiano di Contabilità (Italian Accounting Board; OIC).
Where the information required by international accounting standards is considered inadequate for providing a true and fair view, the Notes to the financial statements also include additional information for such purpose.
The financial statements have been prepared on an accrual and going-concern basis. The general principles of the materiality and significance of information and the prevalence of substance over form have also been taken into account.

2016 CONSOLIDATED FINANCIAL STATEMENTS •
61
No assets have been offset against liabilities, or revenues against costs, unless expressly required or allowed by accounting standards or a related interpretation.
New accounting standards applicable to the financia l statements for the year ended 31 December 2016
As required by IAS 8 (Accounting policies, changes in accounting estimates and errors) details are provided below of the new international accounting standards, or amendments to standards already in force, whose application became mandatory from 1 January 2016:
• European Commission Regulation (EU) no. 2016/1703 of 22 September 2016, published in Official Journal L. 257 of 23 September, amending Regulation (EC) no. 1126/2008, adopting certain international accounting standards in accordance with Regulation (EC) no. 1606/2002 of the European Parliament and of the Council as regards International Financial Reporting Standards (IFRS) 10 and 12 and International Accounting Standard (IAS) 28. The main amendments concern: - IFRS 10 – Consolidated Financial Statements: the document aims to restrict the cases for exemption from
presentation of the consolidated financial statements, the prerequisites for determination of an investment entity and the cases of exemptions from consolidation of the investments held by investment entities;
- IFRS 12 – Disclosure of Interests in Other Entities: the amendments mandate the disclosure that has to be given by the investees that prepare financial statements where their subsidiaries are measured in accordance with IFRS 10;
- IAS 28 – Investments in Associates and Joint Ventures: the amendments introduce new guidelines for application of the equity method, by restricting the conditions for exemption from its application.
• European Commission Regulation (EU) no. 2015/2173 of 24 November 2015, published in the Official Journal L. 307 of 25 November, adopting the Amendments to IFRS 11 entitled “Accounting for Acquisitions of Interests in Joint Operations”. The amendments provide guidance on accounting of acquisitions of interests in joint operations that constitute a business.
• European Commission Regulation (EU) no. 2015/2231 of 2 December 2015, published in the Official Journal L. 317 of 3 December, adopting Amendments to IAS 16 – Property, Plant and Equipment and IAS 38 – Intangible Assets. The amendment in question clarifies when a revenue-based depreciation or amortisation method, or one based on a plan that depreciates property, plant and equipment and amortises intangible assets based on the revenue that is generated by an activity that includes their use is appropriate.
• European Commission Regulation (EU) no. 2015/2343 of 15 December 2015, published in the Official Journal L. 330 of 16 December, adopting the IFRS Annual improvements cycle 2012-2014. Its principal amendments affect: - IFRS 5 - Non-current Assets Held for Sale and Discontinued Operations: the amendment introduces specific
guidance on IFRS 5 if an entity reclassifies an asset from the held-for-sale category to the held-for-distribution category (or vice-versa), or when the pre-requisites for classification of an asset as held-for-distribution lapse. The amendments state that: - these reclassifications do not constitute a change to a plan (for sale or distribution) and, therefore, the
classification and measurement criteria remain valid; - the assets that no longer meet the classification criteria envisaged for held-for-distribution should be treated
in the same way as an asset that ceases to be classified as held for sale. - IFRS 7 – Financial Instruments: Disclosures: the amendment governs the introduction of additional guidance to
clarify whether a servicing contract constitutes residual involvement in a transferred asset for the purposes of the disclosure requested in connection with the transferred assets. It also clarifies that the disclosure on offsetting of financial assets and liabilities is not explicitly required for all interim financial statements. However, this disclosure might be necessary to comply with the requirements imposed by IAS 34, when material information is involved.
- IAS 19 – Employee Benefits: the document explains that to determine the discount rate of post-employment benefits, reference has to be made to high quality corporate bonds issued in the same currency used to pay the benefits and that the scope of the reference market has to be defined in terms of foreign currency.
- IAS 34 – Interim Financial Reporting: the document introduces changes to clarify that certain required information has to be given in the interim financial statements or, at least, in other parts of the interim financial report, with the caution of adding cross-references to that other section in the interim financial statements. In this last case, the interim financial report has to be provided to the readers of the financial statements in the same ways and at the same time as the interim financial statements. Otherwise, the latter will have to be considered incomplete.
• European Commission Regulation (EU) no. 2015/2406 of 18 December 2015, published in the Official Journal L. 333 of 19 December, adopting Amendments to IAS 1 – Presentation of Financial Statements: Disclosure initiative. In the broader scope of improving financial statement disclosures, the amendment in question makes several changes to IAS 1 which provide clarification on the elements that may be perceived as impediments to clear and intelligible preparation of the financial statements.
• European Commission Regulation (EU) no. 2015/2441 of 18 December 2015, published in the Official Journal L. 336 of 23 December, adopting Amendments to IAS 27 – Separate Financial Statements: Equity Method in Separate Financial Statements. The amendment in question introduces the possibility of recognising in the investor's separate

• 2016 ANNUAL REPORT
62
financial statements those investments in subsidiaries, subsidiaries under joint control or subject to significant influence by using the equity method.
• European Commission Regulation (EU) no. 2015/2113 of 23 November 2015, published in the Official Journal L. 306 of 24 November, adopting Amendments to IAS 16 – Property, Plant and Equipment and IAS 41 – Agriculture: bearer plants. Although this amendment is immaterial for the Company, the change permits application of the same accounting treatment of plants used to grow agricultural products over several years, known as bearer plants, as the method used to account for property, plant and equipment in accordance with IAS 16 – Property, Plant and Equipment.
• Regulation (UE) no. 28/2015 for endorsement: Improvements to the international accounting standards Cycle 2010-2012. The aim of the annual improvements is to address necessary issues related to inconsistencies found in the IFRS Standards or terminological clarifications that are not urgent but have been discussed by the IASB during the project cycle begun in 2011. In certain cases, the amendments represent clarifications or corrections to the standards in question (IFRS 8, IAS 16, IAS 24 and IAS 38), in other cases the amendments entail changes to current provisions or provide additional information on their application (IFRS 2 and 3).
• European Commission Regulation (EU) no. 29/2015 of 17 December 2014, published in the Official Journal L. 5 of 9 January 2015, adopting Amendments to IAS 19 – Defined Benefits Plans: Employee Contributions. The amendment to IAS 19 became necessary to facilitate, when certain conditions are met, the recognition of defined benefit plans that call for contributions by employees or third parties. In the absence of certain conditions, the recognition of these contributions is more complex because they will have to be attributed to the individual periods of the plan by making an actuarial calculation of the related liability.
New accounting standards and interpretations alread y issued and endorsed by the European Union but not yet in force:
Listed below are the new standards and interpretations already issued but not yet in force and therefore not applicable to the preparation of the financial statements at 31 December 2016 (unless, where permitted, it is chosen to adopt them in advance):
• European Commission Regulation (EU) no. 2016/2067 of 22 November 2016, published in Official Journal L. 323 of 29 November 2016, amending Regulation (EC) no. 1126/2008, adopting certain international accounting standards in accordance with Regulation (EC) no. 1606/2002 of the European Parliament and of the Council as regards IFRS 9. The standard aims to improve the financial reporting of financial instruments by addressing concerns that arose in this area during the financial crisis. In particular, IFRS 9 addresses the call to move to a more forward-looking model for the recognition of expected losses on financial assets
• European Commission Regulation (EU) no. 2016/1905 of 22 September 2016, published in Official Journal L. 295 of 29 October 2016, amending Regulation (EC) no. 1126/2008, adopting certain international accounting standards in accordance with Regulation (EC) no. 1606/2002 of the European Parliament and of the Council as regards IFRS 15. This standard aims to improve the financial reporting of revenue and to improve comparability of the top line in financial statements globally.
IFRS 9: Financial Instruments
The endorsement of IFRS 9 by the European Union completes and ends the process to replace IAS 39. This process is divided into three phases, named: “classification and measurement”, “impairment”, and “hedge accounting”. Rimane da ultimare la revisione delle regole di contabilizzazione delle coperture generiche (cd. Revision of the rules for macro hedge accounting still has to be completed, for which the IASB has decided to undertake a separate project from IFRS 9.
In extreme summary, the main innovations wrought by the new standard involve:
• la classificazione e la misurazione degli strumenti di debito, basata sull’analisi contestuale del modello di gestione adottato (cd. the classification and measurement of debt instruments, based on the contextual analysis of the adopted business model and the characteristics of the contractual cash flows generated by the instrument, envisages three accounting categories: financial assets measured at amortised cost, financial assets measured at fair value through profit and loss (“FVTPL”), and financial assets measured at fair value through other comprehensive income “FVOCI”). “FVTPL”), attività finanziarie valutate al fair value con contropartita la riserva di patrimonio netto (cd. “FVOCI”). In contrast with the current IAS 39, the portfolios of available-for-sale financial assets and financial assets held to maturity, and the possibility of separating the embedded derivatives from hybrid contracts for financial assets alone, are eliminated. Instead, the current classification and measurement rules for financial liabilities as given in IAS 39 are confirmed;
• the classification of equity instruments in the FVTPL category, unless the option is exercised to classify the equity instruments not held for trading in the FVOCI category;
• la contabilizzazione del cd. the recognition of “own credit risk” (i.e. the change in value of the financial liabilities designated under the fair value option attributable to the change in the entity’s own credit quality) through other comprehensive income, instead of in the income statement as currently provided by IAS 39;
• the presence of just one impairment model, to be applied to all financial assets not measured at fair value through profit and loss (“FVTPL”), based on the concept of Expected Credit Loss as compared with the previous concept of

2016 CONSOLIDATED FINANCIAL STATEMENTS •
63
Incurred Loss. “FVTPL”), basato su sul concetto di Perdita Attesa (cd. “Expected Credit Loss”) rispetto al precedente concetto di Perdita Subita (cd. “Incurred Loss”). The aim of this new approach to impairment is to ensure more immediate recognition of losses than the present “Incurred Loss” model envisaged in IAS 39, according to which the losses have to be recognised if evidence is found of impairment losses after initial recognition of the asset. In detail, the new model envisages that the financial assets be allocated in three distinct “stages” in increasing order of deterioration of the credit quality: - stage 1: this involves the performing financial assets for which no significant credit impairment was recognised in
comparison with the date of initial recognition. These assets are recognised on the basis of an expected loss one year out;
- stage 2: this involves the performing financial assets whose credit quality has deteriorated significantly since initial recognition. These financial assets are also measured based on their lifetime expected credit loss;
- stage 3: this involves the credit-impaired financial assets which, having suffered a significant increase in their credit risk since initial recognition, are measured based on their lifetime expected credit loss;
• il riconoscimento e la rilevazione delle relazioni di copertura (cd. hedge accounting, with the aim of guaranteeing greater alignment between accounting hedges and operating (or economic) hedge relationships established by the Risk Management Department;
• the impossibility of voluntarily interrupting a hedge accounting relationship if the aim of the hedge by Risk Management remains.
Mandatory application of the standard is scheduled to begin on 1 January 2018, with the possibility of early application of the entire standard or only of the amendments related to the accounting of own credit risk for financial liabilities measured at fair value.
IFRS 15: Revenue from Contracts with Customers
The standard, published by the IASB on 28 May 2014, has introduced a single model for measuring all revenue deriving from contracts with customers and replaces the previous standards/interpretations on revenue (IAS 18, IAS 11, IFRIC 13, IFRIC 15, IFRIC 18, SIC 31). According to this model, the entity has to recognise revenue according to the consideration to which it expects to be entitled in exchange for the goods or services provided, determined according to the following five steps:
• identification of the contract, defined as an agreement having commercial substance between two or more equal parties that can generate rights and obligations;
• identification of the performance obligations contained in the contract; • determination of the transaction price, i.e. the consideration expected for the transfer of goods or services to the
customer; • allocation of the transaction price to each of the performance obligations, by reference to their standalone selling
prices; • recognition of the revenue allocated to the individual obligation when it is satisfied, i.e. when the customer obtains
control of the goods and services. This recognition acknowledges the fact that certain services may be provided at a specific time or over a period of time.
Accounting standards, amendments and interpretation s that have not yet been endorsed by the European Union at the reporting date of these f inancial statements
Certain accounting standards, interpretations and amendments had been issued by the IASB but not yet endorsed by the European Union at the approval date of these financial statements:
• IFRS 14 – Regulatory Deferral Accounts; • IFRS 16 – Leases; • Amendments to IFRS 10 – Consolidated Financial Statements and IAS 28 – Investments In Associates And Joint
Ventures: Sale or Contribution of Assets between an Investor and its Associate or Joint Venture; • Amendments to IAS 12: Recognition of Deferred Tax Assets for Unrealised Losses; • Amendments to IAS 7: Disclosure Initiative; • Amendments to IFRS 2: Classification and Measurement of Share-based Payment Transactions; • Clarifications on IFRS 15: Revenue from Contracts with Customers; • Amendments to IFRS 4: Applying IFRS 9 – Financial Instruments with IFRS 4 – Insurance Contracts.
IFRS 16 – Leases
On 13 January 2016 the IASB published IFRS 16 (Leases), which is intended to replace the current accounting standard IAS 17, and the interpretations IFRIC 4 (Determining whether an Arrangement contains a Lease), SIC 15 (Operating Leases – Incentives), and SIC 27 (Evaluating the Substance of Transactions Involving the Legal Form of a Lease). Il nuovo principio fornisce una nuova definizione di lease ed introduce un criterio basato sul controllo (cd. The new standard gives

• 2016 ANNUAL REPORT
64
a new definition of lease and introduces a principle based on control (“right of use”) of an asset, to distinguish finance leases from service agreements, by identifying the following as discriminating elements: identification of the asset, the right to substitute it, the right to obtain substantially all economic benefits resulting from use of the asset and the right to manage use of the asset underlying the agreement. The aim is to ensure greater comparability between financial statements due to the different accounting principles applied to operating leases and finance leases. The standard establishes a single model for recognition and measurement of leases by the lessee, which entails recognition of the leased asset, including those held under an operating lease, on the assets side of the statement of financial position, with a balancing entry for the financial liability, while also offering the possibility of not recognising as finance leases those agreements whose object are “low-value assets” and leases whose term is 12 months or less. In contrast, the new standard does not envisage significant changes for the lessors.
The new standard applies beginning 1 January 2018, with the envisaged possibility of early application, while the process of endorsement by the European Union is still under way.
Other information
The Board of Directors of 31 March 2017 approved the Group’s 2016 consolidated financial statements authorising their publication and disclosure in line with the deadlines and methods envisaged by current regulations applicable to CDP RETI.
I.1.3. SCOPE AND METHODS OF CONSOLIDATION
Subsidiaries are consolidated on a line-by-line basis, while companies subject to joint control or significant influence are accounted for using the equity method. This does not include certain minor controlling interests in subsidiaries or subsidiaries in the start-up phase that do not contain any assets whose contribution to the condensed consolidated interim financial statements are not significant for the purposes of the full representation of the performance and financial position of the CDP RETI Group.
The figures of the subsidiaries are used for the full line-by-line consolidation of those relating to 31 December 2016, as approved by the competent bodies of the consolidated companies, adjusted where necessary to bring them into line with the Group's accounting policies.
The following table reports the companies included in the scope of consolidation on a full line-by-line basis.

2016 CONSOLIDATED FINANCIAL STATEMENTS •
65
Equity investments in subsidiaries
During the 2016 financial year there was a change in consolidation scope with respect to 31 December 2015 following Terna S.p.A.’s acquisition, on 13 October 2016, of the Uruguayan company “Difebal S.A.”
It should be noted that with ITALGAS no longer being within the consolidation scope of the SNAM Group as a result of the spin-off of the gas distribution segment which took effect on 07 November 2016, there was no impact on the Group’s consolidation scope since the parent company, CDP RETI, continues to exercise effective control of Italgas in accordance with accounting standard IFRS 10 “Consolidated Financial Statements”.
Significant assessments or assumptions made to dete rmine the scope of consolidation
Full line-by-line consolidation
Full consolidation involves the line-by-line incorporation of the aggregates of the Balance sheets and Income statements of subsidiaries. After the allocation to non-controlling interests, reported as a separate item, of their share of equity and net income, the value of the equity investment is cancelled against the residual value of the equity of the subsidiary.
Acquisitions of companies are accounted for using the “acquisition method” provided for under IFRS 3, as modified by Regulation 495/2009, under which the identifiable assets acquired and the identifiable assets assumed (including contingent liabilities) are recognised at their respective fair values at the acquisition date.
For the newly acquired companies, the difference between the purchase price and the equity is provisionally allocated to goodwill if positive or to liabilities under item “Other non-current liabilities” if negative, net of any goodwill in the balance sheets of the acquirees. In accordance with IFRS 3, paragraph 45 et seq., the difference resulting from the transaction must be allocated definitively within twelve months of the acquisition date. If positive, the difference is recognised – after any allocation to the assets and liabilities of the subsidiary – as goodwill or other intangible assets under intangible assets. If negative, it is recognised through profit or loss.
The acquisition method is applied as from the moment in which control of the acquiree is effectively acquired.
Accounting for companies using the equity method
Associates and joint ventures are accounted for using the equity method.
Name Operating office Registered o ffice Investo r % ho lding
1 ACAM GAS S.p.A. La Spezia La Spezia 1 Italgas Reti SpA 100.00% 100.00%
2 Difebal S.A. Montevideo (Uruguay) Montevideo (Uruguay) 1 Terna S.p.A. 100.00% 100.00%
3 Gasrule Insurance D.A.C. Dublino (Irlanda) Dublino (Irlanda) 1 SNAM S.p.A. 100.00% 100.00%
4 GNL Italia SpA San Donato Milanese (MI) San Donato Milanese (MI) 1 SNAM S.p.A. 100.00% 100.00%
5 Italgas Reti S.p.A. Torino Torino 1 Italgas SpA 100.00% 100.00%
6 Italgas S.p.A. Milano Milano 4 CDP RETI S.p.A. 25.08% 25.08%
SNAM S.p.A. 13.50% 13.50%
7 Monita Interconnector S.r.l. Roma Roma 1 Terna S.p.A. 95.00% 95.00%
Terna Rete Italia S.p.A. 5.00% 5.00%
8 Napoletanagas S.p.A Napoli Napoli 1 Italgas Reti SpA 99.69% 99.69%
9 Piemonte Savoia S.r.l. Roma Roma 1 Terna Interconnector S.r.l. 100.00% 100.00%
10 Rete S.r.l. Roma Roma 1 Terna S.p.A. 100.00% 100.00%
11 SNAM RETE GAS S.p.A. San Donato Milanese (MI) San Donato Milanese (MI) 1 SNAM S.p.A. 100.00% 100.00%
12 SNAM S.p.A. San Donato Milanese (MI) San Donato Milanese (MI) 4 CDP RETI S.p.A. 28.98% 28.98%
13 Stogit S.p.A. San Donato Milanese (MI) San Donato Milanese (MI) 1 SNAM S.p.A. 100.00% 100.00%
14 T.E.S. TRANSFORMER ELECTRO SERVICE S.r.l. Ospitaletto (BS) Ospitaletto (BS) 1 Tamini Trasformatori S.r.l. 100.00% 100.00%
15 Tamini Transformers USA L.L.C. Chicago (USA) Chicago (USA) 1 Tamini Trasformatori S.r.l. 100.00% 100.00%
16 Tamini Trasformatori S.r.l. Melegnano (MI) Melegnano (MI) 1 Terna Plus S.r.l. 70.00% 70.00%
17 Terna Chile S.p.A. Santiago del Cile (RCH) Santiago del Cile (RCH) 1 Terna Plus S.r.l. 100.00% 100.00%
18 TERNA Crna Gora d.o.o. Podgorica (Montenegro) Podgorica (MNE) 1 Terna S.p.A. 100.00% 100.00%
19 Terna Interconnector S.r.l. Roma Roma 1 Terna S.p.A. 65.00% 65.00%
TERNA RETE ITALIA S.p.A. 5.00% 5.00%
20 TERNA PLUS S.r.l. Roma Roma 1 Terna S.p.A. 100.00% 100.00%
21 TERNA RETE ITALIA S.p.A. Roma Roma 1 Terna S.p.A. 100.00% 100.00%
22 TERNA RETE ITALIA S.r.l. (ex TELAT) Roma Roma 1 Terna S.p.A. 100.00% 100.00%
23 Terna S.p.A. Roma Roma 4 CDP RETI S.p.A. 29.85% 29.85%
24 Terna Storage S.r.l. Roma Roma 1 Terna S.p.A. 100.00% 100.00%
25 Tes Transformer Electro Service Asia Private Limited Magarpatta City, Hadapsar, Pune (India) Magarpatta City, Hadapsar, Pune (IND) 1 T.E.S. TRANSFORMER ELECTRO SERVICE S.r.l. 100.00% 100.00%
26 V.T.D. Trasformatori S.r.l. Valdagno (VI) Valdagno (VI) 1 Tamini Trasformatori S.r.l. 100.00% 100.00%
Type o f relationship
(1)
Equity investment% o f votes
(2)
Key
(1) Type of relationship:
1 = M ajo rity of vo ting rights in ordinary shareho lders’ meeting
2 = Dominant influence in o rdinary shareholders’ meeting
3 = Agreements with o ther shareho lders
4 = Other fo rm o f contro l
5 = Unitary management pursuant to Article 26.1 o f Legislative Decree 87/92
6 = Unitary management pursuant to Article 26.2 o f Legislative Decree 87/92
(2) Actual percentage o f votes in o rdinary shareho lders’ meeting, distinguishing between effective and potential vo tes

• 2016 ANNUAL REPORT
66
The equity method involves initial recognition of the equity interest at cost, which is subsequently adjusted on the basis of the share held in the equity of the investee.
The difference between the value of the equity interest and the share held of the equity of the investee is included in the carrying amount of the investee.
The share of profit or loss of the investee is recognised in a specific item of the consolidated income statement.
If there is evidence of impairment, the recoverable amount of the investment is estimated and it is given by the higher of its fair value and its value in use (present value of the future cash flows which may be generated by the investment, including the final disposal value). If the recoverable value is less than the carrying amount resulting from the application of the equity method, the difference is recognised through profit or loss.
The consolidation of joint ventures and investments in associates was based on the most recent (annual or interim) financial figures approved by the companies.
Significant assessments or assumptions made to dete rmine whether there is joint control or significant influence
Subsidiaries
Subsidiaries are entities, included structured entities, which are directly or indirectly controlled by the company. Control over an entity is evidenced by the Group's capacity to exercise power in order to influence variable returns to which the Group is exposed as a result of its relationship with the aforementioned entity.
In order to verify the existence of control, the Group considers the following factors:
• the purpose and the structure of the investee, in order to identify the entity's objectives, the activities that determine its revenues and how such activities are governed;
• the power, in order to understand whether the Group has contractual rights enabling it to govern relevant activities; to this end, only substantial rights that confer effective governance are considered;
• the exposure in the investee, in order to assess whether the Group has business relationships with the investee whose returns vary as a result of variances in the investee's performance;
• the existence of potential principal-agent relationships.
Where significant activities are governed through voting rights, the following factors show evidence of control:
• direct or indirect ownership - through one's subsidiary - of over fifty per cent of voting rights of an entity, unless it can be demonstrated - in exceptional cases - that such ownership does not constitute control;
• ownership of fifty per cent or less of the votes that can be exercised in the Shareholders' Meeting and unilateral ability to govern main activities through:
o control of over half of voting rights by virtue of an agreement with other investors; o power to determine financial and operational policies of the entity by virtue of a clause of the Articles of Association
or an agreement; o power to appoint or remove the majority of the members of the Board of Directors or the equivalent governing body,
where management of the business falls under the remit of the aforementioned Board of body; o power to exercise the majority of voting rights in the meetings of the Board of Directors or those of the equivalent
governing body, where management of the business falls under the remit of the aforementioned Board of body. Presence of the aforementioned factors was verified for equity investments in SNAM, Italgas and Terna, over which, therefore, de facto control was ascertained .
The presence and the effect of potential voting rights, where substantial, are taken into account when assessing whether the power of governing another entity's financial and operational policies exists.
Subsidiaries may include any “structured entities” in which voting rights are not significant with respect to control assessment, including special purpose vehicles and investment funds.
Structured entities are considered as subsidiaries where:
• the Group has power through contractual rights that enable governance of relevant activities; • the Group is exposed to variable returns resulting from the aforementioned activities.
The book value of equity stakes in entities consolidated on a line-by-line basis held by the parent company or other Group Companies is offset – against the assets and the liabilities of the investees – as a counterparty of the relevant equity share pertaining to the Group.
Assets and liabilities, off-balance-sheet transactions, income and expenses, as well profits and loss between entities included into the scope of consolidation are fully eliminated, in line with the consolidation method adopted.

2016 CONSOLIDATED FINANCIAL STATEMENTS •
67
A subsidiary's revenues and expenses are included into the consolidation starting from the date of control acquisition. Revenues and expenses of a divested subsidiary sold are included into the consolidated income statement up to the divestment date, that is to say until the time when there is no longer control over the investee. The difference between the sale price for the subsidiary and the book value of its net assets at the same date is recorded in the income statement for companies consolidated on a line-by-line basis.
Non-controlling interests are presented in the Balance Sheet under item “Non-controlling interests”, separately from liabilities and equity attributable to the Group. In the Income Statement, too, non-controlling interests are presented separately under item "Net income (loss) for the year pertaining to non-controlling interests".
For companies included into the scope of consolidation for the first time, the fair value of the cost incurred to acquire control over the stake, including auxiliary charges, is measured at the acquisition date.
The difference between the disposal price of an interest held in a subsidiary and the relevant book value of net assets is recognised as a counter-party of Equity, when the disposal does not entail a loss of control.
Joint arrangements
A joint arrangement is a contractual agreement in which one or more counterparties have joint control. Joint control is the contractually agreed sharing of control of an arrangement, which exists only when decisions about the relevant activities require the unanimous consent of the parties sharing control.
According to IFRS 11, joint arrangements must be classed as joint operation or joint venture depending on the Group's contractual rights and obligations.
A joint operation is a joint arrangement in which the parties have rights on the assets and obligations on the liabilities of the arrangement.
A joint venture is a joint arrangement in which the parties have rights on the net assets of the agreement.
Equity investments in jointly controlled companies are valued at equity.
Associate companies
An associate is a company over which the owner exercises a significant influence and which is neither a subsidiary nor a joint venture. Significant influence is presumed when the owner:
• owns, directly or indirectly, at least 20% of another company’s share capital or • can, also through shareholders' agreements, exercise significant influence through: • representation in the company's management body; • participation in the policy-setting process, including in decisions concerning dividends or other payouts; • existence of significant transactions; • exchange of managerial personnel; • provision of key know-how.
Equity investments in associate companies are valued at equity.
I.1.4. EVENTS SUBSEQUENT TO THE REPORTING DATE
During the period between the reporting date for these financial statements and their approval by the Board of Directors, no events occurred that would require an adjustment to the figures approved.
A more detailed analysis of accrued events can be found in “Significant Events after 31 December 2016” of the Report on Operation.
I.1.5. OTHER ISSUES
Use of estimates
The application of international accounting standards in preparing the consolidated financial statements requires the company to formulate estimates for certain balance sheet items that are considered reasonable and realistic on the basis of the information available at the time the estimate is made. Such estimates impact the carrying amount of the assets and liabilities and the disclosures on contingent assets and liabilities as of the reporting date, as well as the amounts reported for revenues and costs for the period under review. Changes in the conditions underlying the judgements, assumptions and estimates used could also have an impact on future results.

• 2016 ANNUAL REPORT
68
The main items estimated at the reporting date of these consolidated financial statements are attributable to the following:
• current and deferred taxes; • recoverable amount of equity investments; • assessment of the fair value of goodwill and other intangible assets; • employee benefits; • provisions; • provision for bad debts.
Accounting of transactions between companies belonging to the group
According to IAS 8, and in the absence of a Standard or an Interpretation that specifically applies to a transaction, other event or condition, management must use its judgement in developing and applying an accounting policy that results in information that is relevant and reliable. Transactions among entities under common control are therefore accounted using values of the acquired entity in the holding company.
For this reason, the conferral of TERNA from CDP to CDP RETI has been accounted keeping in CDP RETI consolidated financial statements the same values booked in CDP, already as from 2014.
The spin-off of ITALGAS from SNAM occurred during the financial year has been also accounted for accordingly for the purpose of determining the equity investments value in the CDP RETI financial statements. The equity investment value of SNAM before the spin-off has been split between equity investment value of SNAM after the spin-off and equity investment value of ITALGAS, by the application of the “relative value”, taking into account the weight the each generating unit had at acquisition date, and in detail by the use of information elaborated for the PPA process.
I.2. SECTION PERTAINING TO THE MAIN ITEMS OF THE CONSOLIDATED FINANCIAL STATEMENT
The following pages provide a description of the accounting policies adopted in preparing the consolidated financial statements.
An asset or liability is classified as "current" when its trading, realization or settlement is expected within twelve months from the reporting date of the consolidated financial statements or within the normal business cycle if after twelve months; all other assets and liabilities are classified as "non-current".
I.2.1. PROPERTY, PLANT AND EQUIPMENT
Property, plant and equipment refers to non-current assets for long-term use in business operations.
Property, plant and equipment and other tangible assets used in operations are governed by IAS 16, while investment property (land and buildings) is governed by IAS 40.
Property, plant and equipment is recognised at purchase cost including incidental expenses directly allocable, needed to make the assets available for use.
The consolidated financial statements show the carrying amount of property, plant and equipment, net of depreciation. The depreciation rates are calculated based on rates considered adequate to reflect the remaining useful life of each asset or value, and any accumulated impairment losses. As well as any costs (discounted) of dismantling and removing the assets which will be incurred as a result of contractual obligations to restore assets to their original condition. Newly purchased assets are depreciated starting from when they are used in the production process.
Land and buildings are treated as separate assets for accounting purposes, even if purchased together. Land is considered to have an indefinite life and, as such, is not depreciated.
Buildings are depreciated over a 40-year period, which is considered to be the useful life of the buildings.
Assets whose use or nature classifies them as capital equipment are depreciated on a straight-line basis over their remaining useful lives.
Maintenance and repair costs that do not increase the utility or useful lives of assets are charged directly to income for the year. Alternately, these costs are posted to assets when it is likely that they will increase the future economic benefits expected.

2016 CONSOLIDATED FINANCIAL STATEMENTS •
69
"Assets under construction and advances" are composed of advances or expenses incurred in respect of assets and materials that have not been completed or are undergoing testing before entering service. Since they have not yet entered the company's production cycle, depreciation is suspended.
I.2.2. ASSET USED IN FINANCE LEASES
Leased assets, if the operation has a financial purpose, are recognised in the consolidated financial statements of the user. A financial purpose is assumed when the lease agreement substantially transfers to the lessee the main part of risks and rewards attached to the leased items. It is also presumed when the agreement, at the time of signature, establishes that the actual value of the asset at the time of exercise of the buyout option is significantly higher than the remaining price.
These include assets under finance leases (for the lessee) and operating leases (for the lessor), as well as leasehold improvement costs. In determining whether a contract contains a lease, the provisions of IFRIC 4 are applied.
I.2.3. INTANGIBLE ASSETS
Intangible assets are those assets without identifiable physical form which are controlled by the company and capable of producing future economic benefits, as well as goodwill, when purchased for consideration, and are governed by IAS 38.
Intangible assets include assets pertaining to service concession agreements for the development, financing, management and maintenance of infrastructure under concession arrangements, as well as rights on infrastructure or assets for the performance of dispatching activity provided under concession agreements.
They also include industrial patent and intellectual property rights, concessions, licences, marks and similar rights, as well as development costs.
Intangible assets include Goodwill, governed by IFRS 3, equal to the difference between the price paid in a business combination and the fair value of the acquired net assets. If the difference is negative (badwill) or if goodwill is not supported by the future economic benefit of the subsidiaries, the difference is taken in the profit and loss.
Intangible assets are recognised at purchase or development cost including incidental expenses and are amortised over their estimated useful life (period of time in which it is expected that the company may use the asset), which, at the end of each year, is subject to impairment testing in order to verify the appropriateness of the estimates.
An intangible asset is only recognised under the following conditions:
1. the company can control the future economic benefits generated by the asset; 2. future economic benefits from the asset are expected to flow to the entity; 3. the cost of the asset can be measured reliably.
Intangible assets are therefore derecognised when sold or when future economic benefits are no longer expected.
Costs incurred for the purchase and development of software by third parties are amortised, usually on a straight-line basis, over the residual useful lives of the assets, which is no greater than 5 years.
Costs incurred for software development before the year in which the project is completed are capitalised when the development/implementation of the project is likely to be successful and the utility of the product extends over more than one year. In this case, the costs are amortised over a period of no more than 5 years. In the year in which the software is completed, the costs incurred and not yet amortised are imputed to the asset and the cost is amortised over 5 years.
"Assets under development and advances" are composed of advances or expenses incurred in respect of intangible assets that have not been completed or are undergoing testing before entering service. Since they have not yet entered the company's production cycle, amortisation is suspended.
Goodwill generated from the acquisition of subsidiaries is allocated to each identified cash generating unit (CGU). Within the CDP Reti Group, cash generating units correspond to the individual legal entities. By virtue of being an intangible asset having an indefinite useful life, goodwill is not amortised but tested only for the adequacy of its carrying value. An impairment test is performed annually on goodwill, or whenever there is evidence of impairment. This involves comparing the carrying value of goodwill and the recovery value of the CGUs to which the goodwill is attributed. If the carrying value of goodwill is higher than the recoverable value of the CGU, the difference is recognised in the income statement at “Net adjustments of intangible assets”. Any reversals of impairment of goodwill may not be recognised.
Goodwill in respect of investments in associated companies and companies subject to joint control is included in the carrying amount of such companies. Negative goodwill is taken to the income statement at the time of the acquisition.
If an impairment loss, independently of amortisation, is identified, the asset is written down, with the original value being restored if the reasons for the writedown no longer apply.

• 2016 ANNUAL REPORT
70
I.2.4. EQUITY INVESTMENTS
“Equity investments” means investments in joint operations (IFRS 11) and associates (IAS 28).
Associates are companies in which CDP RETI holds, either directly or indirectly, at least 20% of the voting rights or, independently of the proportion of voting rights, companies over which CDP RETI has significant influence, which is defined as the power to participate in determining financial and operating policies, but without exercising either control or joint control. Non-controlling interests are recognised in “Available-for-sale financial assets” as described above.
Equity investments are initially recognised at cost and subsequently measured using the equity method. The same provisions governing business combinations apply to acquisitions. Consequently, the difference between the acquisition price and the portion of acquired equity is allocated based on the fair value of the identifiable net assets of the associate. Any unallocated excess amount is considered as goodwill. The higher allocated price is not presented separately, but is included in the carrying amount of the investment (“equity method”).
Any positive difference between the value of the portion of equity of the investee and the cost of the investment is recognised as income. Application of the equity method also considers the treasury shares held by the investee.
The carrying amount of assets is tested for impairment every reporting date.
Evidence of impairment, based on the existence of qualitative and quantitative indicators, as illustrated hereunder, and in accordance with the internal policies, differs where these involve investments in companies whose shares are or are not listed on active markets.
An impairment test is performed when the aforementioned indicators exist, in accordance with the provisions of IAS 36. This test is aimed at estimating the recoverable amount of the equity investment and comparing it with its carrying amount to determine the recognition of any impairment losses.
The following are possible indicators of impairment:
• the recognition of losses or significantly lower results than budgeted or forecast in multi-year plans; • the announcement or commencement of insolvency proceedings or restructuring plans; • the receipt of a dividend that exceeds the total comprehensive income of the investee for the year or its accumulated
income from previous years; • a carrying amount of the equity investment in the separate financial statements that exceeds the amount, in the
consolidated financial statements, of the corresponding portion of equity, including any goodwill. • moreover, the following is considered evidence of impairment for equity investments in listed companies: • equity higher than market capitalisation; • a reduction in the market price exceeding the carrying amount by over 40% or for more than 24 months.
The recoverable amount is the higher of the fair value of the unit, net of any sales costs and value in use, being the present value of the future cash flows that the equity investment may generate, including the final disposal value of the investment. If this value is lower than the carrying amount, the difference is recognised in the income statement as an impairment loss.
The investor's interest in any losses of the investee that exceed the carrying amount of the equity investment is recognised in a specific provision, to the extent that the investor is committed to meeting the legal or implicit obligations of the investee, or otherwise cover its losses.
I.2.5. FINANCIAL ASSETS
Financial assets include:
1. loans; 2. financial assets held for trading; 3. financial assets available for sale; 4. financial assets held to maturity; 5. hedging derivatives.
1. Loans
Financial instruments, including debt securities, which are not listed on active markets which IAS 39 refers to as "loans and receivables", for which the company has a right to receive future cash flows are recognised as "Financial and other receivables".
Loans are recognised when the contract is executed, i.e. upon the unconditional acquisition of a right to payment of the amounts agreed, and are initially measured at fair value, which equals the amount disbursed including directly related transaction costs and commissions. Where the net amount disbursed does not equal the loan's fair value because the

2016 CONSOLIDATED FINANCIAL STATEMENTS •
71
interest rate is lower than the market rate or the rate normally applied for similar loans, initial measurement is effected by discounting the future cash flows using an appropriate rate.
Interest on loans and on arrears is recognised as interest income and similar revenues, on an accruals basis.
The carrying amount of loans in the consolidated financial statements is subject to periodic testing for impairment that could reduce their expected realisable value.
The measurement of writedowns of loans is based on discounting the expected future cash flows of principal and interest net of collection costs, taking account of any guarantees securing the positions and any advances received. The key to determining the value of the future cash flows is in defining the estimated collections, the related timing, and the discount rate to be applied.
The impairment of problem loans is then written back only when the quality of the loan improves to the point that there is a reasonable certainty of a greater recovery of principal and interest and/or greater receipts have been recorded than the carrying amount of the loan recorded in the previous consolidated financial statements. In any event, given the method used to measure impairment losses, as the due dates for credit collection approach with the passing of time, the value of the loan is "written back", given that there is a reduction in the implicit finance costs previously recognised as a reduction in the value of the loans.
The recovery of all or a part of previously written down loans is recognised as a reduction in "Increases in the value of financial instruments".
Loans are derecognised when paid in full, when all of the related risks and rewards have been transferred, or when a loan is deemed to be definitively uncollectible. "Loans to customers" include unlisted financial assets in respect of customers (loans, debt securities, operating receivables, etc.).
2. Financial assets held for trading
"Financial assets held for trading" refer to all financial assets, regardless of type (debt securities, equity, loans, derivatives, etc.), allocated to the trading portfolio and held for the purpose of generating profits over the short term as a result of changes in the price of such instruments, as well as the derivative contracts operationally connected with financial liabilities at fair value (under the fair value option) and derivatives with a positive value, including those resulting from the separation of embedded derivatives, that are not deemed to be effective for hedging purposes.
Financial assets held for trading meet the following prerequisites:
• they are purchased with the intention of being sold in the short term; • they are a part of a portfolio of identified financial instruments that are managed together and for which there is
evidence of a recent actual pattern of short-term profit-taking; • they are derivatives (with the exception of derivatives that are designated and effective hedging instruments).
Such financial assets are initially recognised at fair value, which generally equals the amount paid or received net of transactions costs or income. Where the amount paid is different from the fair value, the financial asset is recognised at fair value, and the difference between the two amounts is recognised through profit or loss. Initial recognition is carried out at the signing date for derivative contracts and at the settlement date for debt and equity securities, with the exception of those for which delivery is governed by conventions on the market concerned, for which initial recognition is at the settlement date.
Financial assets held for trading also include derivative contracts embedded in other financial instruments or contracts and which have financial and risk characteristics that are not correlated with the host instrument or which meet the requirements to be classified themselves as derivative contracts, recognising them separately after separating the embedded derivative from the main contract, which is then treated in accordance with the accounting rules for its own category. This is not done in cases in which the compound instrument containing the derivative is measured at fair value through profit or loss.
The financial instruments are measured subsequently at fair value based on the official prices as of the reporting date of these consolidated financial statements if they are listed on active markets. For financial instruments, including equity, not listed on active markets, fair value is determined by using measurement techniques and information available on the market, such as the price of similar instruments on an active market, discounted cash flows, option pricing models and values registered in recent similar transactions. For equity securities and related derivative instruments, if the fair value obtained using such measurement techniques cannot be reliably determined, the financial instruments are measured at cost and written down in the event of impairment losses.
If the fair value of a financial asset becomes negative, it is recognised as a financial liability held for trading.
Financial assets held for trading are derecognised when payment is received, when the contractual rights to the cash flows expire, or a sale transfers all the risks and rewards connected with ownership to a third party. Conversely, when a prevalent
• 2016 ANNUAL REPORT
72
share of the risks and rewards associated with the financial asset is retained, the asset remains on the balance sheet even if official title has been transferred.
3. Financial assets held for sale
"Financial assets available for sale" are non-derivative financial assets (debt securities, equity, etc.) that are classified as being available for sale and not as (a) loans and receivables, (b) held-to-maturity investments, or (c) financial assets at fair value through profit or loss.
Available-for-sale financial assets are initially recognised on the contract date for all financial assets, with the exception of those for which delivery is governed by conventions on the market concerned, for which initial recognition is carried out at the settlement date and on the disbursement date in the case of loans.
The financial assets are initially recognised at fair value, which generally equals the amount paid or received net of transactions costs or gains. Where the amount paid is different from the fair value, the financial asset is recognised at fair value, and the difference between the two amounts is recognised through profit or loss.
Unrealised gains or losses on available-for-sale securities are recorded in a specific equity reserve, net of tax effects, until the investment is sold or written down.
The financial instruments are measured subsequently at fair value based on the official prices as of the reporting date of these consolidated financial statements if they are listed on active markets. For financial instruments, including equity securities, not listed on active markets, fair value is determined by using measurement techniques and information available on the market, such as the price of similar instruments on an active market, discounted cash flows, option pricing models and values registered in recent comparable transactions. If the fair value of financial instruments not listed on active markets cannot be reliably determined, the financial instruments are measured at cost and written down in the event of impairment losses.
Available-for-sale financial assets undergo impairment testing to determine whether there is objective evidence of impairment. Where the decline in the fair value of an available-for-sale security with respect to its initial cost value is significant or long lasting, an impairment is recognised through profit or loss, regardless of other measurement considerations. To this end, the "significance" and "durability" of the reduction in fair value are measured separately, setting appropriate materiality thresholds.
When an available-for-sale security is impaired, the cumulative, unrealised change in value recorded in the equity reserve is recognised through profit or loss. The impairment is recognised when the purchase cost (net of any amortisation and repayments of principal) of an available-for-sale financial asset exceeds its recoverable amount. The amount of this loss is measured using specific valuation techniques and models for equity securities. Any writebacks of investments in equity instruments are not recognised in the income statement but in an equity reserve, while any writebacks of investments in debt instruments go through the income statement. The value of the instrument after the writeback shall in any event not exceed the amortised cost that the instrument would have had in the absence of the prior adjustments.
Dividends on equity instruments that are available for sale are recognised as income when the right to receive payment is established.
In addition to the recognition of impairment losses, the cumulative gains or losses in the equity reserve are, as mentioned above, recognised through profit and loss at the time of the sale of the asset. Accordingly, in the event of disposal of an investment in available-for-sale securities, the related cumulative, unrealised change in value recorded in equity is recognised through profit and loss.
Available-for-sale financial assets are derecognised when payment is received, when the contractual rights to the cash flows expire, or a sale transfers all the risks and rewards connected with ownership to a third party. Conversely, when a prevalent share of the risks and rewards associated with the financial asset is retained, the asset remains on the balance sheet even if official title has been transferred.
4. Financial assets held to maturity
Financial assets held to maturity include financial assets other than derivatives with fixed or determinable payments and fixed maturity that an entity has the positive intention and ability to hold to maturity.
If, following a change in such intention or ability, it is no longer appropriate to continue to classify an investment as held to maturity, it is reclassified under financial assets available for sale.
Held-to-maturity financial assets are initially recognised at fair value, which is normally equal to the price paid or received. In cases where the price differs from fair value, the asset is recognised at fair value and the difference between the price and the fair value is taken to the income statement.

2016 CONSOLIDATED FINANCIAL STATEMENTS •
73
The value at which such assets are recognised includes incidental costs and revenues attributable to the transaction.
Following initial recognition, financial assets held to maturity are measured at amortised cost and undergo impairment testing. The amortised cost of a financial asset is equal to the amount at which it is measured at initial recognition minus principal repayments, plus or minus the cumulative amortisation using the effective interest rate method of any difference between the initial amount and the maturity amount, and minus any reduction (directly or through the use of an allowance account) for impairment or uncollectibility. If the reasons for a previous impairment loss cease to be valid, the value of the asset is restored up to the value of applying the amortised cost if the write-down had not been made. Such assets are derecognised when the contractual rights to the cash flows from the assets expire or when the assets are divested by transferring substantially all the risks and rewards of ownership of the assets.
5. Hedging derivatives
Financial assets include financial derivatives, which at the reporting date showed a positive fair value.
Refer to the paragraph below on hedging transactions for a description of the accounting standards adopted for the recognition of hedging derivatives.
Hedging transactions
In accordance with the IAS definition, hedging instruments are designated derivatives or (limited to the hedging of foreign currency risk) non-derivative financial assets or liabilities the fair value or cash flows of which are expected to offset the changes in fair value or cash flows of a designated position. A hedged item is an asset, liability, firm commitment, a highly probable forecast transaction, or a net investment in a foreign operation that (a) exposes the organisation to the risk of a change in fair value or future cash flows and (b) is designated as being hedged. The effectiveness of the hedge is the extent to which the change in fair value or cash flows of the hedged position that is attributable to a hedged risk are offset by the change in fair value or cash flows of the hedging instrument.
When a financial instrument is classified as a hedging instrument, the following are to be formally documented:
• the relationship between the hedging instrument and the position hedged, including the risk management objectives; • the hedging strategy, which must be in line with established risk management policies; • the methods to be used in order to verify the effectiveness of the hedge.
Accordingly, both at the inception of the hedge and throughout its life, the change in the fair value of the derivative is analysed in order to determine whether it is highly effective in offsetting the changes in fair value of the hedged position.
A hedge is deemed to be highly effective if, both at inception and throughout its life, the changes in fair value of the hedged position or in the expected cash flows attributable to the risk being hedged are almost entirely offset by the changes in fair value of the hedging derivative, with the relationship of these changes falling within a range of between 80% and 125%.
If the hedge is not effective as described above, the hedging instrument is reclassified under trading instruments, while the hedged item is measured in accordance with the criteria for its category. Hedge accounting also ceases in the event the hedging instrument expires, is sold or exercised or where the hedged item expires, is sold or is repaid.
In the event of hedges designed to neutralise the risk of changes in future cash flows arising from future transactions that are considered as highly probable as at the balance-sheet date (cash flow hedge), the fair value changes of the derivative after initial recognition are recognised, to the extent of the effective portion, under the item “reserves” in shareholders’ equity. When the economic effects of the hedged item materialize, the reserve is transferred to operating profit or loss. If the hedge is not fully effective, the fair value change of the hedging instrument, to the extent of the ineffective portion, is immediately recognised through profit or loss.
If the hedged transaction is no longer considered as probable, the cumulative unrealised gains or losses recognised in equity are immediately recycled through profit or loss. If, during the life of a derivative, the expected hedged cash flows are no longer considered as highly probable, the portion of that instrument recognized as “reserves” is immediately recycled through profit or loss. Conversely, if the derivative is sold or no longer qualifies as an effective hedge, the portion of "reserves" corresponding to the fair value changes of the instrument recognised up to that time, continues to be recognised in equity and shall be recycled through profit or loss, in accordance with the above mentioned classification criteria, as the economic effects of the underlying hedged item materialize.
I.2.6. TRADE RECEIVABLES
Trade receivables are initially recognised at fair value and subsequently measured at amortised cost, using the effective interest method, net of any impairment losses related to amounts deemed unrecoverable and recognised in specific bad debt provisions. Impairment losses are calculated based on the present value of expected future cash flows, discounted

• 2016 ANNUAL REPORT
74
at the original effective interest rate, being the interest rate that aligns the present value of the expected cash flows with the carrying amount at initial recognition.
Receivables due within normal commercial terms are not discounted.
I.2.7. INVENTORIES
Inventories, including compulsory stock, are stated at the lesser of their cost and their net realisable value, represented by the amount that the business expects to obtain from their sale in the normal course of its activities, less selling costs. Cost is measured as the weighted average cost. The net realisable value is the selling price in the ordinary course of business less the estimated completion costs and those necessary to sell the good. Work in progress and semi-finished goods are valued at production cost, excluding financial charges and overheads. Sales and purchases of strategic gas do not generate an actual transfer of the risks and rewards associated with ownership and, therefore, do not result in changes in inventory.
I.2.8. CONSTRUCTION CONTRACTS
The revenues and contract costs associated with construction contracts are separately recorded in the income statement depending on the progress status of the contract activity, when the outcome of a construction contract can be estimated reliably. The state of progress is determined based on the work carried out and measured proportionally to the costs of the contracts incurred up to the reference date and the total estimated contract costs. The positive or negative difference between the value of the contracts performed and that of the advances received is recorded in the balance sheet assets or liabilities, depending on the case, considering any impairment losses on the work carried out so as to take into account the risks of customers' refusal to recognise the work performed. Expected contract losses are immediately taken to profit or loss under contract costs.
Contract costs include all those costs that relate directly to the specific contract, as well as fixed and variable costs incurred by Group companies as part of normal operations.
I.2.9. CASH AND CASH EQUIVALENT
Cash and cash equivalents are measured at their nominal amount, which corresponds to fair value.
This item includes cash in hand, cash at banks and other current financial assets due within three months from purchase, readily convertible into cash with no cashing expenses and subject to an insignificant risk of changes in value.
Cash and cash equivalents take account of the interest accrued on the amounts, albeit not yet paid.
I.2.10. CURRENT AND DEFERRED TAXATION
Corporate income tax (IRES) and regional tax on business activities (IRAP) are recognised on an accruals basis using a realistic estimate of the negative and positive tax components for the year and were calculated on the basis of the tax rates currently in force.
Deferred tax items regard the recognition of the effects of temporary differences between the valuation of accounting items under tax regulations, which are used to determine taxable income, and that under statutory reporting regulations (which seek to quantify the result for the year).
More specifically, "taxable temporary differences" between statutory and tax values are those that will give rise to taxable amounts in future tax periods, while "deductible temporary differences" are those that will give rise to deductible amounts in the future.
Deferred tax assets/liabilities are classified as non-current assets/liabilities pursuant to IAS 1.56. Deferred tax items are therefore recognised as non-current liabilities under "Deferred tax liabilities”, where they are related to items that will become taxable in future tax periods. Where they represent assets, i.e. they are related to items that will be deductible in future tax periods, they are recognised as "Deferred tax assets", under non-current assets in the balance sheet.
If the deferred tax items regard operations that directly affected equity, they are recognised in equity.
Deferred income taxes are determined using tax rates that are expected to apply to the period when the related differences are realized or settled.

2016 CONSOLIDATED FINANCIAL STATEMENTS •
75
I.2.11 PROVISIONS
Provisions are allocated only to cover liabilities that are specific, certain or probable, but whose value or date of occurrence cannot be determined at the end of the reporting period.
"Provisions" are therefore recognised solely under the following conditions:
• there is a present (legal or constructive) obligation resulting from a past event; • it is probable/expected that a charge, i.e., an outflow of resources embodying economic benefits, will be required to
settle the obligation; • a reliable estimate can be made of the amount of the obligation.
When the financial impact of the time factor is significant and the payment dates of the obligations can be estimated reliably, the allowance reflects the present value (at the market rates ruling at the time of preparation of the consolidated financial statements) of the future charges, estimated based on the risks associated with the obligation, that are expected to be incurred in order to settle the obligation.
Contingent - not probable - liabilities are not provided for. However, they are disclosed in the notes, unless the probability of an outflow of resources is remote or the event is deemed insignificant.
Accruals to the provision for risks and charges are reversed when the obligation is settled or when it is no longer probable that an outflow of resources will be required to settle the present obligation.
I.2.12. PROVISION FOR EMPLOYEE BENEFIT
The liabilities pertaining to the benefits recognised to employees and paid upon or after termination of the employment relationship and pertaining to defined benefit plans and other long-term benefits are recorded net of any assets in favour of the plan, separately for each plan, on the basis of actuarial assumptions and reported by accrual consistent with the work service required to obtain the benefits on the reference date. Liabilities are valued by independent actuaries.
Actuarial profits and losses, resulting from the re-measurement of the liability recorded for commitments towards employees for each financial year, are entered into Valuation reserves included in the equity.
I.2.13. FINANCIAL LIABILITIES
Financial liabilities, including payables for loans but other than derivatives, are recognised at the cost on the settlement date, represented by the fair value of the liabilities reduced by any directly attributable transaction costs. Subsequently, the financial liabilities are measured with the amortised cost criteria, using the effective interest rate method.
Financial liabilities are derecognised when they are overdue or when they are rembursed.
I.2.14. REVENUES
Depending on the type of transaction, revenues are recognised on the basis of the following specific criteria:
• revenues from the sale of goods are recognised when the material risks and rewards of ownership of the goods have been transferred to the buyer;
• revenues from services are recognised with reference to the stage of completion of the service. If revenues cannot be reliably measured, they are recognised to the extent of recoverable costs;
• revenues from charges collected for compensation of the National Transmission Grid (NTG) are valued on the basis of the tariffs established by the Authority for Electricity and Gas.
Amounts collected on behalf of third parties, such as the fees paid to non-Group grid owners, as well as revenues recognised for managing activities related to the balancing of the national electrical system, which do not increase equity, are reported net of the related costs.
I.2.15. GRANTS
Grants related to assets whose carrying amount is recognised under non-current assets are recognised as a deduction in arriving at the carrying amount of the asset.
Grants related to income are recognised in the income statement on an accruals basis when the related costs are incurred.

• 2016 ANNUAL REPORT
76
I.2.16. INTEREST INCOME AND EXPENSE
Interest income and expense is recognised in the income statement for all instruments based on amortised cost using the effective interest method.
Interest also includes the net balance, positive or negative, of differentials and margins pertaining to financial derivatives contracts.
I.2.17. DIVIDENDS
Dividends received from investee companies not consolidated on a line-by-line basis are recognised as income in the period in which they are approved for distribution.
Dividends pertaining to companies valued with the equity method are deducted from the book value of equity investments.
I.2.18. SHARE-BASED PAYMENTS
The cost of employee service remunerated through stock option plans is measured at the fair value of the options granted to employees at the grant date. The fair value of options granted is recognised under personnel expenses over the vesting period, with a corresponding increase in equity, considering the best possible estimate of the number of options that employees will be able to exercise. Such estimate is reviewed where subsequent information indicates that the expected number of instruments representative of capital that will mature differs from the estimate previously carried out, regardless of achievement of the market conditions.
The measurement method used to calculate fair value considers all the characteristics of the options (term, price and conditions, etc.), as well as the price of the underlying stock at the grant date, its volatility and the yield curve at the grant date, in line with the term of the plan.
At maturity, the estimate is revised through the income statement to recognise the actual amount corresponding to the number of equity instruments that have actually matured, regardless of achievement of the market conditions.
I.2.19. CAPITALISED BORROWING COST
Borrowing costs directly attributable to the acquisition, construction or production of an asset that qualify for capitalisation are capitalised as part of the cost of the asset. The qualifying assets (property, plant and equipment and intangible assets) involved are those that require at least one year before being ready for use. The directly attributable borrowing cost is that which would not have been incurred if the expenditure for the asset had not been incurred.
Where funds are borrowed specifically, costs eligible for capitalisation are the actual costs incurred, less any income earned on the temporary investment of such borrowings. Where funds are part of a general pool, the eligible amount is determined by applying a capitalisation rate to the expenditure on that asset. The capitalisation rate will be the weighted average of the borrowing costs applicable to the general pool, excluding any specifically borrowed funds. The amount of borrowing costs capitalised during a year shall in any case not exceed the amount of borrowing costs incurred during that year.
Capitalisation commences as from the date all the following conditions have been met: (a) expenditures have been incurred for the asset; (b) borrowing costs are being incurred; and (c) activities to prepare the asset for its intended use or sale are in progress.
Capitalisation ceases when the activities necessary to prepare the asset for its intended use or sale are substantially complete.
I.2.20. FAIR VALUE MEASUREMENT
Fair value is the price that would be received to sell an asset or paid to transfer a liability in an orderly transaction between market participants (i.e. not in compulsory winding-up or sale below cost) at the measurement date. Fair value is a market measurement criterion that does not refer specifically to the individual business. Underlying the definition of fair value is the assumption that the company is operating its business normally without any intention to liquidate its own assets, significantly reduce the level of its own assets, or settle transactions at unfavourable conditions. An entity shall measure the fair value of an asset or a liability using the assumptions that market participants would use when pricing the asset or liability, assuming that market participants act in their economic best interest.
In accordance with IFRS 13, the CDP RETI Group measures fair value also considering the effect of non-performance risk, including the changes in the counterparty's credit risk and those in its own credit risk.

2016 CONSOLIDATED FINANCIAL STATEMENTS •
77
The fair value of financial instruments is calculated according to a hierarchy of criteria based on the origin, type, and quality of information used. In detail, this hierarchy assigns the highest priority to the prices quoted (and not changed) on active markets and lower importance to unobservable inputs. Three different input levels are identified:
• in the case of instruments quoted on active markets, prices on financial markets are used (Level 1); • in the case of financial instruments not quoted on active markets, valuation techniques which use observable market
parameters other than quoted prices for the instrument but connected with its fair value by non-arbitrage relationships shall be used, where possible (Level 2);
• in other cases, internal valuation techniques that also use as input parameters that are not observable on the market, and thus are inevitably subjective to some degree, shall be used (Level 3).
Since Level 1 inputs are available for numerous financial assets and liabilities, some of which are traded on more than one active market, the Company has to take special care when defining both of the following aspects:
• the principal market for assets or liabilities or, in the absence of a principal market, that is the most advantageous market for the asset or liability;
• if the company can conclude a transaction involving the asset or liability at that price and on that market at the measurement date.
The CDP RETI Group believes that the principal market of a financial asset or liability can be identified as the market on which the Group normally operates.
A market is considered active if the quoted prices, representing effective and regular market transactions executed during an appropriate reference period, are readily and regularly available through stock exchanges, brokers, intermediaries, specialised firms, quotation services or authorised entities.
In the event of a significant reduction in the volume or level of ordinary activity for the asset or liability (or for similar assets or liabilities) flagged by certain indicators (number of transactions, insignificance of the prices given by the market, significant increase in the implicit premiums for liquidity risk, widening or increase in the bid-ask spread, reduction or total absence of a market for new issues, scanty information in the public domain), the transactions or quoted prices are analysed.
In the case of financial instruments that are not quoted on active markets, valuation using Level 2 inputs requires the use of valuation techniques that process market parameters at different levels of complexity. For example, valuation techniques may, in addition to interpolations and extrapolations, involve the specification of stochastic processes that represent market dynamics and the use of simulations or other numerical techniques to determine the fair value of the instruments being measured.
In selecting the valuation techniques to be used in Level 2 measurements, the Group takes account of the following criteria:
• simpler valuation techniques are preferred to more complex techniques, all other conditions being equal and as long as they represent all of the relevant characteristics of the product, ensuring that they are reasonably in line with the practices and results of other sector operators;
• valuation techniques are applied consistently over time to consistent categories of instruments, unless objective grounds for replacement emerge;
• all other conditions being equal, preference is given to standard models whose mathematical structure and implementing procedures are familiar to practitioners and implemented in the Group's systems.
The market parameters used as inputs for Level 2 valuations are selected on the basis of non-arbitrage relationships or comparative relationships that define the fair value of the financial instrument being measured as the relative fair value compared with that of financial instruments quoted on active markets.
The Group has established a reference framework for derivative contracts and bonds. This framework is composed of the valuation criteria and models on which the valuation of each category of instruments is based.
In some cases, in determining fair value it is necessary to use valuation techniques that call for inputs that cannot be drawn directly from observable market variables, such as statistical or “expert-based” estimates by the party performing the valuation (Level 3).
Level 3 valuation techniques are also applied consistently over time to consistent categories of instruments, unless objective grounds for replacement emerge. Similarly, parameters that cannot be drawn directly from observable market variables are applied consistently over time.
I.2.21. BUSINESS COMBINATIONS
Business combinations are recognised in accordance with the acquisition method. Under this method, the consideration transferred in a business combination is measured at fair value, calculated as the sum of the acquisition-date fair values

• 2016 ANNUAL REPORT
78
of the assets transferred and the liabilities assumed by the Group and the equity instruments issued in exchange for control of the acquiree. Transaction costs are generally recognised in profit or loss when incurred.
For newly acquired companies, the difference between the acquisition price and equity is provisionally recognised as goodwill, if positive, or under liabilities if negative, net of goodwill, if any, recognised in the financial statements of the acquirees. In accordance with IFRS 3.45 and following, within twelve months of the acquisition date, the differences resulting from the transaction are allocated recognising the acquisition-date fair value of the identifiable assets acquired and liabilities assumed. The following items are an exception and are measured in accordance with their applicable standard:
• deferred tax assets and liabilities; • assets and liabilities for employee benefits; • liabilities or equity instruments related to share-based payment transactions involving shares of the Group issued in
replacement of contracts of the acquiree; • assets held for sale and discontinued operations.
Goodwill is determined as the excess of the aggregate of the consideration transferred in the business combination, the amount of any non-controlling interest in the acquiree and the fair value of any equity interest previously held by the acquirer in the acquiree over the acquisition-date fair value of the net assets acquired and the liabilities assumed. If the acquisition-date fair value of the net assets acquired and the liabilities assumed exceeds the aggregate of the consideration transferred, the amount of any non-controlling interest in the acquiree and the fair value of any equity interest previously held by the acquirer in the acquiree, the excess is recognised in profit or loss as a gain from the transaction.
At the acquisition date, non-controlling interests are measured at fair value or as a proportionate share of the recognised amounts of the acquiree's identifiable net assets. The measurement method is selected on a transaction basis.
Any contingent consideration provided in the business combination is measured at the acquisition-date fair value and included in the amount of the consideration transferred in the business combination for the purposes of calculating goodwill. Any subsequent changes in that fair value, that qualify as adjustments occurring during the measurement period, are included in goodwill retrospectively. Changes in fair value that can be considered as measurement-period adjustments are those prompted by new information about facts and circumstances that existed at the acquisition date that has been obtained during the measurement period (which shall not exceed one year from the business combination).
In the case of business combinations achieved in stages, the equity interest previously held by the Group in the acquiree is revalued at the fair value at the date control was acquired and any resulting gain or loss is recognised through profit or loss. Any changes in the value of the previously held equity investment that had been recognised in other comprehensive income/(expense) are reclassified to profit or loss as if the equity investment had been sold. If the initial accounting for a business combination is incomplete by the end of the reporting period in which the combination occurs, the Group shall report in its financial statements provisional amounts for the items for which the accounting is incomplete. During the measurement period, the Group shall adjust the provisional amounts to reflect new information obtained about facts and circumstances that existed at the acquisition date and, if known, would have affected the measurement of the amounts recognised at that date.
Disposals of non-controlling interests in a subsidiary by way of sale or dilution that do not result in the loss of control are accounted for as equity transactions (i.e., transactions with owners in their capacity as owners). In these circumstances, the carrying amounts of controlling and non-controlling interests must be adjusted to reflect the changes in their interests in the subsidiary. Any difference between the amount of the adjustment of non-controlling interests and the fair value of the consideration received must be recognised directly in equity.
I.2.22. TRANSACTIONS WITH RELATED PARTIES
Reporting is provided on transactions with related parties identified according to the criteria established by IAS 24.

2016 CONSOLIDATED FINANCIAL STATEMENTS •
79
II - INFORMATION ON THE CONSOLIDATED BALANCE SHEET
I. ASSETS
NON-CURRENT ASSETS
A1. Property, plant and equipment
Below is a breakdown of the CDP Reti Group’s property, plant and equipment, which shows a net book value of €33,671 million at 31 December 2016 (€33,235 million at 31 December 2015).
Property, plant and equipment: breakdown
The item mainly includes investments made by the TERNA Group in energy transport lines and transformation stations, investments made by the SNAM Group in transport infrastructure, gas storage and regasification, and the investments made by the ITALGAS Group in the gas distribution segment, limited to land and buildings that are not subject to IFRIC12.
Moreover, the added value resulting from the Purchase Price Allocation of the investee companies compared to the value of their equity at the purchase date is recorded as an increase of €5.5 billion under the item Plant and Equipment.
During the year the SNAM Group made investments of €863 million that were mainly in the transport (€734 million) and storage (€113 million) sectors, and for a lesser amount in the distribution sector (€9 million), before its spin-off benefiting the ITALGAS Group for which investments for the period were €4 million.
With regard to the TERNA Group, the increases for the year mainly refer to investments in the Group's regulated activities for €774 million, and non-regulated activities for €38.8 million.
The changes to property, plant and equipment that took place during 2016 are detailed below:
(thousands of euros)Items/Figures Gross amount
Provision for amortisation,
depreciation and impairment Net value Gross amount
Provision for amortisation,
depreciation and impairment Net value
Land 369,150 (1,083) 368,067 357,098 - 357,098
Buildings 2,719,964 (868,750) 1,851,214 2,313,461 (700,839) 1,612,622
Plant and equipment 42,525,376 (14,708,247) 27,817,129 40,592,508 (13,656,221) 26,936,287
Other plant and equipments 1,581,968 (613,027) 968,941 1,541,220 (639,797) 901,423
Industrial and commercial equipment 371,773 (276,529) 95,244 354,215 (260,254) 93,961
Other assets 277,917 (190,755) 87,162 319,452 (233,869) 85,583
Assets under development and advances 2,514,046 (30,507) 2,483,539 3,248,261 - 3,248,261
Total 50,360,194 (16,688,898) 33,671,296 48,726,215 (15,490,980) 33,235,235
31/12/2016 31/12/2015

• 2016 ANNUAL REPORT
80
Property, plant and equipment: changes for the year
A2. Inventories - compulsory stock
Compulsory stock: breakdown
Inventories - compulsory stock, equal to €363 million, includes the minimum natural gas quantities that the storage companies are required to hold under Presidential Decree no. 22 of 31 January 2001. The stock of gas, equivalent to approximately 4.5 billion standard cubic metres of natural gas, is determined by the Ministry for Economic Development on an annual basis.
A3. Intangible assets
The following table shows the breakdown of "Intangible assets", which at 31 December 2016 amounted to €7,753 million (€7,824 thousand at 31 December 2015):
Intangible assets: breakdown
The main component of intangible assets consists of ITALGAS’s service concession agreements, which concern public-private agreements relating to the development, financing, maintenance and operation of infrastructures under concession arrangements from the granting entity. The rules on service concession agreements are applicable to ITALGAS in relation to the public service of natural gas distribution, i.e. agreements whereby the operator undertakes to provide the public
(tho usands of euros)Items/Figures Land Buildings Plant and equipment
Other plant and equipments
Industrial and commercial equipment Other assets
Assets under development and
advances Total
Gross opening balance 357,098 2,313,461 40,592,508 1,541,220 354,215 319,452 3,248,261 48,726,215
Provision for amortisation, depreciation and impairment - opening balance - (700,839) (13,656,221) (639,797) (260,254) (233,869) - (15,490,980)
Net opening balance 357,098 1,612,622 26,936,287 901,423 93,961 85,583 3,248,261 33,235,235
Gross amount: change for the period - - - - - - - -
Investments 1,073 300 3,625 90,682 15,800 2,225 1,567,047 1,680,752
Contributions from business combinations - - - - - - - -
Transfers 5,100 229,300 1,049,900 - 142 - (1,284,442) -
Disposals (947) (2,540) (19,289) - (12,069) (5,751) (9,494) (50,090)
(Writedow ns)/Writebacks - (2,863) - - - - - (2,863)
Other changes 1,121 112,494 11,610 (131,860) (9,473) (39,538) 63,070 7,424
Reclassifications 5,705 69,812 887,022 81,926 23,158 1,529 (1,070,396) (1,244)
Provision for amortisation, depreciation and impair ment - change for the period
- - - - - - - -
Depreciation for the period - (58,433) (1,032,213) (73,843) (22,611) (28,205) - (1,215,305)
Contributions from business combinations - - - - - - - -
Disposals - 1,401 - 9,841 10,871 5,544 - 27,657
(Writedow ns)/Writebacks (1,083) (1,336) (2,000) (2,638) - (554) (30,507) (38,118)
Other changes - (109,471) (56,319) 151,993 8,927 (420) - (5,290)
Reclassifications - (72) 38,506 (58,583) (13,462) 66,749 - 33,138
Gross closing balance 369,150 2,719,964 42,525,376 1,581,968 371,773 277,917 2,514,046 50,360,194
Provision for amortisation, depreciation and impair ment - closing balance
(1,083) (868,750) (14,708,247) (613,027) (276,529) (190,755) (30,507) (16,688,898)
Net closing balance 368,067 1,851,214 27,817,129 968,941 95,244 87,162 2,483,539 33,671,296
(thousands o f euros)Items/Figures Carrying amount
Vo lumes(billions of cu.m.) Carrying amount
Vo lumes(billions o f cu.m.)
Compulsory stock 362,713 4.5 362,713 4.5
Total 362,713 4.5 362,713 4.5
31/12/201531/12/2016
(thousands of euros)Items/Figures Gross amount
Provision for amortisation,
depreciation and impairment Net value Gross amount
Provision for amortisation,
depreciation and impairment Net value
Goodw ill 852,510 - 852,510 850,775 - 850,775
Service concession agreements 9,383,653 (3,837,448) 5,546,205 9,122,712 (3,483,542) 5,639,170
Industrial patent and intellectual property rights 1,000,922 (792,732) 208,190 890,937 (709,592) 181,345
Concessions, licenses, trademarks and similar rights 1,138,775 (155,471) 983,304 1,127,829 (140,423) 987,406
Other intangible assets 368,929 (246,917) 122,012 300,840 (217,700) 83,140
Assets under development and advances 41,244 - 41,244 82,563 - 82,563
Total 12,786,033 (5,032,568) 7,753,465 12,375,656 (4,551,257) 7,824,399
31/12/2016 31/12/2015

2016 CONSOLIDATED FINANCIAL STATEMENTS •
81
service of natural gas distribution at the tariff set by the Authority for Electricity, Gas and the Water System (AEEGSI), with the right to use the infrastructure controlled by the granting authority in order to provide the public service.
In implementation of the “partial goodwill method” for the recognition of goodwill envisaged by IFRS 3, the item “Goodwill” represents the only share belonging to CDP Reti Group for the goodwill recorded in the consolidated financial statements of TERNA, SNAM, and ITALGAS, as well as the share recorded as a result of allocating the differences between the prices paid for the purchase of equity investments and the relevant equity.
Goodwill recognised in the financial statements as at 31 December 2016 in the amount of €853 million, consists of:
• €364,4 million for the TERNA Group • €384,1 million for the SNAM Group • €104 million for the ITALGAS Group
In relation to TERNA, SNAM and ITALGAS, the CGUs to which goodwill was allocated coincide with the individual legal entities and the recoverable value is equivalent to the market value of the companies, determined on the basis of the average of the stock market prices of december. The companies’ fair values were higher than the value of their respective net assets, inclusive of the results of the purchase price allocation and goodwill.
The following table shows the changes in Intangible assets, which decreased during the financial year by approx. €71 million:
Intangible assets: changes for the year
A4. Equity investments
SNAM, TERNA, and ITALGAS’s equity investments are listed below, together with information on the investment relationships.
(thousands of euros)Items/Figures Goodwill
Service concession agreements
Industrial patent and intellectual property rights
Concessions, licenses,
trademarks and similar rights
Other intangible assets
Assets under development and
advances Total
Gross opening balance 850,775 9,122,712 890,937 1,127,829 300,840 82,563 12,375,656
Provision for amortisation, depreciation and impairment - opening balance - (3,483,542) (709,592) (140,423) (217,700) - (4,551,257)
Net opening balance 850,775 5,639,170 181,345 987,406 83,140 82,563 7,824,399
Gross amount: change for the period
Investments - 275,007 709 201 23,727 157,520 457,164
Contributions from business combinations - - - - - - -
Transfers - 16,012 - - 18,997 (35,009) -
Disposals - (49,258) (63) - - (598) (49,919)
(Writedow ns)/Writebacks (1,074) (6,794) - - - - (7,868)
Other changes 2,810 (29,986) 36,864 6,687 6,617 (10,925) 12,067
Reclassif ications - 55,960 72,475 4,058 18,748 (152,307) (1,066)
Provision for amortisation, depreciation and impair ment - change for the period Depreciation for the period - (361,701) (72,165) (8,418) (34,751) - (477,035)
Contributions from business combinations - - - - - - -
Disposals - 32,011 37 - - - 32,048
(Writedow ns)/Writebacks - - - - - - -
Other changes - (24,217) (11,009) (6,630) 3,901 - (37,955)
Reclassif ications - 1 (3) - 1,633 - 1,631
Gross closing balance 852,510 9,383,653 1,000,922 1,138,775 368,929 41,244 12,786,033
Provision for amortisation, depreciation and impair ment - closing balance
- (3,837,448) (792,732) (155,471) (246,917) - (5,032,568)
Net closing balance 852,510 5,546,205 208,190 983,304 122,012 41,244 7,753,465

• 2016 ANNUAL REPORT
82
Equity investments in joint operations, associates a nd other companies: information on equity relations hips
During the year, the value of equity investments recorded in the consolidated financial statements changed as follows:
Equity investments: changes for the year
The increases over the year refer to the SNAM Group, and more specifically to the capital contribution made to the AS Gasinfrastruktur Beteiligung GmbH (ASG HoldCo) consortium, a joint venture that is owned 60% by Allianz and 40% by Snam. The capital contribution follows the agreements entered into on 22 September 2016 between the AS Gasinfrastruktur Beteiligung GmbH (ASG HoldCo) consortium and OMV Gas & Power GmbH (OGP) for the sale and purchase of 49% of Gas Connect Austria GmbH (GCA), a natural gas transport company based in Austria. The transaction was finalised on 15 December 2016 following the payment of €135 million.
The revaluations made during the year mainly concern the investments in Trans Austria Gasleitung GmbH (€90 million), TIGF Holding S.A.S. (€50 million), Toscana Energia S.p.A. (€20 million), while the value adjustments mainly concern the investment in GasBridge 1 B.V. (€5 million), GasBridge 2 B.V. (€5 million) Trans Adriatic Pipeline AG (€3 million) and CGES A.D. (€5 million).
Other information on equity investments
Consistent with the provisions set out in IFRS 12 “Disclosure of interests in other entities”, the financial performance of joint operations and associates are summarised below.
(thousands of euros)
Items/Figures
Name Registered o ffice Investor % holding Voting rights % Carrying amount Valuation method
A.1 Joint ventures
Trans Austria Gasleitung GmbH (1) Vienna SNAM S.p.A. 84.47% 89.22% 512,627 Equity method
ELMED Etudes S.a.r.l. Tunisi Terna S.p.A. 50.00% 50.00% - Equity method
TIGF Holding S.A.S. Pau SNAM S.p.A. 40.50% 40.50% 460,524 Equity method
Toscana Energia S.p.A. Firenze Italgas Reti SpA 48.08% 48.08% 256,229 Equity method
GasBridge 1 B.V. Rotterdam SNAM S.p.A. 50.00% 50.00% 43,588 Equity method
Metano S.Angelo Lodigiano S.p.A. Sant'Angelo Lodigiano Italgas Reti SpA 50.00% 50.00% 2,125 Equity method
Umbria Distribuzione GAS S.p.A. Terni Italgas Reti SpA 45.00% 45.00% 13,321 Equity method
GasBridge 2 B.V. Rotterdam SNAM S.p.A. 50.00% 50.00% 43,656 Equity method
AS Gasinfrastruktur Beteiligung GmbH Vienna SNAM S.p.A. 40.00% 40.00% 135,284 Equity method
A.2 Associates
CGES A.D. Podgorica Terna S.p.A. 22.09% 22.09% 29,961 Equity method
CESI S.p.A. Milano Terna S.p.A. 42.70% 42.70% 44,917 Equity method
CORESO S.A. Bruxelles Terna S.p.A. 16.67% 16.67% 363 Equity method
Trans Adriatic Pipeline AG Baar SNAM S.p.A. 20.00% 20.00% 161,496 Equity method
A.3 Other companies
ASSET COMPANY 1 S.r.L. San Donato Milanese (MI) SNAM S.p.A. 100.00% 100.00% 10 Cost
ASSET COMPANY 2 S.r.L. San Donato Milanese (MI) SNAM S.p.A. 100.00% 100.00% 10 Cost
(1) At 31 december 2016 Snam S.p.A. howned 84,47% of shares but economic rights are l’89,22%.
Equity investment
(thousands of euros)
Items/Figures 31/12/2016 31/12/2015
A. Opening balance 1,546,517 1,575,744
B. Increases 342,655 376,575
B.1 Purchases 135,284 190,209
of which business combinations - -
B.2 Writebacks - -
B.3 Revaluations 162,979 137,837
B.4 Other increases 44,392 48,529
C. Decreases (185,061) (405,802)
C.1 Sales - -
of which business combinations - -
C.2 Writedow ns (18,519) (3,331)
C.3 Other decreases (166,542) (402,471)
D. Closing balance 1,704,111 1,546,517
- of w hich total revaluations 279,359 195,532
- of w hich total adjustments (18,519) (3,331)

2016 CONSOLIDATED FINANCIAL STATEMENTS •
83
Economic and financial data of significant equity in vestments
Economic and financial data of not significant equit y investments
Obligations relating to equity investments
The main obligations relating to equity investments are set out below:
Trans Adriatic Pipeline AG
Snam S.p.A. has made commitments to TAP in its capacity as owner responsible for financing the project and for the investment share it possesses. As at 31 December 2016, Snam S.p.A.’s total commitment with regard to the estimated cost of the entire project approved by TAP in 2016 amounts to approximately €0.8 billion. As at 31 December 2016, Snam has paid a total of €0.3 billion, including the amounts recognised upon closing the acquisition of the company, €0.1 billion of which relate to the aforementioned commitment. However, it should be noted that for any financing agreements with the market for the cost of the project, any guarantees, with a resulting reduction in the amount of the overall obligation, as well as the way the loan will be repaid to the shareholders, will be defined.
Restrictions relating to equity investments
With regard to restrictions relating to equity investments, the following should be noted:
TIGF Investissement S.A.S.
The payment of interest calculated on the nominal residual balance of the convertible bond issue of €670 million (of which €272 million underwritten by Snam), may be postponed at the discretion of the issuer, TIGF Investissement. The bond is subordinated to the existing bank loans.
(thousands o f euro)
Names Cas
h an
d ca
sh
equi
vale
nt
Cur
rent
ass
ets
Non
cur
rent
ass
tes
Cur
rent
fina
ncia
l lia
bilit
ies
Non
cur
rent
fina
ncia
l lia
bilit
ies
Cur
rent
liab
ilitie
s
Non
cur
rent
liab
ilitie
s
Rev
enue
s
Inte
rest
inco
me
Inte
resn
t exp
ense
s
Dep
reci
atio
n
Inco
me
(loss
) be
fore
ta
xes
on c
ontin
uing
op
erat
ions
Inco
me
(loss
) af
ter
taxe
s on
con
tinui
ng
oper
atio
ns
Tax
es
Net
inco
me
(loss
) fo
r th
e pe
riod
(1)
Oth
er c
ompr
ehen
sive
in
com
e ne
t of t
axes
(2
)
Com
preh
ensi
ve
inco
me
(3)=
(1)
+(2)
A.1 Joint ventures
Trans Austria Gasleitung GmbH 23,805 47,666 1,019,873 - (301,410) (55,585) (160,992) 344,874 1,172 (3,189) (76,175) 103,872 (34,540) 103,872 1,298 105,170
TIGF Holding S.A.S. 67,900 74,820 2,807,240 (17,152) (1,391,383) (378,651) (25,677) 464,886 - (37,175) (132,727) 123,264 (9,937) 123,264 (229) 123,035
Toscana Energia S.p.A. - 74,000 811,000 - - (113,000) (377,000) 135,000 (4,000) (32,000) 61,000 - (20,000) 41,000 - 41,000
AS Gasinfrastruktur Beteiligung GmbH 17,722 - 601,000 - (280,000) - - - - - - - - - - - -
A.2 Associates
Trans Adriatic Pipeline AG - 82,566 1,643,004 - - (281,109) (1,084,481) - (18,191) (18,191) 1,361 (16,830)
(thousands o f euro)
Type o f investments Car
ryng
am
ount
of
the
inve
stm
ents
Tot
al a
sset
s
Tot
al li
abilit
ies
Tot
al r
even
ues
Inco
me
(loss
) be
fore
taxe
s on
co
ntin
uing
op
erat
ions
Inco
me
(loss
) af
ter
taxe
s on
con
tinui
ng
oper
atio
ns
Net
inco
me
(loss
) fo
r th
e pe
riod
(1)
Oth
er
com
preh
ensi
ve
inco
me
net o
f tax
es
(2)
Com
preh
ensi
ve
inco
me
(3)=
(1)
+(2)
Joint ventures 102,690 186,985 (9,196) 6,000 (19,875) - (19,875) (30,196) (50,071)
Associates 75,241 420,271 (137,350) 157,245 11,476 - 11,476 - 11,476
Other not consolidated 20 - - - - - - - -

• 2016 ANNUAL REPORT
84
A5. Non-current financial assets
Non-current financial assets: breakdown and fair va lue levels
The main components of non-current financial assets (€576 million at 31 December 2016, €775 million at 31 December 2015) are as follows:
• the value of the derivatives recorded in the non-current financial assets of TERNA is €326 million, for which the mark-to-market adjustment is considerably lower than that of the previous year following the simplification of the derivatives portfolio conducted during the second quarter of 2016, which was partially offset by the change in fair value of those instruments in effect at 31 December 2016;
• financial receivables from operations (€213 million at 31 December 2016; €78 million at 31 December 2015) recorded in the financial statements of SNAM and related to the Shareholders’ Loan to the associated company Trans Adriatic Pipeline AG (TAP), which was taken over by SNAM following the contractual agreements related to the acquisition of the equity investment. The receivable was classified as “non-current” based on the contractual agreements in effect between the shareholders. With respect to 31 December 2015, the receivables increased by €135 million, including accrued interest, following the cash call requested by the SNAM investee during 2016 based on the previously mentioned agreements;
• the deposit made to the Interconnector guarantee fund (€17.4 million) established for the realisation of interconnections under Article 32 of Law 99/09 and recorded in the consolidated financial statements of the TERNA Group.
A6. Deferred tax assets
Deferred tax assets recorded in the financial statements at 31 December 2016 amount to €704 million (€624 million at 31 December 2015), of which €694 million were recorded in the income statement.
Deferred tax assets: breakdown
The following table shows the breakdown of the deferred tax assets:
(thousands o f euros)
Items/Figures Carrying amount L1 L2 L3 Carrying amount L1 L2 L3
Available for sale
Debt securities - - - - 65 - - 65
Equity securities 175 90 - 85 - - - -
Units in collective investment undertakings
- - - - - - - -
Loans - - - - 3,610 - - 3,610
Total 175 90 - 85 3,675 - - 3,675 Held to maturity - - - - - - Debt securities 156 156 - - - - - -
Loans - - - - - - - -
Total 156 156 - - - - - - Hedging derivatives - - - - - - - - Hedging derivatives 344,910 - 344,910 - 692,885 - 692,885 -
Total 344,910 - 344,910 - 692,885 - 692,885 - Loans and receivablesDebt securities 213,386 - - 213,386 78,149 - - 78,149
Loans 17,679 - - 17,679 - - - -
Total 231,065 - - 231,065 78,149 - - 78,149 Total 576,306 246 344,910 231,150 774,709 - 692,885 81,824
31/12/2016 31/12/2015
(thousands of euros)
Items/Figures 31/12/2016 31/12/2015
Deferred tax assets
- recognised in income statement 693,900 612,125
- recognised in equity 10,073 11,789
Total 703,973 623,914

2016 CONSOLIDATED FINANCIAL STATEMENTS •
85
Deferred tax assets: breakdown
The changes in deferred tax assets during the financial year, with the balancing entry in the income statement, are shown below:
(thousands of euros)
Items/Figures 31/12/2016 31/12/2015
Deferred tax assets recognised in income statement 693,900 612,125
- losses carried forw ard - -
- non-repayable grants 78,444 23,326
- misc. impairment 10,123 -
- f inancial instruments - 746
- payables - -
- site decommissioning and reinstatement 176,141 143,949
- provisions 113,881 110,949
- w rite-dow ns on receivables 38,160 38,320
- equity investments - -
- property, plant and equipment/intangible assets 212,789 209,837
- employee benefits 32,503 32,983
- exchange rate differences - -
- other temporary differences 31,859 52,015
Deferred tax assets recognised in equity 10,073 11,789
- f inancial assets available for sale 656 -
- exchange rate differences - -
- cash flow hedge 3,285 3,207
- other 6,132 8,582
Total 703,973 623,914

• 2016 ANNUAL REPORT
86
Change in deferred tax assets (balancing entry in t he income statement)
The changes in deferred tax assets for the financial year, with the balancing entry in equity, are shown below:
(thousands of euros)
Items/Figures 31/12/2016
1. Opening balance 612,125
2. Increases 144,775
2.1 Deferred tax assets recognised during the year 96,952
a) in respect of previous periods -
b) due to change in accounting policies -
c) w ritebacks -
d) other 96,952
2.2 New taxes or increases in tax rates -
2.3 Other increases 47,823
2.4 Business combinations -
3. Decreases (63,000)
3.1 Deferred tax assets derecognised during the year (62,635)
a) reversals (37,370)
b) w ritedow ns for supervening non-recoverability -
c) due to change in accounting policies -
d) other (25,265)
3.2 Reduction in tax rates -
3.3 Other decreases (365)
3.4 Business combination transactions -
Closing balance 693,900

2016 CONSOLIDATED FINANCIAL STATEMENTS •
87
Change in deferred tax assets (balancing entry in e quity)
A7. Other non-current assets
Other non-current assets at 31 December 2016 amounted to €175 million (€143 million at 31 December 2015).
Their breakdown is provided in the table below:
Other current assets: breakdown
Accrued income and prepaid expenses from regulated activities of €100 million at 31 December 2016, which represent the majority of Other non-current assets, relate to the natural gas transport service recognised in the financial statements of SNAM and ITALGAS, and mainly concern the lower amounts invoiced compared to the limit set by the Regulator.
A14. Non-current assets held for sale
Assets held for sale, amounting to €25 million (€24.5 million at 31 December 2015), relate to a building complex owned by Italgas for which the sale to Eni S.p.A. has been approved.
(thousands of euros)
Items/Figures 31/12/2016
1. Opening balance 11,789
2. Increases 3,699
2.1 Deferred tax assets recognised during the year 2,193
a) in respect of previous periods -
b) due to change in accounting policies -
c) w ritebacks -
d) other 2,193
2.2 New taxes or increases in tax rates -
2.3 Other increases 1,506
2.4 Business combinations -
3. Decreases (5,415)
3.1 Deferred tax assets derecognised during the year (5,286)
a) reversals -
b) w ritedow ns for supervening non-recoverability -
c) due to change in accounting policies -
d) other (5,286)
3.2 Reduction in tax rates (129)
3.3 Other decreases -
3.4 Business combination transactions -
4. Closing balance 10,073
(thousands of euros)
Items/Figures 31/12/2016 31/12/2015
Accrued income and prepaid expenses from regulated activities 99,919 71,893
Accrued income and prepaid expenses 24,708 20,949
Guarantee deposits 17,660 16,082
Loans and advances to employees 9,054 9,079
Other assets 23,483 25,393
Total 174,824 143,396

• 2016 ANNUAL REPORT
88
Non-current assets and asset groups held for sale: breakdown by type of asset
CURRENT ASSETS
A8. Current financial assets
Current financial assets: breakdown and fair value levels
Current financial assets at 31 December 2016 amounted to €42 million (€73 million at 31 December 2015) and were mainly composed of the following:
• the current portion of the fair value hedge of the bonds recorded in the consolidated financial statements of the TERNA Group. The change with respect to the previous year is attributed to net financial gains accrued on the relative financial instruments that have not yet been settled;
(thousands of euros)
Items/Figures 31/12/2016 31/12/2015
A. Individual assets - -
A.1 Financial assets - -
A.2 Equity investments - -
A.3 Tangible assets - -
A.4 Intangible assets - -
A.5 Other assets - -
Total A - -
B. Asset groups (discontinued operating units) - -
B.1 Property, plant and equipment 24,949 24,479
B.2 Inventories - -
B.3 Intangible assets - -
B.4 Equity investments - -
B.5 Financial assets - -
B.6 Other assets - -
Total B 24,949 24,479
Total 24,949 24,479
(thousands o f euros)
Items/Figures Carrying amount L1 L2 L3 Carrying amount L1 L2 L3
Available for sale
Debt securities - - - - - - - -
Equity securities 157 - - 157 119 - - 119
Units in collective investment undertakings - - - - - - - -
Loans - - - - 2,791 - - 2,791
Total 157 - - 157 2,910 - - 2,910
Held to maturity
Debt securities - - - - - - - -
Loans - - - - - - - -
Total - - - - - - - -
Hedging derivatives
Hedging derivatives 30,867 - 30,867 - 65,299 - 65,299 -
Total 30,867 - 30,867 - 65,299 - 65,299 -
Loans and receivables
Debt securities - - - - - - - -
Loans 11,073 - - 11,073 4,330 - - 4,330
Total 11,073 - - 11,073 4,330 - - 4,330
Total 42,097 - 30,867 11,230 72,539 - 65,299 7,240
31/12/2016 31/12/2015

2016 CONSOLIDATED FINANCIAL STATEMENTS •
89
• the receivable of €11 million (€4 million at 31 December 2015) recorded by CDP RETI and due from the parent company CDP for the margin paid to it under the guarantee agreement (Credit Support Agreement) entered into when the cash flow hedge derivative was taken out.
A9. Income tax receivables
Income tax receivables recorded in the consolidated financial statements at 31 December 2016 amounted to €96 million (€88 million at 31 December 2015) and were broken down as follows:
Income tax receivables: breakdown
A10. Trade receivables
Trade receivables recorded in the consolidated financial statements at 31 December 2016 amounted to €3,196 million (€3,050 million at 31 December 2015) and were broken down as follows:
Trade receivables: breakdown
Trade receivables are calculated net of amounts deemed unrecoverable and therefore recorded as an adjustment to the bad debt provision.
The Gas sector trade receivables mainly relate to:
• trade receivables recorded in SNAM’s financial statements amounting to €1,271 million (€1,677 million at 31 December 2015) mainly relating to the transport (€988 million) and storage of natural gas (€218 million), including the effects deriving from the addition of revenues related to the assignment of natural gas storage capacity through tender (€68 million) by applying AEEGSI resolution 323/2016/R/gas “Provisions governing the regulation of transactions related to storage services for the 2016 - 2017 thermal year”;
• trade receivables, mainly for gas distribution and related services, recorded in the financial statements of ITALGAS including, above all, amounts due from Eni S.p.A. (€196 million) and third parties (172 million).
TERNA’s trade receivables amount to €1,443 million and include:
• receivables for “pass-through” items related to the activities performed by Terna S.p.A. (€976 million); • receivables due from distributors related to fees for use of the national transmission grid (NTG) amounting to €18
million; • the receivable due from Cassa per i Servizi Energetici e Ambientali (CSEA) related to the ENSR performance
assessment recognised during the 2016 financial year (€3 million).
Total trade receivables recorded by TERNA include a positive change of €172 million with respect to the prior year attributable to pass through energy receivables essentially as a result of the increase in the net receivable (€181.1 million) related to the so-called Uplift Price for the provisioning of resources on the Dispatching Services Market (DSM) - and the associated energy items. The change is mainly coming from the higher cost reported on the DSM market and from the higher charges from imbalances (including the effects of Resolution No. 333/2016/R/eel).
(thousands of euros)
Items/Figures 31/12/2016 31/12/2015
Income tax receivables 96,445 88,078
- Ires receivables 94,350 44,048
- Irap receivables 2,091 30,166
- other tax receivables 4 13,864
Total 96,445 88,078
(thousands of euros)
Items/Figures 31/12/2016 31/12/2015
Energy-related receivables 997,819 825,966
Grid transport consideration receivables 323,994 400,023
Gas sector trade receivables 1,688,640 1,677,014
Other trade receivables 124,487 100,063
Construction contracts 61,387 47,313
Total 3,196,327 3,050,379

• 2016 ANNUAL REPORT
90
A11. Inventories
Inventories: breakdown
Inventories at 31 December 2016 were recorded in the financial statements for €161 million (€164 million at 31 December 2015) and are recognised net of the provision for impairment of €42 million (€40 million at 31 December 2015).
Raw materials, supplies and consumables mainly consist of natural gas used for transportation activities (€42 million), spare materials for the gas pipeline network (€ 42 million), the distribution network (primarily gas meters related to the substitution plan, equal to €33 million) and storage facilities for €10 million. An additional €10 million of this line item consists of materials and equipment for the operation of plants in the electricity sector.
Finished products inventories, equal to 18 million in total, net of the relevant provision (identical at 31 December 2015), consist instead of natural gas in the storage network.
A12. Other current assets
The composition of Other current assets, which at 31 December 2016 amounted to €212 million (€410 million at 31 December 2015), is shown below.
Other current assets: breakdown
The decrease compared to the prior year is mainly attributable to the following factors:
• a decrease in receivables pertaining to withholding and indirect taxes due to the lower amount of VAT owed by the TERNA Group (down €79 million when compared to 31 December 2015) resulting essentially from the decrease in energy payables, offset in part by Terna Rete Italia S.p.A.’s recognition of a receivable due from the tax authorities for IRAP (€6.0 million) related to a request for reimbursement of 2015 taxes.
• decrease in the current portion of accrued income and prepaid expenses related to the natural gas transportation service recorded in SNAM’s financial statements and concerning lower amounts invoiced compared to the limit set by the Regulator (down €41 million compared to 31 December 2015).
A13. Cash and cash equivalents
Cash and cash equivalents, which at 31 December 2016 amounted to €1,272 million (€821 million at 31 December 2015) are broken down as follows:
(thousands o f euros)Items/Figures Gross amount
Provision fo r impairment Net value Gross amount
Provision for impairment Net value
Raw materials, supplies and consumables 153,474 (10,167) 143,307 153,598 (7,570) 146,028
Finished products and goods 49,921 (32,193) 17,728 49,984 (32,044) 17,940
Total 203,395 (42,360) 161,035 203,582 (39,614) 163,968
31/12/2016 31/12/2015
(thousands of euros)
Items/Figures 31/12/2016 31/12/2015
Accrued income and prepaid expenses from regulated activities 39,411 77,291
Accrued income and prepaid expenses 17,862 14,471
Guarantee deposits 58 80
Loans and advances to employees 157 1,231
Receivables for tax w ithholdings and direct taxes 56,456 128,814
Advances to suppliers 12,946 36,605
Other assets 85,104 151,426
Total 211,994 409,918

2016 CONSOLIDATED FINANCIAL STATEMENTS •
91
Cash and cash equivalents: breakdown
The change compared to 31 December 2015 is mainly attributable to the increase in cash in the bank current accounts held by the TERNA Group (up €860 million compared to 31 December 2015).
(thousands of euros)
Items/Figures 31/12/2016 31/12/2015
Current accounts and demand deposits 1,012,945 80,489
Short-term f inancial investments 258,764 739,691
Cash 712 528
Total 1,272,421 820,708

• 2016 ANNUAL REPORT
92
II. LIABILITIES
P1. EQUITY
Equity, for an amount of €4,060 million (€4,339 million at 31 December 2015) consists of the following:
Equity attributable to CDP RETI
During the year there were no changes to the company’s shareholding structure and the number of shares, which remained the same compared to the prior year:
Company’s shareholding structure
Outstanding shares at 31 December 2016 amounted to 161,514 without par value and are fully paid-up.
NON-CURRENT LIABILITIES
P2. Provisions for risks and charges
The provisions for risks and charges recorded in the consolidated financial statements at 31 December 2016 amounted to €1,176 million (€975 million at 31 December 2015) and were broken down as follows:
(thousands of euros)
Items/Figures 31/12/2016 31/12/2015
Share capital 162 162
Issue premium 1,315,158 1,315,158
Reserves 2,670,184 2,511,985
- Legal reserve 32 32
- Reserve for shareholder payments for investments 2,029,920 2,029,920
- Other reserves (3,256) (2,774)
- Retained earnings 643,488 484,807
Valuation reserves (20,915) (7,726)
- Cash f low hedges (13,878) (4,494)
- Exchange rate differences (1,651) 2,763
- Actuarial Profit (Loss) on defined-benefit pension plans (6,421) (6,524)
- Share of valuation reserves of equity investments accounted for using equity method 1,035 529
Advances on dividends (253,000) -
Net income for the period (+/-) 348,275 518,991
Total 4,059,863 4,338,570
M ember / Number o f shares / %Share category
AShare category
BShare category
C %
CDP 95,458 59.10%
State Grid 56,530 35.00%
Cassa Forense 4,253 2.63%
Foundations and Savings Banks 5,273 3.26%
95,458 56,530 9,526 100.00%

2016 CONSOLIDATED FINANCIAL STATEMENTS •
93
Provisions for risks and charges: breakdown
The provisions for site decommissioning and remediation, which represent the majority of this item, were recorded by the SNAM Group companies in relation to their natural gas transport and storage activities to cover the costs they will presumably incur to remove and reinstate natural gas storage and transport facilities. The change in the provision during the year can be attributed to a review of the cost estimates (discounting) for decommissioning and remediation following the reduction in the expected discount rates.
The Provision for exit incentives increased significantly from the prior year, going from €41 million at 31 December 2015 to €81 million at 31 December 2016. The change is predominantly attributable to accruals made during the year by TERNA (€32 million), ITALGAS (€15 million) and SNAM (€8 million).
The other provisions increased mainly as a result of net accruals for charges following the commissioning of plants belonging to the TERNA Group. In particular, €32.9 million related to the urban and environmental requalification projects and the provisions related to the works at Sorgente-Rizziconi and Villanova-Gissi.
The changes to the provisions for risks and charges recorded during the year are detailed below:
Provisions for risks and charges: changes for the ye ar
P3. Provisions for employee benefits
Below is the breakdown of the provisions for employee benefits:
(thousands of euros)
Items/Figures 31/12/2016 31/12/2015
Provision for site decommissioning and reinstatement 628,822 514,409
Provision for environmental risks and charges 137,159 135,219
Provision for risks of legal disputes 46,651 43,333
Provision for tax risks 50,904 44,464
Provision for early retirement incentives 81,410 40,791
Other provisions 231,042 196,383
Total 1,175,988 974,599
(thousands of euros)Items/Figures
Provision for site decommissioning and reinstatement
Provision for environmental risks
and chargesProvision for risks
o f legal disputesProvision for tax
risks
Provision for early retirement incentives Other provisions Totale
Opening balance 514,409 135,219 43,333 44,464 40,791 196,383 974,599
Increases:
Allocation in the year - 9,185 10,989 6,175 55,018 79,310 160,677
Changes due to the passing of time 9,458 427 - - - - 9,885
Changes due to changes to the discount rate 116,282 - - - - - 116,282
Other changes - 4,867 - 138 86 - 5,091
Decreases:
Use in the f inancial year
- to charges (11,323) (4,477) (1,310) (155) (350) (7,092) (24,707)
- due to surplus - (1,416) (1,324) (32) - (3,202) (5,974)
Changes due to changes to the discount rate - - - - - - -
Other changes (4) (6,646) (5,037) 314 (14,135) (34,357) (59,865)
Closing balance 628,822 137,159 46,651 50,904 81,410 231,042 1,175,988

• 2016 ANNUAL REPORT
94
Provisions for employee benefits: breakdown
The balance of Provisions for employee benefits decreased when compared to the prior year, going from €272 million at 31 December 2015 to €268 million at 31 December 2016.
This change is specifically attributable to the Energy discount provision which decreased by €5 million as a result of actuarial changes for gains and losses.
The changes to the Provisions for employee benefits are shown below:
Provisions for employee benefits: changes for the ye ar
P4. Long-term loans
Long-term loans recorded by the group at 31 December 2016 amounted to €19.6 million (€21 million at 31 December 2015) and were broken down as follows:
Loans: long term portion
The item “EMTN programme” in long-term loans relate to bond issues by SNAM for €6.9 million, and TERNA for €6.4 million.
The item “other issues”, instead, refers to the placement, concluded in May 2015 by CDP RETI, of an unsubordinated and unsecured fixed-rate bond, for a nominal value of €750 million.
An analysis of bond issues, with an indication of the issuing company, the currency, the interest rate and maturity, is provided below:
(thousands of euros)
Items/Figures 31/12/2016 31/12/2015
Severance pay 155,331 151,658
Long-term service aw ard 4,525 4,169
Supplementary health funds 18,125 17,534
Energy discount 28,847 33,709
Other employee benefits 61,465 64,577
Total 268,293 271,647
(thousands o f euros)Items/Figures Severance pay
Long-term service award
Supplementary health funds Energy discount
Other employee benefits Totale
Opening balance 151,658 4,169 17,534 33,709 64,577 271,647
Increases for business combinations - - - - - -
Current cost 346 714 518 500 2,918 4,996
Interest expense 2,917 19 383 700 735 4,754
Revaluations: - - - - - -
- actuarial prof it and loss due to changes in f inancial assumptions 6,095 - 1,091 (5,162) 915 2,939
- actuarial prof it and loss due to changes in demographic assumptions - - - - - -
- effect of past experience (532) - (1,040) - (185) (1,757)
Other changes (1,687) (377) (92) (900) (197) (3,253)
Paid benefits (3,466) - (269) - (7,298) (11,033)
Closing balance 155,331 4,525 18,125 28,847 61,465 268,293
(thousands of euros)
Items/Figures 31/12/2016 31/12/2015
Bonds
- EMTN programme 13,396,576 14,862,052
- other issues 748,270 747,971
Bank loans 4,579,889 4,552,253
Other lenders 838,239 919,706
Total 19,562,974 21,081,982

2016 CONSOLIDATED FINANCIAL STATEMENTS •
95
P5. Other non-current financial liabilities
Other non-current financial liabilities, totalling €24 million (€12 million at 31 December 2015), refer to the fair value of the interest rate derivative contracts entered into by the TERNA group for €12.8 million and CDP RETI for €11.5 million.
Other non-current financial liabilities: breakdown and fair value levels
(millions o f euros)
Issuer Currency Notional debt Accounting value Interest rate M aturity (year)
CDP RETI S.p.A. Euro 750 757 1.875 2023
Snam S.p.A. Euro 851 874 3.875 2018
Snam S.p.A. Euro 741 746 5.250 2022
Snam S.p.A. Euro 716 737 3.500 2020
Snam S.p.A. Euro 583 608 5.000 2019
Snam S.p.A. Euro 506 511 2.375 2017
Snam S.p.A. Euro 332 340 3.375 2021
Snam S.p.A. Yen 81 81 1.115 2019
Snam S.p.A. Euro 70 71 2.625 2018
Snam S.p.A. Euro 426 434 3.250 2024
Snam S.p.A. Euro 500 518 Euribor 12m + 0,5645 2023
Snam S.p.A. Euro 265 266 1.500 2019
Snam S.p.A. Euro 592 543 1.375 2023
Snam S.p.A. Euro 138 142 1.500 2023
Snam S.p.A. Euro 1,250 1,242 0.875 2026
Snam S.p.A. Euro 500 497 - 2020
Terna S.p.A. Euro 800 1,054 4.900 2024
Terna S.p.A. Euro 565 710 2.730 2023
Terna S.p.A. Euro 600 660 4.880 2019
Terna S.p.A. Euro 80 79 1.600 2026
Terna S.p.A. Euro 1,250 1,433 4.750 2021
Terna S.p.A. Euro 770 770 4.130 2017
Terna S.p.A. Euro 1,000 996 0.880 2022
Terna S.p.A. Euro 750 749 2.880 2018
Terna S.p.A. Euro 750 739 1.000 2028
(thousands of euros)
Items/Figures L1 L2 L3 L1 L2 L3
Fair value-related hedging derivatives
a) interest rate risk - - - - - -
b) exchange rate risk - - - - - -
c) several risks - - - - - -
Cash flow hedge-related derivatives - - - - - -
a) interest rate risk - 24,407 - - 12,435 -
b) exchange rate risk - - - - - -
c) other - - - - - -
Non-hedging derivatives - - - - - -
Other financial liabilities - - - - - -
Total - 24,407 - - 12,435 -
31/12/201531/12/2016

• 2016 ANNUAL REPORT
96
P6. Deferred tax liabilities
Deferred tax liabilities recorded in the financial statements at 31 December 2016 amounted to €2,978 million (€3,110 million at 31 December 2015), and consist of deferred tax liabilities entered as the offsetting item recognised in the income statement as detailed in the following table:
Non-current tax liabilities: breakdown
Below is the breakdown of deferred tax liabilities:
Deferred tax liabilities: breakdown
Deferred tax liabilities that refer to property, plant and equipment amounted to €1,941 million and represent the deferred tax recorded in conjunction with the higher price paid for the acquisition of the subsidiaries under Purchase Price Allocation (PPA).
The following tables indicate the change in deferred taxes during the year:
(thousands of euros)
Items/Figures 31/12/2016 31/12/2015
Deferred tax liabilities
- recognised in income statement 2,978,417 3,110,039
- recognised in equity - 17
Total 2,978,417 3,110,056
(thousands of euros)
Items/Figures 31/12/2016 31/12/2015
Deferred tax liabilities recognised in income state ment 2,978,417 3,110,039
- surplus paid in instalments 1,323 18,107
- staff severance pay 5,038 8,290
- leasing 1,311 -
- property, plant and equipment 2,831,604 2,996,798
- ow n securities - -
- equity investments - 19,552
- other f inancial instruments - -
- exchange rate differences 17 -
- other temporary differences 139,124 67,292
Deferred tax liabilities recognised in equity - 17
- f inancial assets available for sale - -
- Law 169/83 reserves - -
- Law 213/98 reserves - -
- other reserves - 17
Total 2,978,417 3,110,056

2016 CONSOLIDATED FINANCIAL STATEMENTS •
97
Change in deferred tax liabilities (balancing entry in the income statement)
Change in deferred tax liabilities (balancing entry in equity)
P7. Other non-current liabilities
The table below provides a breakdown of Other non-current liabilities as at 31 December 2016, for a total amount of €452 million (€417 million at 31 December 2015).
(thousands of euros)
Items/Figures 31/12/2016
1. Opening balance 3,110,039
2. Increases 45,663
2.1 Deferred tax assets recognised during the year 6,678
a) in respect of previous periods -
b) due to change in accounting policies -
c) others 6,678
2.2 New taxes or increases in tax rates -
2.3 Other increases 38,985
2.4 Business combination transactions -
3. Decreases (177,285)
3.1 Deferred tax assets derecognised during the year (145,153)
a) reversals (145,153)
b) due to change in accounting policies -
c) others -
3.2 Reduction in tax rates (27,670)
3.3 Other decreases (4,462)
3.4 Business combination transactions -
4. Closing balance 2,978,417
(thousands of euros)
Items/Figures 31/12/2016
1. Opening balance 17
2. Increases -
2.1 Deferred tax assets recognised during the year -
a) in respect of previous periods -
b) due to change in accounting policies -
c) others -
2.2 New taxes or increases in tax rates -
2.3 Other increases -
2.4 Business combination transactions -
3. Decreases (17)
3.1 Deferred tax assets derecognised during the year -
a) reversals -
b) due to change in accounting policies -
c) others -
3.2 Reduction in tax rates -
3.3 Other decreases (17)
3.4 Business combination transactions -
4. Closing balance -

• 2016 ANNUAL REPORT
98
Other non-current liabilities: breakdown
Other non-current liabilities mainly consist of the following:
• liabilities from regulated activities of the SNAM Group related to the transport sector (€141 million, of which €129 million are non-current) related to the higher amounts invoiced for the transport of natural gas with respect to the limits set by the Regulator, and to penalties charged to users that exceeded their reserved capacity, subject to reimbursement through tariff adjustments pursuant to AEEGSI resolution no. 166/05, as well as to the storage sector (€38 million, only the current portion) related to balancing and stock replenishment charges to be reimbursed to service users in accordance with the Authority’s resolution no. 50/06;
• deferrals for grants related to plants belonging to the TERNA Group for €118.4 million; • security deposits paid by users of the balancing service, pursuant to resolution ARG/gas 45/11 for €62 million and
recorded in SNAM’s financial statements; • liabilities of €66 million related to the increased quantity of combustible gas allocated by the users in previous years
pursuant to resolution ARG/gas 184/09 compared to the amount actually used in the same years, subject to adjustments through the reduction of quantities allocated by the users.
P13. Liabilities directly attributable to available -for-sale assets
Liabilities directly attributable to available-for-sale assets, for an amount of approximately €6 million( €7 million at 31 December 2015), concern environmental provisions for expenses for remediation work on a building complex classed under available-for-sale assets.
Liabilities directly attributable to available-for- sale assets: breakdown
CURRENT LIABILITIES
P8. Current portion of long-term loans
The item, which at 31 December 2016 amounted to €1,914 million (€1,510 million at 31 December 2015) includes the current portion of long-term loans.
(thousands of euros)
Items/Figures 31/12/2016 31/12/2015
Accrued liabilities and deferred income 14,183 22,478
Accrued liabilities and deferred income from regulated activities 284,951 272,763
Other liabilities 152,613 121,286
Total 451,747 416,527
(thousands of euros)
Items/Figures 31/12/2016 31/12/2015
C. Liabilities associated to individual assets held for sale
C.1 Debts - -
C.2 Securities - -
C.3 Other liabilities - -
Total C - -
D. Liabilities associated to groups of individual a ssets held for sale - -
D.1 Loans payable - -
D.2 Financial liabilities - -
D.3 Provisions 5,970 6,782
D.4 Other liabilities - -
Total D 5,970 6,782
Total 5,970 6,782

2016 CONSOLIDATED FINANCIAL STATEMENTS •
99
Loans: current portion
P9. Trade payables
Trade payables recorded in the consolidated financial statements at 31 December 2016 amounted to €2,968 million (€2,864 million at 31 December 2015) and were broken down as follows:
Trade payables: breakdown
Energy-related trade payables (€1,526 million) recorded in TERNA's financial statements, relating to the financial effects of “pass-through” costs, principally related to TERNA’s electricity dispatching operations, as well as to the transport fees due to other owners of portions of the national transmission grid.
Non-energy related trade payables of €736 million recorded in TERNA Group’s financial statements refer to amounts owed to suppliers for invoices both already received and yet to be received for tenders, services and the purchase of materials and equipment. The increase with respect to the previous year is mainly attributable to the increase in investment activity in the last part of the year.
Trade payables from the GAS segment of €687 million mainly refer to the transport (€313 million, of which €213 million related to gas system balancing services), distribution (€174 million) and storage (€46 million) of natural gas, and regasification for €1 million.
P10. Income tax liabilities
Current tax liabilities amounted to €11 million at 31 December 2016 (€17 million at 31 December 2015) and were broken down as follows
Current tax liabilities: breakdown
(thousands of euros)
Items/Figures 31/12/2016 31/12/2015
Bonds
- EMTN programme 1,403,792 1,355,065
- other issues 8,322 8,299
Bank loans 500,278 143,759
Other lenders 1,374 3,197
Total 1,913,766 1,510,320
(thousands of euros)
Items/Figures 31/12/2016 31/12/2015
Payables due to suppliers 2,958,658 2,853,605
- energy-related payables 1,525,743 1,435,677
- non-energy-related payables 735,713 724,308
- GAS sector payables 686,668 693,620
Payables due to other suppliers 10,534 -
Payables for construction contracts 9,135 10,349
Total 2,967,793 2,863,954
(thousands of euros)
Items/Figures 31/12/2016 31/12/2015
Income tax payables 11,169 16,787
- Ires payables 10,754 6,799
- Irap payables 294 8,567
- other tax payables 121 1,421
Total 11,169 16,787

• 2016 ANNUAL REPORT
100
P11. Current financial liabilities
The item pertaining to Other financial liabilities amounted to €4,195 million at 31 December 2016 (€1,895 million at 31 December 2015) and referred mainly to:
• uncommitted variable rate credit facilities used by SNAM of €1,497 million; • a bank pool loan (Bridge to Bond) recorded in the ITALGAS financial statements for €2,696 million, underwritten by a
group of eleven leading domestic and international banks with the option to renew for an additional 12 months, with a nominal value of €2,300 million, and net utilisations of uncommitted bank credit facilities of €396 million.
Current financial liabilities: breakdown and fair v alue levels
P12. Other current liabilities
Other Current liabilities amounted to €1,230 million at 31 December 2016 (€1,406 million at 31 December 2015) and were broken down as shown in the following table:
Other current liabilities: breakdown
The change in Other current liabilities is mainly attributed to the following factors:
• a decrease in VAT payables which go from €35 million at 31 December 2015 to €4 million at 31 December 2016; • a reduction in the current portion of liabilities, for the SNAM Group, related to regulated activities in the transport sector
as a result of higher revenues from the transportation of natural gas compared to the limit set by the Regulator; • a decrease in the payable to Cassa Servizi Energetici e Ambientali (previously, CCSE) recorded by the SNAM Group,
which goes from €418 million to €380 million; • a decrease in debts for investment activities of the SNAM Group, which go from €467 million at 31 December 2015 to
€384 million at 31 December 2016
(thousands o f euros)
Items/Figures L1 L2 L3 L1 L2 L3
Fair value-related hedging derivatives
a) interest rate risk - - - - - -
b) exchange rate risk - 203 - - 3,107 -
c) several risks - - - - - -
Cash flow hedge-related derivatives - - - - - -
a) interest rate risk - 732 - - 587 -
b) exchange rate risk - - - - - -
c) other - - - - - -
Non-hedging derivatives - - - - - -
Other financial liabilities - - 4,193,943 120,610 3,373 1,767,168
Total - 935 4,193,943 120,610 7,067 1,767,168
31/12/201531/12/2016
(thousands of euros)
Items/Figures 31/12/2016 31/12/2015
VAT payables 4,016 34,821
Irpef w ithholdings on employees 12,789 6,295
Other duties and taxes 9,274 15,787
Accrued liabilities and deferred income 13,386 9,271
Advances 57,112 60,148
Payables due to pension and social security institutions 49,849 43,323
Payables due to employees 100,402 89,477
Accrued liabilities and deferred income from regulated activities 12,490 56,436
Other liabilities 970,444 1,090,217
Total 1,229,762 1,405,775

2016 CONSOLIDATED FINANCIAL STATEMENTS •
101
III - INFORMATION ON THE CONSOLIDATED INCOME STATEMENT
A. REVENUES
A1. REVENUES FROM SALES AND SERVICES
A1. Revenues from sales and services: breakdown
The grid transmission fees refer to the income earned by TERNA for use of the National Transmission Grid - NTG. The change over the prior year is attributable to the following:
• contribution from the inclusion in 2016 of the National Transmission Grid acquired at the end of 2015 from the FSI Group (+€63 million);
• the overall effects of the new 2016–2023 regulatory period (which entail a reduction in revenue attributable to the revision of the WACC, partially offset by the reduction in the time-lag);
The other energy revenues consist mainly of fees paid to TERNA by electricity companies for despatching services. The decrease over the prior year can be attributed to the fee reduction for despatching services in the new regulatory period.
Finally, the other sales and services originate from the purchase and sale of energy concluded on a daily basis with the operators in the electricity market in carrying out despatching activities.
Revenues in the gas sector, which amounted to €3,754 million at 31 December 2016, are related to transport (€1,919 million), distribution (€1,319 million), storage of natural gas (€434 million), regasification of LNG (€18 million), and finally, other sales and services (€64 million). These revenues are recorded net of the additional tariff components, which are meant to cover the general costs of the gas system. The amounts collected are then paid to Cassa per i servizi energetici e ambientali (CSEA), for the same amount.
(thousands of euros)
Items/Figures 31/12/2016 31/12/2015
Revenues from electricity dispatching and distribut ion
Grid transport consideration receivables 1,732,994 1,706,568
CTR adjustments for previous years 2,009 (175)
Service quality 15,449 (4,710)
Other energy revenues 132,453 151,363
Other sales and performance 149,722 158,867
Total 2,032,627 2,011,913
- of w hich IFRIC 12 revenues 21,179 26,170
Revenues from storage, transportation, regasificati on and distribution of natural gas
Storage 434,378 396,936
Distribution 1,319,386 1,347,525
Transport and dispatching 1,918,513 2,036,003
Regasif ication 17,485 17,880
Other sales and performance 63,935 57,860
Total 3,753,697 3,856,204
- of w hich IFRIC 12 revenues 315,530 320,826
Total 5,786,324 5,868,117

• 2016 ANNUAL REPORT
102
A2. OTHER REVENUES AND INCOME
The table below shows the breakdown of Other revenues and income, which at 31 December 2016 amounted to €200 million (€184 million at 31 December 2015):
Other revenues and income: breakdown
Income from the sale of gas for the balancing service are revenues from balancing activities, in operation since 1 December 2011 as a result of resolution ARG/gas 45/11 issued by the Authority, and relate to sales of natural gas owned by the Company for balancing the gas system. These revenues correspond to the operating costs connected to the withdrawal of gas from storage.
B. OPERATING COSTS
B1. RAW MATERIALS AND CONSUMABLES USED
The breakdown of costs for raw materials is shown in the table below:
Costs for raw materials: breakdown
The item represents the value of materials and miscellaneous equipment consumed in ordinary plant operation and plant maintenance, as well as the consumption of materials for the fulfilment of orders.
B2. SERVICES
Costs for services recognised in the financial statements at 31 December 2016 amounted to €753 million (€665 million at 31 December 2015) and were broken down as follows:
(thousands of euros)
Items/Figures 31/12/2016 31/12/2015
Other industrial revenues 75,095 50,966
Revenues from the sale of gas for the balancing service 72,296 48,840
Income from the sale of energy eff iciency securities 672 -
Contractual penalties and other income relating to trade transactions 2,127 2,126
Other revenues and incomes 113,454 130,145
Rental income 27,958 28,007
Lease of business unit - -
Other contributions 9,376 12,731
Other income 76,120 89,407
Gains on disposal 11,506 2,825
Gains on disposal from property, plant and equipment 11,461 2,825
Gains on disposal from intangible assets 45 -
Total 200,055 183,936
(thousands of euros)
Items/Figures 31/12/2016 31/12/2015
Raw materials, supplies, consumables and goods (288,493) (357,617)
Increases for internal w ork 65,543 81,873
Total (222,950) (275,744)

2016 CONSOLIDATED FINANCIAL STATEMENTS •
103
Costs for services: breakdown
The change in costs for services with respect to the prior year is mainly attributable to the SNAM Group, which reported an increase in costs for technical, legal, administrative and professional services of €52 million, and to the TERNA Group, which was impacted by the maintenance costs incurred by the subsidiary Rete S.r.l. (€36 million) for the FSI Group.
Costs for professional services include the 2016 fees for auditing and certification services provided to companies of the CDP RETI Group by the independent auditors.
The following disclosure is provided pursuant to Article 149-duodecis of CONSOB Issuers' Regulations:
Independent auditors’ fees
B3. STAFF COSTS
A breakdown of staff costs is provided below:
(thousands of euros)
Items/Figures 31/12/2016 31/12/2015
Construction, planning and w orks management (158,847) (179,592)
IT services (Information Technology) (80,074) (80,427)
Purchase of transport capacity (interconnection) (62,548) (58,622)
Maintenance services (44,458) (52,749)
Technical, legal, administrative and professional services (115,643) (53,337)
Personnel-related services (30,856) (32,791)
Telecommunications services (36,717) (25,352)
Electricity, thermal energy, w ater, etc. (19,092) (20,397)
Insurance (10,978) (25,042)
Other services (157,232) (104,616)
Costs for leases and rentals (92,118) (109,260)
- fees, patents and user licenses (62,859) (66,059)
- leases and rentals (29,259) (43,201)
Increases for internal w ork 56,242 77,340
Commission expenses (940) -
Total (753,261) (664,845)
(thousands of euros)
Items/Figures PwC Ernst & Young Totale
Auditing 700 1,497 2,197
Certif ication 257 1,044 1,301
Tax consultancy services - - -
Other 38 - 38
Total 995 2,541 3,536

• 2016 ANNUAL REPORT
104
Staff costs: breakdown
Staff costs for employees, which at 31 December 2016, before their allocation to fixed assets, totalled €776 million, are mainly attributable:
• for € 306 million to Terna group employees, whose average headcount totalled 3,801 in 2016; • for € 411 million to SNAM group employees, whose average headcount totalled 2,850 in the same period; • for € 59 million to ITALGAS group employees, whose average headcount totalled 3,555.
It should be noted that the income statement data deriving from the SNAM Group’s consolidated financial statements include results from the distribution segment up to the effective date of the spin-off of the ITALGAS Group (7 November 2016), while the contribution coming from the ITALGAS Group relates to the period from the spin-off date until the end of the financial year (approximately two months).
The following table shows the average headcount of group employees by contractual level:
Average headcount
B4. AMORTISATION, DEPRECIATION AND IMPAIRMENT
Amortisation, depreciation and impairment, for an amount of €1,738 million at 31 December 2016 (€1,687 million at 31 December 2015) are broken down as follows:
(thousands of euros)
Items/Figures 31/12/2016 31/12/2015
1) Employees (754,771) (756,808)
a) salaries and w ages (491,064) (508,720)
b) social security charges (4,470) (4,198)
c) staff severance pay (14,285) (16,682)
d) pension costs (149,164) (149,780)
e) provision for staff severance pay (2,464) (1,049)
f) provision for post-employment benefits: (11) (2,367)
- defined contribution (11) -
- defined benefits - (2,367)
g) payments to external supplementary pension plans: (15,670) (12,057)
- defined contribution (13,375) (3)
- defined benefits (2,295) (12,054)
h) costs related to payment agreements based on ow n equity instruments - -
i) other benefits for employees (77,643) (61,955)
2) Other personnel in service (6,454) (4,314)
3) Board of Directors and Board of Auditors (15,051) (11,702)
4) Retired personnel - -
5 Increases for internal work 136,085 134,829
Total (640,191) (637,995)
Items/Figures 31/12/2016 31/12/2015
Senior Managers 213 206
Middle Managers 1,213 1,161
Off ice staff 5,455 5,367
Manual w orkers 3,329 3,283
Total 10,210 10,017

2016 CONSOLIDATED FINANCIAL STATEMENTS •
105
Amortisation, depreciation and impairment: breakdow n
B5. OTHER OPERATING COSTS
Other operating costs, which at 31 December 2016 amounted to €190 million (€143 million at 31 December 2015), are shown in the table below:
Other operating costs: breakdown
The change compared to the prior year is attributable to the following factors:
• decrease in the net accruals to the provision for bad debts by the SNAM Group which amounted to €31 million at 31 December 2015;
• increase in net accruals to the provisions for risks and charges, which at 31 December 2015 was a negative adjustment of €9 million in reduction of Other operating costs, while at 31 December 2016 totalled €39 million and was partially attributable to the SNAM Group’s provision for claims related to the captive company Gasrule.
C. FINANCIAL INCOME (EXPENSE)
C1. FINANCIAL INCOME
Financial income, equal to €93 million (€117 million at 31 December 2015) is broken down as follows:
Financial income: breakdown
(thousands of euros)Items/Figures
Amortisation and depreciation
(a)Impairment
adjustments (b)Writebacks
(c) Net result (a+b+c)
Amortisation and depreciation
(a)Impairment
adjustments (b)Writebacks
(c) Net result (a+b+c)
Property, plant and equipment (1,215,305) (38,118) - (1,253,423) (1,184,852) (25,335) - (1,210,187)
Intangible assets (477,035) (7,868) - (484,903) (476,336) - - (476,336)
Total (1,692,340) (45,986) - (1,738,326) (1,661,188 ) (25,335) - (1,686,523)
31/12/2016 31/12/2015
(thousands of euros)
Items/Figures 31/12/2016 31/12/2015
Indirect duties and taxes (40,962) (37,371)
Losses from cancellation of property, plant and machine and intangible assets (37,858) (35,673)
Provisions for bad debts (3,692) (34,762)
Methane gas consumption tax - (1,121)
Electricity service quality charges (8,871) (7,878)
Net provision for risks and charges (38,810) 8,643
Other costs (59,344) (34,639)
Total (189,537) (142,801)
(thousands of euros)
Items/Figures 31/12/2016 31/12/2015
Interest income and other f inancial income 10,761 10,573
Interest income on hedging derivatives 82,032 91,404
Other financial income - 15,335
Total 92,793 117,312

• 2016 ANNUAL REPORT
106
C2. FINANCIAL EXPENSES
Financial expenses recognised in the financial statements at 31 December 2016, amounting to €858 million (€662 million at 31 December 2015), is broken down as follows:
Financial expenses: breakdown
The decrease in interest expenses, in particular from medium-long term debt, is mainly attributable to the general decrease in market interest rates during the period, and to the liability management operations conducted by both the SNAM and TERNA Groups during the period.
With regard to expenses for sales and repurchases amounting to €329 million, these charges recorded in the financial statements of the SNAM Group at 31 December 2016 relate to expenses for a liability management operation carried out by the Group whose outcome was the repurchase of certain bond issues for a total nominal value of €2.75 billion.
Financial expenses capitalized during the year are €40 million (€58,7 million in the previous year).
C3. PORTION OF INCOME / (EXPENSES) FROM EQUITY INVESTMENTS CARRIED AT EQUITY
Income and expenses from equity investments, amounting to €146 million at 31 December 2016 (€136 million at 31 December 2015) consisted of the following:
Portion of income / (expenses) from equity investmen ts carried at equity
The main events recorded during the year were:
• the revaluations concerning the investments in Trans Austria Gasleitung GmbH (€90 million), TIGF Holding S.A.S. (€50 million) and Toscana Energia S.p.A. (€20 million);
• the value adjustments predominantly attributable to the investments in GasBridge 1 B.V. (€5 million), GasBridge 2 B.V. (€5 million), Trans Adriatic Pipeline AG (€3 million) and CGES A.D. (€5 million).
(thousands of euros)
Items/Figures 31/12/2016 31/12/2015
Interest expenses and other charges (517,351) (660,484)
of which interest expenses on bonds (443,962) (366,187)
Exchange rate differences (280) -
Financial expenses from trading activities - -
Financial expenses from hedging activities (10,959) (1,818)
Financial expenses from buyback activities (329,386) -
Total (857,976) (662,302)
(thousands o f euros)Items/Figures Joint ventures Associates Total Joint ventures Associates Total
A. Income 160,887 3,228 164,115 135,579 3,362 138,941
1. Income 160,887 2,092 162,979 135,542 2,295 137,837
- Net equity valued investments 160,887 2,092 162,979 135,542 2,295 137,837
- Other investments - - - - - -
2. Gains on disposal - - - - - -
3. Writebacks - - - - - -
4. Other - 1,136 1,136 37 1,067 1,104
B. Charges (9,852) (8,667) (18,519) - (3,331) (3,331)
1. Impairment (9,852) (8,667) (18,519) - - -
- Net equity valued investments (9,852) (8,667) (18,519) - - -
- Other investments - - - - - -
2. Impairment adjustments - - - - (3,331) (3,331)
3. Losses on disposal - - - - - -
4. Other - - - - - -
Total 151,035 (5,439) 145,596 135,579 31 135,610
31/12/2016 31/12/2015

2016 CONSOLIDATED FINANCIAL STATEMENTS •
107
E. TAXES FOR THE YEAR
Taxes for the year amounted to €594 million (€415 million at 31 December 2015) and are broken down as follows:
Taxes for the year: breakdown
The reconciliation between the theoretical and actual tax liability is shown below:
Reconciliation between theoretical and actual tax l iability: IRES
(thousands of euros)
Items/Figures 31/12/2016 31/12/2015
1. Current taxes (-) (800,119) (940,597)
2. Change in current taxes from previous years (+/-) 6,055 21,162
3. Reduction of current taxes for the year (+) - -
4. Change in deferred tax assets (+/-) 34,317 (51,461)
5. Change in deferred tax liabilities (+/-) 166,185 556,072
6. Taxes for the year (593,562) (414,824)
(thousands of euros)
Items/Figures 31/12/2016
Income (loss) before taxes 1,822,527
IRES theoretical tax liability 27.5% (501,196)
Increase in taxes (324,993)
- non deductible interest expenses 4% (6,785)
- temporary non deductible dif ferences (80,417)
- permanent non deductible dif ferences (4,614)
- equity investments impairment (6,875)
- altre variazioni in aumento (226,302)
Decreases in taxes 161,261
- dividends 95% exempt 122,912
- non-taxable income -
- ACE benefit 34,468
- temporary dif ferences 41
- prior period deductible expenses -
- IRAP deduction 2,863
- other changes 977
IRES Actual tax liability (664,928)

• 2016 ANNUAL REPORT
108
Reconciliation between theoretical and actual tax l iability: IRAP
G. NET INCOME FROM DISCONTINUED OPERATIONS
This item was not included at 31 December 2016, while at 31 December 2015 it amounted to €7.3 million and was attributable to Terna's release of the provision accrued for probable tax obligations resulting from the sale of Terna Participações by Terna S.p.A.
(thousands of euros)
Items/Figures 31/12/2016
IRAP tax base 2,757,063
IRAP theoretical tax liability 5.57% (153,568)
Increases in taxes 666
- non deductible interest expenses 4% (55)
- other non deductible expenses 721
- effect of dif ferent regional tax rates -
Decreases in taxes 17,712
- prior period deductible expenses -
- deductible employees costs 21
- decreases 1,377
- effect of dif ferent regional tax rates 16,314
IRAP surcharge -
IRAP Actual tax liability (135,190)

2016 CONSOLIDATED FINANCIAL STATEMENTS •
109
IV - BUSINESS COMBINATIONS
IV.1 TRANSACTIONS CARRIED OUT DURING THE PERIOD
There were no business combination transactions considered material for the CDP RETI Group carried out during the year ended 31 December 2016.
IV.2 TRANSACTIONS CARRIED OUT AFTER THE REPORTING D ATE
There were no business combination transactions considered material for the CDP RETI Group carried out after the reporting date.

• 2016 ANNUAL REPORT
110
V - TRANSACTIONS WITH RELATED PARTIES
V.1 INFORMATION ON THE REMUNERATION OF KEY MANAGEME NT PERSONNEL
The following table provides the remuneration amounts for 2016 paid to members of the management and control bodies, and key management personnel of the Parent Company and of the companies that are consolidated on a line-by-line basis.
Remuneration of key management personnel
V.2. INFORMATION ON TRANSACTIONS WITH RELATED PARTI ES
The following table illustrates the assets, liabilities, revenues and costs in respect of transactions undertaken by the CDP RETI Group in 2016 with associates and joint operations, companies of the CDP Group, and with companies controlled by the Ministry of Economy and Finance.
In this regard it is noted, in fact, that related parties of CDP RETI, based on the current group shareholding structure, include not only the subsidiaries, associates and companies subject to joint control of SNAM, TERNA and ITALGAS but also the parent company CDP S.p.A. and its subsidiaries and associates, as well as companies controlled (directly or indirectly) by the Ministry for the Economy and Finance (MEF). In addition, the members of the Board of Directors, Statutory Auditors, key management personnel, and their relatives, of the CDP RETI Group and of CDP, are also considered to be related parties.
Related-party transactions in 2016 mainly relate to performances within the ordinary running of the business conducted at arm’s length conditions, i.e. the conditions that would be applied between two independent parties.
(thousands o f euros)Items/Figures Directors Board o f audito rs
Key management personnel Total
a) short-term benefits (6,796) (1,379) (6,172) (14,347)
b) post-employment benefits (204) - (334) (538)
c) other long-term benefits (825) - (2,981) (3,806)
d) severance benefits (5,847) - - (5,847)
e) share-based payments - - - -
Total (13,672) (1,379) (9,487) (24,538)
31/12/2016

2016 CONSOLIDATED FINANCIAL STATEMENTS •
111
Transactions with related parties
(thousands o f euro)
Names Assets Liabilities Off-balance sheet Income statement
ANAS S.p.A. 1,492 5,115 (880,116)
Ansaldo Energia S.p.A. 4,078
AS Gasinfrastruktur GmbH 3,666 3,666
CDP SpA 17,871 1,190,923 (18,090)
CESI S.p.A. 16,677 10,341 1,200 (2,307)
Coni Servizi S.p.A. 116 46 (115)
CORESO S.A. (1,556)
Enel Energia 31,588 1,861 30,892
Enel Italia 291,210 31,851 509,900 1,484,980
ENEL S.p.A. 165,496 13,042 481,817
ENI S.p.A. 479,451 66,605 19,900 1,871,621
Fincantieri S.p.A. 182
Fintecna SpA (81)
FONDENEL (416)
FOPEN 1,516 (1,864)
FS - Ferrovie dello Stato Italiane S.p.A. 1,213 773 (219)
Gestore dei Mercati Energetici S.p.A. 44 1 -
GSE - Gestore dei Servizi Energetici S.p.A. 15,862 10,566 21,473
Leonardo - Finmeccanica S.p.A. 36 197 (184)
Metano Sant'Angelo Lodigiano S.p.A. 3 243
Poste Italiane S.p.A (128)
Poste Italiane S.p.A. 117 (54)
Rete Ferroviaria Italiana - Società per Azioni (RFI) 12,480 29,850 24,200 (32,350)
Saipem S.p.A. 42,964 (39,781)
TIGF Holding S.A.S. 5 6 113
TIGF Investissements S.A.S. 1,001 48 138
TIGF S.A. 277 296 (149)
Toscana Energia S.p.A. 231 9 1,961
Trans Adriatic Pipeline AG 252 236
Trans Austria Gasleitung GmbH 3,170 2,719 1,845
Umbria Distribuzione Gas S.p.A. 460

• 2016 ANNUAL REPORT
112
VI - FINANCIAL RISK MANAGEMENT
Regarding the Parent Company’s financial risks, see the special section of the financial statements.
The main corporate risks, measured and managed in regard to TERNA, SNAM and ITALGAS, are detailed below:
• Interest rate risk and risks related to funding needs; • Exchange rate risk; • Credit risk; • Liquidity risk; • Default risk and debt covenants.
Information on other risks affecting the Company’s business can be found in the “Risk factors” section of the Report on Operations.
VI.1. RISK OF CHANGE IN INTEREST RATES AND RISKS RE LATED TO FUNDING NEEDS
Interest rate fluctuations and their impact on the market value of the company's financial assets and liabilities and on the level of net financial charges, are monitored in pursuit of the objectives set and approved in the respective financial plans.
At 31 December 2016, the SNAM Group used external financial resources in the form of bond issues and bi-lateral and syndicated loan agreements with banks and other Lenders, in the form of medium- to long-term loans and credit facilities at interest rates that were index-linked to the market rates in question, in particular the Europe Interbank Offered Rate (Euribor), and at a fixed rate. Exposure to interest rate risk at 31 December 2016 stood at approximately 36% of the Group’s total exposure (similar to that at 31 December 2015).
At 31 December 2016, Snam had an Interest Rate Swap (IRS) derivative contract for a fixed-rate bond of €500 million with maturity date 2023. The IRS derivate contract is used to convert the fixed-rate loan to a floating-rate loan.
Terna, too, is exposed to interest rate risk. This interest rate risk mainly derives from items of net financial debt and the related hedging positions in derivative instruments that generate financial charges. The borrowing strategy focused on long-term loans, whose term reflects the useful life of company assets. It pursues an interest rate risk hedging policy that aims to guarantee a fixed-rate debt of at least 40%, as foreseen by company policy. Bearing in mind the lower interest rates and the new regulatory review, this percentage had risen to over 80% by 31.12.2016. Accordingly, the hedging instruments used, at various maturity dates, include both derivatives that transform fixed rates into floating rates, and derivatives that transform floating rates into fixed rates. At 31 December 2016, on the one hand Terna had entered into fixed-to-floating interest rate swaps (FVHs) to hedge the fair-value risk of fixed-rate bonds, and on the other it had entered into floating-to-fixed interest rate swaps (CFHs) to hedge the expected cash flows in regard to all other floating-rate debt.
At 31 December 2016, ITALGAS used external financial resources in the form of bilateral and syndicated loan agreements with Banks and other Lenders, in the form of medium- to long-term loans and credit facilities at interest rates index-linked to market rates. Net financial debt, further details of which are given in the specific section dedicated to the matter, is of a completely floating-rate nature.
VI.2. EXCHANGE RATE RISK
Exposure to exchange rate risk concerns both transaction risk and translation risk relating to exchange rates. The "transaction" exchange rate risk arises from the conversion of trade or financial receivables (payables) into currencies other than the operating currency, and can be linked to the impact of adverse exchange rate fluctuations between the moment the transaction is generated and the moment it is perfected (i.e. the date of collection/payment). The “translation” exchange rate risk, on the other hand, manifests itself in the preparation of the consolidated financial statements, due to

2016 CONSOLIDATED FINANCIAL STATEMENTS •
113
the translation of the income statement and balance sheet of consolidated subsidiaries that prepare their accounts in a currency other than the Euro.
The aim is to minimize these risks, also through the use of derivative financial instruments.
With regard to SNAM in particular, at 31 December 2016, it had foreign currency items consisting essentially of a bond amounting to 10 billion Japanese Yen, with maturity in 2019, with a foreign exchange value of approximately 75 million Euro, fully converted into Euros through a Cross Currency Swap hedging derivative, and with a notional amount and maturities reflecting the covered item.
Terna covers the exchange rate risk through the sale or purchase of forward currency contracts, or of options entitling or obliging it to purchase or sell predetermined amounts of foreign currency at a specific exchange rate at the end of a certain time period. Normally, both forward contracts and options have maturities of no more than 12 months. Such contracts have a notional amount and maturity date less than, or equal to, that of the underlying financial liability or the expected cash flows.
At 31 December 2016, the financial instruments linked to exchange rate risk were of a marginal entity and imputable to the Tamini Group.
At 31 December 2016, the ITALGAS Group was not exposed to exchange rate risk.
VI.3. CREDIT RISK
Credit risk is the company's exposure to potential losses arising from counterparties defaulting on their obligations. The non-payment or delayed settlement of any amounts due may negatively impact the company’s performance and financial soundness.
SNAM provides its business services to a limited number of gas sector operators, of which ENI S.p.A. is the most important in terms of turnover. However, it cannot be ruled out that SNAM may incur liabilities and/or losses due to the non-fulfilment of payment obligations by its clients. At 31 December 2016, approx. 65% of trade receivables (compared with 60% at 31 December 2015) concerned top-tier investment grade customers, including Eni S.p.A. which represented 21% of total trade receivables (compared with 28% at 31 December 2015).
TERNA provides its services mainly to counterparties considered solvent by the market, and thus with a correspondingly high credit rating, and is not characterized by any concentrations of credit risk.
As regards ITALGAS, the rules of user access to the gas distribution service are established by the AEEGSI and are provided for in the Network Code, or in documents establishing, for each type of service, those rules governing the rights and obligations of the persons involved in service provision, and establishing contractual provisions curbing the risk of contractual breach by customers, such as the issue of bank or insurance guarantees callable on first demand. However, ITALGAS may nevertheless still incur liabilities and/or losses due to the non-fulfilment of payment obligations by its clients. At 31 December 2016, approx. 58% of trade receivables referred to top-tier investment grade customers, of which Eni represents approximately 47% of total trade receivables.
VI.4. LIQUIDITY RISK
Liquidity risk is the risk that, due to the inability of raising new funds (funding liquidity risk) or liquidating assets on the market (asset liquidity risk), the Company may not be able to fulfil its payment commitments, thus impacting income if the company is forced to sustain additional costs to meet such commitments, or as an extreme consequence, it may result in a state of insolvency putting business continuity at risk.
At 31 December 2016, SNAM had unused long-term committed credit facilities totalling approximately €3.2 billion. Moreover, Snam had a Euro Medium Term Notes (EMTN) programme for a maximum total foreign exchange value of €10 billion, of which approx. €7.5 billion had been used at 31 December 2016. At the end of 2016, the programme permitted the issue, by 30 September 2017, of bonds with a total maximum value of approximately 2.5 billion euro, to be placed with institutional investors operating prevalently in Europe.
At 31 December 2016, Terna had approximately €959 million in short-term credit lines and €2,050 million in revolving credit lines.
To mitigate this risk, and to preserve the level of liquidity required in order to maintain its rating, Italgas had signed loan agreements (of 1.1 billion Euro) over and above its financial requirements at 31 December 2016. It should also be noted that on 18 November 2016, Italgas saw a Euro Medium Term Notes (EMTN) programme approved by the appointed

• 2016 ANNUAL REPORT
114
authorities, permitting the issue, by 31 October 2017, of one or more bonds for a maximum amount of 2.8 billion Euro, to be placed with institutional investors.
VI.5. DEFAULT RISK AND DEBT COVENANTS
The risk of default consists in the possibility that the loan agreements underwritten contain provisions permitting the lender to activate contractual protections which could result in the early repayment of the loan if specific circumstances occur, thereby generating a potential liquidity risk.
At 31 December 2016, SNAM, TERNA and ITALGAS had outstanding bilateral and syndicated loan agreements with banks and other Financial Institutions, in addition to bond issues. Some of these agreements and loans provide for, among other things, compliance with the following: (i) negative pledge commitments under which there are limitations concerning the pledging of real property rights or other restrictions on all or part of the corresponding assets, shares or merchandise; (ii) pari passu, change of control and event of default clauses; (iii) limitations on some extraordinary transactions that the Company and its subsidiaries can carry out; iv) disclosure obligations.
For EIB loans only, the lender is entitled to request further guarantees if there is a reduction in the rating.
On the other hand, with regard to ITALGAS, the EIB loans contain a clause whereby any significant reduction in EBITDA deriving from the loss of concessions, shall require that the EIB be informed, followed by a period of consultation at the end of which the advance repayment of the loan may be demanded.

2016 CONSOLIDATED FINANCIAL STATEMENTS •
115
VII – SHARE-BASED PAYMENTS
No share-based payment compensation plans were signed during the year and there were no plans in place in previous years.

• 2016 ANNUAL REPORT
116
VIII – SEGMENT REPORTING
This section of the notes to the consolidated financial statements has been drafted in compliance with IFRS 8 - Operating Segments, in force since 01 January 2009 in replacement of IAS 14 - Segment Information.
CDP RETI's corporate purpose is the holding and management, both on an ordinary and extraordinary basis, of the equity investments in SNAM, ITALGAS and TERNA, monitoring the infrastructure they operate to ensure it is developed and maintained appropriately, and developing the necessary expertise in gas transport, dispatching, distribution, regasification and storage, and electricity transmission, in order to oversee its investments most effectively.
The segments that CDP RETI and its subsidiaries operate in essentially consist of:
• gas transport, regasification and storage handled by the companies of the SNAM Group; • dispatch and transmission of electricity handled by the companies of the TERNA Group; • gas distribution handled by the company of ITALGAS Group.
Below the results by business segment as at 2016 and 2015 as well as the reconciliation to the Group net income.
The consolidated information on balance sheet analyzed by senior management do not make direct reference to sector activities, but to the measurement and presentation of Equity, Net Financial Debt and Technical Investments.
(millions o f euros) 31/12/2015
Items
CDP RETI SNAM TERNA ITALGASIntercompany
adj.Other adj. Group Group
Revenues from sales and services - 3,531 2,033 248 (25) - 5,786 5,868
Other revenues and income 0 105 71 26 (1) - 200 184
Revenues from financial statement 0 3,635 2,103 274 (26) - 5,986 6,052
Reclassifications (1) - (254) (21) (62) - - (337) (347)
Revenues from sectors 0 3,382 2,082 212 (26) - 5,65 0 5,705
Costs from financial statement (not included Deprec iation and Amortization) (3) (1,101) (563) (166) 26 - (1,806) (1,721)
Reclassifications (1) - 254 21 62 - - 337 347
Costs from sectors (not included Depreciation and A mortization) (3) (847) (541) (104) 26 - (1,469) (1, 374)
EBITDA (3) 2,535 1,541 108 - - 4,180 4,331
EBITDA margin 75% 74% 51% 74% 76%
Ammortisation, depreciation and impairment - (894) (505) (77) - (262) (1,738) (1,687)
Operating profit (EBIT) (3) 1,640 1,036 31 - (262) 2,442 2,644
EBIT margin 49% 50% 15% 43% 46%
Financial income 375 126 87 0 (121) (375) 93 117
Borrow ing expenses (25) (643) (188) (123) 121 - (858) (662)
Portion of income (expenses) from equity investments valued w ith the equity method - 133 (2) 3 - 11 146 136
Taxes for the period 6 (395) (305) 18 - 83 (594) (415)
Profit from discontinued operations - - - - - - - 7
Net income from sectors 354 861 628 (71) - (543) 1, 229 1,827
(1) Riclassification pursuant to IFRIC 12 “ Service Concession Arrangements” .
31/12/2016

2016 CONSOLIDATED FINANCIAL STATEMENTS •
117
IX - GUARANTEES AND COMMITMENTS
Guarantees and commitments, amounting to €5.2 million in total at 31 December 2016 (€4.3 million at 31 December 2015) relate to the Gas sector and consisted of the following:
Guarantees and commitments: breakdown
IX.1 GUARANTEES
Guarantees pledged, amounting to € 219 million, refer to hold-harmless letters issued in favour of third parties and related to guarantees granted to subsidiaries and associates mainly for participation in tenders and concessions relating to the natural gas distribution service.
IX.2 COMMITMENTS
Commitments with suppliers to purchase property, plant and equipment and provide services relating to investments in property, plant and equipment and intangible assets under construction totalled €2,438 million.
Commitments for associates, equal to €776 million, refer to the obligation assumed by SNAM regarding TAP being responsible for the financing of the project according to the equity investment held.
Other commitments refer to minimum future payments related to leasing contracts that cannot be cancelled, of which €6 million refer to payments with maturity falling in the next year and €6 million with maturity falling in the next 5 years.
IX.3 RISKS
Risks related to third-party assets on deposit, equal to €1,786 million relate to approximately 8.4 billion cubic meters of natural gas deposited in the storage plants by customers of the service. The amount is valued based on average cost of the gas stock.
(thousands of euros)
Items/Figures 31/12/2016 31/12/2015
Guarantees pledged 219,105 124,439
Trade guarantees 96,475 124,439
Financial guarantees 69,280 -
Assets held as guarantee for third-party services 53,350 -
Commitments 3,135,849 1,898,604
Commitments for the purchase of goods and services 2,347,588 1,898,604
Commitments for associates 776,000 -
Other 12,261 -
Risks 1,892,115 2,302,085
For third-party assets held for safekeeping 1,785,600 2,209,919
For damages and claims 106,515 92,166
Total 5,247,069 4,325,128

• 2016 ANNUAL REPORT
118
Risks concerning compensation and litigation, equal to €107 million, are related to possible but not probable claims for compensation arising.

2016 CONSOLIDATED FINANCIAL STATEMENTS •
119
ANNEXES
ANNEX 1
List of equity investments

• 2016 ANNUAL REPORT
120
ANNEX 1: LIST OF EQUITY INVESTMENTS
Company name Registered Office Share capital EUR Investor % ho lding
Consolidation method or valuation method
Holding
CDP RETI S.p.A. Roma 161,514 Cassa depositi e prestiti S.p.A. 59.10%
State Grid Europe Limited 35.00%
Cassa Nazionale di Previdenza e Assistenza Forense 2.63%
Others 3.27%
Consolidated entities
ACAM GAS S.p.A. La Spezia 68,090,000 Italgas Reti S.p.A. 100.00% Line by line
AS Gasinfrastruktur Beteiligung GmbH Vienna 35,000 SNAM S.p.A. 40.00% Equity method
ASSET COMPANY 1 S.r.L. San Donato Milanese (MI) 10,000 SNAM S.p.A. 100.00% Cost
ASSET COMPANY 2 S.r.L. San Donato Milanese (MI) 10,000 SNAM S.p.A. 100.00% Cost
CESI S.p.A. Milano 8,550,000 Terna S.p.A. 42.70% Equity method
CGES A.D. Podgorica 155,108,283 Terna S.p.A. 22.09% Equity method
CORESO S.A. Bruxelles 1,000,000 Terna S.p.A. 16.67% Equity method
Difebal S.A. Montevideo 140.000 (2) Terna S.p.A. 100.00% Line by line
ELMED Etudes S.a.r.l. Tunisi 2.700.000 (5) Terna S.p.A. 50.00% Equity method
GasBridge 1 B.V. Rotterdam 66,268,000 SNAM S.p.A. 50.00% Equity method
GasBridge 2 B.V. Rotterdam 66,268,000 SNAM S.p.A. 50.00% Equity method
Gasrule Insurance D.A.C. DUBLINO 20,000,000 SNAM S.p.A. 100.00% Line by line
GNL Italia S.p.A. San Donato Milanese (MI) 17,300,000 SNAM S.p.A. 100.00% Line by line
ITALGAS RETI S.P.A. Torino 252,263,314 Italgas S.p.A. 100.00% Line by line
ITALGAS S.P.A. Milano 1,001,231,518 CDP RETI S.p.A. 25.08% Line by line
SNAM S.p.A. 13.50% Line by line
Metano S.Angelo Lodigiano S.p.A. Sant'Angelo Lodigiano 200,000 Italgas Reti S.p.A. 50.00% Equity method
Monita Interconnector S.r.l. Roma 10,000 Terna S.p.A. 95.00% Line by line
Terna Rete Italia S.p.A. 5.00% Line by line
Napoletanagas S.p.A. Napoli 15,400,000 Italgas Reti S.p.A. 99.69% Line by line
Piemonte Savoia S.r.l. Roma 10,000 Terna Interconnector S.r.l. 100.00% Line by line
Rete S.r.l. Roma 387,267,082 Terna S.p.A. 100.00% Line by line
SNAM RETE GAS S.p.A. San Donato Milanese 1,200,000,000 SNAM S.p.A. 100.00% Line by line
SNAM S.p.A. San Donato Milanese (MI) 2,735,670,476 CDP RETI S.p.A. 28.98% Line by line
Stogit S.p.A. San Donato Milanese (MI) 152,205,500 SNAM S.p.A. 100.00% Line by line
T.E.S. TRANSFORMER ELECTRO SERVICE S.r.l. Ospitaletto (BS) 1,134,000 Tamini Trasformatori S.r.l. 100.00% Line by line
Tamini Transformers USA L.L.C. Chicago 42.904 (4) Tamini Trasformatori S.r.l. 100.00% Line by line
Tamini Trasformatori S.r.l. Melegnano (MI) 3,000,000 Terna Plus S.r.l. 70.00% Line by line
Terna Chile S.p.A. Santiago del Cile 1.000.000 (3) Terna Plus S.r.l. 100.00% Line by line
TERNA Crna Gora d.o.o. Podgorica 56,000,000 Terna S.p.A. 100.00% Line by line
Terna Interconnector S.r.l. Roma 10,000 Terna S.p.A. 65.00% Line by line
TERNA RETE ITALIA S.p.A. 5.00% Line by line
TERNA PLUS S.r.l. Roma 16,050,000 Terna S.p.A. 100.00% Line by line
TERNA RETE ITALIA S.p.A. Roma 120,000 Terna S.p.A. 100.00% Line by line
TERNA RETE ITALIA S.r.l. (ex TELAT) Roma 243,577,554 Terna S.p.A. 100.00% Line by line
Terna S.p.A. Roma 442,198,240 CDP RETI S.p.A. 29.85% Line by line
Terna Storage S.r.l. Roma 10,000 Terna S.p.A. 100.00% Line by line
Tes Transformer Electro Service Asia Private Limited Magarpatta City, Hadapsar, Pune 100.000 (6) T.E.S. TRANSFORMER ELECTRO SERVICE S.r.l. 100.00% Line by line
TIGF Holding S.A.S. Pau 505,869,374 SNAM S.p.A. 40.50% Equity method
Toscana Energia S.p.A. Firenze 146,214,387 Italgas Reti S.p.A. 48.08% Equity method
Trans Adriatic Pipeline AG Baar 553,510,000 SNAM S.p.A. 20.00% Equity method
Trans Austria Gasleitung GmbH (1) Vienna 76,566.31 SNAM S.p.A. 84.47% Equity method
Umbria Distribuzione GAS S.p.A. Terni 2,120,000 Italgas Reti S.p.A. 45.00% Equity method
V.T.D. Trasformatori S.r.l. Valdagno (VI) 774,000 Tamini Trasformatori S.r.l. 100.00% Line by line
(1) The percentage of financial rights is equal to 89,22%
(2) Currency: UYU
(3) Currency: CLP
(4) Currency: USD
(5) Currency: TND
(6) Currency: INR

2016 CONSOLIDATED FINANCIAL STATEMENTS •
121
REPORT OF THE INDEPENDENT AUDITORS

• 2016 ANNUAL REPORT
122

2016 CONSOLIDATED FINANCIAL STATEMENTS •
123
CERTIFICATION OF THE CONSOLIDATED FINANCIAL STATEME NTS PURSUANT TO ARTICLE 154 – BIS OF LEGISLATIVE DECREE NO. 58/1998
1. The undersigned Leone Pattofatto, in his capacity as Chief Executive Officer, and Alessandro Uggias, in his capacity as the manager responsible for the preparation of the financial reports of CDP RETI S.p.A., hereby certify, taking account of the provisions of Article 154-bis.3 and 4, of Legislative Decree 58 of 24 February 1998:
• the appropriateness with respect to the characteristics of the company and • the effective adoption
of the administrative and accounting procedures for the preparation of the consolidated financial statements in 2016.
2. The assessment of the appropriateness of the administrative and accounting procedures followed in preparing the consolidated financial statements at 31 December 2016 was based on a process developed by CDP RETI S.p.A. in line with the Internal Control – Integrated Framework issued by the Committee of Sponsoring Organisations of the Treadway Commission, which is a generally accepted framework at the international level;
3. In addition, we certify that:
3.1 the consolidated financial statements at 31 December 2016:
a. have been prepared in compliance with the international accounting standards adopted in the European Union pursuant to Regulation (EC) no. 1606/2002 of the European Parliament and of the Council of 19 July 2002;
b. correspond to the information in the books and other accounting records; c. provide a true and fair representation of the performance and financial position of the issuer and the companies
included in the scope of consolidation;
3.2 the report on operations contains a reliable analysis of operations and performance, as well as the situation of the issuer and the companies included in the scope of consolidation, together with a description of the main risks and uncertainties to which they are exposed.
Rome, 18 April 2017
Chief Executive Officer Financial Reporting Manager
/signature/Leone Pattofatto /signature/Alessandro Uggias

• 2016 ANNUAL REPORT
124

REPORT ON CDP RETI S.P.A. OPERATIONS •
125
3. Report on CDP RETI S.p.A. operations

• 2016 ANNUAL REPORT
126
1. CDP RETI S.P.A. OPERATIONAL PERFORMANCE
1.1 FINANCIAL HIGHLIGHTS
Financial Higlights
Key financial figures
Items 31/12/2016 31/12/2015
Dividends (thousands of euros) 374,883 373,623
- of w hich SNAM (thousands of euros) 253,623 253,623
- of w hich TERNA (thousands of euros) 121,260 120,000
- of w hich ITALGAS (1) (thousands of euros) - n/a
Pofit (loss) on operations (thousands of euros) (27,525) (27,986)
Net income (loss) (thousands of euros) 353,694 358,327
Key balance sheet and cash flow figures
Items 31/12/2016 31/12/2015
Equity investment in SNAM (thousands of euros) 2,930,946 3,520,230
Equity investment in TERNA (thousands of euros) 1,315,200 1,315,200
Equity investment in ITALGAS (1) (thousands of euros) 589,284 n/a
Equity (thousands of euros) 3,438,142 3,701,129
Net financial debt (thousands of euros) (1,394,721) (1,130,960)
Other key figures and ratios
Items 31/12/2016 31/12/2015
Net cash flow for the period (thousands of euros) (270,291) 178,975
ROE (%) 10% 10%
Net financial debt/Equity (numbers) 0.41 0.31
Net financial debt/Dividends (numbers) 4 3
(1) Company established on 1 June 2016 and previously called ITG Holding S.p.A. (as of 7 November 2016 renamed Italgas S.p.A.)

REPORT ON CDP RETI S.P.A. OPERATIONS •
127
1.2 INCOME PERFORMANCE
To facilitate the reading of the income statement, in view of the fact that CDP RETI S.p.A. is an investment vehicle, the following reclassified income statement has been prepared, which “inverts the order of the income statement items pursuant to Legislative Decree 127/1991, presenting first those which relate to the financial operations, as this is the most significant component of income for those companies” (see Consob Communication 94001437 of 23 February 1994).
CDP RETI S.p.A.’s income in the 2016 compared with the previous year are summarized in the operational income statement shown below.
The main component of CDP RETI's income is related to dividends distributed by SNAM and TERNA, in slight increase compared to 2015 (€375 million vs €374 million) for the higher contribution of TERNA. In this regard during the period €254 million was received by SNAM (2015 dividend) and €121 million by TERNA (€78 2015 final dividend and €43 2016 interim dividend).
Among the expense items, financial expenses stood at €25 million, relating mainly to interest expense on Term Loan (€11 million also taking account of the settlement of interest related to the Swap Transaction) and the Bond (€14 million). The item compared to the comparison period was due by the debt renegotiation (May 2015), as the elimination of interest on the Bridge to Bond43 and the reduction of interest on the Term Loan were more than outweighed by the payments due on the bond and those connected to the derivative (negotiation in May 2015 with parent Cdp) on the Term Loan. Finally, the drop compared to the first half of 2015 was also affected by lower interest income due to the fall in the base rate/lower balance on the irregular deposit44 held with the parent Cdp.
Administrative expenses (equal to €3 million) essentially affected by staff costs (approx. 0.7 million) and for the remaining part mainly by fees paid to the parent company/third party suppliers for services received during the period, show an improvement on the same period of the last year which was driven in large part by commissions (amendment fees) paid to lenders (banks and CDP) for the loan restructuring in May 2015.
Lastly, tax income positive for €6 million, mainly incorporates the income from tax consolidation connected with the Aid to Economic Growth (ACE) tax incentive (€7 million) and the remuneration (€1 million) of the interest expenses transferred to the tax consolidation, reduced in part by the effects (€2 million) of the redetermination of the tax burden for the previous years following the work’s results with Revenue Agency to determine how and to what extent ACE (growth incentive) tax deductions may be applied.
The above components led CDP RETI to end the year 2016 with net income of €354 million, in slight reduction (approx. -1%) on the same period of 2015 (€358 million) mainly due to the smaller contribution of tax management (as mentioned €6 million vs €13 million). In this regard, the balance for 2015 benefited mainly from the revision of the taxes estimated at the closure of the accounts as at 31 December 2014 due to the positive response from the Italian Revenue Agency to the request for tax ruling submitted by the Company.
43 Bullet loan of €1 billion, taken out on 29 September 2014 and settled in May 2015 (original maturity date: 29 September 2015). 44 With regard to the deposit agreement "by which one party (custodian) receives from the other (depositor) movable goods with the obligation to preserve them and to return them in kind" (Art. 1766 of the Italian Civil Code), in the irregular deposit (concerning money or other fungible goods) the custodian is not required to return exactly the same goods, but must return the same amount of the same kind and quality of goods. The custodian, therefore, at the time of delivery, becomes the owner of the goods delivered to the same (Art. 1782 of the Italian Civil Code).
Reclassified Income Statement CDP RETI S.p.A.
(thousands of euros)
Items 31/12/2016 31/12/2015
Dividends 374,883 373,623
Pofit (loss) on core business 374,883 373,623
Financial income and expenses (24,675) (23,859)
Administrative expenses (2,850) (4,127)
Pofit (loss) on operations (27,525) (27,986)
Other revenues and income 24 -
Operating income 347,382 345,637
Income taxes 6,312 12,690
NET INCOME (LOSS) 353,694 358,327
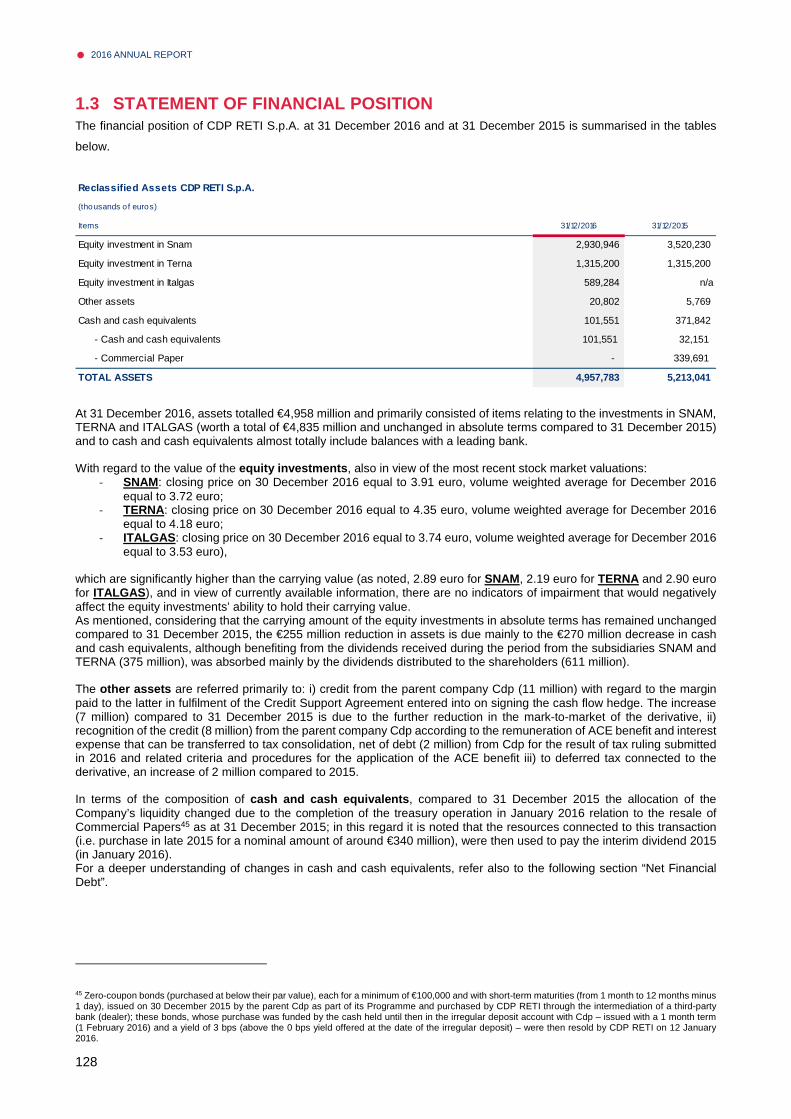
• 2016 ANNUAL REPORT
128
1.3 STATEMENT OF FINANCIAL POSITION The financial position of CDP RETI S.p.A. at 31 December 2016 and at 31 December 2015 is summarised in the tables
below.
At 31 December 2016, assets totalled €4,958 million and primarily consisted of items relating to the investments in SNAM, TERNA and ITALGAS (worth a total of €4,835 million and unchanged in absolute terms compared to 31 December 2015) and to cash and cash equivalents almost totally include balances with a leading bank. With regard to the value of the equity investments , also in view of the most recent stock market valuations:
- SNAM: closing price on 30 December 2016 equal to 3.91 euro, volume weighted average for December 2016 equal to 3.72 euro;
- TERNA: closing price on 30 December 2016 equal to 4.35 euro, volume weighted average for December 2016 equal to 4.18 euro;
- ITALGAS : closing price on 30 December 2016 equal to 3.74 euro, volume weighted average for December 2016 equal to 3.53 euro),
which are significantly higher than the carrying value (as noted, 2.89 euro for SNAM, 2.19 euro for TERNA and 2.90 euro for ITALGAS ), and in view of currently available information, there are no indicators of impairment that would negatively affect the equity investments’ ability to hold their carrying value. As mentioned, considering that the carrying amount of the equity investments in absolute terms has remained unchanged compared to 31 December 2015, the €255 million reduction in assets is due mainly to the €270 million decrease in cash and cash equivalents, although benefiting from the dividends received during the period from the subsidiaries SNAM and TERNA (375 million), was absorbed mainly by the dividends distributed to the shareholders (611 million). The other assets are referred primarily to: i) credit from the parent company Cdp (11 million) with regard to the margin paid to the latter in fulfilment of the Credit Support Agreement entered into on signing the cash flow hedge. The increase (7 million) compared to 31 December 2015 is due to the further reduction in the mark-to-market of the derivative, ii) recognition of the credit (8 million) from the parent company Cdp according to the remuneration of ACE benefit and interest expense that can be transferred to tax consolidation, net of debt (2 million) from Cdp for the result of tax ruling submitted in 2016 and related criteria and procedures for the application of the ACE benefit iii) to deferred tax connected to the derivative, an increase of 2 million compared to 2015. In terms of the composition of cash and cash equivalents , compared to 31 December 2015 the allocation of the Company’s liquidity changed due to the completion of the treasury operation in January 2016 relation to the resale of Commercial Papers45 as at 31 December 2015; in this regard it is noted that the resources connected to this transaction (i.e. purchase in late 2015 for a nominal amount of around €340 million), were then used to pay the interim dividend 2015 (in January 2016). For a deeper understanding of changes in cash and cash equivalents, refer also to the following section “Net Financial Debt”.
45 Zero-coupon bonds (purchased at below their par value), each for a minimum of €100,000 and with short-term maturities (from 1 month to 12 months minus 1 day), issued on 30 December 2015 by the parent Cdp as part of its Programme and purchased by CDP RETI through the intermediation of a third-party bank (dealer); these bonds, whose purchase was funded by the cash held until then in the irregular deposit account with Cdp – issued with a 1 month term (1 February 2016) and a yield of 3 bps (above the 0 bps yield offered at the date of the irregular deposit) – were then resold by CDP RETI on 12 January 2016.
Reclassified Assets CDP RETI S.p.A.
(thousands of euros)
Items 31/12/2016 31/12/2015
Equity investment in Snam 2,930,946 3,520,230
Equity investment in Terna 1,315,200 1,315,200
Equity investment in Italgas 589,284 n/a
Other assets 20,802 5,769
Cash and cash equivalents 101,551 371,842
- Cash and cash equivalents 101,551 32,151
- Commercial Paper - 339,691
TOTAL ASSETS 4,957,783 5,213,041

REPORT ON CDP RETI S.P.A. OPERATIONS •
129
At 31 December 2016, equity (equal to €3,438 million) mainly includes: i) the share premium reserve deriving from the transfer of TERNA (approx. €1.3 billion); ii) the value of the contribution by Cdp, to the Reserve for shareholder payments for investments , of approximately €3.5 billion to finance the acquisition of the investment in SNAM, net of the portion of that reserve distributed to Cdp during the year 2014 (approx. €1.5 billion); iii) the valuation reserve (negative at -€8 million) representing the effective hedge component of the swap valued at fair value, net of the respective deferred taxation. This derivative contract was designed to hedge the variable cash flows relating to the Term Loan, essentially enabling the conversion of the cost of the loan from the original variable rate to a fixed cost; iv) the interim dividend 2016 equal to €253 million paid in November 2016 and v) the net income for the period of approximately €354 million. Compared to the figure at the end of 2015 (€3,701 million) the item includes the dividends distributed to shareholders (€611 million) and the reduction (€5 million) of the Valuation Reserve, only partly offset by income for the year (€354 million). Loans at 31 December 2016, almost in line with the compared period46, totaled €1,507 million (taking account also of interest payments arising after 31 December 2016) are composed as follows:
For a deeper understanding of Total Loans, refer also to the following section “Net Financial Debt”. The other liabilities at 31 December 2016 refer mainly to Interest Rate Swap (IRS) derivative (16 million) as noted, there was a fall in the mark-to-market, consequently resulting in higher liabilities (from 4 to 12).Residually, the item was also affected by payables to the parent Cdp for services performed by the latter’s departments, as well as payables to external suppliers, revenue authorities and Company Bodies and Officers.
46 The marginal increase of the bond is due to the recognition of the same in the balance sheet at amortized cost.
Reclassified Equity abd Liabilities CDP RETI S.p.A.
(thousands of euros)
Items 31/12/2016 31/12/2015
Equity 3,438,142 3,701,129
- Share capital and reserves 3,084,448 3,342,802
- Net income for the period 353,694 358,327
Loans 1,507,262 1,507,132
- of which owed to Cdp 678,268 678,210
Other liabilities 12,379 4,780
- of which owed to Cdp 11,969 4,408
TOTAL LIABILITIES 4,957,783 5,213,041
Loan
(thousands o f euros)
Items Non current current Non current current
Bond 748,270 8,322 747,971 8,299
Term Loan Facility 750,000 671 750,000 862
Total 1,498,270 8,993 1,497,971 9,161
31/12/2016 31/12/2015

• 2016 ANNUAL REPORT
130
1.4 NET FINANCIAL DEBT
The net financial position at 31 December 2016 of CDP RETI S.p.A., prepared in accordance with ESMA47/2015/1415 Guidelines on Alternative Performance Measures applicable from 3 July 2016, compared with the end of 2015, is composed as follows:
The liquidity at 31 December 2016 almost totally include the amounts deposited with a leading bank (120 million), whilst current financial receivables refer to the amounts deposited with the Parent Company Cdp as security for the derivative contract. Short-term financial payables refer to interests on the Bond (approx. 8 million) and, on a residual basis for the Term Loan, both of them payable in May 2017. Long-term financial payables refer to the Term Loan (750 million) granted by a pool of banks and by the parent company Cdp and the Bond (748 million, equal to a par value of 750 million, minus associated costs that are amortised over the entire term of the Bond), subscribed by institutional investors (412 million) and by the parent company (338 million). Taking account that short-term and long-term financial liabilities were substantially the same with the compared period, Net financial debt improved an increase during 2016 around €264 million, mainly attributable to reduction in the liquidity, only partially offset by the increase in current financial receivable (+€7 million)48. With specific reference to the change (approx. -€270 million) in cash, the year was affected by:
� outgoing cash flow mainly connected to i) the distribution of the 2015 dividend (€323 million as interim dividend49 and €35 million as final dividend) and 2016 interim dividend (€323 million) 50, ii) interest expense on Term Loan (11 million) and on the Bond (14 million), iii) the settlement of the margins paid to the parent Cdp in accordance with the guarantee contract related to the hedging derivative (€7 million), and iv) other disbursements connected to core operations;
47 European Securities and Market Authority. 48 The cash flow for the period is due for settlement of the margins paid to the parent Cdp in accordance with the guarantee contract signed at the same time as the hedging derivative. 49 The interim dividend of €1,999.73 per share (for each of the 161,514 shares) was approved based on the accounting situation of the company as at 30 September 2015 - prepared in accordance with the IFRS standards - which closed the period with net income of approx. €323 million and available reserves of approx. €3,345 million. 50 The interim dividend of 1.566,43 per share (for each of the 161,514 shares) was approved based on the accounting situation of the company as at 30 June 2016 - prepared in accordance with the IFRS standards - which closed the period with net income of approx. €320 million and available reserves of approx. €3,345 million.
Financial Indebtness
(thousands o f euros)
Items 31/12/2016 31/12/2015
A. Irregular deposit w ith CdP (1) 1 26
B. Other cash w ith banks (1) 101,550 32,125
C. Commercial Paper (1) - 339,691
D. Liquidity (A) + (B) + (C) 101,551 371,842
E. Current Financial Receivable (2) 10,990 4,330
F. Current banks portion debt of non current debt (3) (369) (474)
G. Current CdP portion debt of non current debt (3) (302) (388)
H. Current Bond issued portion (3) (8,322) (8,299)
I. Current Financial Debt (F) + (G) + (H) (8,992) (9,161)
L Net Current Financial Indebtedness (D) + (E) + (I) 103,548 367,011
M. Non current banks loans (4) (412,500) (412,500)
N. Non current CdP loans (4) (337,500) (337,500)
O. Bond issued (4) (748,270) (747,971)
P. Non current Financial Indebtedness (M) + (N) + (O) (1,498,270) (1,497,971)
Q. Net Financial Indebtedness (L) + (P) (1,394,721) (1,130,960)
In the balance sheet o f CDP RETI S.p.A.:
(1) The balance is included in the item “ Cash and cash equivalents”
(2) The balance is included in the item “ Current financial assets”
(3) The balance is included in the item “ Current liabilities”
(4) The balance is included in the item “ Non-current liabilities”

REPORT ON CDP RETI S.P.A. OPERATIONS •
131
� incoming cash flow of about €375 million from dividends received from SNAM (€254 million) and TERNA (€121 million).
The Net Financial Debt/Net Equity ratio (so-called "leverage"), compared with 2015, amounted to 0.41 (0.31 at the end of 2015) mainly following the reduction in the liquidity. Finally, this reduction affects also the Net Financial Debt/Dividend ratio (representative of the profit (loss) on core business of the Company) which changes from 3 to 4.

• 2016 ANNUAL REPORT
132
2. REPORT ON CORPORATE GOVERNANCE AND OWNERSHIP STRUCTURE OF CDP RETI PURSUANT TO ARTICLE 123-BIS.2 B) OF THE CONSOLIDATED LAW ON FINANCIAL INTERMEDIATION (TUF)
With reference to the "Report on corporate governance and ownership structure: main features of the risk management systems and internal control existing in relation to the financial reporting process, including consolidated, pursuant to Article 123-bis, paragraph 2, letter b) of T.U.F. ", it is possible to refer to what is already stated in the paragraph 9 of the Report on operation of the consolidated financial statements, also applicable to the separate financial statements of CDP RETI S.p.A..
2016 FINANCIAL STATEMENTS •
133
4. 2016 Financial Statements

• 2016 ANNUAL REPORT
134
FORM AND CONTENT OF THE FINANCIAL STATEMENTS AT 31 DECEMBER 2016
The financial statements at 31 December 2016 have been prepared in accordance with applicable regulations and consist of:
• the Balance sheet; • the Income statement; • the Statement of comprehensive income; • the Statement of changes in equity; • the Cash flow statement; • the Notes to the financial statements
The Notes consist of the following:
• Introduction • I - Basis of presentation and accounting policies • II - Information on the Balance sheet • III - Information on the Income statement • IV - Information on risks and related hedging policies • V - Transactions with related parties • VI – Non-recurring events and significant transactions • VI - Segment reporting
The section "Annexes", which is an integral part of the financial statements, includes the analytical list of equity investments owned by CDP RETI and the separate financial statements at 31 December 2015 of the parent company Cassa depositi e prestiti S.p.A.

2016 FINANCIAL STATEMENTS •
135
FINANCIAL STATEMENTS AT 31 DECEMBER 2016
BALANCE SHEET ASSETS
(euros)
Assets Notes 31/12/2016 31/12/2015
Non-current assets
Property, plant and equipment
Investment property
Intangible assets
Equity investments I.1.1. 4,835,430,112 4,835,430,115
Non-current f inancial assets
Deferred tax assets I.1.2. 3,307,783 1,261,093
Other non-current assets
Total non-current assets 4,838,737,895 4,836,691,208
Current assets
Loans to investees
Current financial assets I.2.1. 10,990,000 4,330,000
Tax receivables I.2.2. 111,404 109,566
Other current assets I.2.3. 6,392,831 67,781
Cash and cash equivalents I.2.4. 101,550,915 371,842,079
Total current assets 119,045,150 376,349,426
Total assets 4,957,783,045 5,213,040,634

• 2016 ANNUAL REPORT
136
BALANCE SHEET LIABILITIES
(euros)
Liabilities and equity Notes 31/12/2016 31/12/2015
Equity
Share capital II.1.1. 161,514 161,514
Reserves II.1.2. 3,345,110,811 3,345,110,811
Valuation reserves II.1.3. (7,824,146) (2,470,398)
Retained earnings 256
Advances on dividends II.1.4. (253,000,375)
Net income for the period (+/-) 353,693,950 358,327,140
Total Equity 3,438,142,010 3,701,129,067
Non-current liabilities
Provisions
Staff severance pay II.2.1. 10,342 3,920
Loans II.2.2. 1,498,269,605 1,497,971,287
Other financial liabilities II.2.3. 11,588,485 4,024,143
Deferred tax liabilities
Other non-current liabilities
Total non-current liabilities 1,509,868,432 1,501,999,350
Current liabilities
Current portion of loans II.3.1. 8,992,438 9,161,055
Tax payables II.3.2. 95,288 9,495
Other current liabilities II.3.3. 684,876 741,667
- Trade payables 137,910 189,107
- Payables to parent companies 380,482 383,756
- Payables due to pension and social security institutions 20,159 15,977
- Other payables 146,325 152,827
Total current liabilities 9,772,602 9,912,217
Total liabilities and equity 4,957,783,045 5,213,040,634

2016 FINANCIAL STATEMENTS •
137
INCOME STATEMENT
(euros)
Income statement items Notes 31/12/2016 31/12/2015
Revenues
Dividends III.1.1. 374,882,872 373,622,872
Capital gains on equity investments
Increases in the value of f inancial instruments
Total revenues 374,882,872 373,622,872
Costs
Capital expenditure
Capital losses on equity investments
Decreases in the value of f inancial instruments
Total costs
Profit (loss) on operations 374,882,872 373,622,872
Financial income III.2.1. 49,494 205,974
Borrow ing expenses III.2.2. (24,724,422) (24,064,506)
Administrative expenses: III.2.3. (2,850,223) (4,127,139)
a) staff costs (674,217) (385,481)
b) other administrative expenses (2,176,006) (3,741,658)
Amortisation, depreciation and impairment of non-current assets
Impairment of current assets
Profit (loss) on operations (27,525,151) (27,985,671)
Other operating income (costs)
Other income III.3.1. 24,404 1
Other cost
Income before taxes 347,382,125 345,637,202
Income taxes, current and deferred taxes III.4.1. 6,311,825 12,689,938
NET INCOME FOR THE YEAR 353,693,950 358,327,140

• 2016 ANNUAL REPORT
138
STATEMENT OF COMPREHENSIVE INCOME
(euros) Notes 31/12/2016 31/12/2015
Income (loss) for the period 353,693,950 358,327,140
Other comprehensive income net of taxes not transfe rred to income statement
Property, plant and equipment
Defined benefit plans
Other comprehensive income net of taxes transferred to income statement
Financial assets available for sale
Cash f low hedges II.1.3. (5,353,748) (2,470,398)
Total other comprehensive income net of taxes (5,353,748) (2,470,398)
COMPREHENSIVE INCOME 348,340,202 355,856,742

2016 FINANCIAL STATEMENTS •
139
STATEMENT OF CHANGES IN EQUITY: CURRENT YEAR
(euros) NotesReserves
Dividends and o ther allocations
Changes in reserves
Issues o f new shares
Purchase of own shares
Advances on dividends
Special dividend distribution
Changes in equity instruments
Stock options
Share capital:
shares subscribed II.1.1. 161,514 161,514 161,514
Share premium reserve II.1.2. 1,315,158,486 1,315,158,486 1,315,158,486
Reserves: II.1.2. -
a) income 32,303 32,303 256 32,559
b) other 2,029,920,022 2,029,920,022 2,029,920,022
Valuation reserves: II.1.3. -
a) available for sale -
b) cash flow hedges (2,470,398) (2,470,398) (5,353,748) (7,824,146)
c) other reserves -
Equity instruments -
Advances on dividends II.1.4. (253,000,375) (253,000,375)
Treasury shares -
Net income (loss) for the year 358,327,140 358,327,140 (256) (358,326,884) 353,693,950 353,693,950
Equity 3,701,129,067 3,701,129,067 - (358,326,884) - - - (253,000,375) - - - 348,340,202 3,438,142,010
Changes fo r the period
Equity at 31/12/2016
Equity transactions
Comprehensive income fo r 2016
Balance at 31/12/2015
Change in re-opening balances
Balance at 01/01/2016
Allocation o f net income for previous year

• 2016 ANNUAL REPORT
140
STATEMENT OF CHANGES IN EQUITY: PREVIOUS YEAR
(euros)Reserves
Dividends and o ther allocations
Changes in reserves
Issues of new shares
Purchase of own shares
Advances on dividends
Special dividend distribution
Changes in equity instruments
Stock options
Share capital:
shares subscribed 161,514 161,514 161,514
Share premium reserve 1,315,158,486 1,315,158,486 1,315,158,486
Reserves:
a) income 32,303 32,303 32,303
b) other 2,029,920,022 2,029,920,022 2,029,920,022
Valuation reserves:
a) available for sale -
b) cash flow hedges (2,470,398) (2,470,398)
c) other reserves -
Equity instruments -
Advances on dividends
Treasury shares -
Net income (loss) for the year 189,097,115 189,097,115 (189,097,115) 358,327,140 358,327,140
Equity 3,534,369,440 3,534,369,440 - (189,097,115) - - - - - - - 355,856,742 3,701,129,067
Changes fo r the period
Equity at 31/12/2015
Equity transactionsComprehensive income fo r 2015
Balance at 31/12/2014
Change in re-opening balances
Balance at 01/01/2015
A llocation o f net income for previous year

2016 FINANCIAL STATEMENTS •
141
CASH FLOW STATEMENT
(euros) Notes 31/12/2016 31/12/2015
Net income 353,693,950 358,327,140
Adjustments to net income to reflect cash f low from operating activities:
Amortisation and depreciation
Net w ritedow ns (revaluations) of property, plant and equipment and intangible assets
Effect of accounting using the equity method
Net losses (gains) on disposals, cancellations and eliminations of assets
Dividends III.1.1. (374,882,872) (373,622,872)
Interest income III.2.1. (49,494) (205,974)
Interest expense III.2.2. 24,724,422 24,064,506
Income taxes III.4.1. (6,311,825) (12,689,938)
Changes in working capital:
- Inventories
- Trade receivables
- Trade payables (57,785) 451,232
- Provisions
- Current f inancial assets I.2.1. (6,660,000) (4,330,000)
- Other assets and liabilities 86,067 71,999
Cash flow from working capital (6,631,717) (3,806,768)
Change in provisions for employee benefits 6,422 3,920
Dividends received 374,882,872 373,622,872
Interest received 49,494 205,974
Interest paid (24,445,158) (19,219,955)
Income taxes paid net of tax credits reimbursed / income from participation in the tax consolidation mechanism
- 21,393,290
Cash flow from operating activities 341,036,093 368,072,196
- with related parties V.2. 354,932,685 380,652,003
Investing activities:
- Property, plant and equipment
- Intangible assets
- Companies in the scope of consolidation and business units
- Equity investments 3 -
- Change in payables and receivables relative to investing activities
Cash flow from investing activities 3 -
Divestments:
- Property, plant and equipment
- Intangible assets
- Equity investments
- Change in payables and receivables relative to divestments
Cash flow from divestments - -
Net cash flow from investing activities 3 -
- with related parties - -
Assumption of long-term f inancial debt
Repayments of long-term f inancial debt
Increase (decrease) in short-term financial debt
Net equity capital injections
Dividends distributed to shareholders (611,327,259) (189,097,115)
Net cash flow from financing activities (611,327,259) (189,097,115)
- with related parties V.2. (361,306,621) (111,760,172)
Net cash flow for the period (270,291,163) 178,975,080
Cash and cash equivalents at start of year 371,842,079 192,866,999
Cash and cash equivalents at end of year I.2.4. 101,550,915 371,842,079

• 2016 ANNUAL REPORT
142
NOTES TO THE FINANCIAL STATEMENTS
INTRODUCTION ............................................................................................................................................... 144
I – BASIS OF PRESENTATION AND ACCOUNTING POLICIES .......................................................................... 145
I. GENERAL INFORMATION .............................. ....................................................................................................... 145
Declaration of compliance with International Accoun ting Standards ..................................... ............................ 145
Basis of presentation ............................. .................................................................................................................. 145
Events subsequent to the reporting date ............ ................................................................................................... 146
Other issues ...................................... ........................................................................................................................ 146
II. THE MAIN FINANCIAL STATEMENT ITEMS ................. ...................................................................................... 149
Equity investments ................................. .................................................................................................................. 150
Financial assets .................................. ...................................................................................................................... 151
Trade receivables ................................. .................................................................................................................... 153
Current and deferred taxation ..................... ............................................................................................................ 153
Financial liabilities ............................. ....................................................................................................................... 154
Hedging derivatives ............................... ................................................................................................................... 154 Hedging transactions ............................................................................................................................................. 154
Cash and cash equivalents ......................... ............................................................................................................. 155
Other information ................................. .................................................................................................................... 155 Interest income and expense ................................................................................................................................. 155 Dividends ............................................................................................................................................................... 155 Transactions with related parties ............................................................................................................................ 155 Methods for determining fair value measurement criteria....................................................................................... 155
II - INFORMATION ON THE BALANCE SHEET .................................................................................................. 157
I. ASSETS .................................................................................................................................................................. 157
I.1. Non-current assets ........................... .................................................................................................................. 157 I.1.1. Equity investments ........................................................................................................................................ 157 I.1.2. Deferred tax assets ....................................................................................................................................... 158
I.2. Current assets ............................... ...................................................................................................................... 160 I.2.1. Current financial assets ................................................................................................................................. 160 I.2.2. Tax receivables ............................................................................................................................................. 160 I.2.3. Other current assets ...................................................................................................................................... 160 I.2.4. Cash and cash equivalents ........................................................................................................................... 161
II. LIABILITIES .................................... ....................................................................................................................... 162
II.1. Equity ....................................... ........................................................................................................................... 162 II.1.1. Share capital ................................................................................................................................................ 162 II.1.2. Reserves ...................................................................................................................................................... 162 II.1.3. Valuation reserves........................................................................................................................................ 163
II.2. Non-current liabilities ..................... ................................................................................................................... 163 II.2.1. Staff severance pay ...................................................................................................................................... 163 II.2.2. Loans ........................................................................................................................................................... 164 II.2.3. Other financial liabilities ................................................................................................................................ 164
II.3. Current liabilities ......................... ...................................................................................................................... 165 II.3.1. Current loans ................................................................................................................................................ 165 II.3.2. Tax payables ................................................................................................................................................ 165

2016 FINANCIAL STATEMENTS •
143
II.3.3. Other current liabilities .................................................................................................................................. 165
II.4. Reporting on financial instruments for IFRS pu rposes............................................. ..................................... 167
II.5. Other information ........................... ................................................................................................................... 168
III - INFORMATION ON THE INCOME STATEMENT ........................................................................................... 169
III.1. Profit (loss) on core business .............. ........................................................................................................... 169
III.1.1. Dividends................................. ....................................................................................................................... 169
III.2. Profit (loss) on operations ................. .............................................................................................................. 169
III.2.1. Financial income ......................... ................................................................................................................... 169
III.2.2. Borrowing expenses ....................... .............................................................................................................. 170
III.2.3. Administrative expenses................... ............................................................................................................ 170 Staff costs .............................................................................................................................................................. 170 Other administrative expenses ............................................................................................................................... 171
III.3. Other operating income (costs) ............. .......................................................................................................... 171
III.3.1 Other income .............................. ..................................................................................................................... 171
III.4. Income taxes, current and deferred taxes ... ................................................................................................... 172
III.4.1 Income taxes, current and deferred taxes .. .................................................................................................. 172
IV – INFORMATION ON RISKS AND RELATED HEDGING POLICIES ................................................................. 174
IV.1. Market risk .................................. ...................................................................................................................... 174
IV.2. Risk related to the financial performance and operating results of SNAM, TERNA and ITALGAS ........ ... 174
IV.3. Risk related to the limits in the transfer of financial resources from SNAM, TERNA and ITALGAS .... .... 174
IV.4. Liquidity and credit risk .................... ............................................................................................................... 175
IV.5. Default risk and debt covenants .............. ....................................................................................................... 175
V – TRANSACTIONS WITH RELATED PARTIES ................................................................................................ 177
V.1. Information on the remuneration of key manageme nt personnel ...................................... ........................... 177
V.2. Information on transactions with related partie s ........................................................................................... 178
V.3. Key data of the company performing management a nd coordination ................................... ...................... 179
VI – NON-RECURRING EVENTS AND SIGNIFICANT TRANSACTIONS ............................................................... 180
VII – SEGMENT REPORTING ............................................................................................................................ 181
PROPOSED ALLOCATION OF 2016 NET INCOME ............................................................................................ 182
ANNEXES ........................................................................................................................................................ 183
Annex 1 ........................................... ........................................................................................................................... 184
Annex 2 ........................................... ........................................................................................................................... 185
REPORT OF THE BOARD OF AUDITORS ......................................................................................................... 189
REPORT OF THE INDEPENDENT AUDITORS ................................................................................................... 196
CERTIFICATION OF THE SEPARATE FINANCIAL STATEMENTS PURSUANT TO ART. 154 BIS OF LEGISLATIVE DECREE 58/1998 .............................................................................................................................................. 198

• 2016 ANNUAL REPORT
144
INTRODUCTION
Structure and content of the financial statements
The financial statements of CDP RETI have been prepared based on the IFRS international accounting standards.
With Regulation (EC) 1606/2002 of 19 July 2002, the European Union made it compulsory, as of the 2006 financial year, for EU companies that issue equity or debt securities on a regulated market in the European Union to adopt IFRS in preparing their financial statements.
Italian Legislative Decree 38 of 28 February 2005 was then issued in order to govern the application of:
• the International Financial Reporting Standards (IFRS) issued by the International Accounting Standards Board (IASB);
• the International Accounting Standards (IAS) issued by the International Accounting Standards Committee (IASC);
as well as the Implementation Guidance and Basis for Conclusions adopted by the International Financial Reporting Interpretations Committee (IFRIC, formerly the Standing Interpretations Committee, or SIC) and by the IASB.
The financial statements include the Balance sheet, the Income statement, the Statement of comprehensive income, the Statement of changes in equity, the Cash flow statement and these Notes to the financial statements, and are accompanied by the Directors' report on operations.
The financial statements present a clear, true and fair view of the Company's financial position and performance of operations.
The account balances correspond with the company's accounting records and fully reflect the transactions conducted during the year.
All figures in the financial statements and in the tables in the Notes are in euros. In the income statement, revenues are indicated without a sign, while costs are shown in brackets. The rounded amounts for the various items are the sum of the rounded balances of sub-items.
As detailed below, the Notes to the financial statements provide all information required by law and regulations, as well as any additional information deemed necessary in order to provide a true and fair view of the company’s financial position and performance.
Audit of the financial statements
The financial statements of CDP RETI are audited by the independent auditors PricewaterhouseCoopers S.p.A., in compliance with the appointment of this firm to audit the financial statements and accounts for the period 2015-2023 with shareholders' resolution of 24 June 2015.
Management and coordination by CDP S.p.A.
CDP RETI is 59.10% owned by CDP. The Company is managed and coordinated by CDP. Management and coordination is performed in such a way as to avoid infringing European regulations on state aid and, in particular, the principles of Notice no. 2001/C 235/03 of the European Commission on “State aid and risk capital”.

2016 FINANCIAL STATEMENTS •
145
I – BASIS OF PRESENTATION AND ACCOUNTING POLICIES
I. GENERAL INFORMATION
DECLARATION OF COMPLIANCE WITH INTERNATIONAL ACCOUN TING STANDARDS
These financial statements have been prepared in accordance with the International Financial Reporting Standards (IFRS) issued by the International Accounting Standards Board (IASB), as endorsed by the European Commission and in force at 31 December 2016, taking into account also the minimum reporting requirements established by the Italian Civil Code, where compatible with the standards adopted.
The IFRS also include the International Accounting Standards (IAS) and the interpretations issued by the IFRS Interpretation Committee (IFRS IC) and that are still in force, including those previously issued by the International Financial Reporting Interpretations Committee (IFRIC) and, even earlier, by the Standing Interpretations Committee (SIC).
BASIS OF PRESENTATION
The financial statement formats used to prepare the financial statements, which coincide with those used in the Annual Financial Report 2015, are consistent with the provisions of IAS 1 – Presentation of Financial Statements (hereinafter, IAS 1).
In particular:
• the items on the Balance sheet are classified by distinguishing assets and liabilities as “current / non-current”; • the Income statement has been prepared by classifying costs by their nature, insofar as this form of presentation is
deemed the most appropriate for representing the actual situation of the Company, and is consistent with the consolidated practice of firms operating on international markets;
• the Statement of comprehensive income shows income inclusive of the revenues and costs that are recognised directly in equity pursuant to IFRS;
• the Statement of changes in equity presents the total income (loss) for the year, the transactions with shareholders and other changes in equity;
• the Cash flow statement is drafted by using the “indirect” method, adjusting net income for the effects of non-cash transactions.
It is believed that these statements present an adequate view of the Company's financial position and performance of operations.
Reference is made to the section “Transactions with related parties” for information about the net amounts of receivables and payables and transactions with related parties.
The financial statements have been prepared in accordance with the IFRS issued by the IASB (including the SIC and IFRIC interpretations) and endorsed by the European Commission pursuant to Regulation (EC) 1606 of 19 July 2002.
For the purposes of interpretation and to provide support in applying these standards, the following documents have also been considered, although they have not been endorsed by the European Commission:
• the Framework for the Preparation and Presentation of Financial Statements (issued by the International Accounting Standards Board in 2001);
• Implementation Guidance, Basis for Conclusions, IFRIC interpretations, and any other documentation prepared by the IASB or IFRIC to supplement the IFRS;
• Interpretation documents concerning the application of the IFRS in Italy, prepared by the Italian Accounting Board (Organismo Italiano di Contabilità - OIC).
Where the information required by international accounting standards is considered inadequate for providing a true and fair view, the Notes to the financial statements also include additional information for such purpose.
• 2016 ANNUAL REPORT
146
The financial statements have been prepared on an accrual and going-concern basis. The general principles of the materiality and significance of information and the prevalence of substance over form have also been taken into account.
In compliance with IAS 1 Revised, CDP RETI has conducted an assessment of the Company's ability to continue to operate as a going concern, considering all available information over the medium term.
Based on analysis of this information, CDP RETI considers it appropriate to prepare the financial statements on a going-concern basis.
No assets have been offset against liabilities, or revenues against costs, unless expressly required or allowed by accounting standards or a related interpretation.
Use of estimates
The application of international accounting standards in preparing the financial statements requires the company to make estimates for certain balance sheet items that are considered reasonable and realistic on the basis of the information available at the time the estimate is made. Such estimates impact the carrying amount of the assets and liabilities and the disclosures on contingent assets and liabilities as of the reporting date, as well as the amounts reported for revenues and costs for the period under review. Changes in the conditions underlying the judgements, assumptions and estimates used could also have an impact on future results.
The only items estimated at the reporting date relate to current and deferred taxes, the fair value of the interest rate swap hedging derivative and the recoverable amount of equity investments.
The estimates and assumptions used to prepare these financial statements are the same as were used to prepare the annual financial report of CDP RETI as at 31 December 2015.
EVENTS SUBSEQUENT TO THE REPORTING DATE
During the period between the reporting date for the financial statements and their approval by the Board of Directors on 31 March 2017, no events occurred requiring an adjustment to the figures approved or additional reporting.
OTHER ISSUES
New accounting standards applicable to the financia l statements for the year ended 31 December 2016
As required by IAS 8 (Accounting policies, changes in accounting estimates and errors) details are provided below of the new international accounting standards, or amendments to standards already in force, whose application became mandatory from 1 January 2016:
• European Commission Regulation (EU) no. 2016/1703 of 22 September 2016, published in Official Journal L. 257 of 23 September, amending Regulation (EC) no. 1126/2008, adopting certain international accounting standards in accordance with Regulation (EC) no. 1606/2002 of the European Parliament and of the Council as regards International Financial Reporting Standards (IFRS) 10 and 12 and International Accounting Standard (IAS) 28. The main amendments concern: - IFRS 10 – Consolidated Financial Statements: the document aims to restrict the cases for exemption from
presentation of the consolidated financial statements, the prerequisites for determination of an investment entity and the cases of exemptions from consolidation of the investments held by investment entities;
- IFRS 12 – Disclosure of Interests in Other Entities: the amendments mandate the disclosure that has to be given by the investees that prepare financial statements where their subsidiaries are measured in accordance with IFRS 10;
- IAS 28 – Investments in Associates and Joint Ventures: the amendments introduce new guidelines for application of the equity method, by restricting the conditions for exemption from its application.
• European Commission Regulation (EU) no. 2015/2173 of 24 November 2015, published in the Official Journal L. 307 of 25 November, adopting the Amendments to IFRS 11 entitled “Accounting for Acquisitions of Interests in Joint Operations”. The amendments provide guidance on accounting of acquisitions of interests in joint operations that constitute a business.
• European Commission Regulation (EU) no. 2015/2231 of 2 December 2015, published in the Official Journal L. 317 of 3 December, adopting Amendments to IAS 16 – Property, Plant and Equipment and IAS 38 – Intangible Assets. The amendment in question clarifies when a revenue-based depreciation or amortisation method, or one based on a plan that depreciates property, plant and equipment and amortises intangible assets based on the revenue that is generated by an activity that includes their use is appropriate.

2016 FINANCIAL STATEMENTS •
147
• European Commission Regulation (EU) no. 2015/2343 of 15 December 2015, published in the Official Journal L. 330 of 16 December, adopting the IFRS Annual improvements cycle 2012-2014. Its principal amendments affect: - IFRS 5 - Non-current Assets Held for Sale and Discontinued Operations: the amendment introduces specific
guidance on IFRS 5 if an entity reclassifies an asset from the held-for-sale category to the held-for-distribution category (or vice-versa), or when the pre-requisites for classification of an asset as held-for-distribution lapse. The amendments state that: - these reclassifications do not constitute a change to a plan (for sale or distribution) and, therefore, the
classification and measurement criteria remain valid; - the assets that no longer meet the classification criteria envisaged for held-for-distribution should be treated
in the same way as an asset that ceases to be classified as held for sale. - IFRS 7 – Financial Instruments: Disclosures: the amendment governs the introduction of additional guidance to
clarify whether a servicing contract constitutes residual involvement in a transferred asset for the purposes of the disclosure requested in connection with the transferred assets. It also clarifies that the disclosure on offsetting of financial assets and liabilities is not explicitly required for all interim financial statements. However, this disclosure might be necessary to comply with the requirements imposed by IAS 34, when material information is involved.
- IAS 19 – Employee Benefits: the document explains that to determine the discount rate of post-employment benefits, reference has to be made to high quality corporate bonds issued in the same currency used to pay the benefits and that the scope of the reference market has to be defined in terms of foreign currency.
- IAS 34 – Interim Financial Reporting: the document introduces changes to clarify that certain required information has to be given in the interim financial statements or, at least, in other parts of the interim financial report, with the caution of adding cross-references to that other section in the interim financial statements. In this last case, the interim financial report has to be provided to the readers of the financial statements in the same ways and at the same time as the interim financial statements. Otherwise, the latter will have to be considered incomplete.
• European Commission Regulation (EU) no. 2015/2406 of 18 December 2015, published in the Official Journal L. 333 of 19 December, adopting Amendments to IAS 1 – Presentation of Financial Statements: Disclosure initiative. In the broader scope of improving financial statement disclosures, the amendment in question makes several changes to IAS 1 which provide clarification on the elements that may be perceived as impediments to clear and intelligible preparation of the financial statements.
• European Commission Regulation (EU) no. 2015/2441 of 18 December 2015, published in the Official Journal L. 336 of 23 December, adopting Amendments to IAS 27 – Separate Financial Statements: Equity Method in Separate Financial Statements. The amendment in question introduces the possibility of recognising in the investor's separate financial statements those investments in subsidiaries, subsidiaries under joint control or subject to significant influence by using the equity method.
• European Commission Regulation (EU) no. 2015/2113 of 23 November 2015, published in the Official Journal L. 306 of 24 November, adopting Amendments to IAS 16 – Property, Plant and Equipment and IAS 41 – Agriculture: bearer plants. Although this amendment is immaterial for the Company, the change permits application of the same accounting treatment of plants used to grow agricultural products over several years, known as bearer plants, as the method used to account for property, plant and equipment in accordance with IAS 16 – Property, Plant and Equipment.
• Regulation (UE) no. 28/2015 for endorsement: Improvements to the international accounting standards Cycle 2010-2012. The aim of the annual improvements is to address necessary issues related to inconsistencies found in the IFRS Standards or terminological clarifications that are not urgent but have been discussed by the IASB during the project cycle begun in 2011. In certain cases, the amendments represent clarifications or corrections to the standards in question (IFRS 8, IAS 16, IAS 24 and IAS 38), in other cases the amendments entail changes to current provisions or provide additional information on their application (IFRS 2 and 3).
• European Commission Regulation (EU) no. 29/2015 of 17 December 2014, published in the Official Journal L. 5 of 9 January 2015, adopting Amendments to IAS 19 – Defined Benefits Plans: Employee Contributions. The amendment to IAS 19 became necessary to facilitate, when certain conditions are met, the recognition of defined benefit plans that call for contributions by employees or third parties. In the absence of certain conditions, the recognition of these contributions is more complex because they will have to be attributed to the individual periods of the plan by making an actuarial calculation of the related liability.
New accounting standards and interpretations alread y issued and endorsed by the European Union but not yet in force:
Listed below are the new standards and interpretations already issued but not yet in force and therefore not applicable to the preparation of the financial statements at 31 December 2016 (unless, where permitted, it is chosen to adopt them in advance):
• European Commission Regulation (EU) no. 2016/2067 of 22 November 2016, published in Official Journal L. 323 of 29 November 2016, amending Regulation (EC) no. 1126/2008, adopting certain international accounting standards in accordance with Regulation (EC) no. 1606/2002 of the European Parliament and of the Council as regards IFRS 9. The standard aims to improve the financial reporting of financial instruments by addressing concerns that arose in this area during the financial crisis. In particular, IFRS 9 addresses the call to move to a more forward-looking model for the recognition of expected losses on financial assets

• 2016 ANNUAL REPORT
148
• European Commission Regulation (EU) no. 2016/1905 of 22 September 2016, published in Official Journal L. 295 of 29 October 2016, amending Regulation (EC) no. 1126/2008, adopting certain international accounting standards in accordance with Regulation (EC) no. 1606/2002 of the European Parliament and of the Council as regards IFRS 15. This standard aims to improve the financial reporting of revenue and to improve comparability of the top line in financial statements globally.
IFRS 9: Financial Instruments
The endorsement of IFRS 9 by the European Union completes and ends the process to replace IAS 39. This process is divided into three phases, named: “classification and measurement”, “impairment”, and “hedge accounting”. Revision of the rules for macro hedge accounting still has to be completed, for which the IASB has decided to undertake a separate project from IFRS 9.
In extreme summary, the main innovations wrought by the new standard involve:
• the classification and measurement of debt instruments, based on the contextual analysis of the adopted business model and the characteristics of the contractual cash flows generated by the instrument, envisages three accounting categories: financial assets measured at amortised cost, financial assets measured at fair value through profit and loss (“FVTPL”), and financial assets measured at fair value through other comprehensive income “FVOCI”). In contrast with the current IAS 39, the portfolios of available-for-sale financial assets and financial assets held to maturity, and the possibility of separating the embedded derivatives from hybrid contracts for financial assets alone, are eliminated. Instead, the current classification and measurement rules for financial liabilities as given in IAS 39 are confirmed;
• the classification of equity instruments in the FVTPL category, unless the option is exercised to classify the equity instruments not held for trading in the FVOCI category;
• the recognition of “own credit risk” (i.e. the change in value of the financial liabilities designated under the fair value option attributable to the change in the entity’s own credit quality) through other comprehensive income, instead of in the income statement as currently provided by IAS 39;
• the presence of just one impairment model, to be applied to all financial assets not measured at fair value through profit and loss (“FVTPL”), based on the concept of Expected Credit Loss as compared with the previous concept of Incurred Loss. The aim of this new approach to impairment is to ensure more immediate recognition of losses than the present “Incurred Loss” model envisaged in IAS 39, according to which the losses have to be recognised if evidence is found of impairment losses after initial recognition of the asset. In detail, the new model envisages that the financial assets be allocated in three distinct “stages” in increasing order of deterioration of the credit quality: - stage 1: this involves the performing financial assets for which no significant credit impairment was recognised in
comparison with the date of initial recognition. These assets are recognised on the basis of an expected loss one year out;
- stage 2: this involves the performing financial assets whose credit quality has deteriorated significantly since initial recognition. These financial assets are also measured based on their lifetime expected credit loss;
- stage 3: this involves the credit-impaired financial assets which, having suffered a significant increase in their credit risk since initial recognition, are measured based on their lifetime expected credit loss;
• hedge accounting, with the aim of guaranteeing greater alignment between accounting hedges and operating (or economic) hedge relationships established by the Risk Management Department;
• the impossibility of voluntarily interrupting a hedge accounting relationship if the aim of the hedge by Risk Management remains.
Mandatory application of the standard is scheduled to begin on 1 January 2018, with the possibility of early application of the entire standard or only of the amendments related to the accounting of own credit risk for financial liabilities measured at fair value.
In 2016, the company participated in a specific project on this issue, undertaken by the parent company CDP, aimed at assessing the macro impacts resulting from application of the new standard, and the related gaps that might derive therefrom. Based on initial analyses, it is not expected that any application of the standard will impact the classification and measurement of currently existing financial instruments.
IFRS 15: Revenue from Contracts with Customers
The standard, published by the IASB on 28 May 2014, has introduced a single model for measuring all revenue deriving from contracts with customers and replaces the previous standards/interpretations on revenue (IAS 18, IAS 11, IFRIC 13, IFRIC 15, IFRIC 18, SIC 31). According to this model, the entity has to recognise revenue according to the consideration to which it expects to be entitled in exchange for the goods or services provided, determined according to the following five steps:
• identification of the contract, defined as an agreement having commercial substance between two or more equal parties that can generate rights and obligations;
• identification of the performance obligations contained in the contract; • determination of the transaction price, i.e. the consideration expected for the transfer of goods or services to the
customer;

2016 FINANCIAL STATEMENTS •
149
• allocation of the transaction price to each of the performance obligations, by reference to their standalone selling prices;
• recognition of the revenue allocated to the individual obligation when it is satisfied, i.e. when the customer obtains control of the goods and services. This recognition acknowledges the fact that certain services may be provided at a specific time or over a period of time.
The Company has not yet initiated any formal assessment of the impact deriving from application of the new standard that is being examined, which are otherwise expected not to be significant.
Accounting standards, amendments and interpretation s that have not yet been endorsed by the European Union at the reporting date of these f inancial statements
Certain accounting standards, interpretations and amendments had been issued by the IASB but not yet endorsed by the European Union at the approval date of these financial statements:
• IFRS 14 – Regulatory Deferral Accounts; • IFRS 16 – Leases; • Amendments to IFRS 10 – Consolidated Financial Statements and IAS 28 – Investments In Associates And Joint
Ventures: Sale or Contribution of Assets between an Investor and its Associate or Joint Venture; • Amendments to IAS 12: Recognition of Deferred Tax Assets for Unrealised Losses; • Amendments to IAS 7: Disclosure Initiative; • Amendments to IFRS 2: Classification and Measurement of Share-based Payment Transactions; • Clarifications on IFRS 15: Revenue from Contracts with Customers; • Amendments to IFRS 4: Applying IFRS 9 – Financial Instruments with IFRS 4 – Insurance Contracts.
IFRS 16 – Leases
On 13 January 2016 the IASB published IFRS 16 (Leases), which is intended to replace the current accounting standard IAS 17, and the interpretations IFRIC 4 (Determining whether an Arrangement contains a Lease), SIC 15 (Operating Leases – Incentives), and SIC 27 (Evaluating the Substance of Transactions Involving the Legal Form of a Lease). The new standard gives a new definition of lease and introduces a principle based on control (“right of use”) of an asset, to distinguish finance leases from service agreements, by identifying the following as discriminating elements: identification of the asset, the right to substitute it, the right to obtain substantially all economic benefits resulting from use of the asset and the right to manage use of the asset underlying the agreement. The aim is to ensure greater comparability between financial statements due to the different accounting principles applied to operating leases and finance leases. The standard establishes a single model for recognition and measurement of leases by the lessee, which entails recognition of the leased asset, including those held under an operating lease, on the assets side of the balance sheet, with a balancing entry for the financial liability, while also offering the possibility of not recognising as finance leases those agreements whose object are “low-value assets” and leases whose term is 12 months or less. In contrast, the new standard does not envisage significant changes for the lessors.
The new standard applies beginning 1 January 2018, with the envisaged possibility of early application, while the process of endorsement by the European Union is still under way.
Other information
The Board of Directors meeting of 31 March 2016 approved CDP RETI’s draft financial statements 2016 authorising their publication and disclosure, which will comply with the timing and procedures set out in current regulations applicable to CDP RETI.
Due to requirements relating to the preparation of the consolidated financial statements, in accordance with Article 2364 of the Italian Civil Code and the Articles of Association, approval of the financial statements of CDP and acknowledgement of the consolidated financial statements of the CDP RETI Group by the Shareholders’ Meeting will take place within 180 days after the end of the financial year.
II. THE MAIN FINANCIAL STATEMENT ITEMS
The following pages provide a description of the accounting policies adopted in preparing the financial statements.

• 2016 ANNUAL REPORT
150
An asset or liability is classified as "current" when its trading, realisation or settlement are expected within twelve months from the reporting date or within the normal business cycle, if after twelve months; all other assets and liabilities are classified as "non-current".
EQUITY INVESTMENTS
This item includes investments in other companies, both represented by securities and not, that give rise to a relationship of control or association or a joint venture. “Equity investments” means investments in subsidiaries (IFRS 10), in joint operations (IFRS 11) and in associates (IAS 28), other than investments recognised as “Financial assets”.
The entities over which CDP RETI has the right of exercising direct or indirect control, as defined in IFRS 10 – Consolidated Financial Statements, are considered to be subsidiaries. In particular, control exists when the controlling entity simultaneously:
• has decision-making power over the investee, or valid rights that grant it the current power to manage significant activities;
• is entitled to participate in or is exposed to the variable (positive or negative) results of the investee; • can exercise power over the investee to affect the amount of its own returns.
The evidence of control has to be verified by the Company on a continuing basis, in view of identifying all facts or circumstances that might imply a change in one or more elements on which depends the existence of a control relationship over an investee.
Joint ventures are companies in which control is shared with other parties by contract.
Associates are companies in which CDP RETI holds, either directly or indirectly, at least 20% of the voting rights or, independently of the proportion of voting rights, companies over which CDP RETI has significant influence, which is defined as the power to participate in determining financial and operating policies, but without exercising either control or joint control.
Non-controlling interests are recognised in “Available-for-sale financial assets” as described above.
The equity investments held at 31 December 2016 are listed individually in Annex 1 “Analytical list of equity investments”, which is an integral part of these Notes to the financial statements.
Equity investments are initially recognised and subsequently carried at cost at the settlement date.
The existence of objective evidence that the carrying amount of the equity investments might not be fully recoverable is verified at every reporting date.
Evidence of impairment, based on the existence of qualitative and quantitative indicators, as illustrated hereunder, and in accordance with the internal policies, differs where these involve investments in companies whose shares are or are not listed on active markets.
An impairment test is performed when the aforementioned indicators exist, in accordance with the provisions of IAS 36. This test is aimed at estimating the recoverable amount of the equity investment and comparing it with its carrying amount to determine the recognition of any impairment losses.
The following are possible indicators of impairment:
• the recognition of losses or significantly lower results than budgeted or forecast in multi-year plans; • the announcement or commencement of insolvency proceedings or restructuring plans; • the receipt of a dividend that exceeds the total comprehensive income of the investee for the year or its accumulated
income from previous years; • a carrying amount of the equity investment in the separate financial statements that exceeds the amount, in the
consolidated financial statements, of the corresponding portion of equity, including any goodwill.
Moreover, the following is considered evidence of impairment for equity investments in listed companies:
• consolidated equity higher than market capitalisation; • a reduction in the market price exceeding the carrying amount by over 40% or for more than 24 months.
The recoverable amount is the higher of the fair value of the unit, net of any sales costs and value in use, being the present value of the future cash flows that the equity investment may generate, including the final disposal value of the investment. If this value is lower than the book value and if there is persistent or significant impairment, any identified adjustments are recognised in the income statement as impairment losses. When the reasons for these impairments cease to exist, the book value of the equity investments carried at cost is restored for the amount of the recognised impairment, while recognising the effect of this adjustment in the income statement under “Income (expenses) from equity investments”.

2016 FINANCIAL STATEMENTS •
151
The investor's interest in any losses of the investee that exceed the carrying amount of the equity investment is recognised in a specific provision, to the extent that the investor is committed to meeting the legal or implicit obligations of the investee, or otherwise cover its losses.
The dividends are recognised when the investor's right to receive payment for it (resolution to distribute dividends passed by the shareholders' meeting of the investee or the board of directors, if an advance on the dividend is received). The dividends resolved by the subsidiaries are recognised in the income statement when they are resolved and recognised as financial income regardless of the nature of the distributed reserves (equity or profit reserves and, in this latter case, even when these profits derive from the distribution of profit reserves that were established before the acquisition of the equity investment). In any event, considering that the distribution of those reserves represents an event implying a reduction in the value of the equity investment, the Company verifies the recoverability of the book value of the equity investment and, if appropriate, recognises an impairment.
Equity investments are derecognised when the contractual rights to the cash flows of the business terminate or when the financial asset is sold, transferring substantially all risks and rewards connected with it.
FINANCIAL ASSETS
Financial assets include:
1. Loans 2. Financial assets held for trading 3. Financial assets available for sale 4. Financial assets held to maturity 5. Hedging derivatives
1. Loans
Financial instruments, including debt securities, that are not listed on active markets, which IAS 39 refers to as “loans and receivables” and for which the company has a right to receive future cash flows are recognised as “Financial and other receivables”.
Loans are recognised when the contract is executed, i.e. upon the unconditional acquisition of a right to payment of the amounts agreed, and are initially measured at fair value, which equals the amount disbursed including directly related transaction costs and commissions. Where the net amount disbursed does not equal the loan’s fair value because the interest rate is lower than the market rate or the rate normally applied for similar loans, initial measurement is carried out by discounting the future cash flows using an appropriate rate.
Interest on loans and on arrears is recognised as interest income and similar revenues, on an accruals basis.
The carrying amount of loans on the consolidated financial statements is subject to periodic testing for impairment that could reduce their expected realisable value.
The measurement of writedowns of loans is based on discounting the expected future cash flows of principal and interest net of collection costs, taking account of any guarantees securing the positions and any advances received. The key to determining the value of the future cash flows is in defining the estimated collections, the related timing, and the discount rate to be applied.
The impairment of non-performing loans is then reversed only when the quality of the loan improves to the point that there is a reasonable certainty of a greater recovery of principal and interest and/or greater receipts have been recorded than the previously recorded carrying amount of the loan on the consolidated financial statements. In any event, given the method used to measure impairment losses, as the due dates for credit collection approach with the passing of time, the value of the loan is “written back”, given that there is a reduction in the implicit finance costs previously recognised as a reduction in the value of the loans.
Loans are derecognised when paid in full, when all of the related risks and rewards have been transferred, or when a loan is deemed to be definitively unrecoverable.
2. Financial assets held for trading
“Financial assets held for trading” refer to all financial assets, regardless of type (debt securities, equity securities, loans, derivatives, etc.), allocated to the trading portfolio and held for the purpose of generating profits over the short term as a result of changes in the price of such instruments, as well as the derivative contracts operationally connected with financial liabilities measured at fair value (under the fair value option) and derivatives with a positive value, including those resulting from the separation of embedded derivatives, that are not deemed to be effective for hedging purposes.

• 2016 ANNUAL REPORT
152
Financial assets held for trading meet the following prerequisites:
• they are purchased with the intention of being sold in the short term; • they are a part of a portfolio of identified financial instruments that are managed together and for which there is
evidence of a recent actual pattern of short-term profit-taking; • they are derivatives (with the exception of derivatives that are designated and effective hedging instruments).
Such financial assets are initially recognised at fair value, which generally equals the amount paid or received net of transaction costs or income. Where the amount paid is different from the fair value, the financial asset is nonetheless recognised at fair value, and the difference between the two amounts is recognised through profit or loss. Initial recognition is carried out at the signing date for derivative contracts and at the settlement date for debt and equity securities, with the exception of those for which delivery is governed by conventions on the reference market, for which initial recognition is at the settlement date.
Financial assets held for trading also include derivative contracts embedded in other financial instruments or contracts and which have financial and risk characteristics that are not correlated with the host instrument or which meet the requirements to be classified as derivative contracts, recognising them separately after separating the embedded derivative from the main contract, which is then treated in accordance with the accounting rules for its own category. This is not done in cases in which the compound instrument containing the derivative is measured at fair value through profit or loss.
If the financial instruments are listed on active markets, they are measured subsequently at fair value based on the official prices at the reporting date of the consolidated financial statements. For financial instruments, including equity securities, not listed on active markets, fair value is determined by using measurement techniques and information available on the market, such as the price of similar instruments on an active market, discounted cash flows, option pricing models and values registered in recent similar transactions. For equity securities and related derivative instruments, if the fair value obtained using such measurement techniques cannot be reliably determined, the financial instruments are measured at cost and written down in the event of impairment losses.
If the fair value of a financial asset becomes negative, it is recognised as a financial liability held for trading.
Financial assets held for trading are derecognised when payment is received, when the contractual rights to the cash flows expire, or a sale transfers all the risks and rewards connected with ownership to a third party. Conversely, when a prevalent share of the risks and rewards associated with the transferred financial assets is retained, the asset remains on the consolidated financial statements, even if legal title has been effectively transferred.
3. Financial assets available for sale
“Financial assets available for sale” are non-derivative financial assets (debt securities, equity securities, etc.) that are classified as available for sale and not as (a) loans and receivables, (b) held-to-maturity investments, or (c) financial assets at fair value through profit or loss.
Financial assets available for sale are initially recognised on the contract date for all financial assets, with the exception of those for which delivery is governed by conventions on the reference market, for which initial recognition is carried out at the settlement date and on the disbursement date in the case of loans.
The financial assets are initially recognised at fair value, which generally equals the amount paid or received net of transaction costs or income. Where the amount paid is different from the fair value, the financial asset is nonetheless recognised at fair value, and the difference between the two amounts is recognised through profit or loss.
Unrealised gains or losses on available-for-sale securities are recorded in a specific equity reserve, net of tax effects, until the investment is sold or written down.
If the financial instruments are listed on active markets, they are measured subsequently at fair value based on the official prices at the reporting date of the consolidated financial statements. For financial instruments, including equity securities, not listed on active markets, fair value is determined by using measurement techniques and information available on the market, such as the price of similar instruments on an active market, discounted cash flows, option pricing models and values registered in recent similar transactions. If the fair value of financial instruments not listed on active markets cannot be reliably determined, the financial instruments are measured at cost and written down in the event of impairment losses.
Financial assets available for sale undergo impairment testing to determine whether there is objective evidence of impairment. Where the decline in the fair value of a financial asset available for sale with respect to its initial cost value is significant or long lasting, an impairment is recognised through profit or loss, regardless of other measurement considerations. To this end, the “significance” and “durability” of the reduction in fair value are measured separately, setting appropriate materiality thresholds.
When an available-for-sale security is impaired, the cumulative, unrealised change in value recorded in the equity reserve is recognised through profit or loss. The impairment is recognised when the purchase cost (net of any amortisation and

2016 FINANCIAL STATEMENTS •
153
repayments of principal) of a financial asset available for sale exceeds its recoverable amount. The amount of this loss is measured using specific valuation techniques and models for equity securities. Any writebacks of impairment of investments in equity instruments are not recognised through profit or loss but in an equity reserve, while any writebacks of investments in debt instruments are recognised through profit or loss. The value of the instrument after the writeback shall in any event not exceed the amortised cost that the instrument would have had in the absence of the prior adjustments.
Dividends on equity instruments that are available for sale are recognised as income when the right to receive payment is established.
In addition to the recognition of impairment losses, the cumulative gains or losses in the equity reserve are, as mentioned above, recognised through profit and loss at the time of the sale of the asset. Accordingly, in the event of disposal of an investment in available-for-sale securities, the related cumulative, unrealised change in value recorded in equity is recognised through profit and loss.
Financial assets available for sale are derecognised when payment is received, when the contractual rights to the cash flows expire, or a sale transfers all the risks and rewards connected with ownership to a third party. Conversely, when a prevalent share of the risks and rewards associated with the transferred financial assets is retained, the asset remains on the financial statements, even if legal title has been effectively transferred.
4. Financial assets held to maturity
Financial assets held to maturity include financial assets other than derivatives with fixed or determinable payments and fixed maturity that an entity has the positive intention and ability to hold to maturity.
If, following a change in such intention or ability, it is no longer appropriate to continue to classify an investment as held to maturity, it is reclassified under financial assets available for sale.
Financial assets held to maturity are initially recognised at fair value, which is normally equal to the price paid or received. In cases where the price differs from fair value, the financial asset is recognised at fair value and the difference between the price and the fair value is recognised in the income statement.
The value at which such assets are initially recognised includes incidental costs and revenues attributable to the transaction.
Following initial recognition, financial assets held to maturity are measured at amortised cost and undergo impairment testing. The amortised cost of a financial asset is equal to the amount at which it is measured at initial recognition minus principal repayments, plus or minus the cumulative amortisation using the effective interest rate method of any difference between the initial amount and the maturity amount, and minus any reduction (directly or through the use of an allowance account) for impairment or non-recoverability. If the reasons for the previous impairment cease to exist, the value of the assets is restored up to the value that would have resulted from application of the amortised cost if they had not been impaired. Such assets are derecognised when the contractual rights to the cash flows from the assets expire or when the assets are sold by transferring substantially all the risks and rewards connected with ownership of the assets.
5. Hedging derivatives
Financial assets include financial derivatives that have a positive fair value at the reporting date.
Please refer to the paragraph “Hedging transactions” for a description of the accounting standards adopted for the recognition of hedging derivatives.
TRADE RECEIVABLES
Trade receivables are initially recognised at fair value and subsequently measured at amortised cost, using the effective interest method, net of any impairment losses related to amounts deemed unrecoverable and recognised in specific bad debt provisions. Impairment losses are calculated based on the present value of expected future cash flows, discounted

• 2016 ANNUAL REPORT
154
at the original effective interest rate, being the interest rate that aligns the present value of the expected cash flows with the carrying amount at initial recognition.
Receivables due within normal commercial terms are not discounted.
CURRENT AND DEFERRED TAXATION
Corporate income tax (IRES) and regional tax on business activities (IRAP) are recognised using a realistic estimate of the negative and positive tax components for the year and were calculated on the basis of the tax rates currently in force.
As regards IRES, in particular, following the CDP Group joining the tax consolidation mechanism and in compliance with Regulations on consolidation and legal theory and practice, the Company determines its own “potential” liability, recognising the receivable towards the consolidating Company which, in compliance with the new mechanism, is the only party required to settle with the Tax Authorities.
Deferred tax items regard the recognition of the effects of temporary differences between the valuation of accounting items under tax regulations, which are used to determine taxable income, and that under statutory reporting regulations (which seek to quantify the result for the year).
More specifically, “taxable temporary differences” between statutory and tax values are those that will give rise to taxable amounts in future tax periods, while “deductible temporary differences” are those that will give rise to deductible amounts in the future.
Deferred tax assets/liabilities are classified as non-current assets/liabilities pursuant to IAS 1.56.
Deferred tax items are therefore recognised as non-current liabilities under “Deferred tax liabilities”, where they are related to items that will become taxable in future tax periods. Where they represent assets, i.e. they are related to items that will be deductible in future tax periods, they are recognised as “Deferred tax assets”, under non-current assets in the Balance sheet.
If the deferred tax items regard transactions that directly affected equity, they are recognised in equity.
Deferred taxes are determined by using the tax rates expected to be applicable in the years when the differences will be realised or eliminated.
FINANCIAL LIABILITIES
Financial liabilities, including payables for loans but other than derivatives, are recognised at the cost on the settlement date, represented by the fair value of the liabilities reduced by any directly attributable transaction costs. Subsequently, the financial liabilities are measured with the amortised cost criteria, using the effective interest rate method.
Financial liabilities are derecognised when they fall due or are settled.
HEDGING DERIVATIVES
Financial assets or liabilities include financial derivatives that have a positive or negative fair value, respectively, at the reporting date.
Please refer to the paragraph below on hedging transactions for a description of the accounting standards adopted for the recognition of hedging derivatives.
Hedging transactions
In accordance with the IAS definition, hedging instruments are designated derivatives or (limited to the hedging of foreign currency risk) non-derivative financial assets or liabilities, the fair value or cash flows of which are expected to offset the changes in fair value or cash flows of a designated item. A hedged item is an asset, liability, firm commitment, a highly probable forecast transaction, or a net investment in a foreign operation that (a) exposes the organisation to the risk of a change in fair value or future cash flows and (b) is designated as being hedged. The effectiveness of the hedge is the extent to which the change in fair value or cash flows of the hedged item that is attributable to a hedged risk are offset by the change in fair value or cash flows of the hedging instrument.
When a financial instrument is classified as a hedging instrument, the following are to be formally documented:
• the relationship between the hedging instrument and the hedged item, including the risk management objectives; • the hedging strategy, which must be in line with established risk management policies;

2016 FINANCIAL STATEMENTS •
155
• the methods to be used in order to verify the effectiveness of the hedge.
Accordingly, both at the inception of the hedge and throughout its life, the change in the fair value of the derivative is analysed in order to determine whether it is highly effective in offsetting the changes in fair value of the hedged item.
A hedge is deemed to be highly effective if, both at inception and throughout its life, the changes in fair value of the hedged item or in the expected cash flows attributable to the risk being hedged are almost entirely offset by the changes in fair value of the hedging derivative, with the relationship of these changes falling within a range of between 80% and 125%.
If the hedge is not effective as described above, the hedging instrument is reclassified under instruments held for trading, while the hedged item is measured in accordance with the criteria for its category. Hedge accounting also ceases in the event the hedging instrument expires, is sold or exercised or where the hedged item expires, is sold or is repaid.
In the event of hedges designed to neutralise the risk of changes in future cash flows arising from future transactions that are considered as highly probable as at the reporting date (cash flow hedge), the fair value changes of the derivative after initial recognition are recognised, to the extent of the effective portion, under the item “Reserves” in equity. When the economic effects of the hedged item materialize, the reserve is transferred to operating profit or loss. If the hedge is not fully effective, the fair value change of the hedging instrument, to the extent of the ineffective portion, is immediately recognised through profit or loss.
If, during the life of a derivative, the expected hedged cash flows are no longer considered as highly probable, the portion of that instrument recognized as “reserves” is immediately recycled through profit or loss. Conversely, if the derivative is sold or no longer qualifies as an effective hedge, the portion of "reserves" corresponding to the fair value changes of the instrument recognised up to that time continues to be recognised in equity and shall be recycled through profit or loss, in accordance with the abovementioned classification criteria, as the economic effects of the underlying hedged item materialize. If the hedged transaction is no longer considered as probable, the cumulative unrealised gains or losses recognised in equity are immediately recycled through profit or loss.
CASH AND CASH EQUIVALENTS
Cash and cash equivalents are measured at their nominal amount, which corresponds to fair value. This item includes cash deposits at banks and at the parent company based on a deposit agreement with the latter.
Cash and cash equivalents take account of the interest accrued on the amounts, albeit not yet paid.
OTHER INFORMATION
Interest income and expense
Interest income and expense is recognised in the Income statement for all instruments based on amortised cost using the effective interest rate method.
Interest also includes the net positive or negative amount of the differentials and margins related to financial derivatives.
Dividends
The dividends received from unconsolidated investees are recognised as income in the period in which they are approved for distribution.
The dividends from companies carried at equity reduce the book value of the equity investments.
Transactions with related parties
Reporting is provided on transactions with related parties identified according to the criteria established by IAS 24.
Methods for determining fair value measurement crit eria
Fair value is the price that would be received to sell an asset or paid to transfer a liability in an orderly transaction between market participants (i.e. not in compulsory winding-up or sale below cost) at the measurement date. Fair value is a market measurement criterion that does not refer specifically to the individual business. Underlying the definition of fair value is the assumption that the company is operating its business normally without any intention to liquidate its own assets, significantly reduce the level of its own assets, or settle transactions at unfavourable conditions. An entity shall measure

• 2016 ANNUAL REPORT
156
the fair value of an asset or a liability using the assumptions that market participants would use when pricing the asset or liability, assuming that market participants act in their economic best interest.
As envisaged in IFRS 13, to measure the fair value, CDP RETI also considers the effect of non-performance risk. This risk includes both the changes in the counterparty's credit risk and the changes in the issuer's own credit risk.
Fair value of financial instruments is calculated according to a hierarchy of criteria based on the origin, type, and quality of information used. In detail, this hierarchy assigns the highest priority to the prices quoted (and not changed) on active markets and lower importance to unobservable inputs. Three different input levels are identified:
• in the case of instruments quoted on active markets, prices on financial markets are used (Level 1); • in the case of financial instruments not quoted on active markets, valuation techniques which use observable market
parameters other than quoted prices for the instrument but connected with its fair value by non-arbitrage relationships shall be used, where possible (Level 2);
• in other cases, internal valuation techniques that also use as input parameters that are not observable on the market, and thus are inevitably subjective to some degree, shall be used (Level 3).
Since Level 1 inputs are available for numerous financial assets and liabilities, some of which are traded on more than one active market, the Company has to take special care when defining both of the following aspects:
• the principal market for assets or liabilities or, in the absence of a principal market, that is the most advantageous market for the asset or liability;
• if the company can conclude a transaction involving the asset or liability at that price and on that market at the measurement date.
CDP RETI believes that the principal market of a financial asset or liability can be identified as the market on which the Company normally operates.
A market is considered active if the quoted prices, representing effective and regular market transactions executed during an appropriate reference period, are readily and regularly available through stock exchanges, brokers, intermediaries, specialised firms, quotation services or authorised entities.
In the event of a significant reduction in the volume or level of ordinary activity for the asset or liability (or for similar assets or liabilities) flagged by certain indicators (number of transactions, insignificance of the prices given by the market, significant increase in the implicit premiums for liquidity risk, widening or increase in the bid-ask spread, reduction or total absence of a market for new issues, scanty information in the public domain), the transactions or quoted prices are analysed.
In the case of financial instruments that are not quoted on active markets, valuation using Level 2 inputs requires the use of valuation techniques that process market parameters at different levels of complexity. For example, valuation techniques may, in addition to interpolations and extrapolations, involve the specification of stochastic processes that represent market dynamics and the use of simulations or other numerical techniques to determine the fair value of the instruments being measured.
In selecting the valuation techniques to be used in Level 2 measurements, the company takes account of the following criteria:
• simpler valuation techniques are preferred to more complex techniques, all other conditions being equal and as long as they represent all of the relevant characteristics of the product, ensuring that they are reasonably in line with the practices and results of other sector operators;
• valuation techniques are applied consistently over time to consistent categories of instruments, unless objective grounds for replacement emerge;
• all other conditions being equal, preference is given to standard models whose mathematical structure and implementing procedures are familiar to practitioners and implemented in the corporate systems.
The market parameters used as inputs for Level 2 valuations are selected on the basis of non-arbitrage relationships or comparative relationships that define the fair value of the financial instrument being measured as the relative fair value compared with that of financial instruments quoted on active markets.
The company has established a reference framework for derivative contracts and bonds. This framework is composed of the valuation criteria and models on which the valuation of each category of instruments is based.
In some cases, in determining fair value it is necessary to use valuation techniques that call for inputs that cannot be drawn directly from observable market variables, such as statistical or “expert-based” estimates by the party performing the valuation (Level 3).
Level 3 valuation techniques are also applied consistently over time to consistent categories of instruments, unless objective grounds for replacement emerge. Similarly, parameters that cannot be drawn directly from observable market variables are applied consistently over time.

2016 FINANCIAL STATEMENTS •
157
II - INFORMATION ON THE BALANCE SHEET
I. ASSETS
I.1. NON-CURRENT ASSETS
I.1.1. Equity investments
The net amount of “Equity investments” refers to the value of controlling stakes that CDP RETI owns in SNAM S.p.A., Terna S.p.A., and Italgas S.p.A..
Recognition of the investment in Italgas S.p.A. is consequent to the spin-off by SNAM of assets in the natural gas distribution business. The transaction, divided into several steps, was resolved by the Board of Directors of SNAM on 28 June 2016 and approved by the shareholders' meeting the following 1 August. The transaction was completed, with the spin-off of Italgas taking effect, when the shares of the company were listed on 7 November 2016. After this reorganisation, CDP RETI became owner of 202,898,297 Italgas shares, representing 25.08% of the share capital.
Reference is made to the Report on Operation for a more analytical description of the transaction.
Equity investments: breakdown
Equity investments in subsidiaries, companies subject to joint control or under significant influence: information on equity relationships
Equity investments in subsidiaries, companies subjec t to joint control or under significant influence: accounting information
The table below shows the changes in equity investments recorded during the year:
(euros)
Names 31/12/2016 31/12/2015
Italgas SpA 589,284,378
SNAM SpA 2,930,945,734 3,520,230,115
Terna SpA 1,315,200,000 1,315,200,000
Total 4,835,430,112 4,835,430,115
Names Registered office % holding
1. Italgas S.p.A. Milan 25.08%
2. SNAM S.p.A. San Donato Milanese 28.98%
3. Terna S.p.A. Rome 29.85%
(millions o f euros)
Names Total assets (1) Total revenues (1) Net income (loss) (1) Equity (1) Carrying amount Type of transaction
Italgas SpA (2) 5,608 274 (72) 1,064 589 Control
SNAM SpA 20,129 2,501 861 6,497 2,931 Control
Terna SpA 16,041 2,103 628 3,555 1,315 Control
(1) Data from the 2016 Annual Report - Consolidated Financial Statements
(2) Consolidated income statements include Italgas S.p.A. values starting from its estabilishment (1/06/2016), and its subsidiaries values starting from 7/11/2016

• 2016 ANNUAL REPORT
158
Equity investments: annual changes
I.1.2. Deferred tax assets
Following below is a breakdown of "Deferred tax assets" recognised at 31 December 2016 for a total amount of €3,308 thousand (€1,261 thousand at 31 December 2016).
Deferred tax assets: breakdown
Deferred IRES is calculated on temporary differences in the values reported for tax purposes and those used for financial reporting that will become deductible in periods following the period in which they are recognised.
Deferred tax assets with an impact on equity are instead related to deferred tax recorded in relation to cash flow hedging derivatives.
(euros)
Items/Figures 31/12/2016 31/12/2015
A. Opening balance 4,835,430,115 4,835,430,115
B. Increases 589,284,378 -
B.1 Purchases
B.2 Writebacks
B.3 Revaluations
B.4 Other increases 589,284,378
C. Decreases (589,284,381) -
C.1 Sales
C.2 Writedow ns
C.3 Other decreases (589,284,381)
D. Closing balance 4,835,430,112 4,835,430,115
E. Total revaluations
F. Total impairments
(euros)
Items/Figures 31/12/2016 31/12/2015
Deferred IRES 22,820 40,474
Deferred tax assets recognized in equity 3,284,963 1,220,619
Total 3,307,783 1,261,093

2016 FINANCIAL STATEMENTS •
159
The following tables indicate the change in deferred tax assets during the year:
Change in deferred tax assets (balancing entry in t he Income statement)
Change in deferred tax assets (balancing entry in e quity)
(euros)
Items/Figures 31/12/2016 31/12/2015
1. Opening balance 40,474 14,421
2. Increases 22,820 27,108
2.1 Deferred tax assets recognised during the year 22,820 27,108
a) in respect of previous periods
b) due to change in accounting policies
c) w ritebacks
d) other 22,820 27,108
2.2 New taxes or increases in tax rates
2.3 Other increases
3. Decreases 40,474 1,055
3.1 Deferred tax assets derecognised during the year 40,474 1,055
a) reversals 40,474 1,055
b) w ritedow ns for supervening non-recoverability
c) due to change in accounting policies
3.2 Reduction in tax rates
3.3 Other decreases
4. Closing balance 22,820 40,474
(euros)
Items/Figures 31/12/2016 31/12/2015
1. Opening balance 1,220,619
2. Increases 2,193,531 1,220,619
2.1 Deferred tax assets recognised during the year 2,193,531 1,220,619
a) in respect of previous periods
b) due to change in accounting policies
c) others 2,193,530 1,220,619
2.2 New taxes or increases in tax rates
2.3 Other increases
3. Decreases 129,186 -
3.1 Deferred tax assets derecognised during the year - -
a) reversals
b) w ritedow ns for supervening non-recoverability
c) due to change in accounting policies
d) other
3.2 Reduction in tax rates 129,186
3.3 Other decreases
4. Closing balance 3,284,964 1,220,619

• 2016 ANNUAL REPORT
160
I.2. CURRENT ASSETS
I.2.1. Current financial assets
“Current financial assets” at 31 December 2016 were recognised at €10,990 thousand (€4,330 thousand at 31 December 2015) and refer to the receivable with the parent company CDP for the margin paid to it under the guarantee agreement (Credit Support Agreement) entered into when the cash flow hedge derivative was taken out.
Current financial assets: breakdown
I.2.2. Tax receivables
The balance of "Tax receivables" includes assets related to current taxes.
Tax receivables: breakdown
I.2.3. Other current assets
The following table shows the breakdown of "Other current assets", which at 31 December 2016 were recognised for the amount of €6,393 thousand (€68 thousand at 31 December 2015):
Other current assets: breakdown
At 31 December 2016, the Company recognised among Other current assets the receivable from the parent company as a result of the tax consolidation mechanism, and resulting in detail from:
• €7,248 thousand in receivables deriving from transfer to the tax consolidation mechanism of part of the excess ACE (aiuto alla crescita economica - aid to economic growth tax incentive) incentive for 2016 and €977 thousand in receivables as part of the excess in interest expenses not deductible on an individual basis;
• €188 thousand in receivables resulting from the transfer of non-deductible interest expenses from previous years to the tax consolidation mechanism;
• payables of €2,084 thousand resulting from adjustment to the ACE incentive for 2013.
The other current assets mainly refer, instead, to the deferral of costs arising during the year but related to the following year.
(euro)
Items/Figures 31/12/2016 31/12/2015
Loans to CDP for CSA 10,990,000 4,330,000
Total 10,990,000 4,330,000
(euros)
Items/Figures 31/12/2016 31/12/2015
IRAP receivables 109,566
Advances for IRAP 109,566
Advances for VAT 1,838
Total 111,404 109,566
(euros)
Items/Figures 31/12/2016 31/12/2015
Receivables from CDP for tax consolidation 6,329,479
Receivables from CDP for tax consolidation: w ithholdings 35,119 27,933
Receivables from Fintecna 25,425
Other current assets 28,233 14,424
Total 6,392,831 67,781
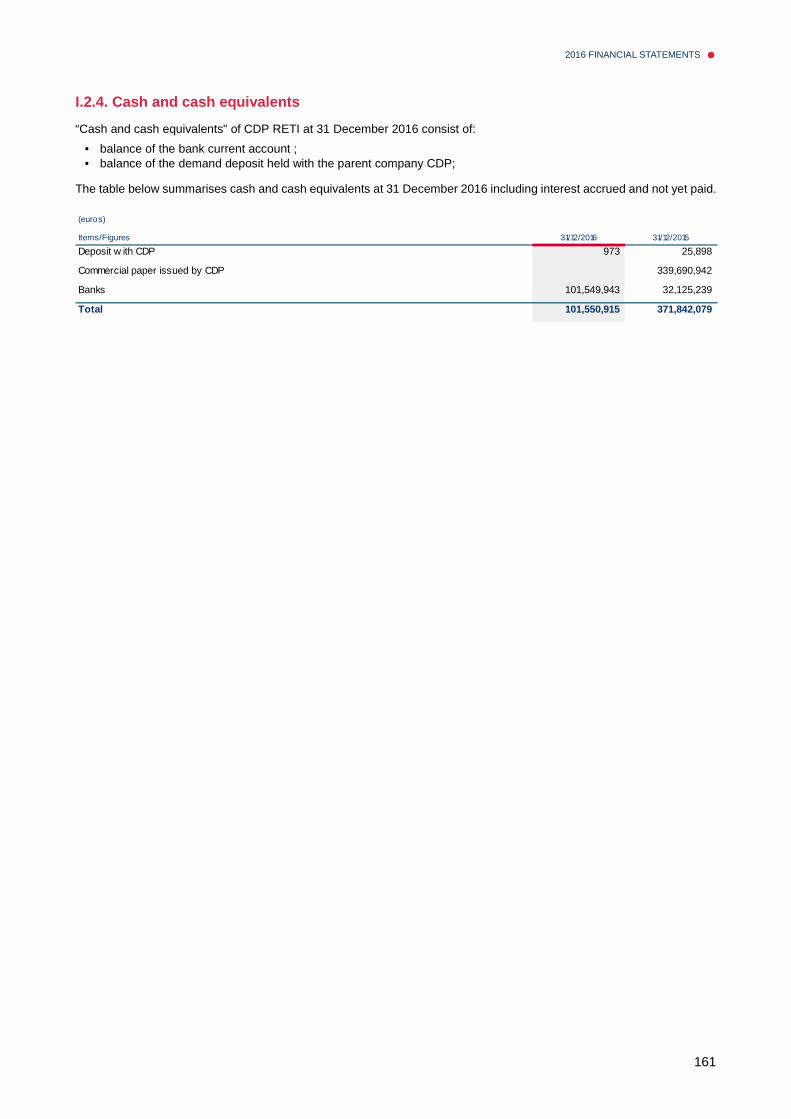
2016 FINANCIAL STATEMENTS •
161
I.2.4. Cash and cash equivalents
“Cash and cash equivalents" of CDP RETI at 31 December 2016 consist of:
• balance of the bank current account ; • balance of the demand deposit held with the parent company CDP;
The table below summarises cash and cash equivalents at 31 December 2016 including interest accrued and not yet paid.
(euros)
Items/Figures 31/12/2016 31/12/2015
Deposit w ith CDP 973 25,898
Commercial paper issued by CDP 339,690,942
Banks 101,549,943 32,125,239
Total 101,550,915 371,842,079

• 2016 ANNUAL REPORT
162
II. LIABILITIES
II.1. EQUITY
II.1.1. Share capital
Share capital: breakdown
At 31 December 2016 the share capital consisted of 161,514 shares without par value (likewise at 31 December 2015) and fully paid in.
During the year there were no changes to the ownership structure, which is therefore unchanged from the following situation resulting from the introduction, at the shareholders' meeting of 24 November 2014, of three separate categories of shares giving holders different rights concerning corporate governance:
Share capital: categories of shares
II.1.2. Reserves
At the end of the year, "Reserves" were as follows:
Reserves: breakdown
The item "Reserve for shareholder payments for investments" included the residual value of the payment made by CDP to fund the purchase of the equity investment in SNAM.
At 31 December 2016, the company did not hold treasury shares directly or indirectly through its subsidiaries or intermediaries.
Information required by Article 2427, point 7-bis, of the Italian Civil Code on the individual details of equity items is given, specifying their origin, possible use and possible distribution.
(euros)
Items/Figures 31/12/2016 31/12/2015
Share capital 161,514 161,514
Total 161,514 161,514
M ember / Number of shares / % Share category AShare category BShare category C %
CDP 95,458 59.10%
State Grid 56,530 35.00%
Cassa Forense 4,253 2.63%
Foundations and Savings Banks 5,273 3.26%
Total 95,458 56,530 9,526 100.00%
(euros)
Items/Figures 31/12/2016 31/12/2015
Legal reserve 32,303 32,303
Share premium reserve 1,315,158,486 1,315,158,486
Reserve for shareholder payments for investments 2,029,920,022 2,029,920,022
Total 3,345,110,811 3,345,110,811

2016 FINANCIAL STATEMENTS •
163
Statement pursuant to Article 2427 of the Italian Ci vil Code
II.1.3. Valuation reserves
Valuation reserves recorded a change as a result of the measurement of the cash flow hedge derivative contract entered into by the Company in May 2015, net of deferred tax.
Valuation reserves: breakdown
II.1.4. Advances on dividends
Having satisfied the requirements of Article 2433-bis of the Italian Civil Code, on 15 November 2016 the Company resolved to distribute advances on dividends for 2016, amounting to €1,566.43 per share, for a total of €253,000,375 payable in November 2016.
Advances on dividends: breakdown
II.2. NON-CURRENT LIABILITIES
II.2.1. Staff severance pay
At 31 December 2016 the Company’s non-current liabilities include €10,342 (€3,920 at 31 December 2015) relative to the “Staff severance pay” provision made in accordance with current regulations for the employees.
(euros)
Items/Figures
Share capital 161,514
Reserves
- Legal reserve 32,303 B 32,303
- Share premium reserve (**) 1,315,158,486 A, B, C 1,315,158,486
- Shareholder payment reserve 2,029,920,022 A, B, C 2,029,920,022
Valuation reserves
- CFH reserve (7,824,146)
Retained Earnings 256 A, B, C 256
Advances on dividends (253,000,375)
Total 3,084,448,059 3,345,111,066
(*) A = capital increase; B = loss coverage; C = distribution to shareholders
(**) Share premium reserve is fully available for distribution since Legal reserve reached a fifth o f Share capital
Balance at 31/12/2016
Possible uses (*)
Amount available
(euros)
Items/Figures 31/12/2016 31/12/2015
Valuation reserves CFH Sw ap (7,824,146) (2,470,398)
Total (7,824,146) (2,470,398)
(euros)
Items/Figures 31/12/2016 31/12/2015
Advances on dividends (253,000,375)
Total (253,000,375) -

• 2016 ANNUAL REPORT
164
Staff severance pay: annual changes
II.2.2. Loans
The total of “Loans” at 31 December 2016, considering the current portion and the non-current portion, amounts €1,507 million, and is substantially unchanged from the previous year.
Loans: breakdown
The breakdown of non-current loans into loans agreed or signed by the parent CDP or by the lending banks or by other institutional investors is provided in the table below:
Non-current loans: breakdown by type of creditor
II.2.3. Other financial liabilities
Other financial liabilities: breakdown
Other non-current financial liabilities originate from the fair value measurement (level 2) of the cash flow hedge derivative contract entered into by the company in May 2015 to hedge the interest-rate risk connected to the Term Loan Facility.
(euros)
Items/Figures 31/12/2016 31/12/2015
A. Opening balance 3,920
B. Increases 7,316 3,944
B.1 Allocation in the year 7,316 3,050
B.2 Other increases 894
C. Decreases 894 24
C.1 Payments made
C.2 Other decreases 894 24
D. Closing balance 10,342 3,920
(euros)
Items/Figures Non current Current Non current Current
Bond 748,269,605 8,321,918 747,971,287 8,299,180
Term loan facility 750,000,000 670,520 750,000,000 861,875
Total 1,498,269,605 8,992,438 1,497,971,287 9,161,055
31/12/201531/12/2016
(euros)
Items/FiguresCDP
Other Istitutional Investors
Poo l of Banks CDPOther Istitutional
InvestorsPool o f Banks
Bond 336,721,322 411,548,283 336,587,079 411,384,208
Term loan facility 337,500,000 412,500,000 337,500,000 412,500,000
Total 674,221,322 411,548,283 412,500,000 674,087,07 9 411,384,208 412,500,000
31/12/2016 31/12/2015
(euros)
Items/Figures 31/12/2016 31/12/2015
Cash-f low hedge derivative contract 11,588,485 4,024,143
Total 11,588,485 4,024,143

2016 FINANCIAL STATEMENTS •
165
II.3. CURRENT LIABILITIES
II.3.1. Current loans
This item includes the current portion of the loans described above, as well as coupons maturing and expiring in the following year. The table below shows the breakdown of the item at 31 December 2016:
Current loans: breakdown by type of creditor
II.3.2. Tax payables
Tax payables at 31 December 2016 mainly relate to the tax withheld by the Company on behalf of its employees and independent contractors, and paid to the revenue authorities during the subsequent month.
Tax payables: breakdown
The balance for Other tax payables refers on the other hand almost entirely to the payable resulting from payment of VAT.
II.3.3. Other current liabilities
"Other current liabilities" refer to short-term payables that will be paid in the year following the reporting date.
Other current liabilities: breakdown
(euros)
Items/FiguresCDP
Other Istitutional Investors
Poo l of Banks CDPOther Istitutional
InvestorsPool o f Banks
Bond 3,744,863 4,577,055 - 3,734,631 4,564,549
Term loan facility 301,734 368,786 387,844 474,031
Total 4,046,597 4,577,055 368,786 4,122,475 4,564,54 9 474,031
31/12/2016 31/12/2015
(euros)
Items/Figures 31/12/2016 31/12/2015
Irpef w ithholdings on employees 15,673 7,368
Irpef w ithholdings on professionals 71,907
Other tax payables 7,709 2,127
Total 95,288 9,495
(euros)
Items/Figures 31/12/2016 31/12/2015
Trade payables 137,910 189,107
Payables to parent companies 380,482 383,756
Payables due to pension and social security institutions 20,159 15,977
Other payables 146,325 152,827
Total 684,876 741,667
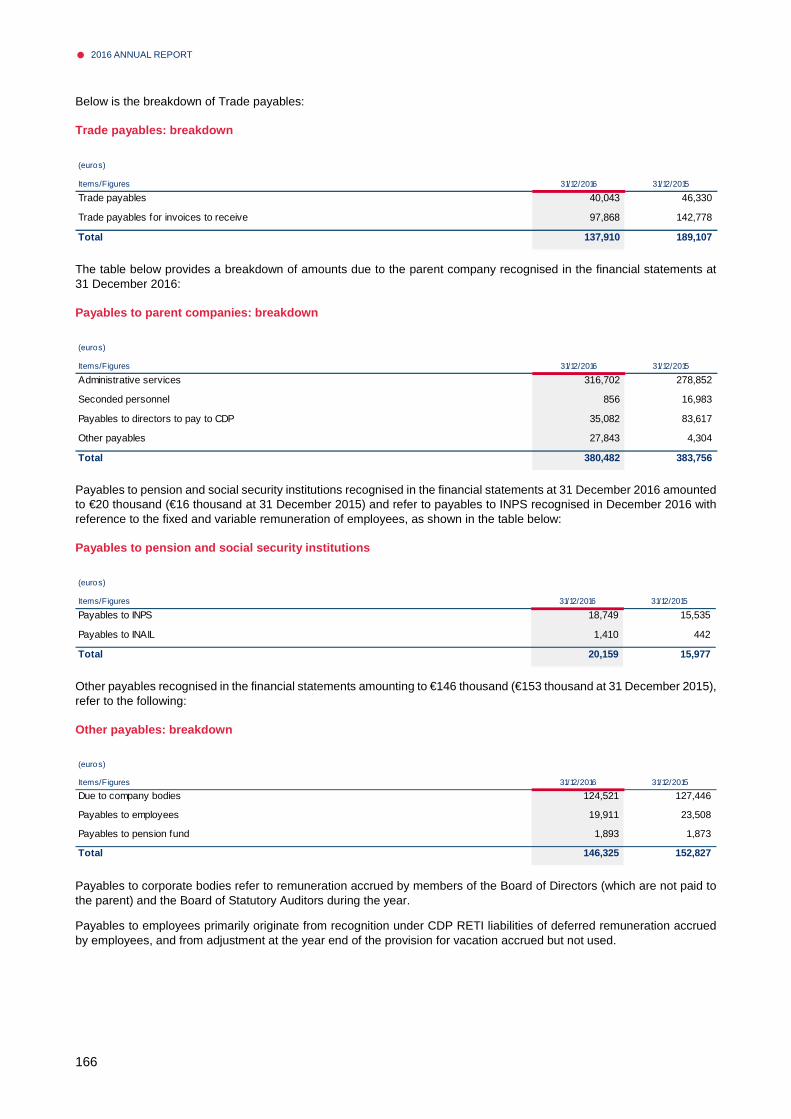
• 2016 ANNUAL REPORT
166
Below is the breakdown of Trade payables:
Trade payables: breakdown
The table below provides a breakdown of amounts due to the parent company recognised in the financial statements at 31 December 2016:
Payables to parent companies: breakdown
Payables to pension and social security institutions recognised in the financial statements at 31 December 2016 amounted to €20 thousand (€16 thousand at 31 December 2015) and refer to payables to INPS recognised in December 2016 with reference to the fixed and variable remuneration of employees, as shown in the table below:
Payables to pension and social security institutions
Other payables recognised in the financial statements amounting to €146 thousand (€153 thousand at 31 December 2015), refer to the following:
Other payables: breakdown
Payables to corporate bodies refer to remuneration accrued by members of the Board of Directors (which are not paid to the parent) and the Board of Statutory Auditors during the year.
Payables to employees primarily originate from recognition under CDP RETI liabilities of deferred remuneration accrued by employees, and from adjustment at the year end of the provision for vacation accrued but not used.
(euros)
Items/Figures 31/12/2016 31/12/2015
Trade payables 40,043 46,330
Trade payables for invoices to receive 97,868 142,778
Total 137,910 189,107
(euros)
Items/Figures 31/12/2016 31/12/2015
Administrative services 316,702 278,852
Seconded personnel 856 16,983
Payables to directors to pay to CDP 35,082 83,617
Other payables 27,843 4,304
Total 380,482 383,756
(euros)
Items/Figures 31/12/2016 31/12/2015
Payables to INPS 18,749 15,535
Payables to INAIL 1,410 442
Total 20,159 15,977
(euros)
Items/Figures 31/12/2016 31/12/2015
Due to company bodies 124,521 127,446
Payables to employees 19,911 23,508
Payables to pension fund 1,893 1,873
Total 146,325 152,827

2016 FINANCIAL STATEMENTS •
167
II.4. REPORTING ON FINANCIAL INSTRUMENTS FOR IFRS P URPOSES
Assets and liabilities measured at fair value on a recurring basis: allocation by fair value levels
Assets and liabilities not measured at fair value o r measured at fair value on a non-recurring basis: allocation by fair value levels
(euros)
Items/Figures L1 L2 L3 L1 L2 L3
Non-current f inancial assets
Current financial assets
Total
Non-current f inancial liabilities
- Other financial liabilities 11,588,485 4,024,143
Current financial liabilities
Total 11,588,485 4,024,143
31/12/2016 31/12/2015
(euros)
Items/Figures CA L1 L2 L3 CA L1 L2 L3
Non-current assets
Current assets
- Current financial assets 10,990,000 10,990,000 4,330,000 4,330,000
- Cash and cash equivalents 101,550,915 101,550,915 371,842,079 339,690,942 32,151,137
Total 101,550,915 - 101,550,915 376,172,079 339,690,942 36,481,137
Non-current liabilities
- Loans 1,498,269,605 771,300,000 750,000,000 1,497,971,287 749,876,250 750,000,000
Current liabilities
- Current portion of loans 8,992,438 8,321,918 670,520 9,161,055 8,299,180 861,875
Total 1,507,262,042 779,621,918 750,670,520 1,507,132,342 758,175,430 750,861,875
31/12/2016 31/12/2015

• 2016 ANNUAL REPORT
168
II.5. OTHER INFORMATION
II.5.1. Guarantees issued and commitments
The Company did not issue any guarantees or make commitments recognised in the memorandum accounts.
II.5.2. Assets pledged as collateral for own debts and commitments
No collateral or guarantees were pledged either directly or indirectly in the interest of third parties.
II.5.3. Own securities portfolio deposited with thi rd parties
The 1,014,491,489 shares of SNAM S.p.A., the 599,999,999 shares of Terna S.p.A., and the 202,898,297 shares of Italgas S.p.A., owned by CDP RETI, are held at the parent company CDP.

2016 FINANCIAL STATEMENTS •
169
III - INFORMATION ON THE INCOME STATEMENT
III.1. PROFIT (LOSS) ON CORE BUSINESS
III.1.1. DIVIDENDS
Profit (loss) on core business comprises dividends from the investee SNAM (€253,622,872 as the balance of the 2015 dividend) and €121,260,000 from the investee Terna (€78,000,000 as the balance of the 2015 dividend and €43,260,000 as an advance on the 2016 dividend). Investee Italgas has not distributed any dividend in the period starting from the spin-off from SNAM taking effect on 7 November 2016 and year end.
Dividends: breakdown
III.2. PROFIT (LOSS) ON OPERATIONS
III.2.1. FINANCIAL INCOME
Financial income at 31 December 2016 amounted to €49 thousand (€206 thousand at 31 December 2015) and came mainly from interest income accrued on the commercial paper issued by CDP (subscribed and received by CDP RETI during the year) and on the bank current account.
Financial income: breakdown
(euros)
Items/Figures 2016 2015
Italgas S.p.A. dividend
SNAM S.p.A. dividend 253,622,872 253,622,872
Terna S.p.A. dividend 121,260,000 120,000,000
Total 374,882,872 373,622,872
(euros)
Items/Figures 2016 2015
Interest income on deposit contract w ith CDP 180,707
Interest income on CDP Commercial paper 21,855
Interest income on current bank account 27,639 24,568
Other interest income 699
Total 49,494 205,974

• 2016 ANNUAL REPORT
170
III.2.2. BORROWING EXPENSES
Borrowing expenses at 31 December 2016 relate to interest expense for the period, as detailed in the table below.
Borrowing expenses: breakdown
Other interest expense amounting to €3,498 thousand was recognised in relation to derivative hedging of cash flows amounting to €3,453 thousand and, for the remaining part, mainly in relation to the interest expense accrued in fulfilment of the guarantee agreement (CSA) entered into in conjunction with the signing of the CFH derivative.
III.2.3. ADMINISTRATIVE EXPENSES
“Administrative expenses” at 31 December 2016 amounted to €2,850 thousand (€4,127 thousand at 31 December 2015) and are broken down as follows into staff costs and other administrative expenses:
Administrative expenses: breakdown
Staff costs
Staff costs of €674,217 (€385,481 at 31 December 2015) are broken down as follows:
Staff costs: breakdown
(euros)
Items/Figures 2016 2015
Interest on Bridge to bond facility 5,144,992
Interest on Term facility 6,842,603 9,023,889
Interest on Bond 14,383,555 8,452,967
Other interest expense 3,498,263 1,442,658
Total 24,724,422 24,064,506
(euros)
Items/Figures 2016 2015
Staff costs 674,217 385,481
Other administrative expenses 2,176,006 3,741,658
Total 2,850,223 4,127,139
(euros)
Items/Figures 2016 2015
Employees 501,945 168,393
Other personnel in service
Board of Directors and Board of Auditors 171,416 162,130
Retired personnel
Recovery of expenses for employees seconded to other companies
Reimbursement of expenses for third-party employees seconded to the Company 856 54,958
Total 674,217 385,481

2016 FINANCIAL STATEMENTS •
171
Average headcount
The average headcount broken down by job category is illustrated in the following table:
Average headcount
Other administrative expenses
Other administrative expenses: breakdown
The professional and financial services mainly include professional legal and strategic consulting services connected with the spin-off of Italgas from SNAM.
The 2016 fees for the independent auditors PricewaterhouseCoopers S.p.A., as provided by Article 149 - duodecies, paragraph 2, of Consob Resolution no. 11971 of 14 May 1999, as amended, are summarised below:
Independent auditors’ fees:
III.3. OTHER OPERATING INCOME (COSTS)
III.3.1 OTHER INCOME
This item, with a balance of €24,404 (€1 at 31 December 2015), mainly refers to the charge-back to State Grid International Development of the costs incurred by CDP RETI for the audit performed on behalf of State Grid on the reporting package at 31 December 2015.
Items/Figures 2016 2015
Senior Managers
Middle Managers 3 2
Off ice staff 1 1
Manual w orkers
Total 4 3
(euros)
Items/Figures 2016 2015
Professional and f inancial services 1,731,488 3,386,195
Outsourcing CDP 341,334 302,276
General and administrative services 14,288 11,732
Utilities, taxes and other expenses 88,896 41,455
Total 2,176,006 3,741,658
(euros)
Type of service/Values Service Provider Fees for the year
Auditing 123,472
Certif ication 81,740
Other services 38,430
Total 243,642
Pricew aterhouseCoopers SpA

• 2016 ANNUAL REPORT
172
Other income: breakdown
III.4. INCOME TAXES, CURRENT AND DEFERRED TAXES
III.4.1 INCOME TAXES, CURRENT AND DEFERRED TAXES
Taxes for 2016 are detailed below:
Income taxes: breakdown
The current income taxes reflect the “income from participation in the tax consolidation mechanism” arising from payment of the excess ACE incentive (€7,248 thousand) and the payment (€977 thousand) of the interest expenses not deductible on an individual basis transferred to the tax consolidation mechanism51 in accordance with the provisions of the related tax consolidation agreement. As a balancing entry for this income, the Company recognised a receivable for the same amount from the parent company CDP.
The “change in current taxes from previous years” are mainly due to recalculation – following studies undertaken in 2016 with the Tax Authorities – of the ACE incentive previously transferred (and paid in) to the tax consolidation mechanism, with a consequently negative impact of about €2,084 thousand. This effect was only partly offset by the positive impact (€188 thousand) connected with the transfer to the tax consolidation mechanism of excess interest expenses not deductible on an individual basis in previous tax years, considering the existence of excess Gross Operating Profit (GOP)52 transferred to the tax consolidation mechanism by other CDP Group companies.
51 In consequence of its participation since 2013 in the national tax consolidation mechanism of the CDP Group, which allows calculation of IRES on a
consolidated basis for the companies that exercised the option for group taxation, CDP RETI may transfer to the tax consolidation mechanism the excess ACE incentive not used on an individual basis (i.e. deducting it from its own taxable income), consequently obtaining a gain compared to the tax rate in force at that time (27.5% until 31 December 2016 and 24% beginning from 2017). Moreover, again in consequence of its participation in the tax consolidation mechanism, CDP RETI may transfer any excess interest expenses not deductible on an individual basis if and to the extent to which other entities (participating in the tax consolidation mechanism) report excess GOP (Gross Operating Profit) for the same tax period transferable to the Group. In exchange for the transfer of these interest expenses, CDP RETI obtains a gain resulting from lower IRES at the Group level and equal to 50% of the applicable tax year.
52 Difference between the Value of production and Costs of production net of depreciation and amortisation and instalment payments on finance leases of capital goods.
(euros)
Items/Figures 2016 2015
Other income 24,404 1
Other expenses
Totale 24,404 1
(euros)
Items/Figures 2016 2015
1. Current taxes (-) 8,225,701
- of which income from participation in the tax consolidation mechanism 8,225,701
2. Change in current taxes from previous years (+/-) (1,896,222) 12,663,885
3. Reduction of current taxes for the year (+)
4. Change in deferred tax assets (+/-) (17,654) 26,053
5. Change in deferred tax liabilities (+/-)
6. Taxes for the year (-) (-1+/-2+3+/-4+/-5) 6,311,825 12,689,938

2016 FINANCIAL STATEMENTS •
173
The reconciliation between the theoretical and actual tax liability is shown below:
Reconciliation between theoretical and actual tax l iability: IRES
Reconciliation between theoretical and actual tax l iability: IRAP
(euros)
Items/Figures 31/12/2016 Tax rate
Income (loss) before taxes 347,382,125 Tax rate
IRES theoretical tax liability (rate 27.5%) (95,530,084) -27.50%
Increases in taxes
- non-deductible temporary differences (26,147) -0.01%
- non-deductible permanent dif ferences on interest expenses (6,785,601) -1.95%
- non-deductible permanent dif ferences (6,680) 0.00%
Decreases in taxes
- dividends 95% exempt 98,138,258 28.25%
- ACE benefit 11,418,078 3.29%
- excess f inancial expenses 977,404 0.28%
- other 40,474 0.01%
IRES Actual tax liability 8,225,701 2.37%
(euros)
Items/Figures 31/12/2016 Tax rate
Difference between revenues and production costs (2,440,799)
IRAP Theoretical tax liability (5.57% rate) 135,953 -5.57%
Increases in taxes (69,719) n/s
Decreases in taxes 1,398,434 n/s
IRAP Actual tax liability 0 n/s

• 2016 ANNUAL REPORT
174
IV – INFORMATION ON RISKS AND RELATED HEDGING POLICIES
CDP RETI, as holder of significant equity investments, is affected by the risk profiles of its investee companies. The monitoring of these risks, based on the rigorous system of measurement and control, is performed in the first instance by the Directors in assessing the recoverability of investments made that, for the financial statements, is reflected in the measurement of the carrying value of equity investments. The risk profiles are, moreover, constantly measured based on the volatility of the market price of the related shares.
The company also relies on the operational support of the parent CDP under the service contracts in place. More specifically, risk management is coordinated at group level in collaboration with the Equity Investments Area and the other relevant units of CDP.
The following key risks have been identified:
IV.1. MARKET RISK
CDP RETI is exposed to market risk, specifically the interest risk, i.e., the risk of fluctuations in the fair value or the cash flows of financial instruments due to changes in market interest rates.
In the table below, financial indebtedness is broken down by fixed and variable rate at 31 December 2016, with 2015 corresponding figures:
The company entered into an Interest rate swap on the Term loan, used to convert the variable rate loan into a fixed rate one. The notional amount of the current derivative is Euro 750 million, while the year-end fair value is negative by Euro 11,588 thousand (31 December 2015: Euro 4,024 thousand).
IV.2. RISK RELATED TO THE FINANCIAL PERFORMANCE AND OPERATING RESULTS OF SNAM, TERNA AND ITALGAS
Given that the company is a financial holding company, its performance and liquidity are affected by the ability of its subsidiaries to pay out dividends, which is in turn influenced by the financial status and operating results of the SNAM Group, the TERNA Group and the ITALGAS Group. Consequently, any significant change in these two parameters could have an adverse impact on the financial status and operating results of CDP RETI.
IV.3. RISK RELATED TO THE LIMITS IN THE TRANSFER OF FINANCIAL RESOURCES FROM SNAM, TERNA AND ITALGAS
The financial position and operating results of CDP RETI, as already mentioned, depend on the flow of funds from SNAM, TERNA and ITALGAS, in the form of dividends. This availability depends not only on the ability of SNAM, TERNA and ITALGAS to generate sufficient cash flow, but also on the ability of the three groups to overcome any legal and contractual restrictions on the distribution of dividends. For example these may include: i) regulatory impediments to fee increases, ii)
(euros)
Items/Figures Total % Total %
Fixed interest 756,591,522 50.2% 756,270,467 50.2%
Variable interest 750,670,520 49.8% 750,861,875 49.8%
Total 1,507,262,042 100.0% 1,507,132,342 100.0%
31/12/2016 31/12/2015

2016 FINANCIAL STATEMENTS •
175
requests for substantial investments in the infrastructure that the three groups have under management, iii) compliance with covenants in loan agreements. Lastly, in more general terms, a further restriction could arise from future levels of tax.
As a result these restrictions, and the resulting reduction in cash inflows, could have a significant adverse impact on the parent company's ability to cover the cash outflows related to the outstanding bonds and loans.
As compared with 2016, modest growth is expected in 2017 for the dividends per share (DPS) that will be distributed by SNAM and TERNA as a result of the revised dividend policy at both companies. While SNAM has announced an increase of 2.5%, TERNA estimates that this increase will amount to 3%.
IV.4. LIQUIDITY AND CREDIT RISK
In relation to its business activities, the parent company is exposed to liquidity risk, namely the risk that, due to the inability of raising new funds or liquidating assets on the market, the Company may not be able to fulfil its payment commitments, resulting in an impact on income if the company is forced to sustain additional costs to meet such commitments or, an extreme consequence, a condition of insolvency that puts the continuation of company business at risk. Although the company's objective is to establish a financial structure that ensures an adequate level of liquidity and balance in terms of duration and composition of the debt, external factors cannot be ruled out such as an adverse market environment or heavy restrictions on access to bank credit. In such a scenario the Company may encounter difficulties in covering the cash outlays related to outstanding bonds and loans.
In any event, the entire debt of CDP RETI is bullet. Consequently, there is no risk of refinancing until 2020 (repayment of €750 million connected with the term loan) and 2022 (€750 million connected with the bond53).
IV.5. DEFAULT RISK AND DEBT COVENANTS
The risk of default consists in the possibility that the loan agreements underwritten contain provisions, that entail the possibility for the lender to activate contractual protections, which could result in the early repayment of the loan if specific circumstances occur, thereby generating a potential liquidity risk.
CDP RETI long-term loans provide for compliance with covenants that reflect international market practices. These covenants are related to:
1. Bond; 2. Bank debt (so called Term Loan Facility) entered into with a syndicate of banks on 29 September 2014 for an initial
amount of €275 million and currently at 412.5 million as a result of the refinancing in the month of May 2015; 3. Debt (so called Term Loan Facility) granted to the Company by the parent company CDP, entered into on 29 September
2014 for an initial amount of €225 million and currently at €337,5 million (refinancing in the month of May 2015).
The principal covenants relating to the issue of bonds are summarised below:
• “negative pledge” clauses, according to which the Issuer is subject to limitations on the creation or maintenance of restrictions on all or part of its assets or on its income to ensure debt, present or future, except for the circumstances expressly permitted;
• “change of control” clauses, under which bondholders have the option to require the Issuer to repay its bonds in the circumstance in which Cassa depositi e prestiti no longer has control over the company;
• “event of default” clauses, under which predetermined events (e.g. failure to pay, breach of contractual obligations, etc.) are considered to represent potential default and the loan in question falls immediately due; in addition, under the “cross default” clauses, the occurrence of a default event in respect of any financial debt (above a threshold level) issued by the Issuer also constitutes a default in respect of the loan concerned, which becomes immediately repayable.
The main covenants governing the loans granted by the pool of banks and the parent company Cdp, in addition to the covenants described in connection with the bond issue, mainly:
• an increase (from the current 1% to 1.5% potentially) in the spread applied to the interest rate if the credit rating assigned to CDP RETI reaches the level BB+ (or equivalent) or lower for at least one of the two agencies rating (Moody's or Fitch). In 2016 CDP RETI had a long-term “investment grade” credit rating both by Fitch (BBB), with stable
53 CDP RETI on 21 May 2015 closed the placement of a fixed rate bond issue, unsubordinated and unsecured, held by CDP by 45%. The bonds listed on the
Irish Stock Exchange and addressed to institutional investors, have a 7 year maturity with fixed annual coupon of 1.875% and re-offer price of 99.909%. The operation, managed by Banca Imi, Bnp Paribas, Hsbc, Mediobanca, Societe Generale e UniCredit, has been undertaken by around 150 institutional investors interested about an amount totalling over 2 billion euros

• 2016 ANNUAL REPORT
176
outlook, and Moody’s (Baa3). The latter changed the outlook of CDP RETI from stable to negative in consequence of the same change made by the agency to the rating of the Italian Republic on 7 December 2016;
• “pari passu” clauses, under which the Company, for the duration of the loans, will ensure that the payment obligations have the same degree as those relating to all other unsubordinated unsecured creditors, without prejudice to the legal privileges;
• reporting requirements, both periodic and occasional, on the occurrence of specified events; • compliance with the following financial covenants in order to avoid an event of default: o Loan To Value: ratio, expressed as a percentage, of (i) the financial debt (net of cash and cash equivalents) and
(ii) the market value (in the 180 days prior to the date of detection) of SNAM and TERNA shares. This ratio must not exceed 50%;
o Dividend Interest Coverage Ratio (DICR): ratio , with reference to the 12 months preceding the date of detection, of (i) the cash derived from dividends received and (ii) financial interest paid on debt. The ratio should be less than 1.25;
o Total Debt Service Amount (TDSA): at any time CDP RETI must have cash and cash equivalents available in an amount not lower than the interest, fees, commissions and other costs related to the financing that must be paid within the subsequent 6 months.
To mitigate these risks CDP RETI monitors the circumstances that could have adverse effects on its financial position and earnings, also from the perspective of complying with covenants in place on outstanding loans. With regard to the earnings and financial performance of the subsidiaries TERNA, SNAM and ITALGAS, CDP RETI carefully monitors their results, with particular attention to all the aspects that could have impacts on the dividend distribution policies.
As regards liquidity, periodic discussions are also held with the Parent Company CDP, in terms of assessing the need for establishing credit facilities.
In any case, at 31 December 2016 there are no tensions in terms of liquidity, since CDP RETI received dividends in the period from its subsidiaries totalling about €375 million and at 31 December 2016 its cash and cash equivalents stood at approximately €102 million.

2016 FINANCIAL STATEMENTS •
177
V – TRANSACTIONS WITH RELATED PARTIES
V.1. INFORMATION ON THE REMUNERATION OF KEY MANAGEM ENT PERSONNEL
Remuneration of key management personnel
Remuneration of directors and statutory auditors
(euros)
Items/Figures
a) short-term benefits 99,740 63,440 122,590
b) post-employment benefits
c) other long-term benefits
d) severance benefits
e) share-based payments
Total 99,740 63,440 122,590
Board o f Directors Board o f AuditorsKey management
personnel
(euros)
Name
Directors
Franco Bassanini Chairman 01/01/2016-31/12/2016 2016 20,000
Leone Pattofatto Chief Executive Off icer 01/01/2016-31/12/2016 2016 20,000 (2)
Ludovica Rizzotti Director 01/01/2016-25/03/2016 2016 4,658
Cristiana Procopio Director 31/03/2016-31/12/2016 2016 15,082 (2)
Jun Yu Director 01/01/2016-31/12/2016 2016 20,000 (3)
Yunpeng He Director 01/01/2016-31/12/2016 2016 20,000 (3)
Board of Auditors
Guglielmo Marengo Chairman 01/01/2016-31/12/2016 2016 25,376
Francesca Di Donato Auditor 01/01/2016-31/12/2016 2016 19,032
Paolo Sebastiani Auditor 01/01/2016-31/12/2016 2016 19,032
(3) Compensation is paid to State Grid International Development Limited
Position Period in o ffice Expiry of o ffice (1)Compensation and
bonuses
(1) Date o f Shareholders' M eeting called to approve financial statements for the year
(2) Compensation paid to Cassa depositi e prestiti S.p.A.

• 2016 ANNUAL REPORT
178
V.2. INFORMATION ON TRANSACTIONS WITH RELATED PARTI ES
The Company is managed and coordinated by CDP, the majority shareholder.
The CDP Group did not carry out any atypical or unusual transactions with related parties whose size could have an impact on the financial position or performance of the Company. All transactions with related parties were carried out on an arm's length basis and form part of the ordinary operations of CDP RETI.
Transactions with the parent company
Transactions with CDP in 2016, which are summarised in the preceding table, concerned the following:
• the deposit agreement with the parent company CDP; • the cash flow hedge derivative contract with regard to which, at 31 December 2016, the related liability and interest
expense were recognised at fair value; • the receivable deriving from the CSA financial transactions related to the derivative contract;
(euros)
Items/Figures 31/12/2016 31/12/2015
Assets
- Deposit balance 973 25,898
- Receivable for tax consolidation (w ithholding tax) 35,119 27,933
- Receivable for tax consolidation 6,329,479
- Receivable for CSA financial transactions 10,990,000 4,330,000
- Commercial Paper 339,690,942
Liabilities
- Payables for seconded personnel (856) (16,984)
- Payables for directors' compensation to pay to CDP (35,082) (83,617)
- Payables for outsourced services (316,702) (275,192)
- Other payables (27,843) (7,963)
- CFH derivative agreement (11,588,485) (4,024,143)
- Loans:
included in current liabilities (4,046,597) (4,122,475)
included in non-current liabilities (674,221,322) (674,087,079)
Revenues
- Interest income on deposit contract 180,707
- Interest income on CSA financial transactions 415
- Interest income on Commercial Paper 21,855 284
Costs
- Interest expense on CDP loan (9,551,771) (10,179,832)
- Interest expense on CFH (3,453,438) (1,440,438)
- Interest expense on CSA (44,809) (2,220)
- Outsourced services rendered to CDP RETI (341,334) (302,276)
- Costs for personnel seconded to CDP RETI (856) (16,984)
- Costs for directors' compensation to pay (35,082) (35,014)
- Other personnel costs (9,315) (3,233)
- Other costs (15,243)
- Commissions for loan structuring (858,024)
Cash flows
Cash f low from operating activities (19,895,092) 7,081,940
Net cash f low from investing activities - -
Net cash f low from financing activities (361,306,621) (111,760,172)

2016 FINANCIAL STATEMENTS •
179
• the commercial paper issued by CDP and subscribed by CDP RETI on 29 July 2016 and received on 17 November 2016;
• the receivables and payables arising from the participation of CDP RETI in the tax consolidation mechanism; • the payables related to the amounts subscribed by CDP with reference to the Term Loan and the bond issue, as well
as the interest accrued thereon; • outsourcing services provided by CDP to CDP RETI; • the cost of CDP personnel seconded to the Company; • the remuneration of directors paid to the Parent Company.
Transactions with other related companies
Cash flow from operating activities mainly include collection of dividends distributed by subsidiaries.
During the year, the Company also put in place transactions with Fintecna SpA, originating from the lease of office premises on Via Versilia, in Rome.
V.3. KEY DATA OF THE COMPANY PERFORMING MANAGEMENT AND COORDINATION
In compliance with Article 2497-bis, paragraph 4 of the Italian Civil Code, key data from the last financial statements of the parent company Cassa depositi e prestiti S.p.A. are reported in Annex 2.
(euros)
Items/Figures 31/12/2016 31/12/2015
Assets
- Receivables for personnel transfer 25,425
Costs
- Costs for personnel seconded to CDP RETI (37,974)
- Rental costs (80,850) (40,260)
Cash flows
Cash f low from operating activities 374,827,777 373,570,063
Net cash f low from investing activities
Net cash f low from financing activities

• 2016 ANNUAL REPORT
180
VI – NON-RECURRING EVENTS AND SIGNIFICANT TRANSACTIONS
Pursuant to Consob memorandum no. DEM/6064293 of 28 July 2006, no non-recurring events and significant transactions occurred during the year54, except for the spin-off of ITALGAS, for which reference is made to the specific section in the Report on Operations.
54 Transactions whose occurrence is not recurrent or transactions or events that are not frequently repeated in the course of ordinary operations.

2016 FINANCIAL STATEMENTS •
181
VII – SEGMENT REPORTING
In accordance with the guidelines provided in IFRS 8 – Operating Segments, for those companies that publish the consolidated financial statements of a parent company and the separate financial statements of that parent company in a single document, segment reporting is given only in reference to the consolidated financial statements. Therefore, reference is made to the analogous part of the Notes to the Financial Statements of the CDP RETI Group.

• 2016 ANNUAL REPORT
182
PROPOSED ALLOCATION OF 2016 NET INCOME
The Board of Directors proposes, for 2016, to distribute a total dividend of €353,693,048.04 of which 253,000,375.02 approved as an interim dividend on 15 November 2016.
The Board of Directors proposes, therefore, to allocate the net profit for FY 2016 of CDP RETI S.p.A., totalling €353,693,950.14, as follows:
• €253,000,375.02 to cover the account paid on the dividend no later than 25 November 2016; • €100,692,673.02 to pay the balance of the dividend to be distributed in the amount of € 623.43 for each of the 161,514
shares to be assigned for payment - gross of any statutory withholdings – on 26 May 2017; • €902.10 as profit carried forward.
The Shareholders’ Meeting will be held on May 4, 2017 to deliberate upon CDP RETI S.p.A. 2016 Annual Report and net profit allocation.
The Shareholders’ Meeting will be also called to deliberate on the renewal of the Board of Directors and the board of Statutory Auditors, that will expire on the occasion of the approval of the 2016 Annual Report.
2016 FINANCIAL STATEMENTS •
183
ANNEXES
ANNEX 1
Analytical list of equity investments
ANNEX 2
Separate financial statements at 31 December 2015 of Cassa depositi e prestiti S.p.A.

• 2016 ANNUAL REPORT
184
ANNEX 1
Analytical list of equity investments
(euros)
A. Listed entities Names Registered office % holding Carryng amount Type
Italgas S.p.A. Milano 25.08% 589,284,378 Control
SNAM SpA San Donato Milanese (MI) 28.98% 2,930,945,734 Control
TERNA S.p.A. Roma 29.85% 1,315,200,000 Control

2016 FINANCIAL STATEMENTS •
185
ANNEX 2
Cassa depositi e prestiti società per azioni
Registered office in Rome, Via Goito no. 4, Tax Code 80199230584
BALANCE SHEET (euros)
Assets 31/12/2015 31/12/2014
10. Cash and cash equivalents 2,932 3,431
20. Financial assets held for trading 200,501,673 298,681,592
40. Financial assets available for sale 7,578,552,942 6,907,788,220
50. Financial assets held to maturity 24,577,265,251 21,339,001,554
60. Loans to banks 25,207,955,489 26,507,878,599
- of which segregated asset pool 406,691,544 315,157,507
70. Loans to customers 257,105,038,483 263,886,601,722
80. Hedging derivatives 789,378,295 683,756,741
100. Equity investments 28,138,171,456 29,037,562,809
110. Property, plant and equipment 252,558,181 231,831,135
120. Intangible assets 5,349,273 5,653,001
130. Tax assets 809,946,549 914,169,425
a) current 467,581,492 688,383,445
b) deferred 342,365,057 225,785,980
150. Other assets 234,235,232 391,703,034
Total assets 344,898,955,756 350,204,631,263
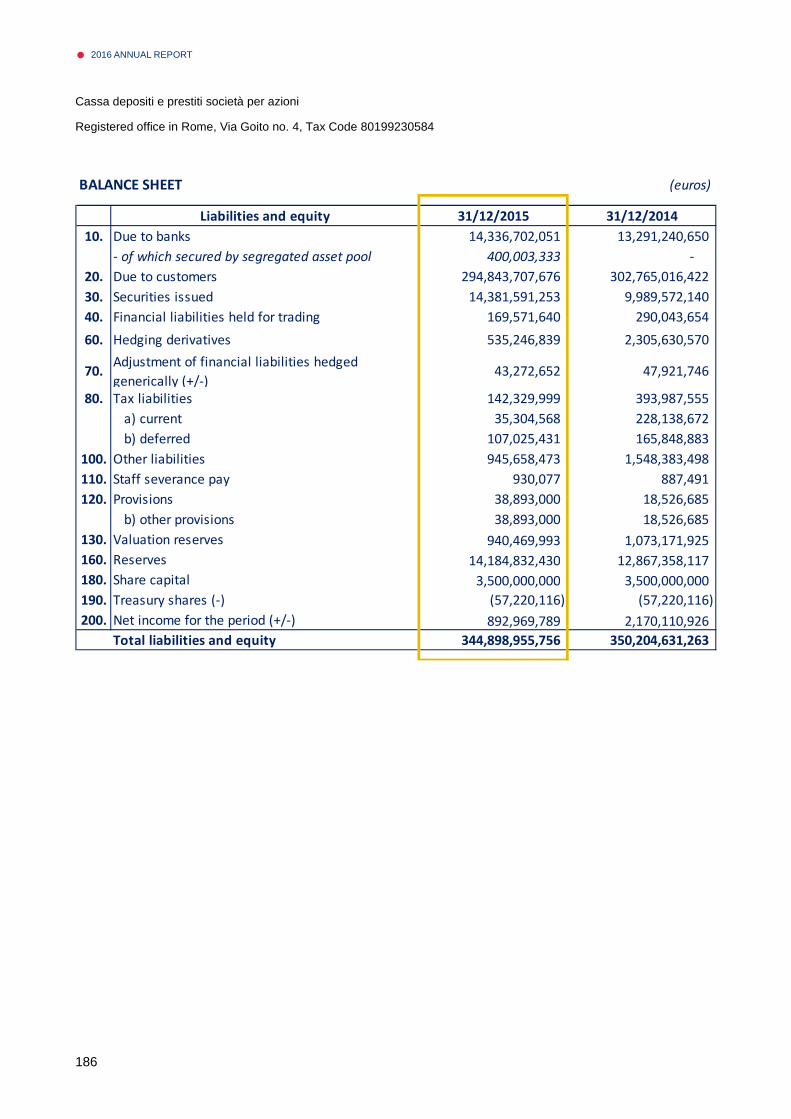
• 2016 ANNUAL REPORT
186
Cassa depositi e prestiti società per azioni
Registered office in Rome, Via Goito no. 4, Tax Code 80199230584
BALANCE SHEET (euros)
Liabilities and equity 31/12/2015 31/12/2014
10. Due to banks 14,336,702,051 13,291,240,650
- of which secured by segregated asset pool 400,003,333 -
20. Due to customers 294,843,707,676 302,765,016,422
30. Securities issued 14,381,591,253 9,989,572,140
40. Financial liabilities held for trading 169,571,640 290,043,654
60. Hedging derivatives 535,246,839 2,305,630,570
70.Adjustment of financial liabilities hedged
generically (+/-)43,272,652 47,921,746
80. Tax liabilities 142,329,999 393,987,555
a) current 35,304,568 228,138,672
b) deferred 107,025,431 165,848,883
100. Other liabilities 945,658,473 1,548,383,498
110. Staff severance pay 930,077 887,491
120. Provisions 38,893,000 18,526,685
b) other provisions 38,893,000 18,526,685
130. Valuation reserves 940,469,993 1,073,171,925
160. Reserves 14,184,832,430 12,867,358,117
180. Share capital 3,500,000,000 3,500,000,000
190. Treasury shares (-) (57,220,116) (57,220,116)
200. Net income for the period (+/-) 892,969,789 2,170,110,926
Total liabilities and equity 344,898,955,756 350,204,631,263

2016 FINANCIAL STATEMENTS •
187
Cassa depositi e prestiti società per azioni
Registered office in Rome, Via Goito no. 4, Tax Code 80199230584
INCOME STATEMENT (euros)
10. Interest income and similar revenues 5,906,932,765 6,924,344,105
20. Interest expense and similar charges (5,001,806,401) (5,762,905,636)
30. Net interest income 905,126,364 1,161,438,469
40. Commission income 61,365,810 52,431,196
50. Commission expense (1,614,857,006) (1,643,658,781)
60. Net commission income (1,553,491,196) (1,591,227,585)
70. Dividends and similar revenues 1,538,444,005 1,846,798,798
80. Net gain (loss) on trading activities 69,670,039 13,164,361
90. Net gain (loss) on hedging activities 4,504,139 (44,393,865)
100. Gains (losses) on disposal or repurchase of: 399,986,163 339,792,976
a) loans 67,284,144 57,922,885
b) financial assets available for sale 332,691,751 281,870,091
c) financial assets held to maturity 10,268 -
120. Gross income 1,364,239,514 1,725,573,154
130. Net impairment adjustments of: (95,628,198) (130,744,682)
a) loans (101,827,650) (113,031,124)
b) financial assets available for sale (26,800) -
d) other financial transactions 6,226,252 (17,713,558)
140. Financial income (expense), net 1,268,611,316 1,594,828,472
150. Administrative expenses: (130,723,327) (128,240,736)
a) staff costs (71,653,920) (65,479,924)
b) other administrative expenses (59,069,407) (62,760,812)
160. Net provisions (18,486,007) (1,628,032)
170. Net adjustments of property, plant and equipment (4,575,292) (4,822,935)
180. Net adjustments of intangible assets (2,246,874) (2,242,113)
190. Other operating income (costs) (18,383,217) 4,164,148
200. Operating costs (174,414,717) (132,769,668)
210. Gains (losses) on equity investments (209,042,375) 938,066,437
240. Gains (losses) on the disposal of investments (5,479) (5,217)
250. Income (loss) before tax from continuing operations 885,148,745 2,400,120,024
260. Income tax for the period on continuing operations 7,821,044 (230,009,098)
270. Income (loss) after tax on continuing operations 892,969,789 2,170,110,926
290. Income (loss) for the period 892,969,789 2,170,110,926
31/12/201431/12/2015

• 2016 ANNUAL REPORT
188
Cassa depositi e prestiti società per azioni
Registered office in Rome, Via Goito no. 4, Tax Code 80199230584
STATEMENT OF COMPREHENSIVE INCOME (euros)
31/12/2015 31/12/2014
10. Income (loss) for the period 892,969,789 2,170,110,926
Other comprehensive income net of taxes transferred to income
statement
90. Cash flow hedges (7,586,917) 11,676,230
100. Financial assets available for sale (125,115,015) 86,312,872
130. Total other comprehensive income net of taxes (132,701,932) 97,989,102
140. Comprehensive income (items 10+130) 760,267,857 2,268,100,028

2016 FINANCIAL STATEMENTS •
189
REPORT OF THE BOARD OF AUDITORS
CDP RETI S.p.A.
Registered offices: Rome – Via Goito n. 4
Rome Company Register, Tax Code and VAT: no. 12084871008
Enrolled in the Rome CCIAA no. REA RM-1349016
Fully paid-in share capital € 161,514.00
Company under the co-ordination and management of
Cassa Depositi e Prestiti S.p.A. - Roma
* * *
REPORT OF THE BOARD OF STATUTORY AUDITORS
ON THE FINANCIAL STATEMENTS AS OF 31 DECEMBER 2016
PURSUANT TO ART. 2429, 2ND PARAGRAPH
OF THE ITALIAN CIVIL CODE
Dear Shareholders,
Preliminarily we would like to remind you that the Board of Statutory Auditors, in its current
composition, has been appointed on 27 November 2014 for the three-year period until the approval
of the 2016 financial statements.
The Board of Statutory Auditors has prepared this report pursuant to art. 2429 of the Italian Civil
Code, since the Company, on the basis of its By-Laws, has appointed as legal auditor of the accounts,
as provided for by art. 13 of Legislative Decree dated 27 January 2010, no. 39 the Audit Firm
PricewaterhouseCoopers S.p.A..

• 2016 ANNUAL REPORT
190
This report has been collectively approved, within the useful time to file the same with the Company,
in the 15 days before the date of the first summoning of the Shareholders’ meeting held to approve
the financial statements at hand.
The Board of Directors has made available the following documents approved on 31 March 2017,
related to the financial year ended as of 31 December 2016:
- draft financial statements for the year and consolidated financial statements, accompanied by
the relevant illustrative notes;
- Management Report.
The format of this report is compliant with the provisions of law and with the Rule no. 71 of the
“Rules of Conduct for the Board of Statutory Auditors – Conduct principles for Boards of Statutory
Auditors of non-quoted companies” issued by the CNDCEC.
Knowledge of the Company and risk evaluation
Recognizing the consolidated knowledge that the Board of Statutory Auditors declares to have on the
Company and with regard to:
• the type of business carried out;
• its organizational and accounting structure;
taking also into account the size and issues of the Company, it is herewith highlighted that the
“planning” phase of the supervisory activity – in which it is necessary to evaluate the intrinsic risks
and the criticalities related to the two above-mentioned parameters – has been carried out through the
positive correspondence regarding the known facts based on information acquired over time.
This report therefore summarizes the activity envisaged by art. 2429, par. 2 of the Italian Civil Code,
with a focus on:
• the result of the financial year;
• the activity performed in the carrying out of the duties envisaged by the provisions of law;
• the observations and proposals on the financial statements, with particular reference to the
2016 FINANCIAL STATEMENTS •
191
possible use by the Board of Directors of the exception provided for by art. 2423, par. 4 of the
Italian Civil Code;
• possible reports by the Shareholders, pursuant to art. 2408 of the Italian Civil Code.
The activities of the Board of Statutory Auditors have regarded, from a temporal point of view, the
entire financial year and, during the same financial year, the meetings envisaged by art. 2404 of the
Italian Civil Code have been regularly held and for such meetings the relevant minutes have been
prepared and duly undersigned by unanimous approval.
Activity carried out
During the periodical controls, the Board of Statutory Auditors has been informed about the evolution
of the Company’s business, paying particular attention to contingent and/or extraordinary issues, in
order to evaluate their economic and financial impact on the result for the financial year and on the
assets, as well as any possible risk.
Therefore, the Board of Statutory Auditors has periodically evaluated the adequateness of the
organizational and functional structure of the Company and any possible change to the same, arising
from minimal needs generated by the business.
The relationships with those operating in the above-mentioned structure – Directors, Employees and
Legal Auditors – have been inspired by the reciprocal collaboration, always respecting the roles
assigned, after having clarified the Board of Statutory Auditors’ duties.
The information required by art. 2381, par. 5 of the Italian Civil Code, has been provided by the
Board of Directors with a frequency even higher than the fixed minimum of six months; this has
happened in occasion of both the planned controls and the Board of Statutory Auditors’ meetings at
the Company’s premises; from the above it can be inferred that the Directors have, both formally and
substantially, respected their duties under the mentioned provision of law.
In conclusion, as far as it has been possible to acknowledge during the activities performed throughout
the financial year, the Board of Statutory Auditors can state that:

• 2016 ANNUAL REPORT
192
• the resolutions taken by the Shareholders and the Board of Directors are compliant with the law
and with the Company’s By-Laws and have not been manifestly imprudent or such as to
jeopardize the integrity of the corporate assets;
• sufficient information has been acquired with regard to general business trends and their
foreseeable evolution, as well as to the most significant operations, by size or characteristics,
carried out by the Company;
• also the operations carried out are compliant with the law and not potentially in contrast with the
resolutions taken by the Shareholders’ meeting or such as to jeopardize the integrity of the
corporate assets;
• there are no specific observations regarding the organizational structure of the Company, nor on
the adequateness of the administrative and accounting system, as well as on this latter’s reliability
to correctly represent the business facts. With particular reference to the organizational structure,
the Company has continued to use, through contractual agreements with the parent company CDP,
all the necessary competences and services provided by the same, to correctly carry out its
business;
• during the supervisory activity, as above described, no further significant fact has emerged, such
as to be mentioned in this report;
• it has not been necessary to intervene for omissions by the Board of Directors, as per art. 2406 of
the Italian Civil Code;
• no report has been filed pursuant to art. 2408 of the Italian Civil Code;
• no report has been filed pursuant to art. 2409, par. 7 of the Italian Civil Code;
• during the financial year, the Board of Statutory Auditors has issued the opinions provided for by
the law and, more in detail, the motivated proposal for the appointment of the legal auditor of
accounts pursuant to articles 13, 14 and 16 of Legislative Decree no. 39/2010, issued on 19 June
2015 and the opinion related to the appointment of the Financial Reporting Officer issued on 10

2016 FINANCIAL STATEMENTS •
193
September 2015 pursuant to art. 154-bis of Legislative Decree dated 24 February 1998, no. 58.
Observations and proposals related to the financial statements and to their approval
With regard to the draft financial statements for the year ended on 31 December 2016, the following
is to be noted:
a) the financial statements at hand have been prepared in compliance with the international accounting
standards adopted with the EC Regulation no. 1606 of 19 July 2002 and enforced into the Italian
provisions of law with Legislative Decree no. 38 of 28 February 2005;
b) the correct representation of the business facts into the accounting records and their inclusion in
the financial statements, according to the IFRS (which include IAS) standards, have been checked by
the Audit Firm, in charge of the legal audit of accounts;
c) the financial statements as of 31 December 2016 show a profit for the year of € 353,693,950 and a
net worth of € 3, 438,142,010. The profit for the year, with regard to the positive income elements,
depends on dividends and revenues from the tax consolidation, offset by negative income elements,
mainly financial charges.
The draft financial statements have been then analyzed; in this regard, please find herewith below the
following further information:
• the evaluation criteria of the assets and liabilities subject to such binding need, have been
controlled and are not substantially different from those adopted in the previous years, in
compliance with the reference accounting principles;
• we have paid attention to the general setting of the financial statements, to their general
compliance with the law, with regard to their formation and structure and in this respect there are
no observations to be included in this report;
• we have verified the observance of the provisions of law regarding the preparation of the
Management Report and in this respect there are no observations to be included in this report;
• the Board of Directors, in preparing the financial statements, has made no exceptions to the

• 2016 ANNUAL REPORT
194
provisions of law, pursuant to art. 2423, par. 4 of the Italian Civil Code;
• we verified that the financial statements correspond to the facts and information we are aware of
as a consequence of the carrying out of our duties as Board of Statutory Auditors and in this regard
we have no further comments to make.
With regard to the aspects under the responsibility of the Board of Statutory Auditors, the following
relevant facts occurred during the financial year are to be highlighted:
• signature of the “Italgas Shareholders’ Agreement” among CDP Reti, SNAM and CDP GAS
executed on 20 October 2016 (effective from the demerger);
• partial proportional demerger of the share held by SNAM in Italgas Reti effective from 7
November 2016;
• Shareholders’ Meeting held on 15 November 2016, which resolved the changes to the By-Laws
for the inclusion of the modified corporate structure and the relevant Shareholders’ Agreements.
The Board of Statutory Auditors has been assured that the Audit Firm is independent pursuant to the
provisions of articles 10 and 17 of Legislative Decree no. 39/2010 and the relevant implementing
regulations.
In compliance with the provisions of articles 2497 and following of the Italian Civil Code, the
Company has provided in the illustrative notes information about its being subject to the management
and coordination of another entity. In particular, it has been confirmed that the Shareholder Cassa
Depositi e Prestiti S.p.A. the entity carrying out such management and coordination activity.
On the occasion of the audit of the financial statements, the Board of Statutory Auditors has discussed
with the Audit Firm the results of the audits performed and has acknowledged the activities carried
out during the financial period of reference. The Audit Firm has not expressed specific observations
on the financial statements as of 31 December 2016. In fact, in this regard, no finding is included in
the relevant report prepared by the same.

2016 FINANCIAL STATEMENTS •
195
Conclusions
Based on the above and as far as the Board of Statutory Auditors is concerned and has verified from
the periodical controls carried out, it is unanimously deemed that there no obstacles to your approval
of the draft financial statements for the period ended on 31 December 2016, as prepared by the Board
of Directors, sharing the opinion of the same Board with regard to the allocation of the profit for the
year.
While thanking you for your trust, the Board of Statutory Auditors would like to remind you that with
the Shareholders’ Meeting summoned for the approval of the financial statements for the period ended
on 31 December 2016, its appointment shall come to its natural expiry date.
Rome, 18 April 2017
The Board of Statutory Auditors
Dott. Guglielmo Marengo
Dott.ssa Francesca Di Donato
Dott. Paolo Sebastiani
This is an English courtesy translation of the original documentation prepared in Italian language. Please consider that only the original version in Italian language has legal value.

• 2016 ANNUAL REPORT
196
REPORT OF THE INDEPENDENT AUDITORS

2016 FINANCIAL STATEMENTS •
197

• 2016 ANNUAL REPORT
198
CERTIFICATION OF THE SEPARATE FINANCIAL STATEMENTS PURSUANT TO ART. 154 BIS OF LEGISLATIVE DECREE 58/1998
1. The undersigned Leone Pattofatto, in his capacity as Chief Executive Officer, and Alessandro Uggias, in his capacity as the manager responsible for the preparation of the financial reports of CDP RETI S.p.A., hereby certify, taking account of the provisions of Article 154-bis.3 and 4, of Legislative Decree 58 of 24 February 1998:
• - the appropriateness with respect to the characteristics of the company and • - the effective adoption
of the administrative and accounting procedures for the preparation of the separate financial statements in 2016.
2. The assessment of the appropriateness of the administrative and accounting procedures followed in preparing the separate financial statements at 31 December 2016 was based on a process developed by CDP RETI S.p.A. in line with the Internal Control – Integrated Framework issued by the Committee of Sponsoring Organisations of the Treadway Commission, which is a generally accepted framework at the international level;
3. In addition, we certify that:
3.1 the separate financial statements at 31 December 2016:
a) have been prepared in compliance with the international accounting standards adopted in the European Union pursuant to Regulation (EC) no. 1606/2002 of the European Parliament and of the Council of 19 July 2002;
b) correspond to the information in the books and other accounting records;
c) provide a true and fair representation of the performance and financial position of the issuer;
3.2 the report on operations contains a reliable analysis of operations and performance, as well as the situation of the issuer, together with a description of the main risks and uncertainties to which it is exposed.
Rome, 18 April 2017
Chief Executive Officer Financial Reporting Manager
/signature/Leone Pattofatto /signature/Alessandro Uggias

2016 FINANCIAL STATEMENTS •
199

• 2016 ANNUAL REPORT
200
CDP RETI S.p.A.
Registered office
Via Goito 4
00185 Rome
Share capital euro 161.514,00 fully paid-in
Rome Chamber of Commerce REA 1349016
Fiscal Code, Company Registrar and VAT no.12084871008
The company is managed and coordinated by Cassa depositi e prestiti società per azioni, Via Goito n. 4, 00185 Rome – Share capital euro 4.051.143.264,00 fully paid-in – Rome Chamber of Commerce REA 1053767, Fiscal code and Company Registrar 80199230584 – VAT no. 07756511007


we promote the future