Embed Size (px)
Citation preview
CDP CLIMATECHANGEREPORT
2017
TABLE OF CONTENTS
CLIMATE CHANGE
CC0. INTRODUCTION 1371522233137
40465054575961
CC1. GOVERNANCECC2. STRATEGYCC3. TARGETS & INITIATIVESCC4. COMMUNICATIONSCC5. CLIMATE CHANGE RISKSCC6. CLIMATE CHANGE OPPORTUNITIESCC7. EMISSIONS METHODOLOGY
CC8. EMISSIONS DATACC9. SCOPE 1 EMISSIONS BREAKDOWNCC10. SCOPE 2 EMISSIONS BREAKDOWNCC11. ENERGYCC12. EMISSIONS PERFORMANCECC13. EMISSIONS TRADINGCC14. SCOPE 3 EMISSIONS
CDP Climate Change 2017 Information Request
PepsiCo, Inc.
Module: Introduction
Page: Introduction
CC0.1
Introduction
Please give a general description and introduction to your organization. PepsiCo products are enjoyed by consumers one billion times a day in more than 200 countries and territories around the world. PepsiCo generated approximately $63 billion in net revenue in 2016, driven by a complementary food and beverage portfolio that includes Frito-Lay, Gatorade, Pepsi-Cola, Quaker and Tropicana, including 22 brands that generate more than $1 billion each in estimated annual retail sales. At the heart of PepsiCo is Performance with Purpose – our goal to deliver top-tier financial performance while creating sustainable growth and shareholder value. In practice, Performance with Purpose means providing a wide range of foods and beverages from treats to healthy eats; finding innovative ways to reduce our impact on the environment and lower our operating costs; providing a safe and inclusive workplace for our employees globally; and respecting, supporting and investing in the local communities where we operate. Cautionary Statement - Statements in this submission that are “forward-looking statements” are based on currently available information, operating plans and projections about future events and trends. Terminology such as “aim,” “anticipate,” “believe,” “drive,” “estimate,” “expect,” “expressed confidence,” “forecast,” “future,” “goal,” “guidance,” “intend,” “may,” “objective,” “outlook,” “plan,” “position,” “potential,” “project,” “seek,” “should,” “strategy,” “target,” “will” or similar statements or variations of such terms are intended to identify forward-looking statements, although not all forward-looking statements contain such terms. Forward-looking statements inherently involve risks and uncertainties that could cause actual results to differ materially from those predicted in such forward-looking statements. Such risks and uncertainties include, but are not limited to: changes in demand for PepsiCo’s products; changes in, or failure to comply with, applicable laws and regulations; imposition or proposed imposition of new or increased taxes aimed at PepsiCo’s products; imposition of labeling or warning requirements on PepsiCo’s products; changes in laws related to packaging and disposal of PepsiCo’s products; PepsiCo’s ability to compete effectively; political conditions, civil unrest or other developments and risks in the markets where PepsiCo’s products are made, manufactured, distributed or sold; PepsiCo’s ability to grow its business in developing and emerging markets; unfavorable economic conditions in the countries in which PepsiCo operates; the ability to protect information systems against, or effectively respond to, a cybersecurity incident or other disruption; increased costs, disruption of supply or shortages of raw materials and other supplies; business disruptions; product contamination or tampering or issues or concerns with respect to product quality, safety and integrity; damage to PepsiCo’s reputation or brand image; failure to successfully complete or integrate acquisitions and joint ventures into PepsiCo’s existing operations or to complete or manage divestitures or refranchisings; changes in estimates and underlying assumptions regarding future performance that could result in an impairment charge; increase in income tax rates, changes in income tax laws or disagreements with tax authorities; failure to realize anticipated benefits from PepsiCo’s productivity initiatives or global operating model; PepsiCo’s ability to recruit, hire or retain key employees or a highly skilled and diverse workforce; loss of any key customer or changes to the retail landscape; any downgrade or potential downgrade of PepsiCo’s credit ratings; PepsiCo’s ability to implement shared services or utilize information technology
systems and networks effectively; fluctuations or other changes in exchange rates; climate change or water scarcity, or legal, regulatory or market measures to address climate change or water scarcity; failure to successfully negotiate collective bargaining agreements, or strikes or work stoppages; infringement of intellectual property rights; potential liabilities and costs from litigation or legal proceedings; and other factors discussed in the risk factors section of PepsiCo’s filings with the Securities and Exchange Commission. Investors are cautioned not to place undue reliance on any such forward-looking statements, which speak only as of the date they are made. PepsiCo undertakes no obligation to update any forward-looking statements.
CC0.2
Reporting Year
Please state the start and end date of the year for which you are reporting data. The current reporting year is the latest/most recent 12-month period for which data is reported. Enter the dates of this year first. We request data for more than one reporting period for some emission accounting questions. Please provide data for the three years prior to the current reporting year if you have not provided this information before, or if this is the first time you have answered a CDP information request. (This does not apply if you have been offered and selected the option of answering the shorter questionnaire). If you are going to provide additional years of data, please give the dates of those reporting periods here. Work backwards from the most recent reporting year. Please enter dates in following format: day(DD)/month(MM)/year(YYYY) (i.e. 31/01/2001).
Enter Periods that will be disclosed
Fri 01 Jan 2016 - Sat 31 Dec 2016
CC0.3
Country list configuration
Please select the countries for which you will be supplying data. If you are responding to the Electric Utilities module, this selection will be carried forward to assist you in completing your response.
Select country
CC0.4
Currency selection
Please select the currency in which you would like to submit your response. All financial information contained in the response should be in this currency. USD($)
CC0.6
Modules
As part of the request for information on behalf of investors, companies in the electric utility sector, companies in the automobile and auto component manufacturing sector, companies in the oil and gas sector, companies in the information and communications technology sector (ICT) and companies in the food, beverage and tobacco sector (FBT) should complete supplementary questions in addition to the core questionnaire. If you are in these sector groupings, the corresponding sector modules will not appear among the options of question CC0.6 but will automatically appear in the ORS navigation bar when you save this page. If you want to query your classification, please email [email protected]. If you have not been presented with a sector module that you consider would be appropriate for your company to answer, please select the module below in CC0.6.
Further Information
Module: Management
Page: CC1. Governance
CC1.1
Where is the highest level of direct responsibility for climate change within your organization?
Board or individual/sub-set of the Board or other committee appointed by the Board
CC1.1a
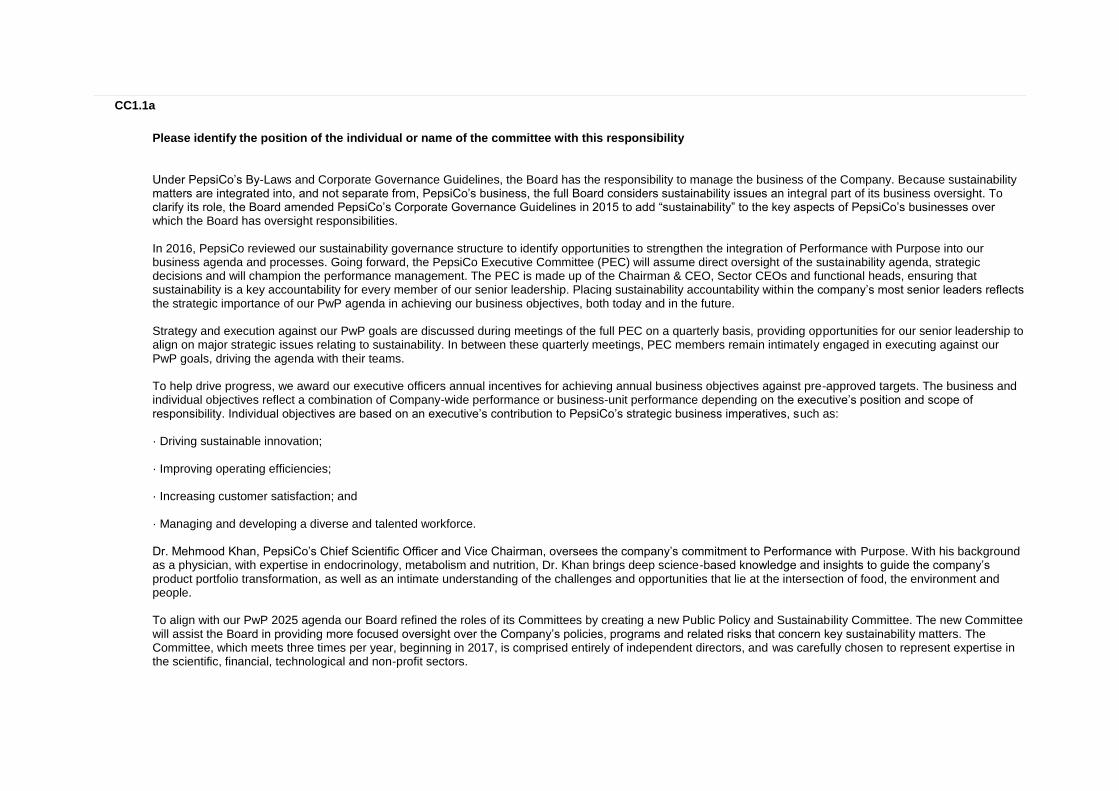
Please identify the position of the individual or name of the committee with this responsibility
Under PepsiCo’s By-Laws and Corporate Governance Guidelines, the Board has the responsibility to manage the business of the Company. Because sustainability matters are integrated into, and not separate from, PepsiCo’s business, the full Board considers sustainability issues an integral part of its business oversight. To clarify its role, the Board amended PepsiCo’s Corporate Governance Guidelines in 2015 to add “sustainability” to the key aspects of PepsiCo’s businesses over which the Board has oversight responsibilities. In 2016, PepsiCo reviewed our sustainability governance structure to identify opportunities to strengthen the integration of Performance with Purpose into our business agenda and processes. Going forward, the PepsiCo Executive Committee (PEC) will assume direct oversight of the sustainability agenda, strategic decisions and will champion the performance management. The PEC is made up of the Chairman & CEO, Sector CEOs and functional heads, ensuring that sustainability is a key accountability for every member of our senior leadership. Placing sustainability accountability within the company’s most senior leaders reflects the strategic importance of our PwP agenda in achieving our business objectives, both today and in the future. Strategy and execution against our PwP goals are discussed during meetings of the full PEC on a quarterly basis, providing opportunities for our senior leadership to align on major strategic issues relating to sustainability. In between these quarterly meetings, PEC members remain intimately engaged in executing against our PwP goals, driving the agenda with their teams. To help drive progress, we award our executive officers annual incentives for achieving annual business objectives against pre-approved targets. The business and individual objectives reflect a combination of Company-wide performance or business-unit performance depending on the executive’s position and scope of responsibility. Individual objectives are based on an executive’s contribution to PepsiCo’s strategic business imperatives, such as: · Driving sustainable innovation; · Improving operating efficiencies; · Increasing customer satisfaction; and · Managing and developing a diverse and talented workforce. Dr. Mehmood Khan, PepsiCo’s Chief Scientific Officer and Vice Chairman, oversees the company’s commitment to Performance with Purpose. With his background as a physician, with expertise in endocrinology, metabolism and nutrition, Dr. Khan brings deep science-based knowledge and insights to guide the company’s product portfolio transformation, as well as an intimate understanding of the challenges and opportunities that lie at the intersection of food, the environment and people. To align with our PwP 2025 agenda our Board refined the roles of its Committees by creating a new Public Policy and Sustainability Committee. The new Committee will assist the Board in providing more focused oversight over the Company’s policies, programs and related risks that concern key sustainability matters. The Committee, which meets three times per year, beginning in 2017, is comprised entirely of independent directors, and was carefully chosen to represent expertise in the scientific, financial, technological and non-profit sectors.
CC1.2
Do you provide incentives for the management of climate change issues, including the attainment of targets?
Yes
CC1.2a
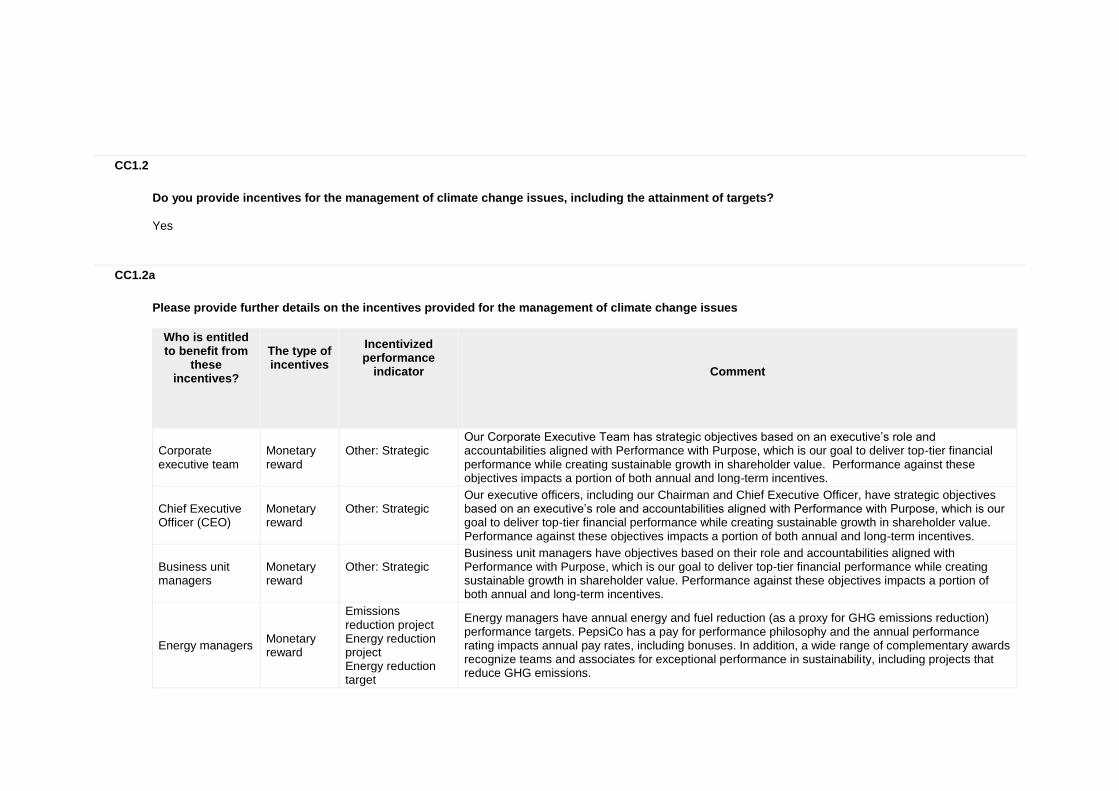
Please provide further details on the incentives provided for the management of climate change issues
Who is entitled to benefit from
these incentives?
The type of incentives
Incentivized performance
indicator
Comment
Corporate executive team
Monetary reward
Other: Strategic
Our Corporate Executive Team has strategic objectives based on an executive’s role and accountabilities aligned with Performance with Purpose, which is our goal to deliver top-tier financial performance while creating sustainable growth in shareholder value. Performance against these objectives impacts a portion of both annual and long-term incentives.
Chief Executive Officer (CEO)
Monetary reward
Other: Strategic
Our executive officers, including our Chairman and Chief Executive Officer, have strategic objectives based on an executive’s role and accountabilities aligned with Performance with Purpose, which is our goal to deliver top-tier financial performance while creating sustainable growth in shareholder value. Performance against these objectives impacts a portion of both annual and long-term incentives.
Business unit managers
Monetary reward
Other: Strategic
Business unit managers have objectives based on their role and accountabilities aligned with Performance with Purpose, which is our goal to deliver top-tier financial performance while creating sustainable growth in shareholder value. Performance against these objectives impacts a portion of both annual and long-term incentives.
Energy managers Monetary reward
Emissions reduction project Energy reduction project Energy reduction target
Energy managers have annual energy and fuel reduction (as a proxy for GHG emissions reduction) performance targets. PepsiCo has a pay for performance philosophy and the annual performance rating impacts annual pay rates, including bonuses. In addition, a wide range of complementary awards recognize teams and associates for exceptional performance in sustainability, including projects that reduce GHG emissions.
Who is entitled to benefit from
these incentives?
The type of incentives
Incentivized performance
indicator
Comment
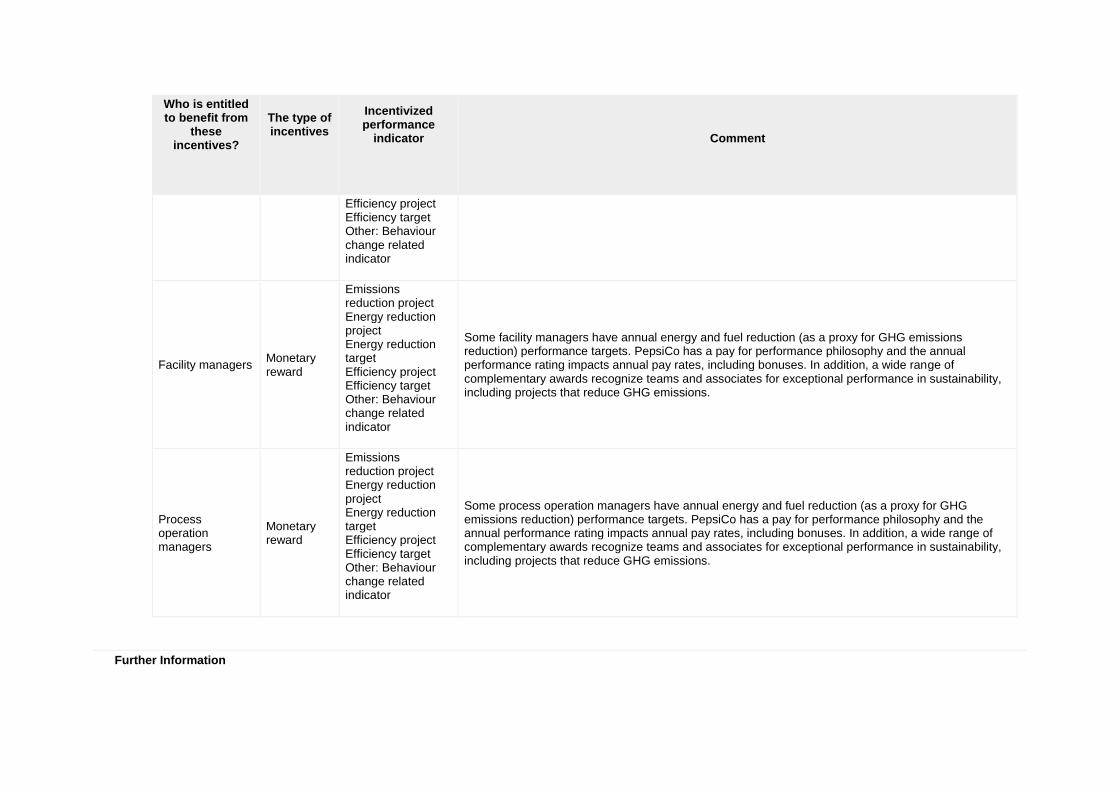
Efficiency project Efficiency target Other: Behaviour change related indicator
Facility managers Monetary reward
Emissions reduction project Energy reduction project Energy reduction target Efficiency project Efficiency target Other: Behaviour change related indicator
Some facility managers have annual energy and fuel reduction (as a proxy for GHG emissions reduction) performance targets. PepsiCo has a pay for performance philosophy and the annual performance rating impacts annual pay rates, including bonuses. In addition, a wide range of complementary awards recognize teams and associates for exceptional performance in sustainability, including projects that reduce GHG emissions.
Process operation managers
Monetary reward
Emissions reduction project Energy reduction project Energy reduction target Efficiency project Efficiency target Other: Behaviour change related indicator
Some process operation managers have annual energy and fuel reduction (as a proxy for GHG emissions reduction) performance targets. PepsiCo has a pay for performance philosophy and the annual performance rating impacts annual pay rates, including bonuses. In addition, a wide range of complementary awards recognize teams and associates for exceptional performance in sustainability, including projects that reduce GHG emissions.
Further Information
Page: CC2. Strategy
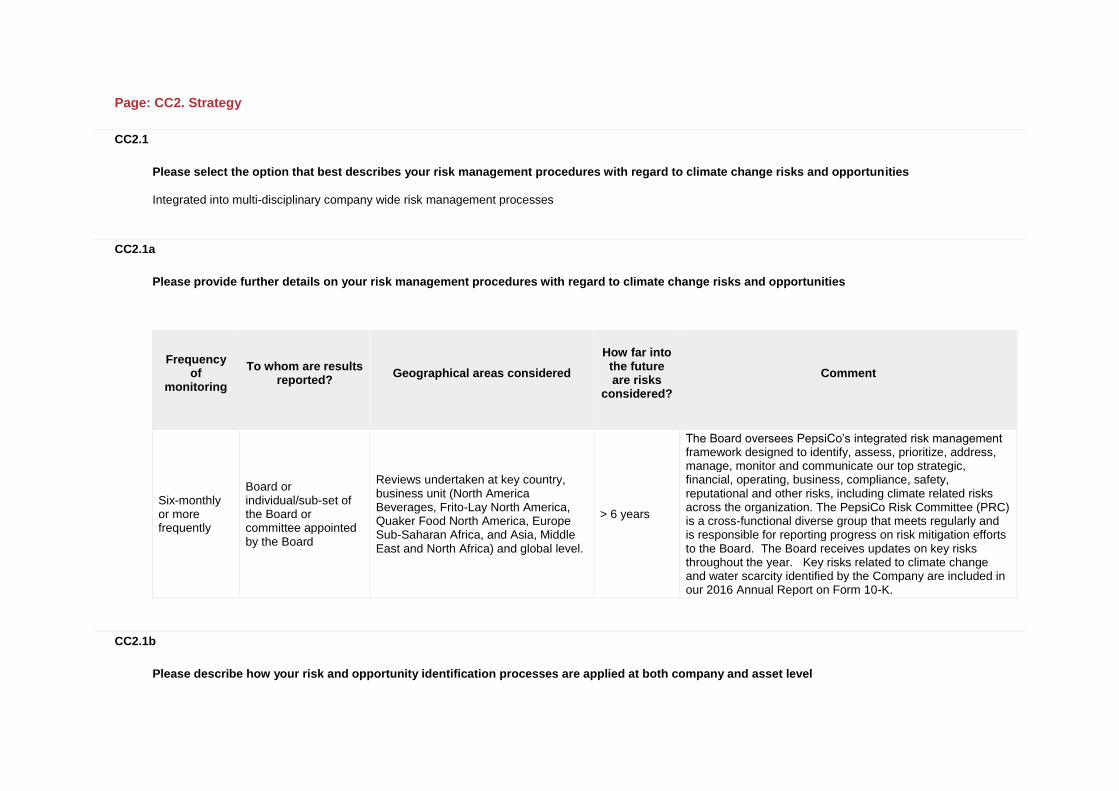
CC2.1
Please select the option that best describes your risk management procedures with regard to climate change risks and opportunities
Integrated into multi-disciplinary company wide risk management processes
CC2.1a
Please provide further details on your risk management procedures with regard to climate change risks and opportunities
Frequency
of monitoring
To whom are results
reported?
Geographical areas considered
How far into
the future are risks
considered?
Comment
Six-monthly or more frequently
Board or individual/sub-set of the Board or committee appointed by the Board
Reviews undertaken at key country, business unit (North America Beverages, Frito-Lay North America, Quaker Food North America, Europe Sub-Saharan Africa, and Asia, Middle East and North Africa) and global level.
> 6 years
The Board oversees PepsiCo’s integrated risk management framework designed to identify, assess, prioritize, address, manage, monitor and communicate our top strategic, financial, operating, business, compliance, safety, reputational and other risks, including climate related risks across the organization. The PepsiCo Risk Committee (PRC) is a cross-functional diverse group that meets regularly and is responsible for reporting progress on risk mitigation efforts to the Board. The Board receives updates on key risks throughout the year. Key risks related to climate change and water scarcity identified by the Company are included in our 2016 Annual Report on Form 10-K.
CC2.1b
Please describe how your risk and opportunity identification processes are applied at both company and asset level
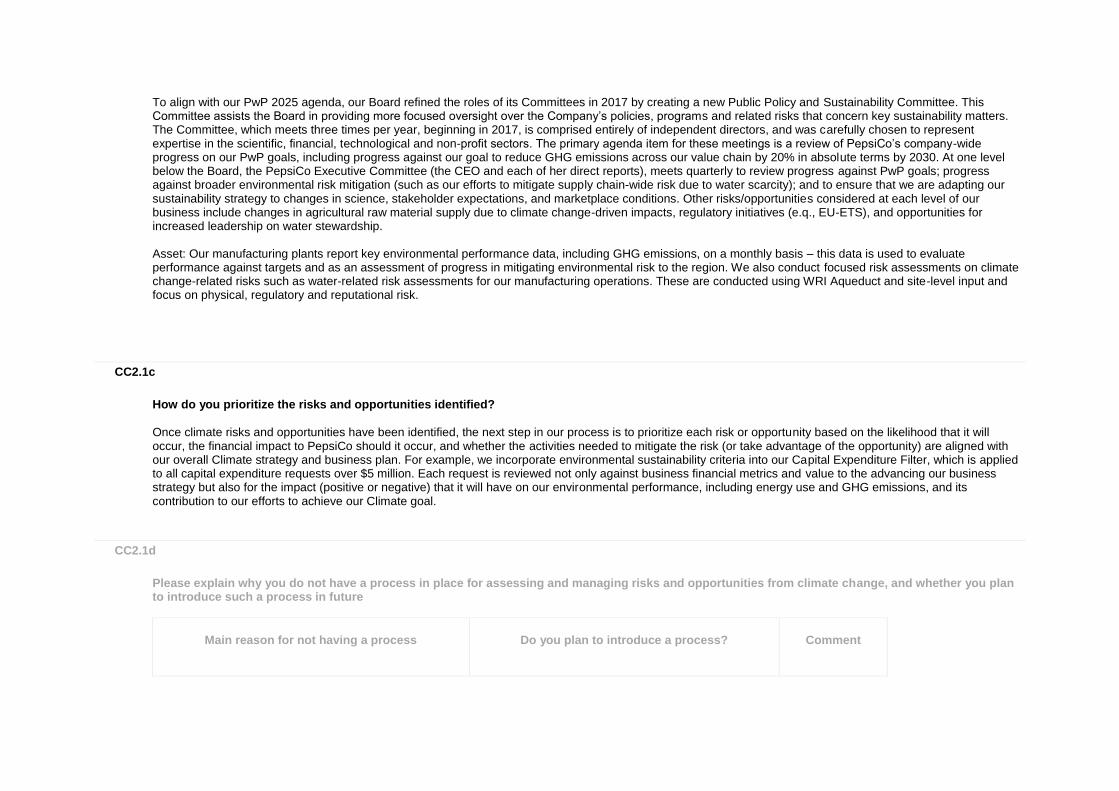
To align with our PwP 2025 agenda, our Board refined the roles of its Committees in 2017 by creating a new Public Policy and Sustainability Committee. This Committee assists the Board in providing more focused oversight over the Company’s policies, programs and related risks that concern key sustainability matters. The Committee, which meets three times per year, beginning in 2017, is comprised entirely of independent directors, and was carefully chosen to represent expertise in the scientific, financial, technological and non-profit sectors. The primary agenda item for these meetings is a review of PepsiCo’s company-wide progress on our PwP goals, including progress against our goal to reduce GHG emissions across our value chain by 20% in absolute terms by 2030. At one level below the Board, the PepsiCo Executive Committee (the CEO and each of her direct reports), meets quarterly to review progress against PwP goals; progress against broader environmental risk mitigation (such as our efforts to mitigate supply chain-wide risk due to water scarcity); and to ensure that we are adapting our sustainability strategy to changes in science, stakeholder expectations, and marketplace conditions. Other risks/opportunities considered at each level of our business include changes in agricultural raw material supply due to climate change-driven impacts, regulatory initiatives (e.q., EU-ETS), and opportunities for increased leadership on water stewardship. Asset: Our manufacturing plants report key environmental performance data, including GHG emissions, on a monthly basis – this data is used to evaluate performance against targets and as an assessment of progress in mitigating environmental risk to the region. We also conduct focused risk assessments on climate change-related risks such as water-related risk assessments for our manufacturing operations. These are conducted using WRI Aqueduct and site-level input and focus on physical, regulatory and reputational risk.
CC2.1c
How do you prioritize the risks and opportunities identified?
Once climate risks and opportunities have been identified, the next step in our process is to prioritize each risk or opportunity based on the likelihood that it will occur, the financial impact to PepsiCo should it occur, and whether the activities needed to mitigate the risk (or take advantage of the opportunity) are aligned with our overall Climate strategy and business plan. For example, we incorporate environmental sustainability criteria into our Capital Expenditure Filter, which is applied to all capital expenditure requests over $5 million. Each request is reviewed not only against business financial metrics and value to the advancing our business strategy but also for the impact (positive or negative) that it will have on our environmental performance, including energy use and GHG emissions, and its contribution to our efforts to achieve our Climate goal.
CC2.1d
Please explain why you do not have a process in place for assessing and managing risks and opportunities from climate change, and whether you plan to introduce such a process in future
Main reason for not having a process
Do you plan to introduce a process?
Comment
CC2.2
Is climate change integrated into your business strategy?
Yes
CC2.2a
Please describe the process of how climate change is integrated into your business strategy and any outcomes of this process
(i) PepsiCo has identified climate change as a key business risk through our Integrated Risk Management Framework, a process that identifies, assesses, prioritizes, manages, and monitors the risks affecting the company across it operations. The identification of climate change as a key risk has influenced our business strategy in the following ways: 1) We have integrated a GHG reduction target into our Performance with Purpose strategy, PepsiCo’s vision to deliver top‑ tier financial performance over the long term by integrating sustainability into our business 2) Climate strategy and actions are reviewed and managed in the context of our short and long term business strategy 3) Climate change risks are included in our Annual Report on Form 10-K. (ii) For example: We have integrated a GHG reduction target into our Performance with Purpose strategy – announced in 2016, our new environmental goals reach well beyond our direct manufacturing operations, enabling us to focus on reducing environmental impacts across our value chain — beginning with a product’s sourcing and extending through its use. Our Climate goal is to reduce GHG emissions by 20% by 2030 across our value chain in absolute terms compared to our 2015 baseline. We established this goal because we recognize that as the world’s population grows and the demand for water and energy increase, continuing a business as usual approach will drive increased GHG emissions, which is predicted to further accelerate climate change and put crops and other raw materials that PepsiCo needs at increased risk. (iii) Several aspects of climate change have influenced our strategy, including a) the need for our business to adapt to a changing environment driven by rising temperatures and fluctuating weather patterns that affect our supply chain; and b) the opportunity to develop a product portfolio that includes fewer GHG-intensive and water-intensive products. (iv) The influence of climate change on our short-term, current to 2030, strategy is reflected in our announcement in 2016 of a GHG reduction target – we have committed to reducing absolute GHG emissions from across our entire value chain by 20% by 2030, and while the target period is 15 years, our efforts to deliver this target are being implemented immediately. For example, continued implementation of our Higher Efficiency Coolers and Vending Machines involving the replacement of retired units with more efficient point-of-sale equipment reduced the GHG emissions from these sources by nearly 500,000 metric tonnes during this reporting year when compared to estimated emissions by the now-retired machines during the prior year. (v) Our long-term strategy has been influenced by Climate change through our merger and acquisition strategy. We have embedded mechanisms to quantify the impact of growth and M&A activity on our ability to deliver our Climate goal into our investment allocation processes as well as integrating a requirement for business units to conduct a water-related risk assessment prior to any major acquisition. (vi) We believe that our climate change strategy is industry-leading and will support our efforts to build PepsiCo reputation as a leader in environmental sustainability, potentially translating into competitive advantage with our customers and consumers. For example, our Sustainable Farming Initiative, which reflects
industry best practice, helps position us and our farmers to compete more effectively in a resource constrained future. Through the Initiative, we are working with our farmers to reduce climate change impacts of farming practices, improve soil health, and improve water use efficiency. (vii) The most substantial decision made in this reporting year influenced by our climate change strategy has been our announcement of our Climate goal to reduce value chain GHG emissions by 20% by 2030. This goal is aggressive and industry-leading and will have significant impacts on the PepsiCo value chain. (viii) PepsiCo supports the Paris Climate Accord and is committed to doing its part to limit global temperature increases to below 2 degrees Celsius. (ix) Our Climate goal has been confirmed as science-based by the Science-Based Targets organization.
CC2.2b
Please explain why climate change is not integrated into your business strategy
CC2.2c
Does your company use an internal price on carbon?
No, and we currently don't anticipate doing so in the next 2 years
CC2.2d
Please provide details and examples of how your company uses an internal price on carbon
CC2.3
Do you engage in activities that could either directly or indirectly influence public policy on climate change through any of the following? (tick all that apply)
Direct engagement with policy makers Trade associations Funding research organizations Other
CC2.3a
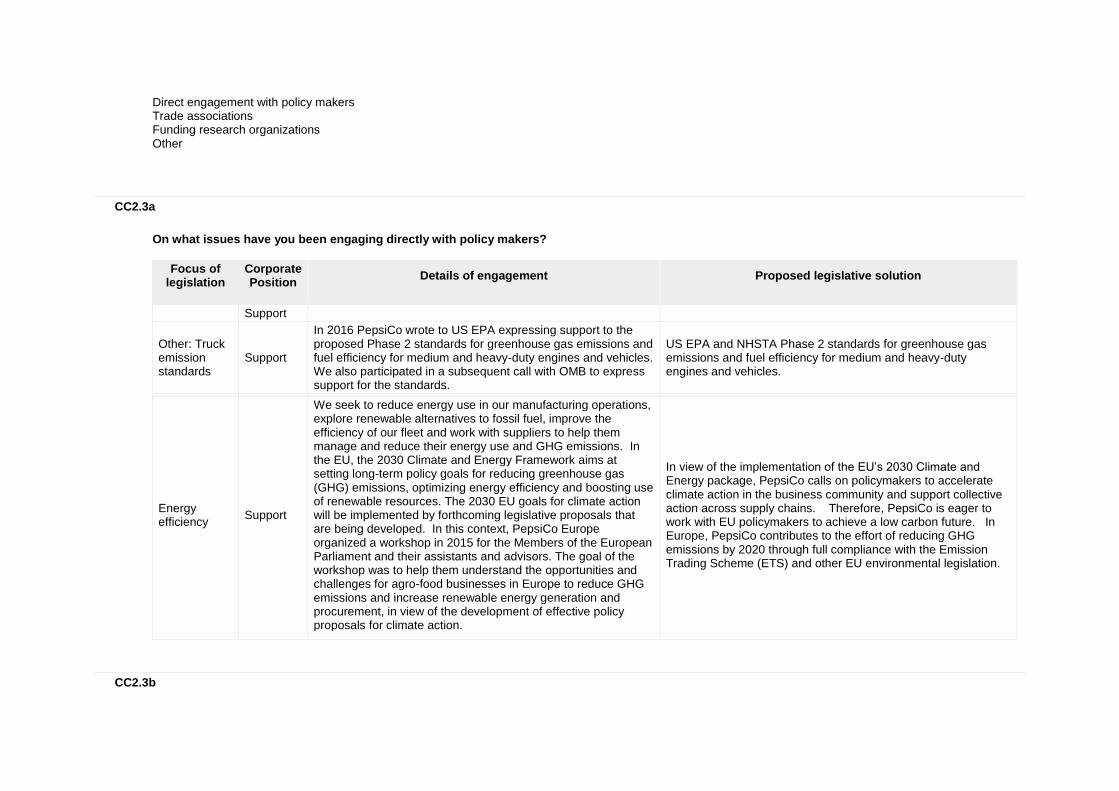
On what issues have you been engaging directly with policy makers?
Focus of legislation
Corporate Position
Details of engagement
Proposed legislative solution
Support
Other: Truck emission standards
Support
In 2016 PepsiCo wrote to US EPA expressing support to the proposed Phase 2 standards for greenhouse gas emissions and fuel efficiency for medium and heavy-duty engines and vehicles. We also participated in a subsequent call with OMB to express support for the standards.
US EPA and NHSTA Phase 2 standards for greenhouse gas emissions and fuel efficiency for medium and heavy-duty engines and vehicles.
Energy efficiency
Support
We seek to reduce energy use in our manufacturing operations, explore renewable alternatives to fossil fuel, improve the efficiency of our fleet and work with suppliers to help them manage and reduce their energy use and GHG emissions. In the EU, the 2030 Climate and Energy Framework aims at setting long-term policy goals for reducing greenhouse gas (GHG) emissions, optimizing energy efficiency and boosting use of renewable resources. The 2030 EU goals for climate action will be implemented by forthcoming legislative proposals that are being developed. In this context, PepsiCo Europe organized a workshop in 2015 for the Members of the European Parliament and their assistants and advisors. The goal of the workshop was to help them understand the opportunities and challenges for agro-food businesses in Europe to reduce GHG emissions and increase renewable energy generation and procurement, in view of the development of effective policy proposals for climate action.
In view of the implementation of the EU’s 2030 Climate and Energy package, PepsiCo calls on policymakers to accelerate climate action in the business community and support collective action across supply chains. Therefore, PepsiCo is eager to work with EU policymakers to achieve a low carbon future. In Europe, PepsiCo contributes to the effort of reducing GHG emissions by 2020 through full compliance with the Emission Trading Scheme (ETS) and other EU environmental legislation.
CC2.3b
Are you on the Board of any trade associations or provide funding beyond membership?
Yes
CC2.3c
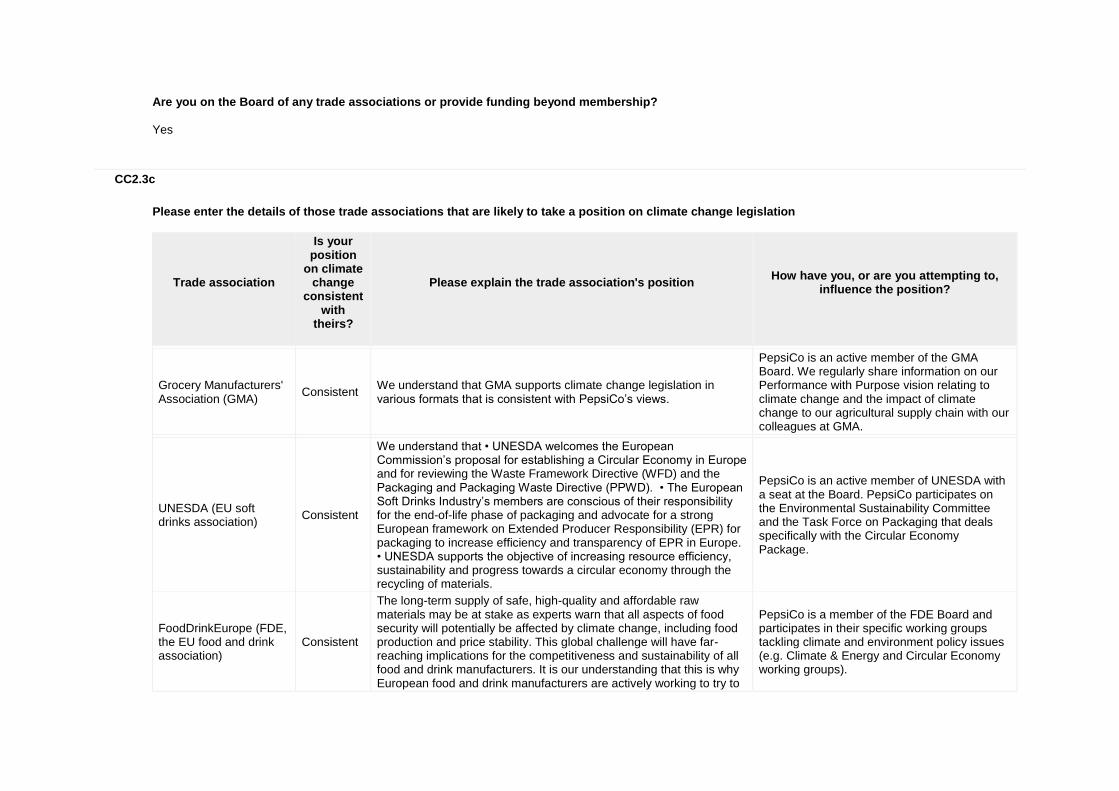
Please enter the details of those trade associations that are likely to take a position on climate change legislation
Trade association
Is your position
on climate change
consistent with
theirs?
Please explain the trade association's position
How have you, or are you attempting to, influence the position?
Grocery Manufacturers' Association (GMA)
Consistent We understand that GMA supports climate change legislation in various formats that is consistent with PepsiCo’s views.
PepsiCo is an active member of the GMA Board. We regularly share information on our Performance with Purpose vision relating to climate change and the impact of climate change to our agricultural supply chain with our colleagues at GMA.
UNESDA (EU soft drinks association)
Consistent
We understand that • UNESDA welcomes the European Commission’s proposal for establishing a Circular Economy in Europe and for reviewing the Waste Framework Directive (WFD) and the Packaging and Packaging Waste Directive (PPWD). • The European Soft Drinks Industry’s members are conscious of their responsibility for the end-of-life phase of packaging and advocate for a strong European framework on Extended Producer Responsibility (EPR) for packaging to increase efficiency and transparency of EPR in Europe. • UNESDA supports the objective of increasing resource efficiency, sustainability and progress towards a circular economy through the recycling of materials.
PepsiCo is an active member of UNESDA with a seat at the Board. PepsiCo participates on the Environmental Sustainability Committee and the Task Force on Packaging that deals specifically with the Circular Economy Package.
FoodDrinkEurope (FDE, the EU food and drink association)
Consistent
The long-term supply of safe, high-quality and affordable raw materials may be at stake as experts warn that all aspects of food security will potentially be affected by climate change, including food production and price stability. This global challenge will have far-reaching implications for the competitiveness and sustainability of all food and drink manufacturers. It is our understanding that this is why European food and drink manufacturers are actively working to try to
PepsiCo is a member of the FDE Board and participates in their specific working groups tackling climate and environment policy issues (e.g. Climate & Energy and Circular Economy working groups).
Trade association
Is your position
on climate change
consistent with
theirs?
Please explain the trade association's position
How have you, or are you attempting to, influence the position?
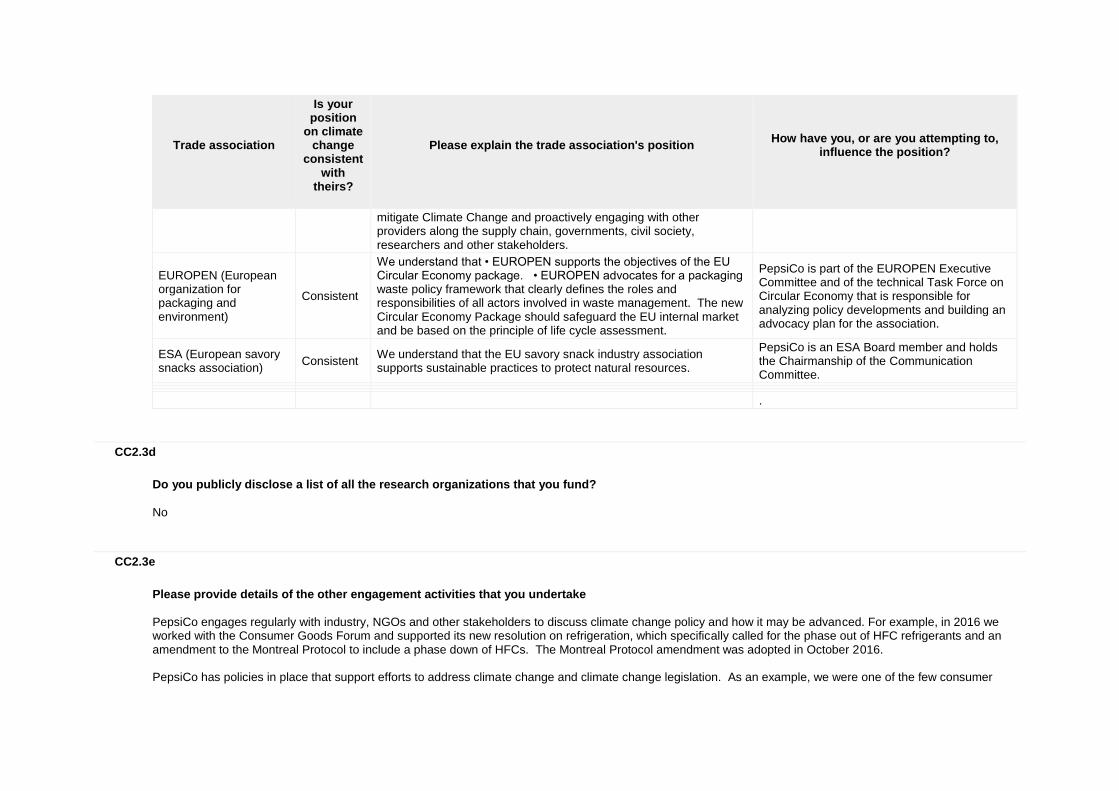
mitigate Climate Change and proactively engaging with other providers along the supply chain, governments, civil society, researchers and other stakeholders.
EUROPEN (European organization for packaging and environment)
Consistent
We understand that • EUROPEN supports the objectives of the EU Circular Economy package. • EUROPEN advocates for a packaging waste policy framework that clearly defines the roles and responsibilities of all actors involved in waste management. The new Circular Economy Package should safeguard the EU internal market and be based on the principle of life cycle assessment.
PepsiCo is part of the EUROPEN Executive Committee and of the technical Task Force on Circular Economy that is responsible for analyzing policy developments and building an advocacy plan for the association.
ESA (European savory snacks association)
Consistent We understand that the EU savory snack industry association supports sustainable practices to protect natural resources.
PepsiCo is an ESA Board member and holds the Chairmanship of the Communication Committee.
.
CC2.3d
Do you publicly disclose a list of all the research organizations that you fund?
No
CC2.3e
Please provide details of the other engagement activities that you undertake
PepsiCo engages regularly with industry, NGOs and other stakeholders to discuss climate change policy and how it may be advanced. For example, in 2016 we worked with the Consumer Goods Forum and supported its new resolution on refrigeration, which specifically called for the phase out of HFC refrigerants and an amendment to the Montreal Protocol to include a phase down of HFCs. The Montreal Protocol amendment was adopted in October 2016. PepsiCo has policies in place that support efforts to address climate change and climate change legislation. As an example, we were one of the few consumer
companies that supported cap and trade legislation in the U.S. through the U.S. Climate Action Partnership (USCAP). Paris Climate Agreement - By signing the White House American Business Act on Climate Pledge in 2015, PepsiCo publically demonstrated its support for a strong international agreement on climate change in Paris, its commitment to climate action and commitment to implement solutions that will help achieve a 2°C-target, including utilizing PepsiCo Sustainable Farming Initiative to expand the use of sustainable farming practices, continuing to implement HFC-free cooling equipment, continuing to reduce GHG emissions from our global fleet, striving for zero deforestation, striving to increase the amount of recycled content in our packaging, and energy efficiency and renewable energy investments at our facilities. To underscore this commitment, PepsiCo hosted a side event at the COP-21 conference in Paris together other participants to highlight climate action progress and future opportunities in U.S. and global agriculture, and to express support for governments’ carbon reduction targets. The then U.S. Secretary of Agriculture, Tom Vilsack, participated in the event. PepsiCo recognizes that limiting global warming to 2° Celsius is important to our future. We have reiterated our call for collective action and our commitment to implementing solutions that will help achieve this goal. PepsiCo participates in many national trade associations, which gives us opportunities to dialogue on clean energy and other solutions to climate change. Examples include the British Soft Drinks Association, the UK Food and Drink Federation, and the Association Nationale des Industries Alimentaires in France. As part of being a member of the American Beverage Association, we committed to increase energy efficiencies while decreasing the carbon footprint of our products. We also committed to improving fuel efficiency, as well as decreasing water use and the use of raw materials for packaging. We support ABA’s efforts at the Board and committee level and by sharing information on our company performance in relation to environmental sustainability. PepsiCo does not always share or agree with all of the views of each of our peers or associations. PepsiCo representatives on the boards and committees of such groups ensure that PepsiCo’s position about policy or related activities is voiced. As such, there may be times when PepsiCo chooses not to fund certain initiatives sponsored by such organizations.
CC2.3f
What processes do you have in place to ensure that all of your direct and indirect activities that influence policy are consistent with your overall climate change strategy?
PepsiCo has specific teams and individuals that are assigned responsibilities for developing corporate policy and regulatory positions as well as engaging on regulatory policy with external stakeholders, including public policymakers, trade associations and non-government actors. The Public Policy and Government Affairs function manages relationships with government actors and coordinates activities that may influence regulatory policy globally.
CC2.3g
Please explain why you do not engage with policy makers
Further Information
Page: CC3. Targets and Initiatives
CC3.1
Did you have an emissions reduction or renewable energy consumption or production target that was active (ongoing or reached completion) in the reporting year?
Absolute target
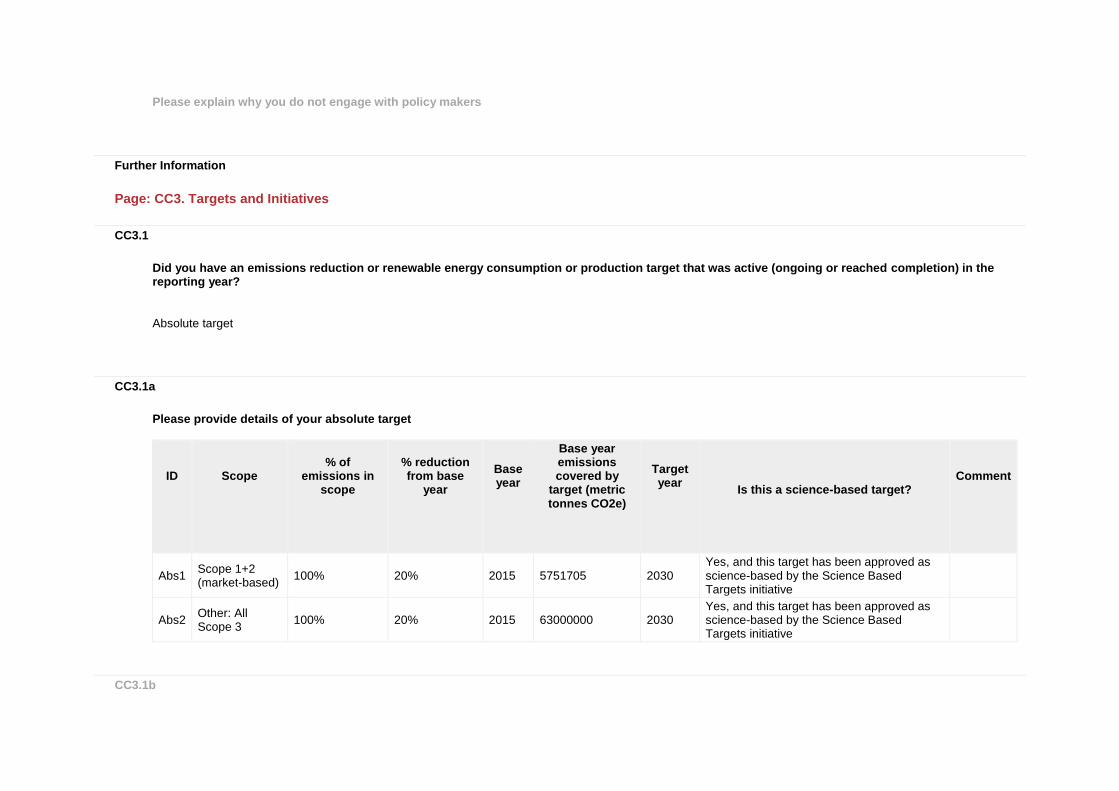
CC3.1a
Please provide details of your absolute target
ID
Scope
% of emissions in
scope
% reduction from base
year
Base year
Base year emissions covered by
target (metric tonnes CO2e)
Target year
Is this a science-based target?
Comment
Abs1 Scope 1+2 (market-based)
100% 20% 2015 5751705 2030 Yes, and this target has been approved as science-based by the Science Based Targets initiative
Abs2 Other: All Scope 3
100% 20% 2015 63000000 2030 Yes, and this target has been approved as science-based by the Science Based Targets initiative
CC3.1b
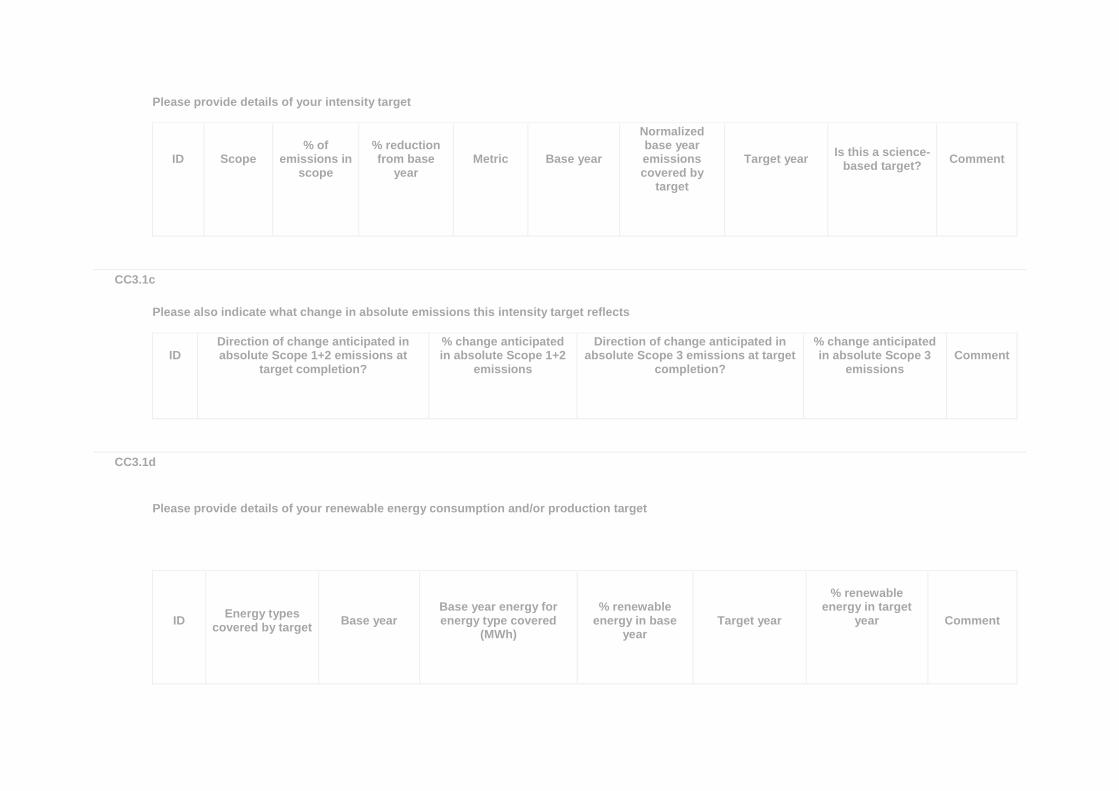
Please provide details of your intensity target
ID
Scope
% of emissions in
scope
% reduction from base
year
Metric
Base year
Normalized base year emissions covered by
target
Target year
Is this a science-based target?
Comment
CC3.1c
Please also indicate what change in absolute emissions this intensity target reflects
ID
Direction of change anticipated in absolute Scope 1+2 emissions at
target completion?
% change anticipated in absolute Scope 1+2
emissions
Direction of change anticipated in absolute Scope 3 emissions at target
completion?
% change anticipated in absolute Scope 3
emissions
Comment
CC3.1d
Please provide details of your renewable energy consumption and/or production target
ID
Energy types
covered by target
Base year
Base year energy for energy type covered
(MWh)
% renewable
energy in base year
Target year
% renewable
energy in target year
Comment
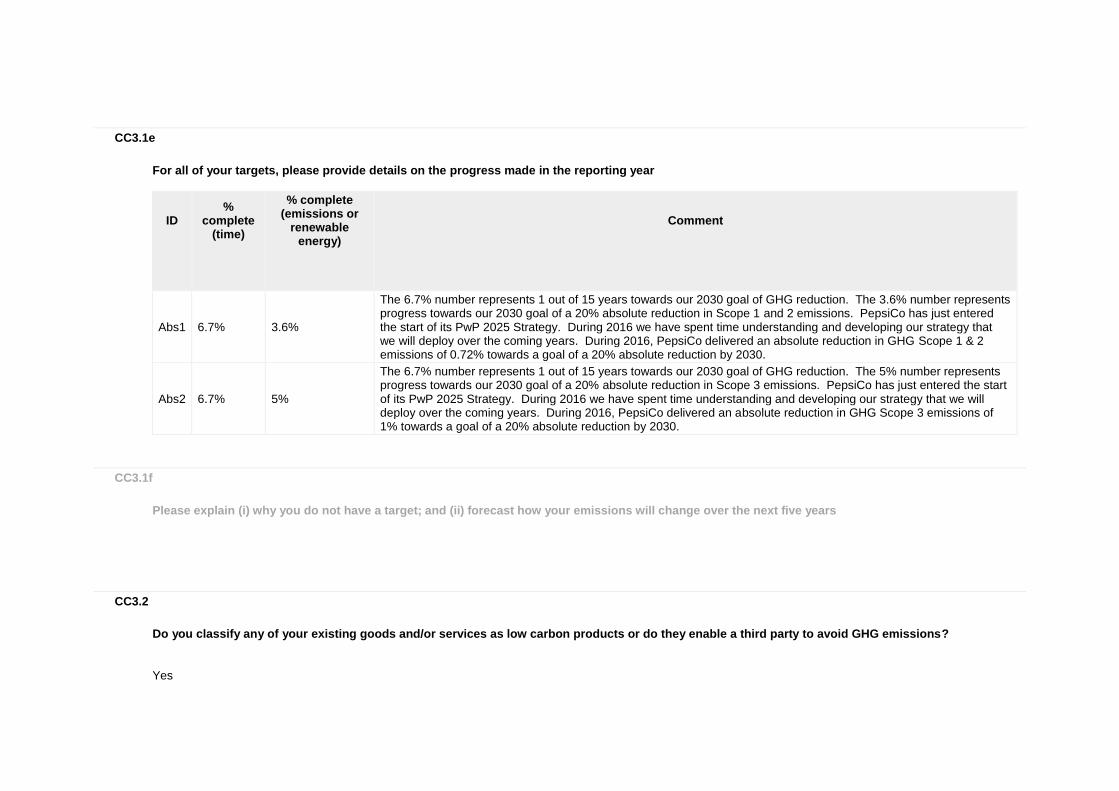
CC3.1e
For all of your targets, please provide details on the progress made in the reporting year
ID
% complete
(time)
% complete (emissions or
renewable energy)
Comment
Abs1 6.7% 3.6%
The 6.7% number represents 1 out of 15 years towards our 2030 goal of GHG reduction. The 3.6% number represents progress towards our 2030 goal of a 20% absolute reduction in Scope 1 and 2 emissions. PepsiCo has just entered the start of its PwP 2025 Strategy. During 2016 we have spent time understanding and developing our strategy that we will deploy over the coming years. During 2016, PepsiCo delivered an absolute reduction in GHG Scope 1 & 2 emissions of 0.72% towards a goal of a 20% absolute reduction by 2030.
Abs2 6.7% 5%
The 6.7% number represents 1 out of 15 years towards our 2030 goal of GHG reduction. The 5% number represents progress towards our 2030 goal of a 20% absolute reduction in Scope 3 emissions. PepsiCo has just entered the start of its PwP 2025 Strategy. During 2016 we have spent time understanding and developing our strategy that we will deploy over the coming years. During 2016, PepsiCo delivered an absolute reduction in GHG Scope 3 emissions of 1% towards a goal of a 20% absolute reduction by 2030.
CC3.1f
Please explain (i) why you do not have a target; and (ii) forecast how your emissions will change over the next five years
CC3.2
Do you classify any of your existing goods and/or services as low carbon products or do they enable a third party to avoid GHG emissions?
Yes
CC3.2a
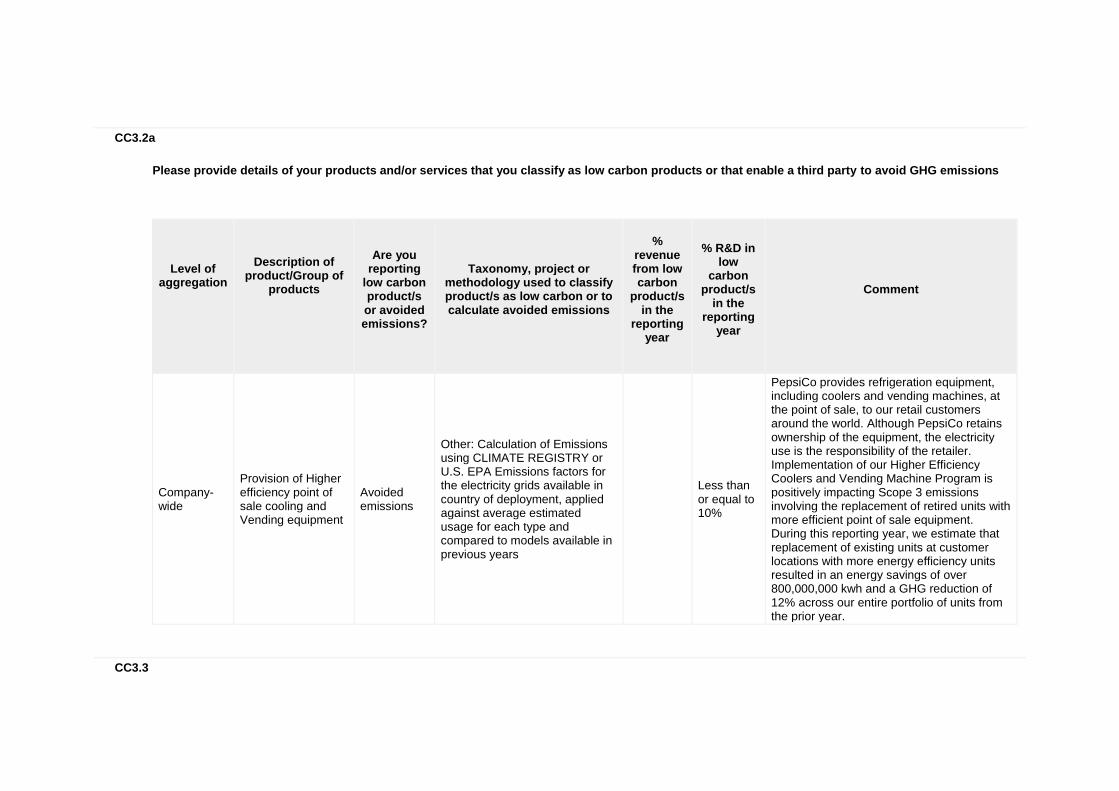
Please provide details of your products and/or services that you classify as low carbon products or that enable a third party to avoid GHG emissions
Level of
aggregation
Description of
product/Group of products
Are you
reporting low carbon product/s or avoided emissions?
Taxonomy, project or
methodology used to classify product/s as low carbon or to calculate avoided emissions
%
revenue from low carbon
product/s in the
reporting year
% R&D in
low carbon
product/s in the
reporting year
Comment
Company-wide
Provision of Higher efficiency point of sale cooling and Vending equipment
Avoided emissions
Other: Calculation of Emissions using CLIMATE REGISTRY or U.S. EPA Emissions factors for the electricity grids available in country of deployment, applied against average estimated usage for each type and compared to models available in previous years
Less than or equal to 10%
PepsiCo provides refrigeration equipment, including coolers and vending machines, at the point of sale, to our retail customers around the world. Although PepsiCo retains ownership of the equipment, the electricity use is the responsibility of the retailer. Implementation of our Higher Efficiency Coolers and Vending Machine Program is positively impacting Scope 3 emissions involving the replacement of retired units with more efficient point of sale equipment. During this reporting year, we estimate that replacement of existing units at customer locations with more energy efficiency units resulted in an energy savings of over 800,000,000 kwh and a GHG reduction of 12% across our entire portfolio of units from the prior year.
CC3.3
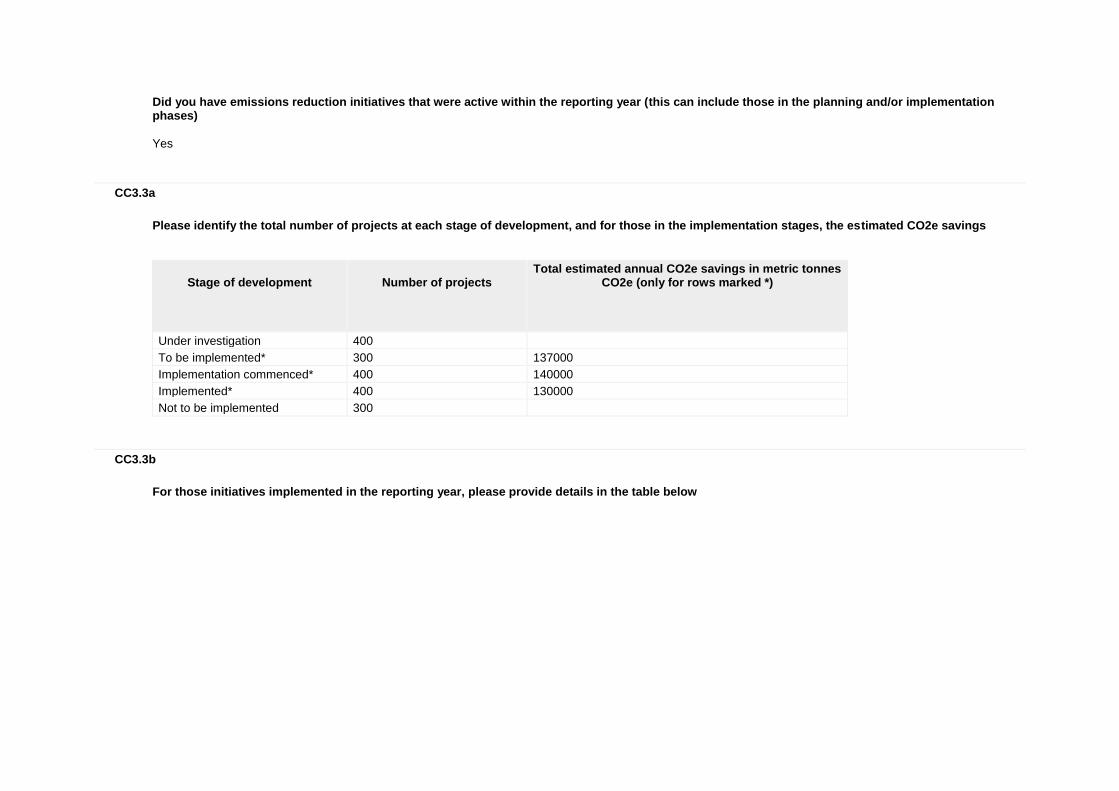
Did you have emissions reduction initiatives that were active within the reporting year (this can include those in the planning and/or implementation phases)
Yes
CC3.3a
Please identify the total number of projects at each stage of development, and for those in the implementation stages, the estimated CO2e savings
Stage of development
Number of projects
Total estimated annual CO2e savings in metric tonnes CO2e (only for rows marked *)
Under investigation 400
To be implemented* 300 137000
Implementation commenced* 400 140000
Implemented* 400 130000
Not to be implemented 300
CC3.3b
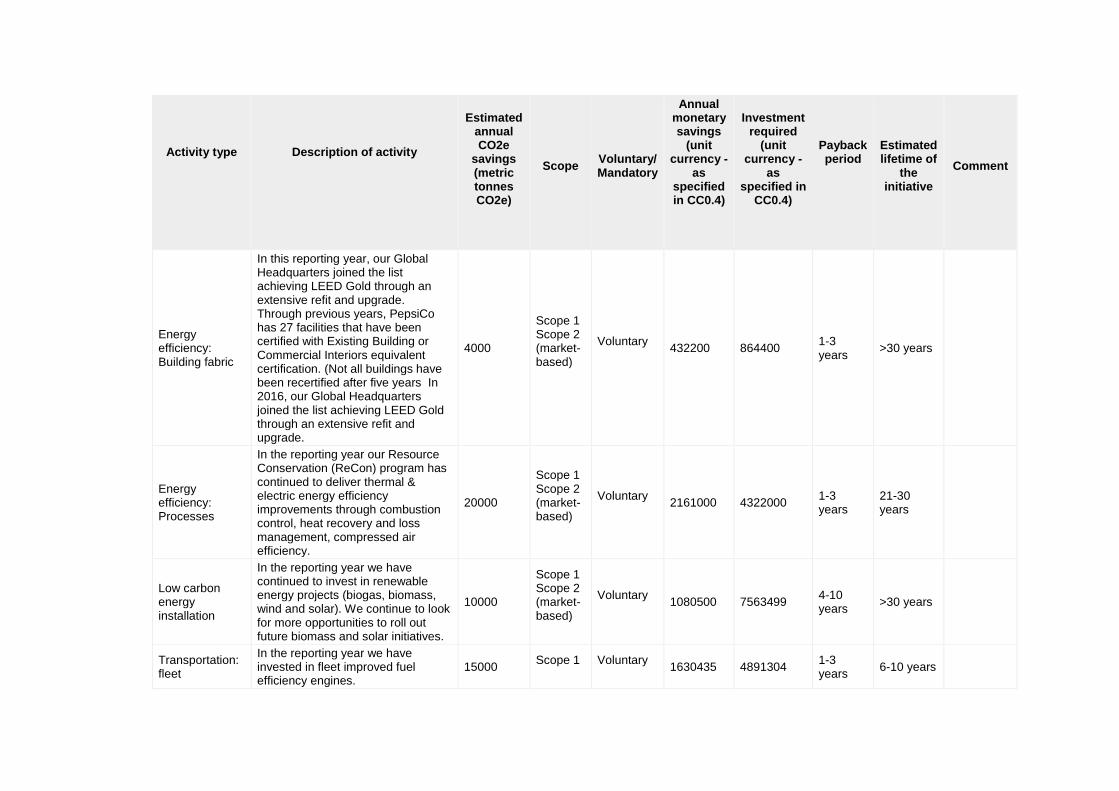
For those initiatives implemented in the reporting year, please provide details in the table below
Activity type
Description of activity
Estimated annual CO2e
savings (metric tonnes CO2e)
Scope
Voluntary/ Mandatory
Annual monetary savings
(unit currency -
as specified in CC0.4)
Investment required
(unit currency -
as specified in
CC0.4)
Payback period
Estimated lifetime of
the initiative
Comment
Energy efficiency: Building fabric
In this reporting year, our Global Headquarters joined the list achieving LEED Gold through an extensive refit and upgrade. Through previous years, PepsiCo has 27 facilities that have been certified with Existing Building or Commercial Interiors equivalent certification. (Not all buildings have been recertified after five years In 2016, our Global Headquarters joined the list achieving LEED Gold through an extensive refit and upgrade.
4000
Scope 1 Scope 2 (market-based)
Voluntary
432200 864400 1-3 years
>30 years
Energy efficiency: Processes
In the reporting year our Resource Conservation (ReCon) program has continued to deliver thermal & electric energy efficiency improvements through combustion control, heat recovery and loss management, compressed air efficiency.
20000
Scope 1 Scope 2 (market-based)
Voluntary
2161000 4322000 1-3 years
21-30 years
Low carbon energy installation
In the reporting year we have continued to invest in renewable energy projects (biogas, biomass, wind and solar). We continue to look for more opportunities to roll out future biomass and solar initiatives.
10000
Scope 1 Scope 2 (market-based)
Voluntary
1080500 7563499 4-10 years
>30 years
Transportation: fleet
In the reporting year we have invested in fleet improved fuel efficiency engines.
15000 Scope 1
Voluntary
1630435 4891304 1-3 years
6-10 years
Activity type
Description of activity
Estimated annual CO2e
savings (metric tonnes CO2e)
Scope
Voluntary/ Mandatory
Annual monetary savings
(unit currency -
as specified in CC0.4)
Investment required
(unit currency -
as specified in
CC0.4)
Payback period
Estimated lifetime of
the initiative
Comment
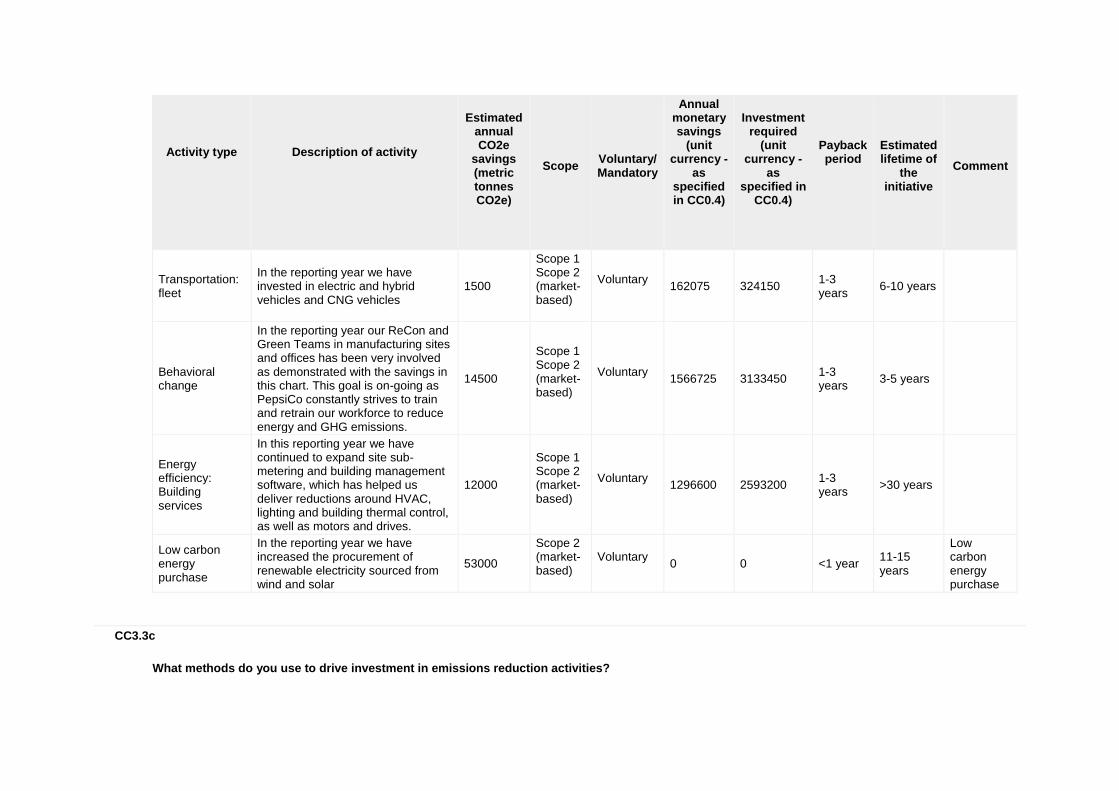
Transportation: fleet
In the reporting year we have invested in electric and hybrid vehicles and CNG vehicles
1500
Scope 1 Scope 2 (market-based)
Voluntary
162075 324150 1-3 years
6-10 years
Behavioral change
In the reporting year our ReCon and Green Teams in manufacturing sites and offices has been very involved as demonstrated with the savings in this chart. This goal is on-going as PepsiCo constantly strives to train and retrain our workforce to reduce energy and GHG emissions.
14500
Scope 1 Scope 2 (market-based)
Voluntary
1566725 3133450 1-3 years
3-5 years
Energy efficiency: Building services
In this reporting year we have continued to expand site sub-metering and building management software, which has helped us deliver reductions around HVAC, lighting and building thermal control, as well as motors and drives.
12000
Scope 1 Scope 2 (market-based)
Voluntary
1296600 2593200 1-3 years
>30 years
Low carbon energy purchase
In the reporting year we have increased the procurement of renewable electricity sourced from wind and solar
53000
Scope 2 (market-based)
Voluntary
0 0 <1 year 11-15 years
Low carbon energy purchase
CC3.3c
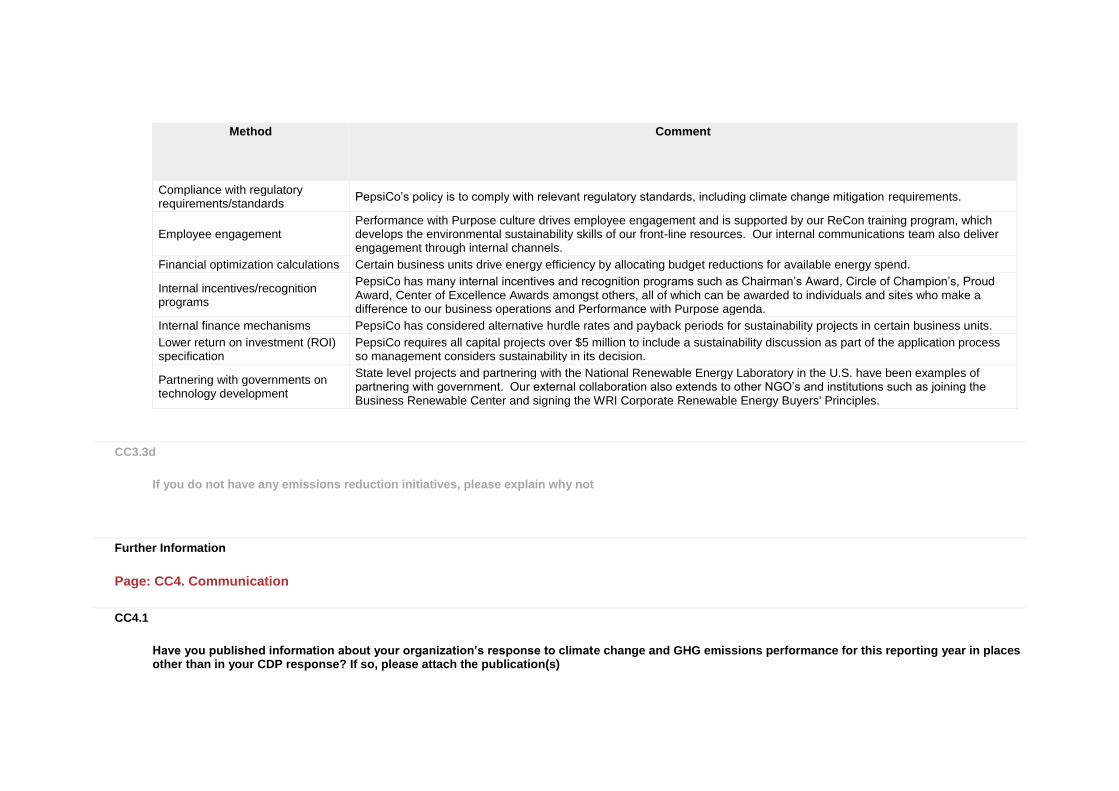
What methods do you use to drive investment in emissions reduction activities?
Method
Comment
Compliance with regulatory requirements/standards
PepsiCo’s policy is to comply with relevant regulatory standards, including climate change mitigation requirements.
Employee engagement Performance with Purpose culture drives employee engagement and is supported by our ReCon training program, which develops the environmental sustainability skills of our front-line resources. Our internal communications team also deliver engagement through internal channels.
Financial optimization calculations Certain business units drive energy efficiency by allocating budget reductions for available energy spend.
Internal incentives/recognition programs
PepsiCo has many internal incentives and recognition programs such as Chairman’s Award, Circle of Champion’s, Proud Award, Center of Excellence Awards amongst others, all of which can be awarded to individuals and sites who make a difference to our business operations and Performance with Purpose agenda.
Internal finance mechanisms PepsiCo has considered alternative hurdle rates and payback periods for sustainability projects in certain business units.
Lower return on investment (ROI) specification
PepsiCo requires all capital projects over $5 million to include a sustainability discussion as part of the application process so management considers sustainability in its decision.
Partnering with governments on technology development
State level projects and partnering with the National Renewable Energy Laboratory in the U.S. have been examples of partnering with government. Our external collaboration also extends to other NGO’s and institutions such as joining the Business Renewable Center and signing the WRI Corporate Renewable Energy Buyers' Principles.
CC3.3d
If you do not have any emissions reduction initiatives, please explain why not
Further Information
Page: CC4. Communication
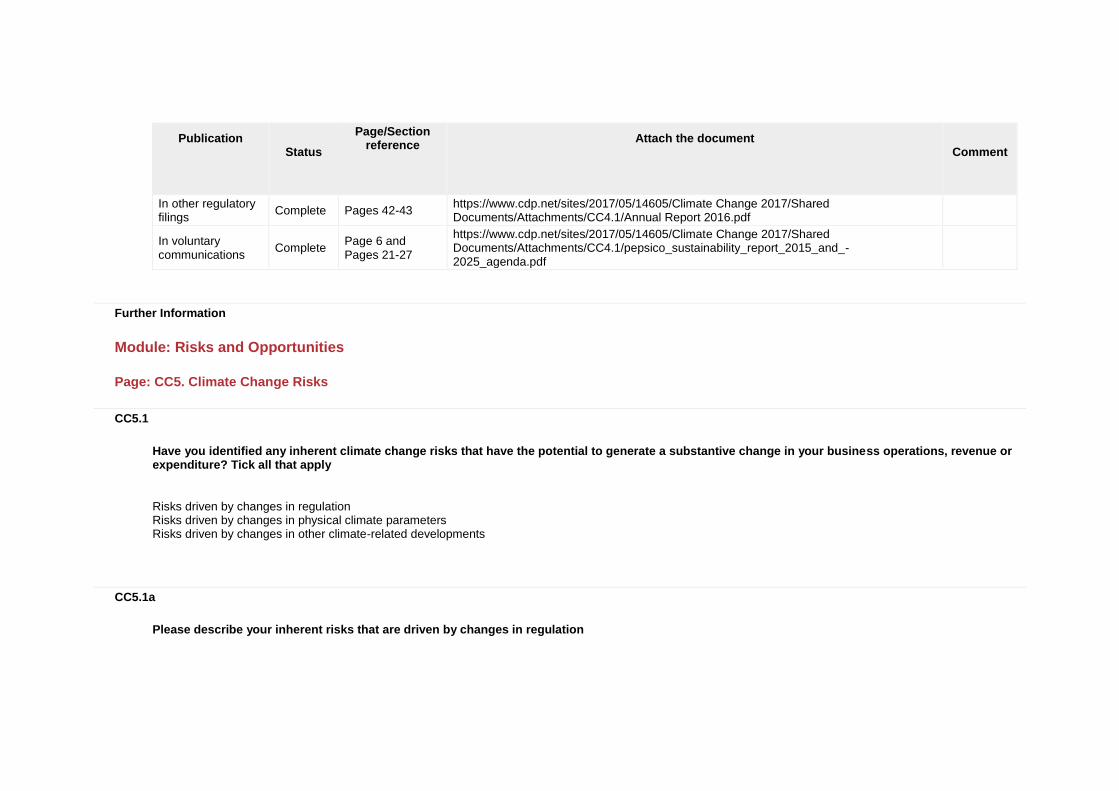
CC4.1
Have you published information about your organization’s response to climate change and GHG emissions performance for this reporting year in places other than in your CDP response? If so, please attach the publication(s)
Publication
Status
Page/Section reference
Attach the document
Comment
In other regulatory filings
Complete Pages 42-43 https://www.cdp.net/sites/2017/05/14605/Climate Change 2017/Shared Documents/Attachments/CC4.1/Annual Report 2016.pdf
In voluntary communications
Complete Page 6 and Pages 21-27
https://www.cdp.net/sites/2017/05/14605/Climate Change 2017/Shared Documents/Attachments/CC4.1/pepsico_sustainability_report_2015_and_-2025_agenda.pdf
Further Information
Module: Risks and Opportunities
Page: CC5. Climate Change Risks
CC5.1
Have you identified any inherent climate change risks that have the potential to generate a substantive change in your business operations, revenue or expenditure? Tick all that apply
Risks driven by changes in regulation Risks driven by changes in physical climate parameters Risks driven by changes in other climate-related developments
CC5.1a
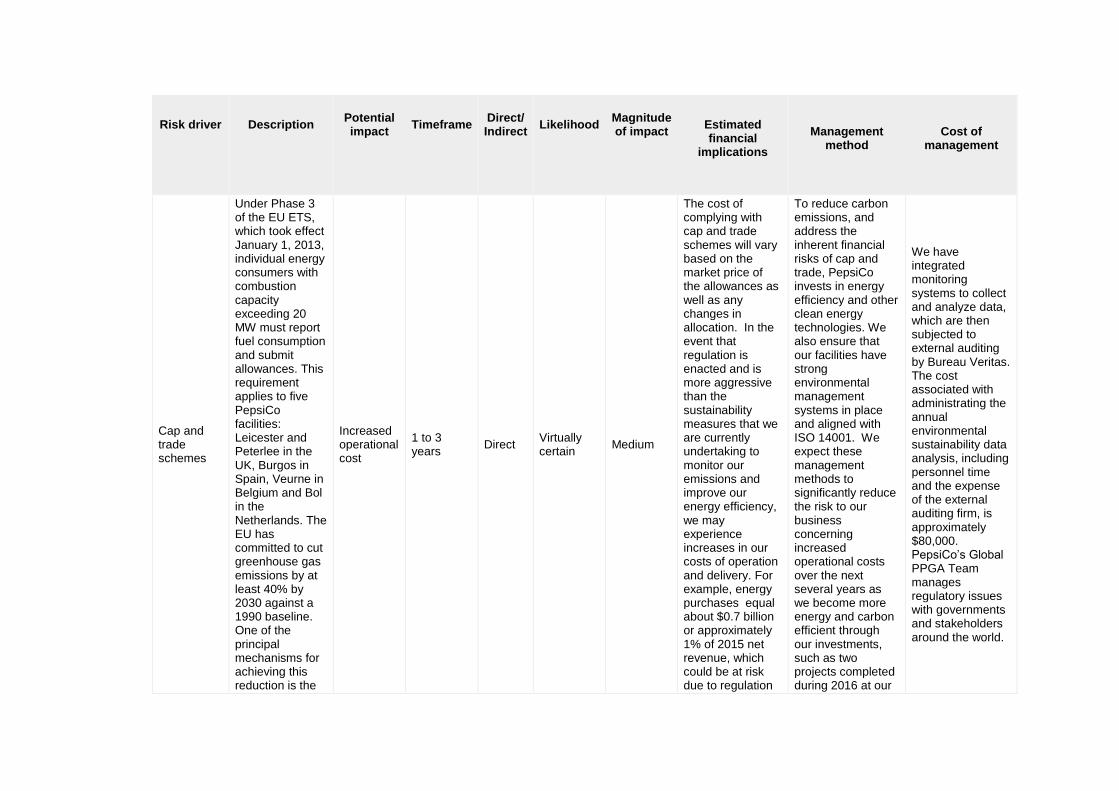
Please describe your inherent risks that are driven by changes in regulation
Risk driver
Description
Potential impact
Timeframe
Direct/ Indirect
Likelihood
Magnitude of impact
Estimated financial
implications
Management
method
Cost of
management
Cap and trade schemes
Under Phase 3 of the EU ETS, which took effect January 1, 2013, individual energy consumers with combustion capacity exceeding 20 MW must report fuel consumption and submit allowances. This requirement applies to five PepsiCo facilities: Leicester and Peterlee in the UK, Burgos in Spain, Veurne in Belgium and Bol in the Netherlands. The EU has committed to cut greenhouse gas emissions by at least 40% by 2030 against a 1990 baseline. One of the principal mechanisms for achieving this reduction is the
Increased operational cost
1 to 3 years
Direct Virtually certain
Medium
The cost of complying with cap and trade schemes will vary based on the market price of the allowances as well as any changes in allocation. In the event that regulation is enacted and is more aggressive than the sustainability measures that we are currently undertaking to monitor our emissions and improve our energy efficiency, we may experience increases in our costs of operation and delivery. For example, energy purchases equal about $0.7 billion or approximately 1% of 2015 net revenue, which could be at risk due to regulation
To reduce carbon emissions, and address the inherent financial risks of cap and trade, PepsiCo invests in energy efficiency and other clean energy technologies. We also ensure that our facilities have strong environmental management systems in place and aligned with ISO 14001. We expect these management methods to significantly reduce the risk to our business concerning increased operational costs over the next several years as we become more energy and carbon efficient through our investments, such as two projects completed during 2016 at our
We have integrated monitoring systems to collect and analyze data, which are then subjected to external auditing by Bureau Veritas. The cost associated with administrating the annual environmental sustainability data analysis, including personnel time and the expense of the external auditing firm, is approximately $80,000. PepsiCo’s Global PPGA Team manages regulatory issues with governments and stakeholders around the world.
Risk driver
Description
Potential impact
Timeframe
Direct/ Indirect
Likelihood
Magnitude of impact
Estimated financial
implications
Management
method
Cost of
management
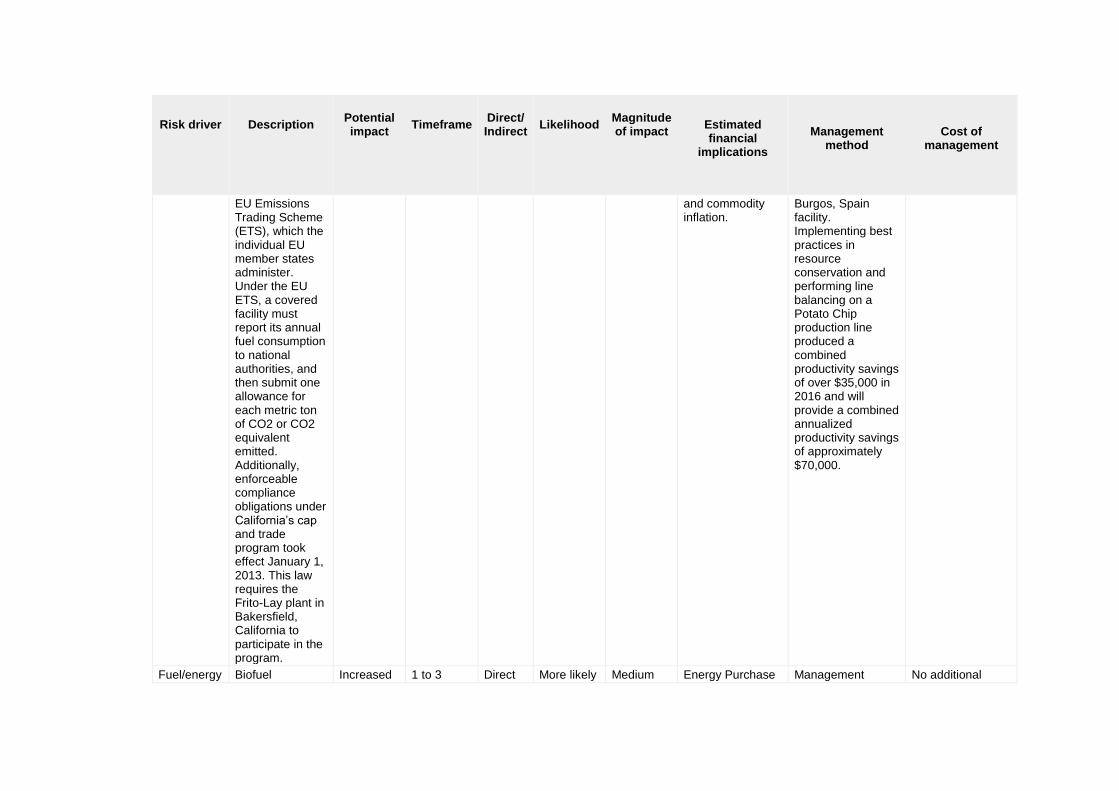
EU Emissions Trading Scheme (ETS), which the individual EU member states administer. Under the EU ETS, a covered facility must report its annual fuel consumption to national authorities, and then submit one allowance for each metric ton of CO2 or CO2 equivalent emitted. Additionally, enforceable compliance obligations under California’s cap and trade program took effect January 1, 2013. This law requires the Frito-Lay plant in Bakersfield, California to participate in the program.
and commodity inflation.
Burgos, Spain facility. Implementing best practices in resource conservation and performing line balancing on a Potato Chip production line produced a combined productivity savings of over $35,000 in 2016 and will provide a combined annualized productivity savings of approximately $70,000.
Fuel/energy Biofuel Increased 1 to 3 Direct More likely Medium Energy Purchase Management No additional
Risk driver
Description
Potential impact
Timeframe
Direct/ Indirect
Likelihood
Magnitude of impact
Estimated financial
implications
Management
method
Cost of
management
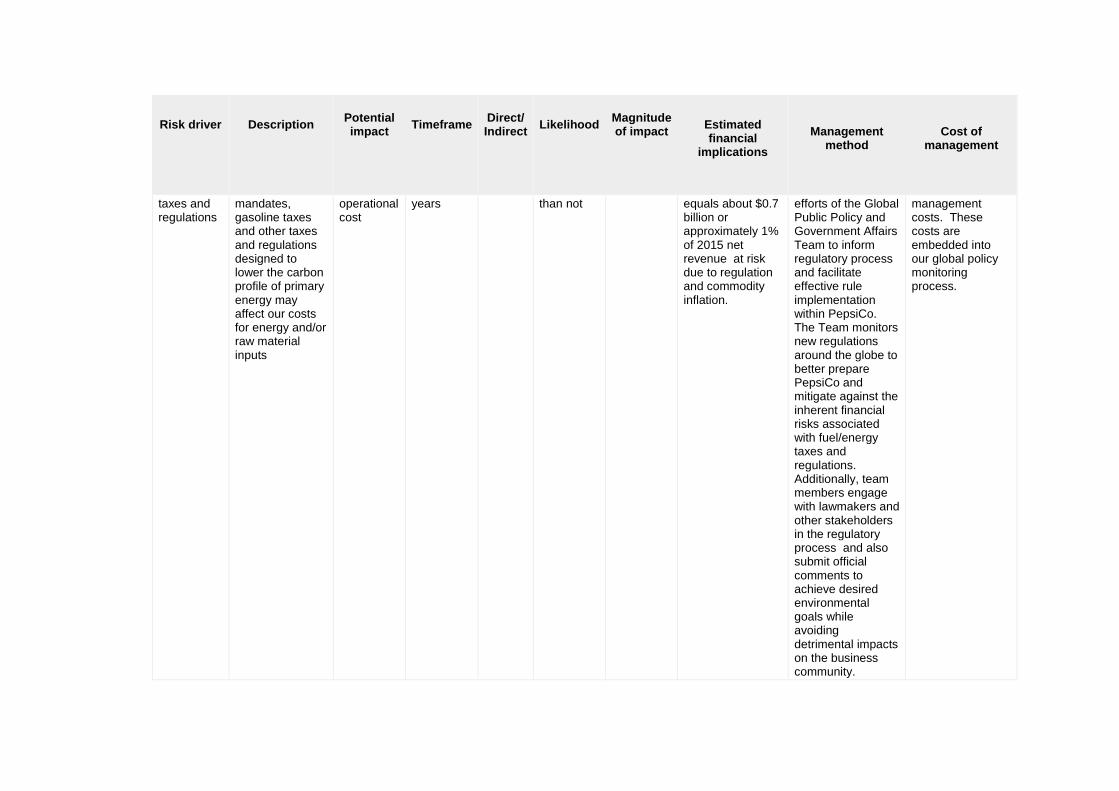
taxes and regulations
mandates, gasoline taxes and other taxes and regulations designed to lower the carbon profile of primary energy may affect our costs for energy and/or raw material inputs
operational cost
years than not equals about $0.7 billion or approximately 1% of 2015 net revenue at risk due to regulation and commodity inflation.
efforts of the Global Public Policy and Government Affairs Team to inform regulatory process and facilitate effective rule implementation within PepsiCo. The Team monitors new regulations around the globe to better prepare PepsiCo and mitigate against the inherent financial risks associated with fuel/energy taxes and regulations. Additionally, team members engage with lawmakers and other stakeholders in the regulatory process and also submit official comments to achieve desired environmental goals while avoiding detrimental impacts on the business community.
management costs. These costs are embedded into our global policy monitoring process.
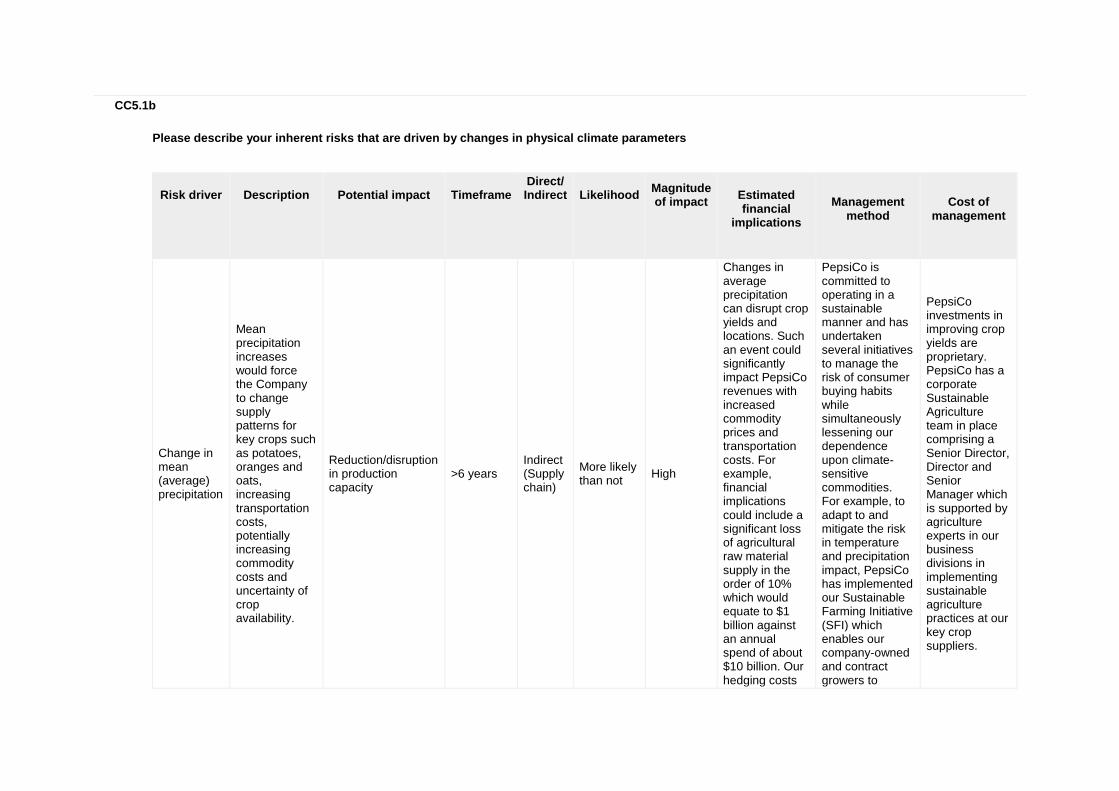
CC5.1b
Please describe your inherent risks that are driven by changes in physical climate parameters
Risk driver
Description
Potential impact
Timeframe
Direct/ Indirect
Likelihood
Magnitude of impact
Estimated financial
implications
Management
method
Cost of
management
Change in mean (average) precipitation
Mean precipitation increases would force the Company to change supply patterns for key crops such as potatoes, oranges and oats, increasing transportation costs, potentially increasing commodity costs and uncertainty of crop availability.
Reduction/disruption in production capacity
>6 years Indirect (Supply chain)
More likely than not
High
Changes in average precipitation can disrupt crop yields and locations. Such an event could significantly impact PepsiCo revenues with increased commodity prices and transportation costs. For example, financial implications could include a significant loss of agricultural raw material supply in the order of 10% which would equate to $1 billion against an annual spend of about $10 billion. Our hedging costs
PepsiCo is committed to operating in a sustainable manner and has undertaken several initiatives to manage the risk of consumer buying habits while simultaneously lessening our dependence upon climate-sensitive commodities. For example, to adapt to and mitigate the risk in temperature and precipitation impact, PepsiCo has implemented our Sustainable Farming Initiative (SFI) which enables our company-owned and contract growers to
PepsiCo investments in improving crop yields are proprietary. PepsiCo has a corporate Sustainable Agriculture team in place comprising a Senior Director, Director and Senior Manager which is supported by agriculture experts in our business divisions in implementing sustainable agriculture practices at our key crop suppliers.
Risk driver
Description
Potential impact
Timeframe
Direct/ Indirect
Likelihood
Magnitude of impact
Estimated financial
implications
Management
method
Cost of
management
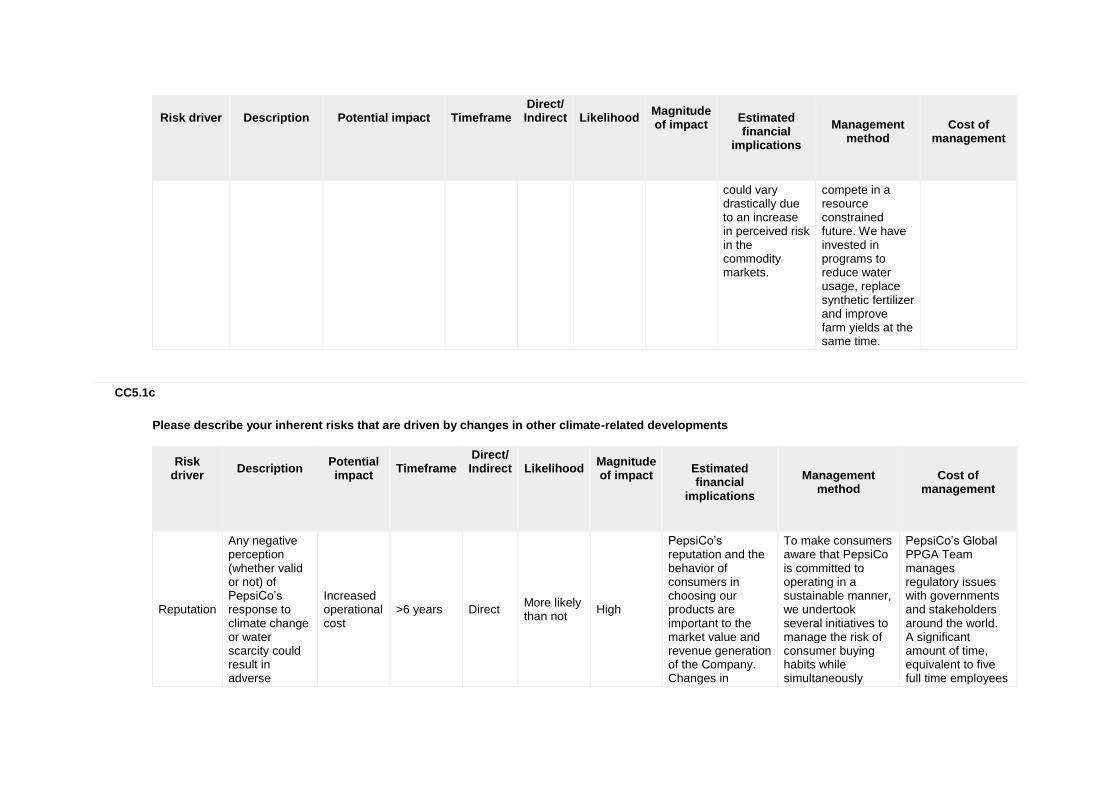
could vary drastically due to an increase in perceived risk in the commodity markets.
compete in a resource constrained future. We have invested in programs to reduce water usage, replace synthetic fertilizer and improve farm yields at the same time.
CC5.1c
Please describe your inherent risks that are driven by changes in other climate-related developments
Risk driver
Description
Potential impact
Timeframe
Direct/ Indirect
Likelihood
Magnitude of impact
Estimated financial
implications
Management
method
Cost of
management
Reputation
Any negative perception (whether valid or not) of PepsiCo’s response to climate change or water scarcity could result in adverse
Increased operational cost
>6 years Direct More likely than not
High
PepsiCo’s reputation and the behavior of consumers in choosing our products are important to the market value and revenue generation of the Company. Changes in
To make consumers aware that PepsiCo is committed to operating in a sustainable manner, we undertook several initiatives to manage the risk of consumer buying habits while simultaneously
PepsiCo’s Global PPGA Team manages regulatory issues with governments and stakeholders around the world. A significant amount of time, equivalent to five full time employees
Risk driver
Description
Potential impact
Timeframe
Direct/ Indirect
Likelihood
Magnitude of impact
Estimated financial
implications
Management
method
Cost of
management
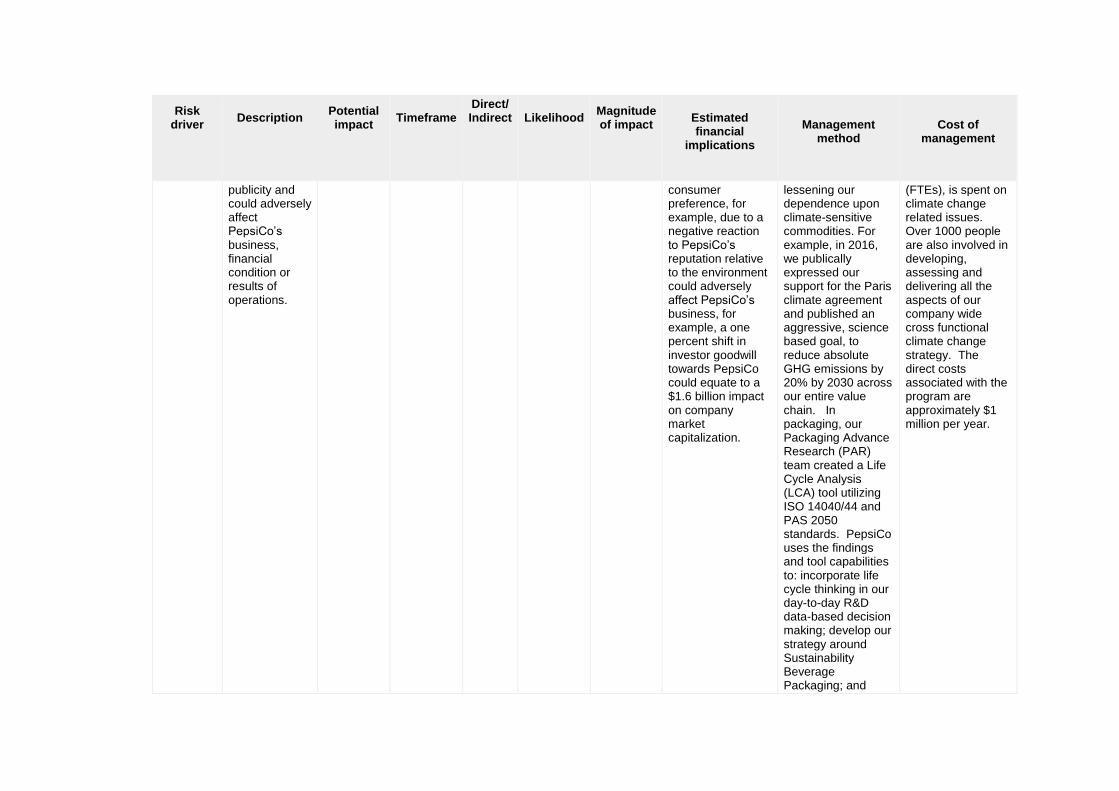
publicity and could adversely affect PepsiCo’s business, financial condition or results of operations.
consumer preference, for example, due to a negative reaction to PepsiCo’s reputation relative to the environment could adversely affect PepsiCo’s business, for example, a one percent shift in investor goodwill towards PepsiCo could equate to a $1.6 billion impact on company market capitalization.
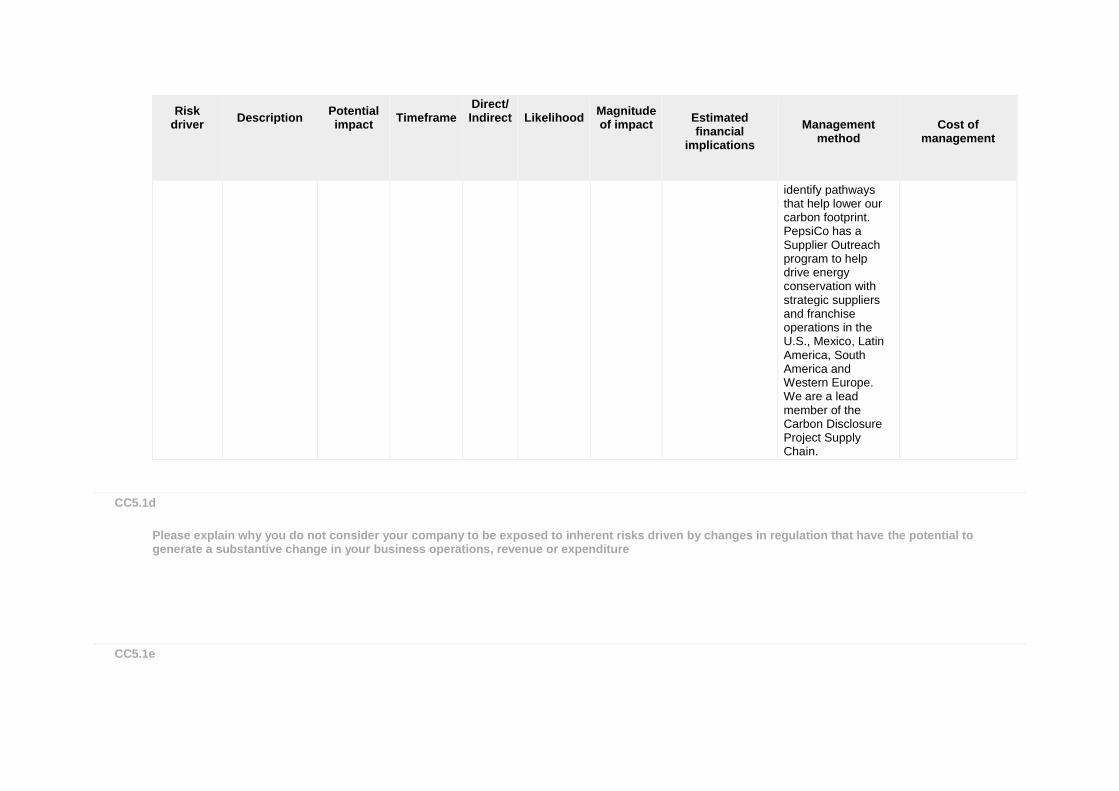
lessening our dependence upon climate-sensitive commodities. For example, in 2016, we publically expressed our support for the Paris climate agreement and published an aggressive, science based goal, to reduce absolute GHG emissions by 20% by 2030 across our entire value chain. In packaging, our Packaging Advance Research (PAR) team created a Life Cycle Analysis (LCA) tool utilizing ISO 14040/44 and PAS 2050 standards. PepsiCo uses the findings and tool capabilities to: incorporate life cycle thinking in our day-to-day R&D data-based decision making; develop our strategy around Sustainability Beverage Packaging; and
(FTEs), is spent on climate change related issues. Over 1000 people are also involved in developing, assessing and delivering all the aspects of our company wide cross functional climate change strategy. The direct costs associated with the program are approximately $1 million per year.
Risk driver
Description
Potential impact
Timeframe
Direct/ Indirect
Likelihood
Magnitude of impact
Estimated financial
implications
Management
method
Cost of
management
identify pathways that help lower our carbon footprint. PepsiCo has a Supplier Outreach program to help drive energy conservation with strategic suppliers and franchise operations in the U.S., Mexico, Latin America, South America and Western Europe. We are a lead member of the Carbon Disclosure Project Supply Chain.
CC5.1d
Please explain why you do not consider your company to be exposed to inherent risks driven by changes in regulation that have the potential to generate a substantive change in your business operations, revenue or expenditure
CC5.1e
Please explain why you do not consider your company to be exposed to inherent risks driven by changes in physical climate parameters that have the potential to generate a substantive change in your business operations, revenue or expenditure
CC5.1f
Please explain why you do not consider your company to be exposed to inherent risks driven by changes in other climate-related developments that have the potential to generate a substantive change in your business operations, revenue or expenditure
Further Information
Page: CC6. Climate Change Opportunities
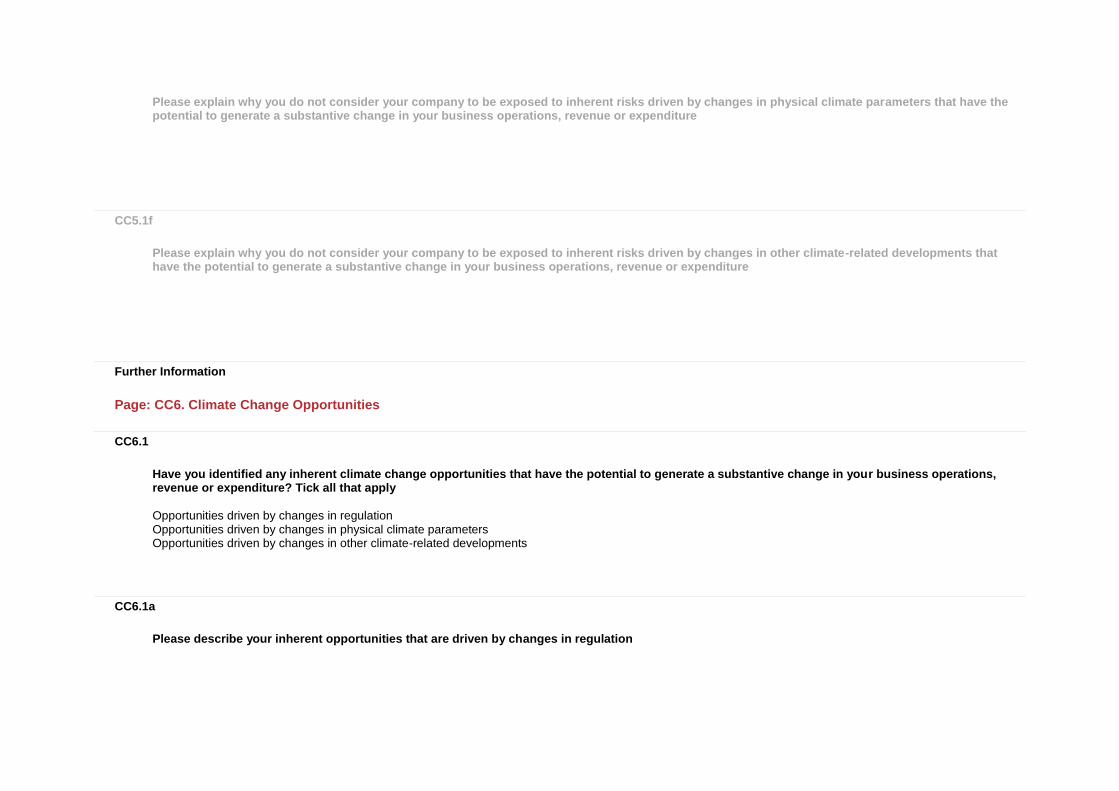
CC6.1
Have you identified any inherent climate change opportunities that have the potential to generate a substantive change in your business operations, revenue or expenditure? Tick all that apply
Opportunities driven by changes in regulation Opportunities driven by changes in physical climate parameters Opportunities driven by changes in other climate-related developments
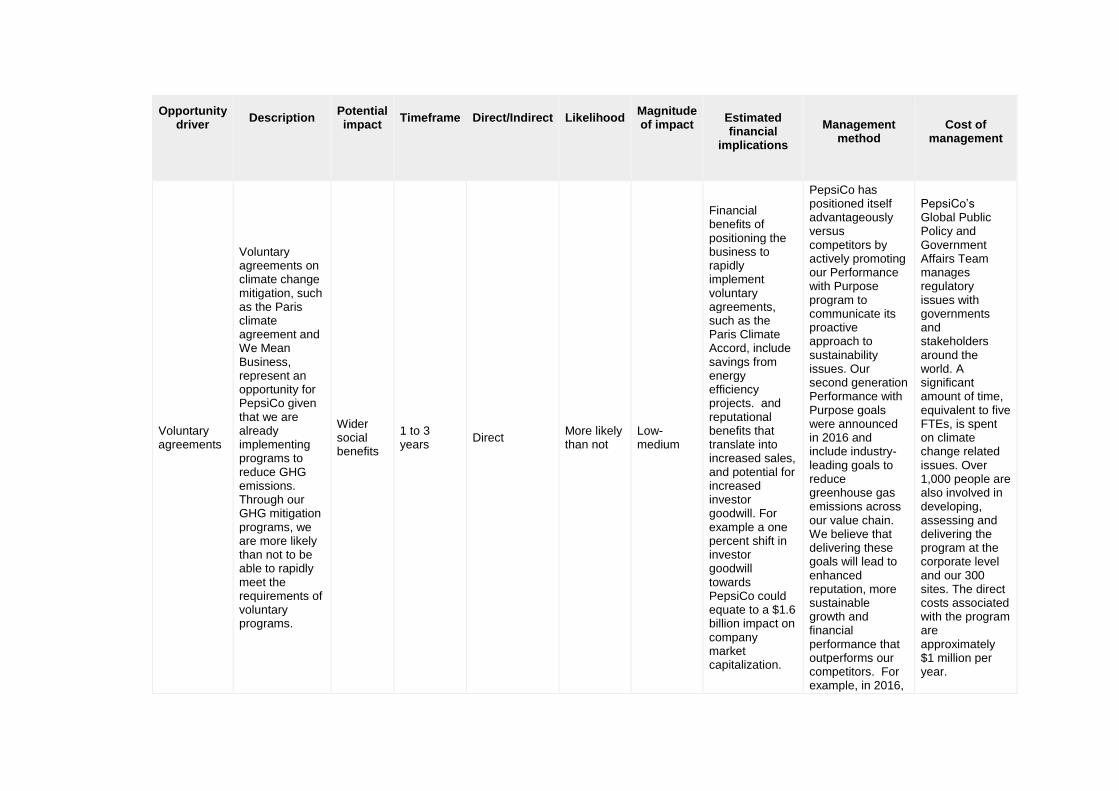
CC6.1a
Please describe your inherent opportunities that are driven by changes in regulation
Opportunity driver
Description
Potential impact
Timeframe
Direct/Indirect
Likelihood
Magnitude of impact
Estimated financial
implications
Management
method
Cost of
management
Voluntary agreements
Voluntary agreements on climate change mitigation, such as the Paris climate agreement and We Mean Business, represent an opportunity for PepsiCo given that we are already implementing programs to reduce GHG emissions. Through our GHG mitigation programs, we are more likely than not to be able to rapidly meet the requirements of voluntary programs.
Wider social benefits
1 to 3 years
Direct More likely than not
Low-medium
Financial benefits of positioning the business to rapidly implement voluntary agreements, such as the Paris Climate Accord, include savings from energy efficiency projects. and reputational benefits that translate into increased sales, and potential for increased investor goodwill. For example a one percent shift in investor goodwill towards PepsiCo could equate to a $1.6 billion impact on company market capitalization.
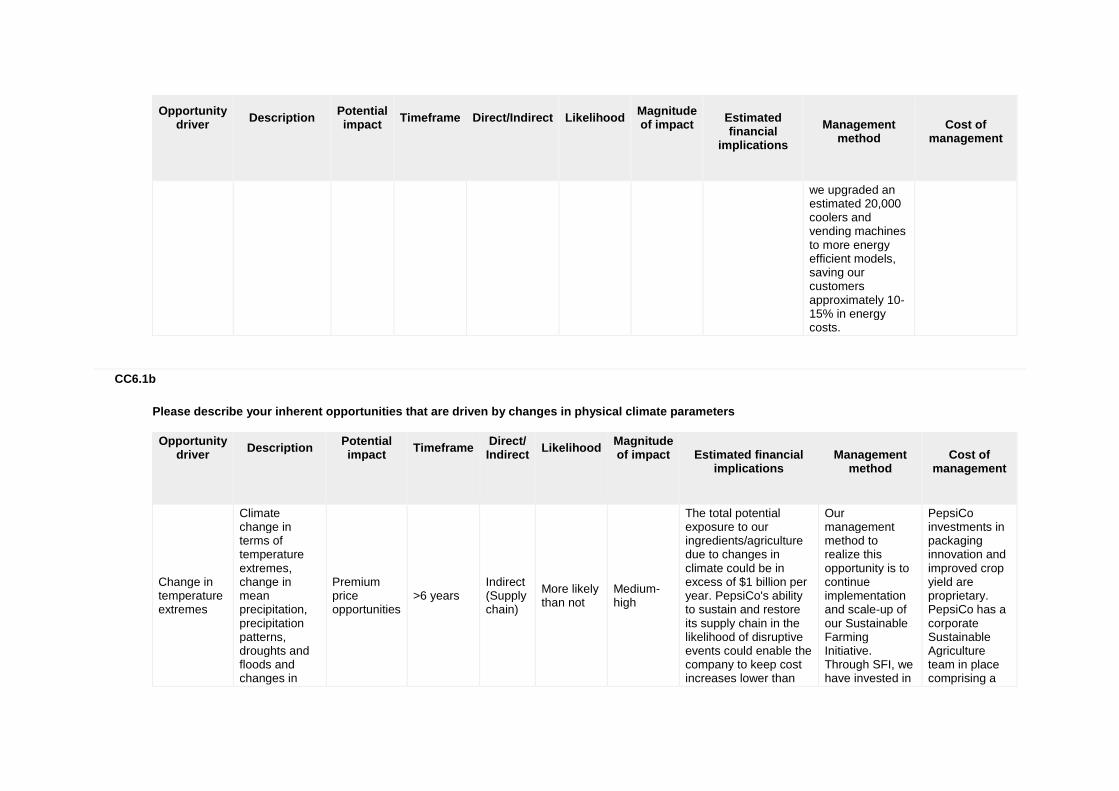
PepsiCo has positioned itself advantageously versus competitors by actively promoting our Performance with Purpose program to communicate its proactive approach to sustainability issues. Our second generation Performance with Purpose goals were announced in 2016 and include industry-leading goals to reduce greenhouse gas emissions across our value chain. We believe that delivering these goals will lead to enhanced reputation, more sustainable growth and financial performance that outperforms our competitors. For example, in 2016,
PepsiCo’s Global Public Policy and Government Affairs Team manages regulatory issues with governments and stakeholders around the world. A significant amount of time, equivalent to five FTEs, is spent on climate change related issues. Over 1,000 people are also involved in developing, assessing and delivering the program at the corporate level and our 300 sites. The direct costs associated with the program are approximately $1 million per year.
Opportunity driver
Description
Potential impact
Timeframe
Direct/Indirect
Likelihood
Magnitude of impact
Estimated financial
implications
Management
method
Cost of
management
we upgraded an estimated 20,000 coolers and vending machines to more energy efficient models, saving our customers approximately 10-15% in energy costs.
CC6.1b
Please describe your inherent opportunities that are driven by changes in physical climate parameters
Opportunity driver
Description
Potential impact
Timeframe
Direct/ Indirect
Likelihood
Magnitude of impact
Estimated financial
implications
Management
method
Cost of
management
Change in temperature extremes
Climate change in terms of temperature extremes, change in mean precipitation, precipitation patterns, droughts and floods and changes in
Premium price opportunities
>6 years Indirect (Supply chain)
More likely than not
Medium-high
The total potential exposure to our ingredients/agriculture due to changes in climate could be in excess of $1 billion per year. PepsiCo's ability to sustain and restore its supply chain in the likelihood of disruptive events could enable the company to keep cost increases lower than
Our management method to realize this opportunity is to continue implementation and scale-up of our Sustainable Farming Initiative. Through SFI, we have invested in
PepsiCo investments in packaging innovation and improved crop yield are proprietary. PepsiCo has a corporate Sustainable Agriculture team in place comprising a
Opportunity driver
Description
Potential impact
Timeframe
Direct/ Indirect
Likelihood
Magnitude of impact
Estimated financial
implications
Management
method
Cost of
management
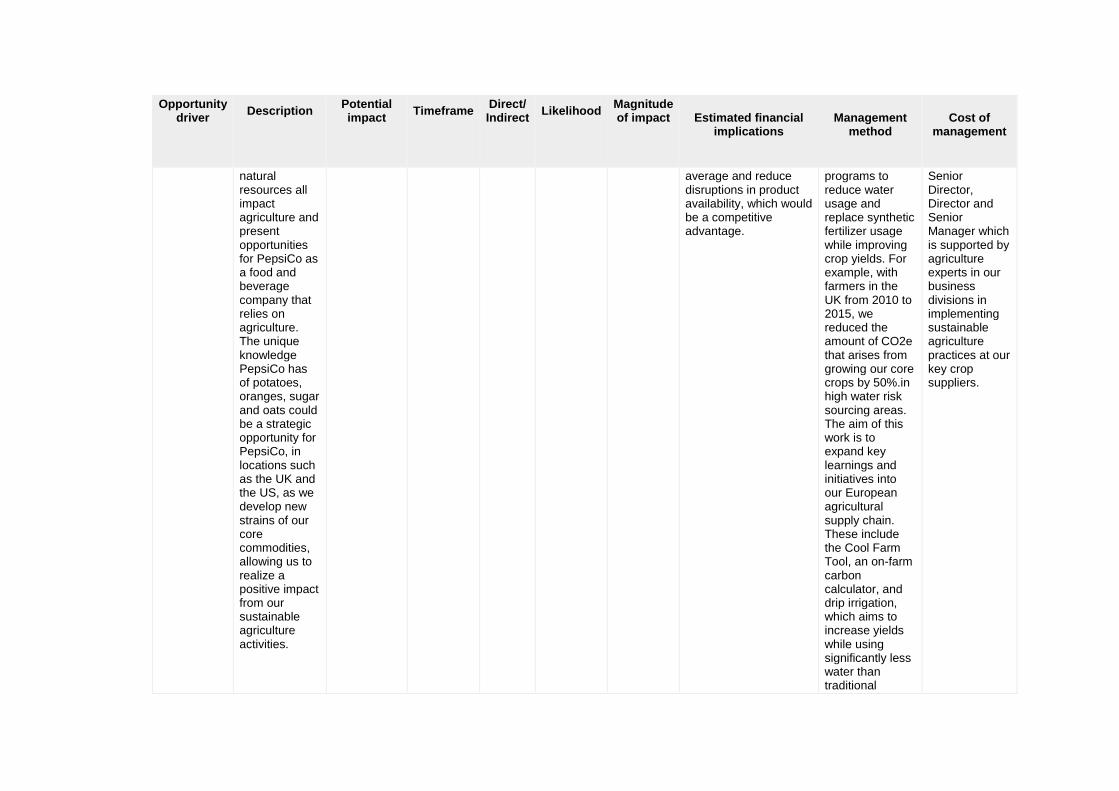
natural resources all impact agriculture and present opportunities for PepsiCo as a food and beverage company that relies on agriculture. The unique knowledge PepsiCo has of potatoes, oranges, sugar and oats could be a strategic opportunity for PepsiCo, in locations such as the UK and the US, as we develop new strains of our core commodities, allowing us to realize a positive impact from our sustainable agriculture activities.
average and reduce disruptions in product availability, which would be a competitive advantage.
programs to reduce water usage and replace synthetic fertilizer usage while improving crop yields. For example, with farmers in the UK from 2010 to 2015, we reduced the amount of CO2e that arises from growing our core crops by 50%.in high water risk sourcing areas. The aim of this work is to expand key learnings and initiatives into our European agricultural supply chain. These include the Cool Farm Tool, an on-farm carbon calculator, and drip irrigation, which aims to increase yields while using significantly less water than traditional
Senior Director, Director and Senior Manager which is supported by agriculture experts in our business divisions in implementing sustainable agriculture practices at our key crop suppliers.
Opportunity driver
Description
Potential impact
Timeframe
Direct/ Indirect
Likelihood
Magnitude of impact
Estimated financial
implications
Management
method
Cost of
management
irrigation techniques.
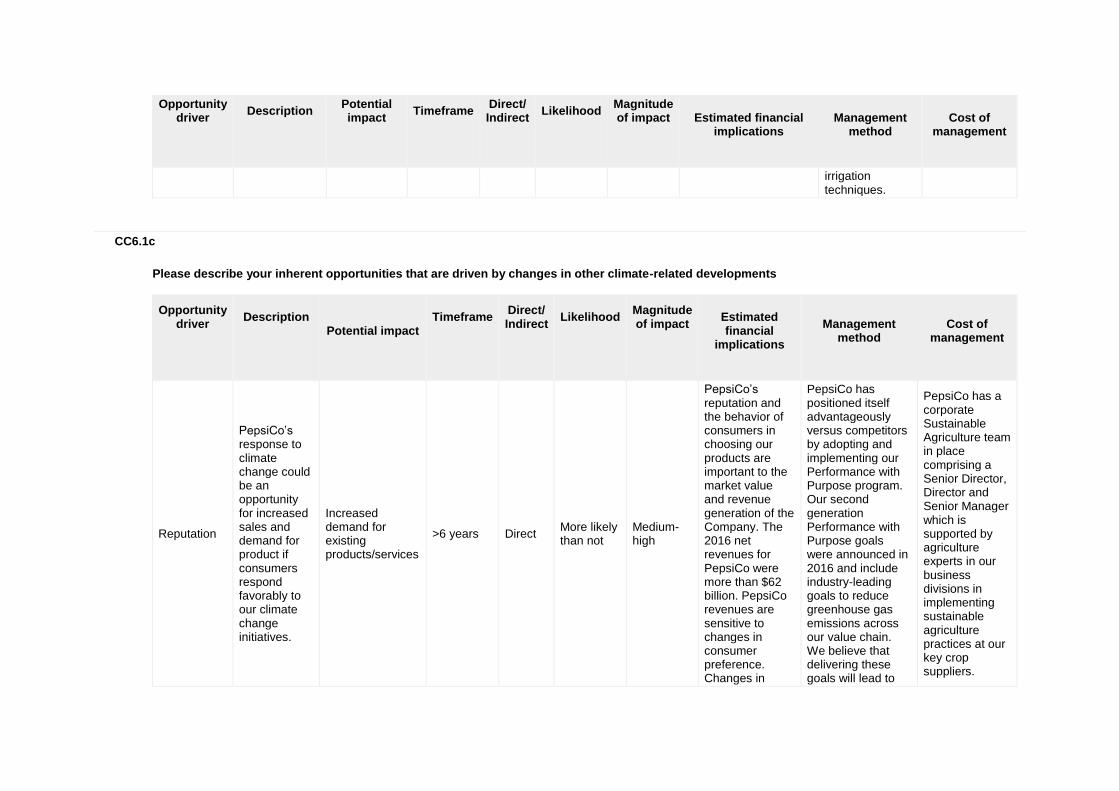
CC6.1c
Please describe your inherent opportunities that are driven by changes in other climate-related developments
Opportunity driver
Description
Potential impact
Timeframe
Direct/ Indirect
Likelihood
Magnitude of impact
Estimated financial
implications
Management
method
Cost of
management
Reputation
PepsiCo’s response to climate change could be an opportunity for increased sales and demand for product if consumers respond favorably to our climate change initiatives.
Increased demand for existing products/services
>6 years Direct More likely than not
Medium-high
PepsiCo’s reputation and the behavior of consumers in choosing our products are important to the market value and revenue generation of the Company. The 2016 net revenues for PepsiCo were more than $62 billion. PepsiCo revenues are sensitive to changes in consumer preference. Changes in
PepsiCo has positioned itself advantageously versus competitors by adopting and implementing our Performance with Purpose program. Our second generation Performance with Purpose goals were announced in 2016 and include industry-leading goals to reduce greenhouse gas emissions across our value chain. We believe that delivering these goals will lead to
PepsiCo has a corporate Sustainable Agriculture team in place comprising a Senior Director, Director and Senior Manager which is supported by agriculture experts in our business divisions in implementing sustainable agriculture practices at our key crop suppliers.
Opportunity driver
Description
Potential impact
Timeframe
Direct/ Indirect
Likelihood
Magnitude of impact
Estimated financial
implications
Management
method
Cost of
management
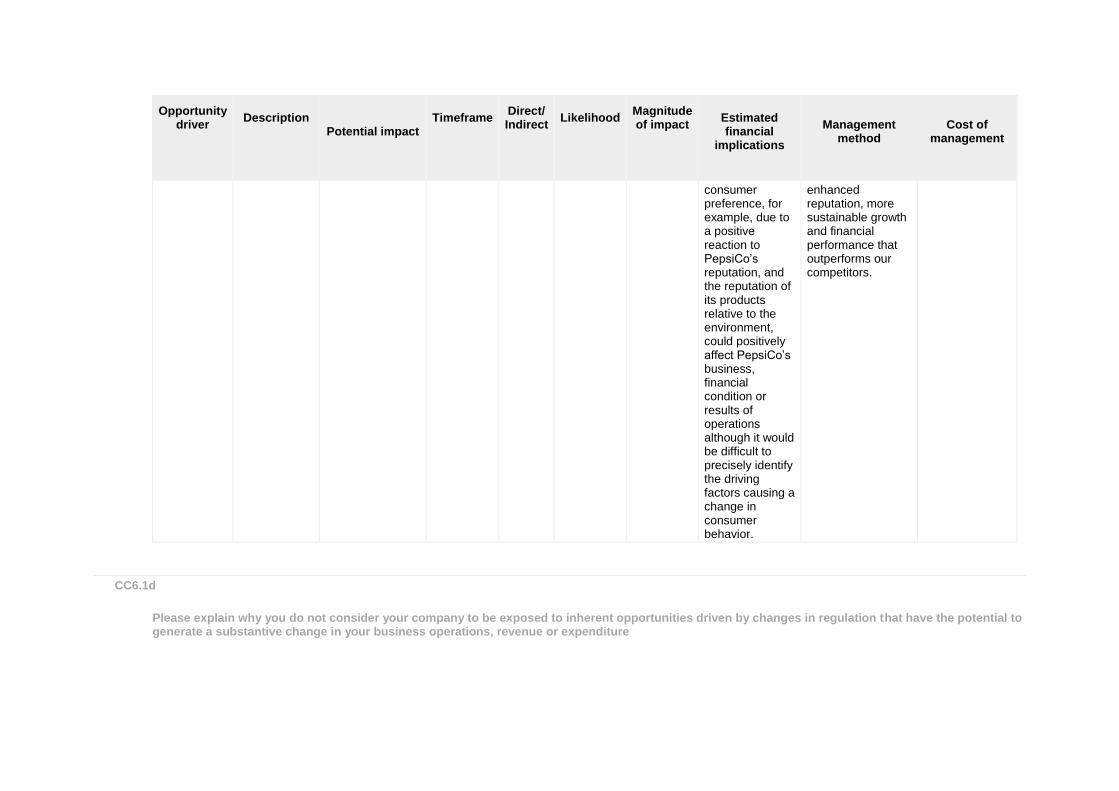
consumer preference, for example, due to a positive reaction to PepsiCo’s reputation, and the reputation of its products relative to the environment, could positively affect PepsiCo’s business, financial condition or results of operations although it would be difficult to precisely identify the driving factors causing a change in consumer behavior.
enhanced reputation, more sustainable growth and financial performance that outperforms our competitors.
CC6.1d
Please explain why you do not consider your company to be exposed to inherent opportunities driven by changes in regulation that have the potential to generate a substantive change in your business operations, revenue or expenditure
CC6.1e
Please explain why you do not consider your company to be exposed to inherent opportunities driven by changes in physical climate parameters that have the potential to generate a substantive change in your business operations, revenue or expenditure
CC6.1f
Please explain why you do not consider your company to be exposed to inherent opportunities driven by changes in other climate-related developments that have the potential to generate a substantive change in your business operations, revenue or expenditure
Further Information
Module: GHG Emissions Accounting, Energy and Fuel Use, and Trading
Page: CC7. Emissions Methodology
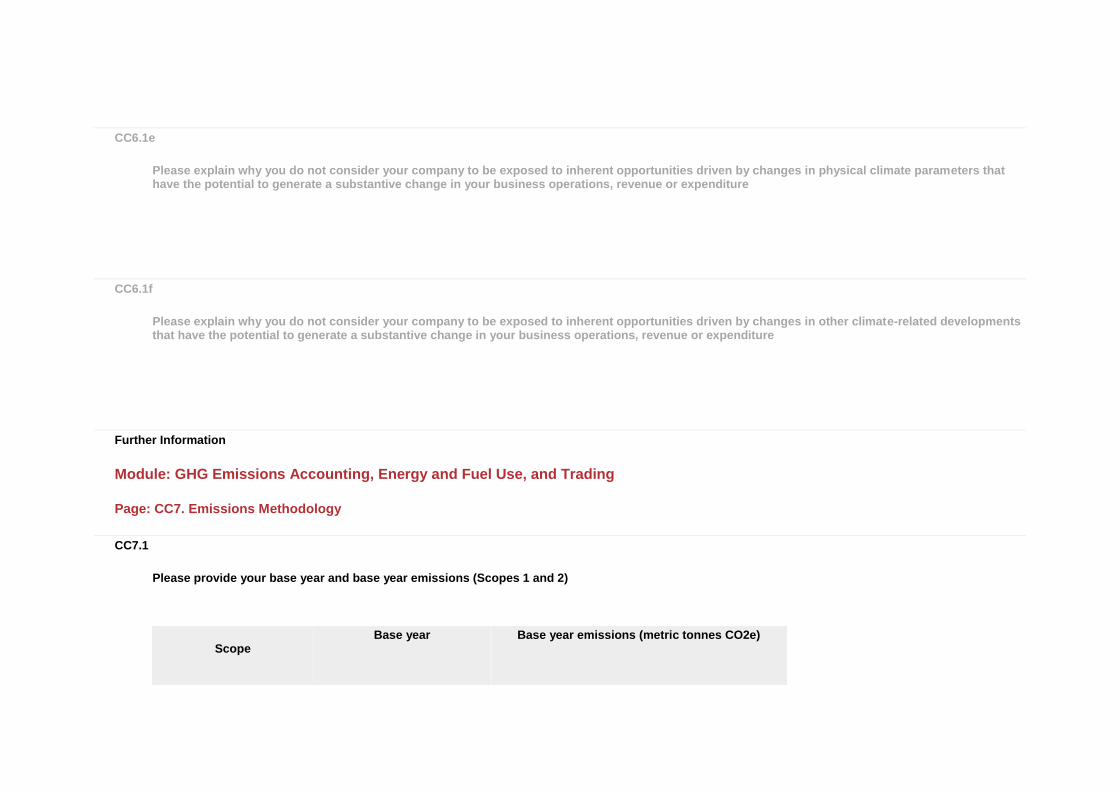
CC7.1
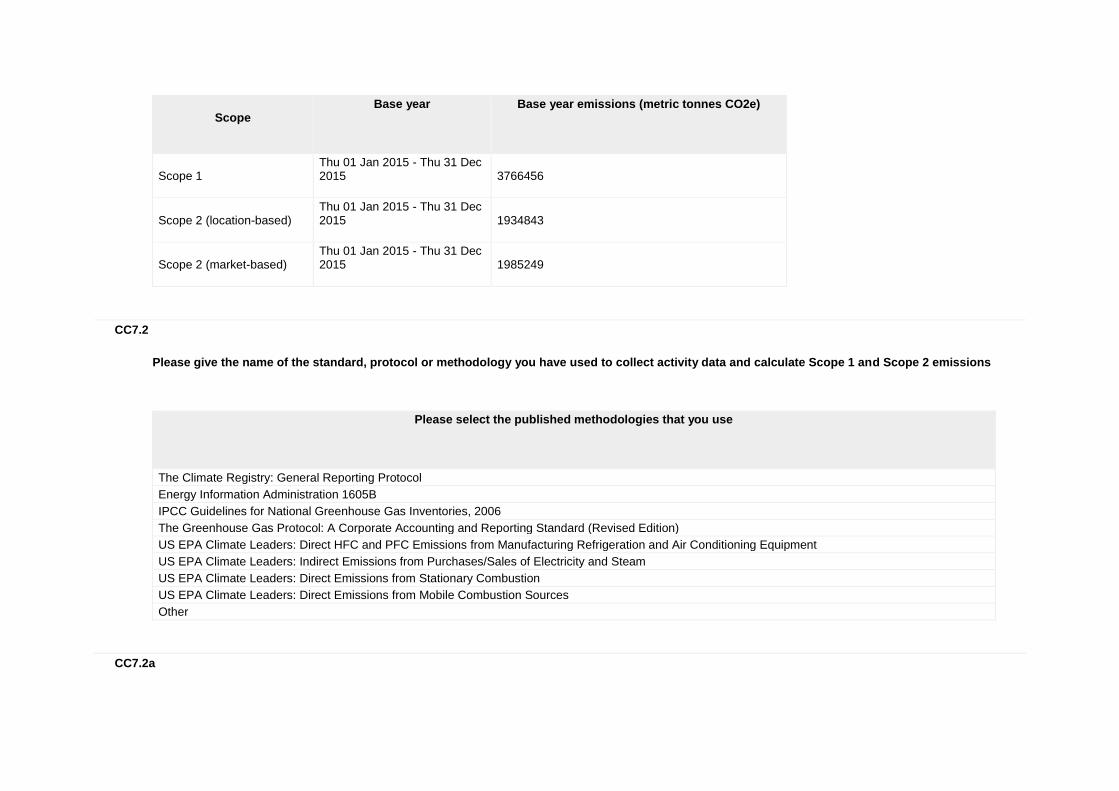
Please provide your base year and base year emissions (Scopes 1 and 2)
Scope
Base year
Base year emissions (metric tonnes CO2e)
Scope
Base year
Base year emissions (metric tonnes CO2e)
Scope 1 Thu 01 Jan 2015 - Thu 31 Dec 2015
3766456
Scope 2 (location-based) Thu 01 Jan 2015 - Thu 31 Dec 2015
1934843
Scope 2 (market-based) Thu 01 Jan 2015 - Thu 31 Dec 2015
1985249
CC7.2
Please give the name of the standard, protocol or methodology you have used to collect activity data and calculate Scope 1 and Scope 2 emissions
Please select the published methodologies that you use
The Climate Registry: General Reporting Protocol
Energy Information Administration 1605B
IPCC Guidelines for National Greenhouse Gas Inventories, 2006
The Greenhouse Gas Protocol: A Corporate Accounting and Reporting Standard (Revised Edition)
US EPA Climate Leaders: Direct HFC and PFC Emissions from Manufacturing Refrigeration and Air Conditioning Equipment
US EPA Climate Leaders: Indirect Emissions from Purchases/Sales of Electricity and Steam
US EPA Climate Leaders: Direct Emissions from Stationary Combustion
US EPA Climate Leaders: Direct Emissions from Mobile Combustion Sources
Other
CC7.2a
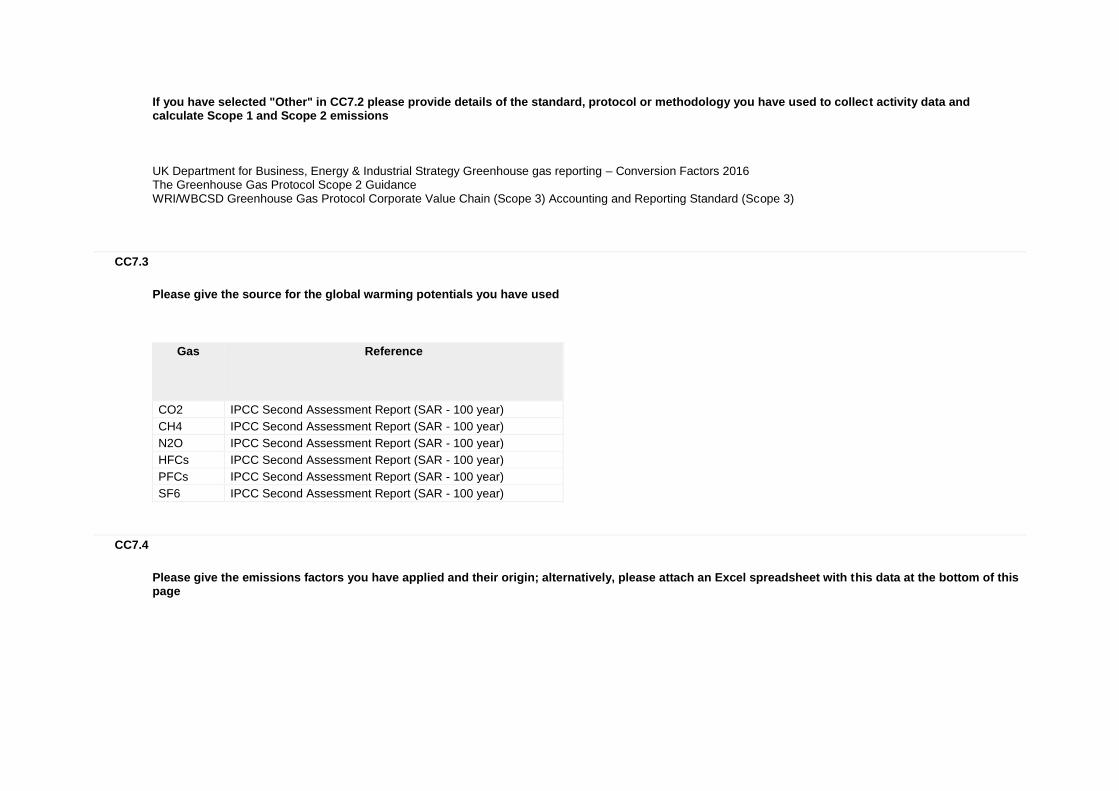
If you have selected "Other" in CC7.2 please provide details of the standard, protocol or methodology you have used to collect activity data and calculate Scope 1 and Scope 2 emissions
UK Department for Business, Energy & Industrial Strategy Greenhouse gas reporting – Conversion Factors 2016 The Greenhouse Gas Protocol Scope 2 Guidance WRI/WBCSD Greenhouse Gas Protocol Corporate Value Chain (Scope 3) Accounting and Reporting Standard (Scope 3)
CC7.3
Please give the source for the global warming potentials you have used
Gas
Reference
CO2 IPCC Second Assessment Report (SAR - 100 year)
CH4 IPCC Second Assessment Report (SAR - 100 year)
N2O IPCC Second Assessment Report (SAR - 100 year)
HFCs IPCC Second Assessment Report (SAR - 100 year)
PFCs IPCC Second Assessment Report (SAR - 100 year)
SF6 IPCC Second Assessment Report (SAR - 100 year)
CC7.4
Please give the emissions factors you have applied and their origin; alternatively, please attach an Excel spreadsheet with this data at the bottom of this page
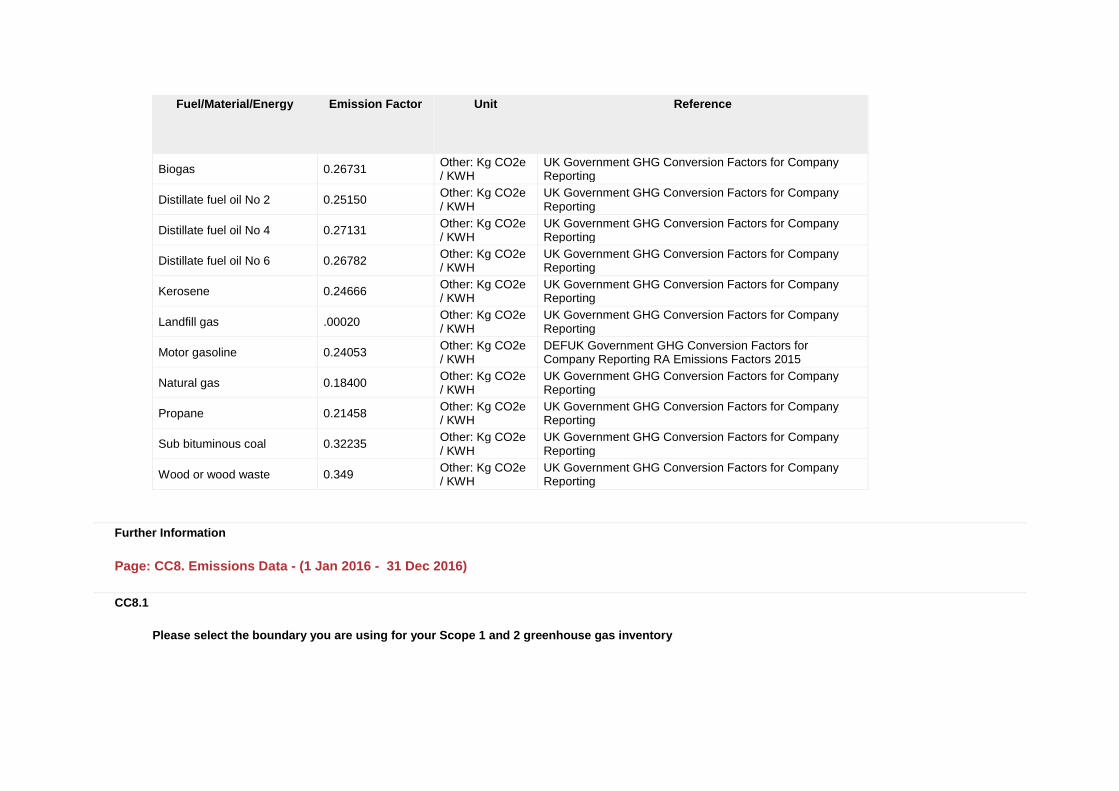
Fuel/Material/Energy
Emission Factor
Unit
Reference
Biogas 0.26731 Other: Kg CO2e / KWH
UK Government GHG Conversion Factors for Company Reporting
Distillate fuel oil No 2 0.25150 Other: Kg CO2e / KWH
UK Government GHG Conversion Factors for Company Reporting
Distillate fuel oil No 4 0.27131 Other: Kg CO2e / KWH
UK Government GHG Conversion Factors for Company Reporting
Distillate fuel oil No 6 0.26782 Other: Kg CO2e / KWH
UK Government GHG Conversion Factors for Company Reporting
Kerosene 0.24666 Other: Kg CO2e / KWH
UK Government GHG Conversion Factors for Company Reporting
Landfill gas .00020 Other: Kg CO2e / KWH
UK Government GHG Conversion Factors for Company Reporting
Motor gasoline 0.24053 Other: Kg CO2e / KWH
DEFUK Government GHG Conversion Factors for Company Reporting RA Emissions Factors 2015
Natural gas 0.18400 Other: Kg CO2e / KWH
UK Government GHG Conversion Factors for Company Reporting
Propane 0.21458 Other: Kg CO2e / KWH
UK Government GHG Conversion Factors for Company Reporting
Sub bituminous coal 0.32235 Other: Kg CO2e / KWH
UK Government GHG Conversion Factors for Company Reporting
Wood or wood waste 0.349 Other: Kg CO2e / KWH
UK Government GHG Conversion Factors for Company Reporting
Further Information
Page: CC8. Emissions Data - (1 Jan 2016 - 31 Dec 2016)
CC8.1
Please select the boundary you are using for your Scope 1 and 2 greenhouse gas inventory
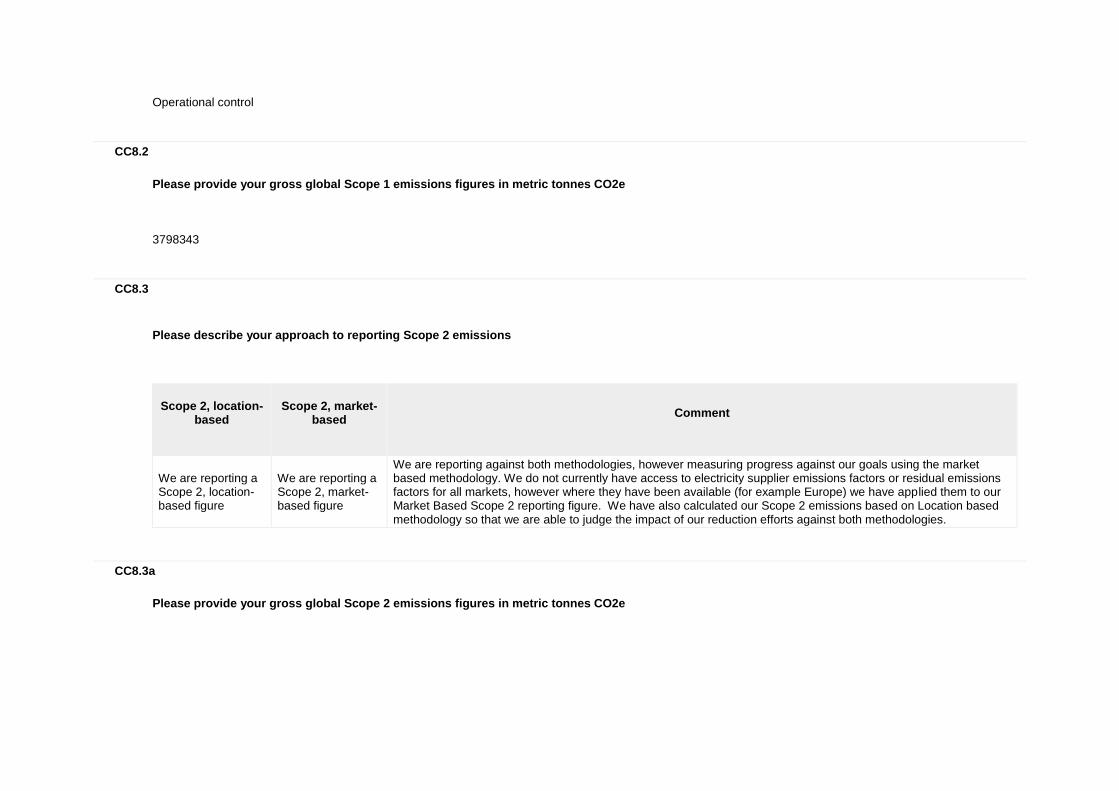
Operational control
CC8.2
Please provide your gross global Scope 1 emissions figures in metric tonnes CO2e
3798343
CC8.3
Please describe your approach to reporting Scope 2 emissions
Scope 2, location-
based
Scope 2, market-
based
Comment
We are reporting a Scope 2, location-based figure
We are reporting a Scope 2, market-based figure
We are reporting against both methodologies, however measuring progress against our goals using the market based methodology. We do not currently have access to electricity supplier emissions factors or residual emissions factors for all markets, however where they have been available (for example Europe) we have applied them to our Market Based Scope 2 reporting figure. We have also calculated our Scope 2 emissions based on Location based methodology so that we are able to judge the impact of our reduction efforts against both methodologies.
CC8.3a
Please provide your gross global Scope 2 emissions figures in metric tonnes CO2e
Scope 2, location-based
Scope 2, market-based (if applicable)
Comment
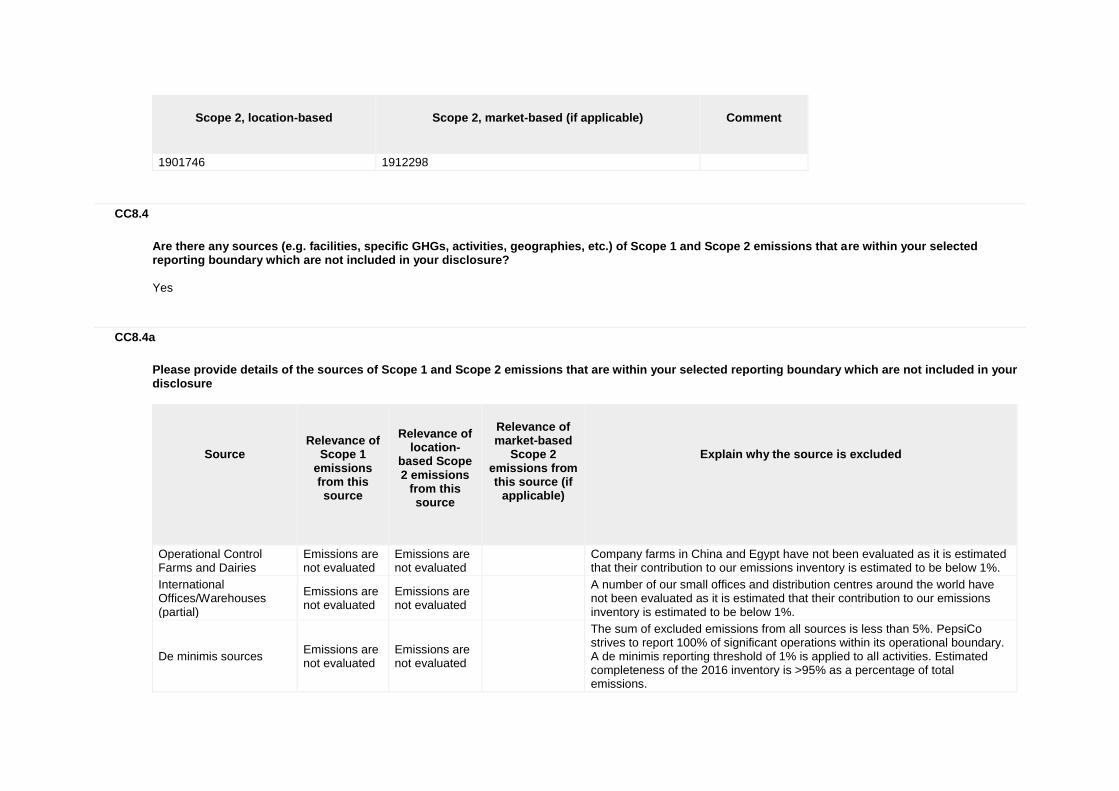
1901746 1912298
CC8.4
Are there any sources (e.g. facilities, specific GHGs, activities, geographies, etc.) of Scope 1 and Scope 2 emissions that are within your selected reporting boundary which are not included in your disclosure?
Yes
CC8.4a
Please provide details of the sources of Scope 1 and Scope 2 emissions that are within your selected reporting boundary which are not included in your disclosure
Source
Relevance of
Scope 1 emissions from this source
Relevance of
location-based Scope 2 emissions
from this source
Relevance of market-based
Scope 2 emissions from this source (if
applicable)
Explain why the source is excluded
Operational Control Farms and Dairies
Emissions are not evaluated
Emissions are not evaluated
Company farms in China and Egypt have not been evaluated as it is estimated that their contribution to our emissions inventory is estimated to be below 1%.
International Offices/Warehouses (partial)
Emissions are not evaluated
Emissions are not evaluated
A number of our small offices and distribution centres around the world have not been evaluated as it is estimated that their contribution to our emissions inventory is estimated to be below 1%.
De minimis sources Emissions are not evaluated
Emissions are not evaluated
The sum of excluded emissions from all sources is less than 5%. PepsiCo strives to report 100% of significant operations within its operational boundary. A de minimis reporting threshold of 1% is applied to all activities. Estimated completeness of the 2016 inventory is >95% as a percentage of total emissions.
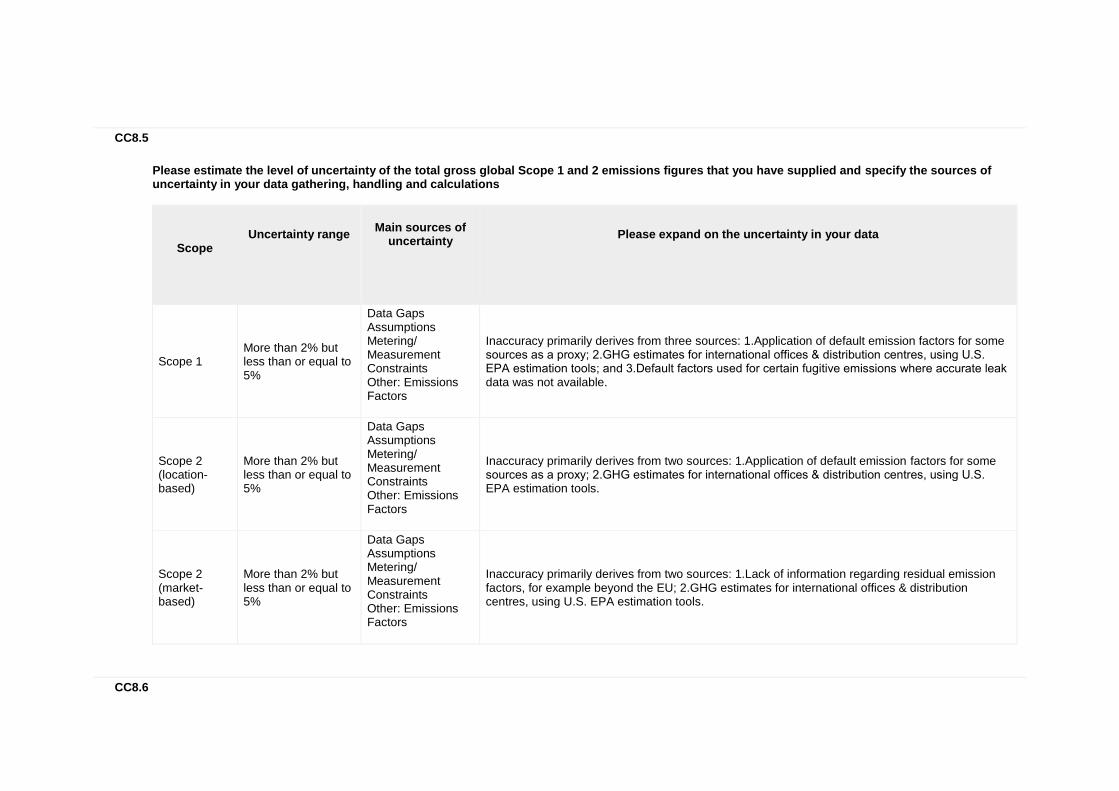
CC8.5
Please estimate the level of uncertainty of the total gross global Scope 1 and 2 emissions figures that you have supplied and specify the sources of uncertainty in your data gathering, handling and calculations
Scope
Uncertainty range
Main sources of
uncertainty
Please expand on the uncertainty in your data
Scope 1 More than 2% but less than or equal to 5%
Data Gaps Assumptions Metering/ Measurement Constraints Other: Emissions Factors
Inaccuracy primarily derives from three sources: 1.Application of default emission factors for some sources as a proxy; 2.GHG estimates for international offices & distribution centres, using U.S. EPA estimation tools; and 3.Default factors used for certain fugitive emissions where accurate leak data was not available.
Scope 2 (location-based)
More than 2% but less than or equal to 5%
Data Gaps Assumptions Metering/ Measurement Constraints Other: Emissions Factors
Inaccuracy primarily derives from two sources: 1.Application of default emission factors for some sources as a proxy; 2.GHG estimates for international offices & distribution centres, using U.S. EPA estimation tools.
Scope 2 (market-based)
More than 2% but less than or equal to 5%
Data Gaps Assumptions Metering/ Measurement Constraints Other: Emissions Factors
Inaccuracy primarily derives from two sources: 1.Lack of information regarding residual emission factors, for example beyond the EU; 2.GHG estimates for international offices & distribution centres, using U.S. EPA estimation tools.
CC8.6
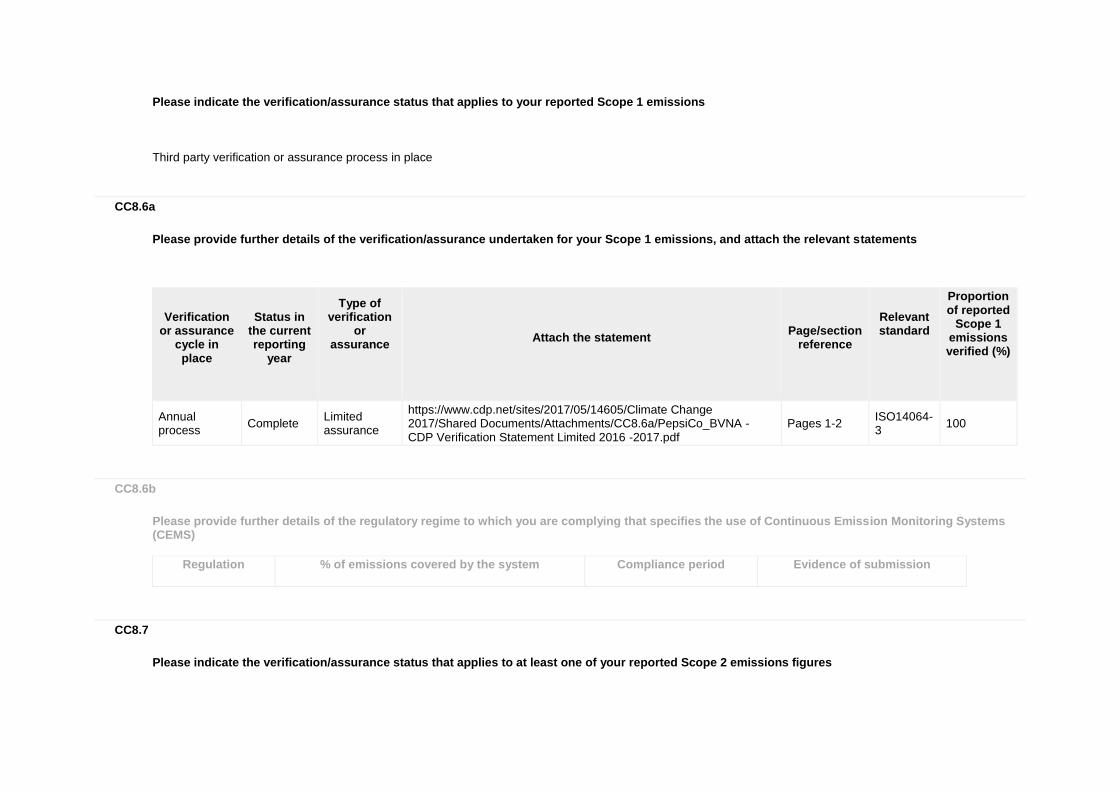
Please indicate the verification/assurance status that applies to your reported Scope 1 emissions
Third party verification or assurance process in place
CC8.6a
Please provide further details of the verification/assurance undertaken for your Scope 1 emissions, and attach the relevant statements
Verification
or assurance cycle in place
Status in
the current reporting
year
Type of verification
or assurance
Attach the statement
Page/section
reference
Relevant standard
Proportion of reported
Scope 1 emissions verified (%)
Annual process
Complete Limited assurance
https://www.cdp.net/sites/2017/05/14605/Climate Change 2017/Shared Documents/Attachments/CC8.6a/PepsiCo_BVNA - CDP Verification Statement Limited 2016 -2017.pdf
Pages 1-2 ISO14064-3
100
CC8.6b
Please provide further details of the regulatory regime to which you are complying that specifies the use of Continuous Emission Monitoring Systems (CEMS)
Regulation
% of emissions covered by the system
Compliance period
Evidence of submission
CC8.7
Please indicate the verification/assurance status that applies to at least one of your reported Scope 2 emissions figures
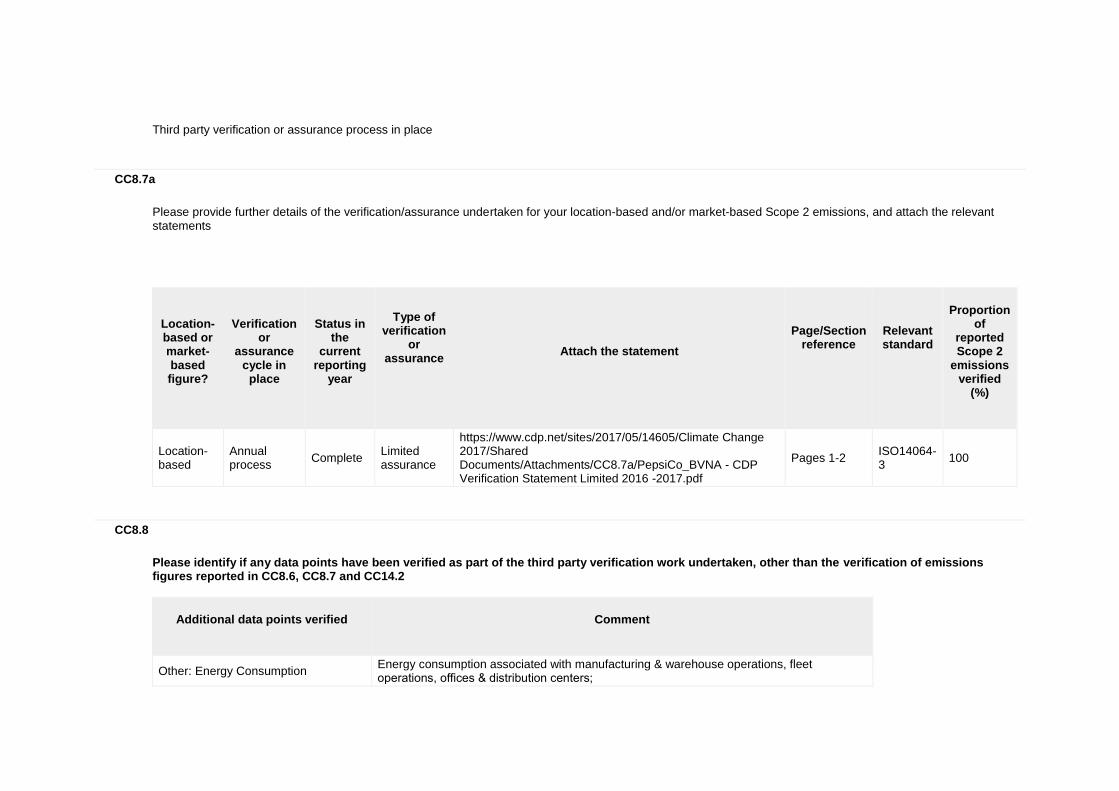
Third party verification or assurance process in place
CC8.7a
Please provide further details of the verification/assurance undertaken for your location-based and/or market-based Scope 2 emissions, and attach the relevant statements
Location-based or market-based figure?
Verification
or assurance
cycle in place
Status in
the current
reporting year
Type of verification
or assurance
Attach the statement
Page/Section reference
Relevant standard
Proportion
of reported Scope 2
emissions verified
(%)
Location-based
Annual process
Complete Limited assurance
https://www.cdp.net/sites/2017/05/14605/Climate Change 2017/Shared Documents/Attachments/CC8.7a/PepsiCo_BVNA - CDP Verification Statement Limited 2016 -2017.pdf
Pages 1-2 ISO14064-3
100
CC8.8
Please identify if any data points have been verified as part of the third party verification work undertaken, other than the verification of emissions figures reported in CC8.6, CC8.7 and CC14.2
Additional data points verified
Comment
Other: Energy Consumption Energy consumption associated with manufacturing & warehouse operations, fleet operations, offices & distribution centers;
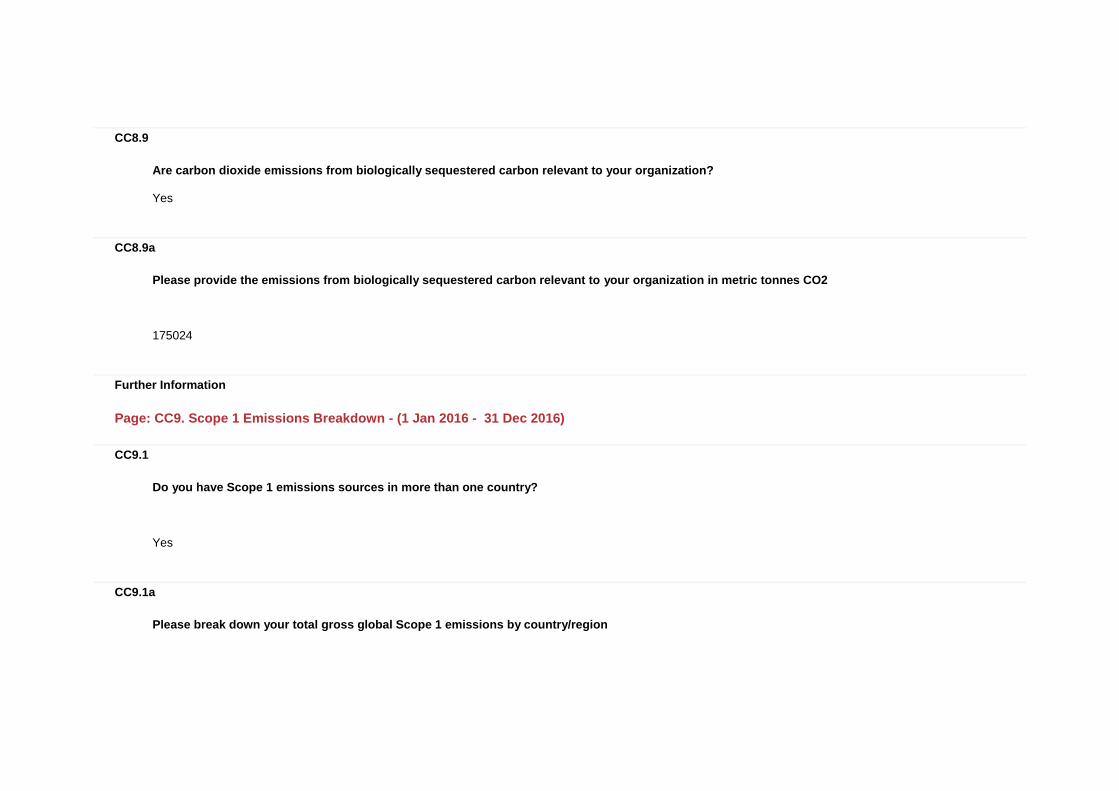
CC8.9
Are carbon dioxide emissions from biologically sequestered carbon relevant to your organization?
Yes
CC8.9a
Please provide the emissions from biologically sequestered carbon relevant to your organization in metric tonnes CO2
175024
Further Information
Page: CC9. Scope 1 Emissions Breakdown - (1 Jan 2016 - 31 Dec 2016)
CC9.1
Do you have Scope 1 emissions sources in more than one country?
Yes
CC9.1a
Please break down your total gross global Scope 1 emissions by country/region
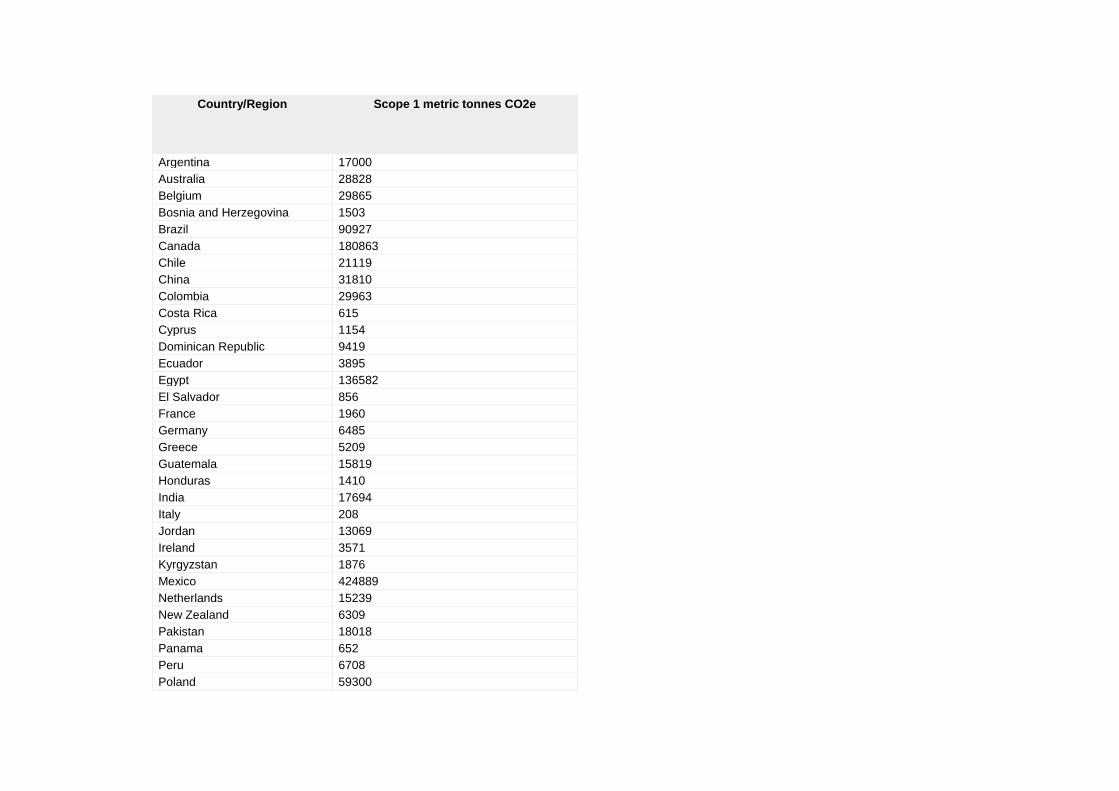
Country/Region
Scope 1 metric tonnes CO2e
Argentina 17000
Australia 28828
Belgium 29865
Bosnia and Herzegovina 1503
Brazil 90927
Canada 180863
Chile 21119
China 31810
Colombia 29963
Costa Rica 615
Cyprus 1154
Dominican Republic 9419
Ecuador 3895
Egypt 136582
El Salvador 856
France 1960
Germany 6485
Greece 5209
Guatemala 15819
Honduras 1410
India 17694
Italy 208
Jordan 13069
Ireland 3571
Kyrgyzstan 1876
Mexico 424889
Netherlands 15239
New Zealand 6309
Pakistan 18018
Panama 652
Peru 6708
Poland 59300
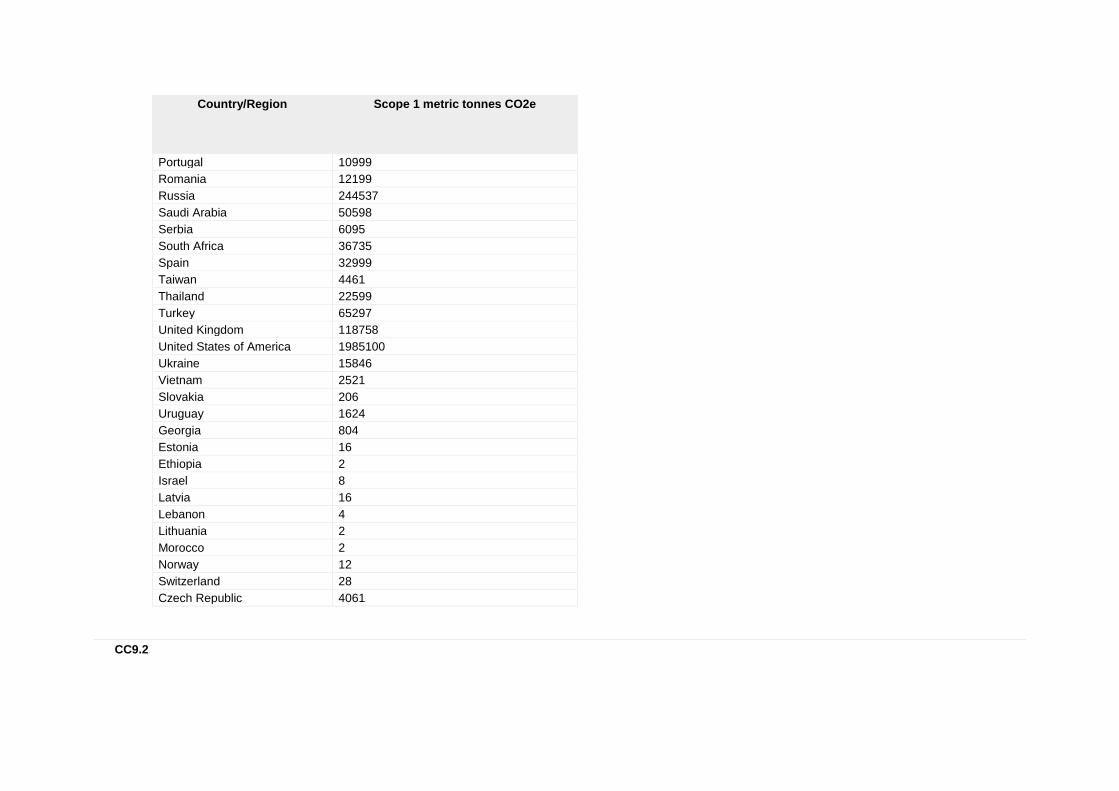
Country/Region
Scope 1 metric tonnes CO2e
Portugal 10999
Romania 12199
Russia 244537
Saudi Arabia 50598
Serbia 6095
South Africa 36735
Spain 32999
Taiwan 4461
Thailand 22599
Turkey 65297
United Kingdom 118758
United States of America 1985100
Ukraine 15846
Vietnam 2521
Slovakia 206
Uruguay 1624
Georgia 804
Estonia 16
Ethiopia 2
Israel 8
Latvia 16
Lebanon 4
Lithuania 2
Morocco 2
Norway 12
Switzerland 28
Czech Republic 4061
CC9.2
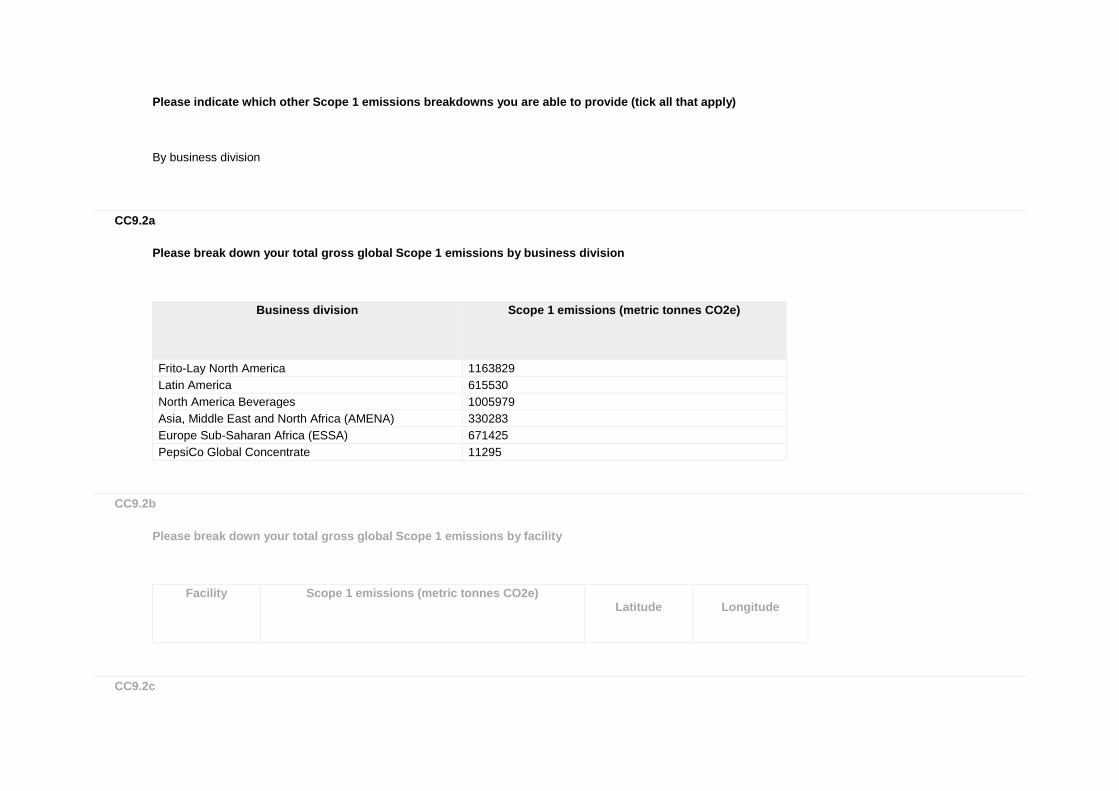
Please indicate which other Scope 1 emissions breakdowns you are able to provide (tick all that apply)
By business division
CC9.2a
Please break down your total gross global Scope 1 emissions by business division
Business division
Scope 1 emissions (metric tonnes CO2e)
Frito-Lay North America 1163829
Latin America 615530
North America Beverages 1005979
Asia, Middle East and North Africa (AMENA) 330283
Europe Sub-Saharan Africa (ESSA) 671425
PepsiCo Global Concentrate 11295
CC9.2b
Please break down your total gross global Scope 1 emissions by facility
Facility
Scope 1 emissions (metric tonnes CO2e)
Latitude
Longitude
CC9.2c
Please break down your total gross global Scope 1 emissions by GHG type
GHG type
Scope 1 emissions (metric tonnes CO2e)
CC9.2d
Please break down your total gross global Scope 1 emissions by activity
Activity
Scope 1 emissions (metric tonnes CO2e)
Further Information
Page: CC10. Scope 2 Emissions Breakdown - (1 Jan 2016 - 31 Dec 2016)
CC10.1
Do you have Scope 2 emissions sources in more than one country?
Yes
CC10.1a
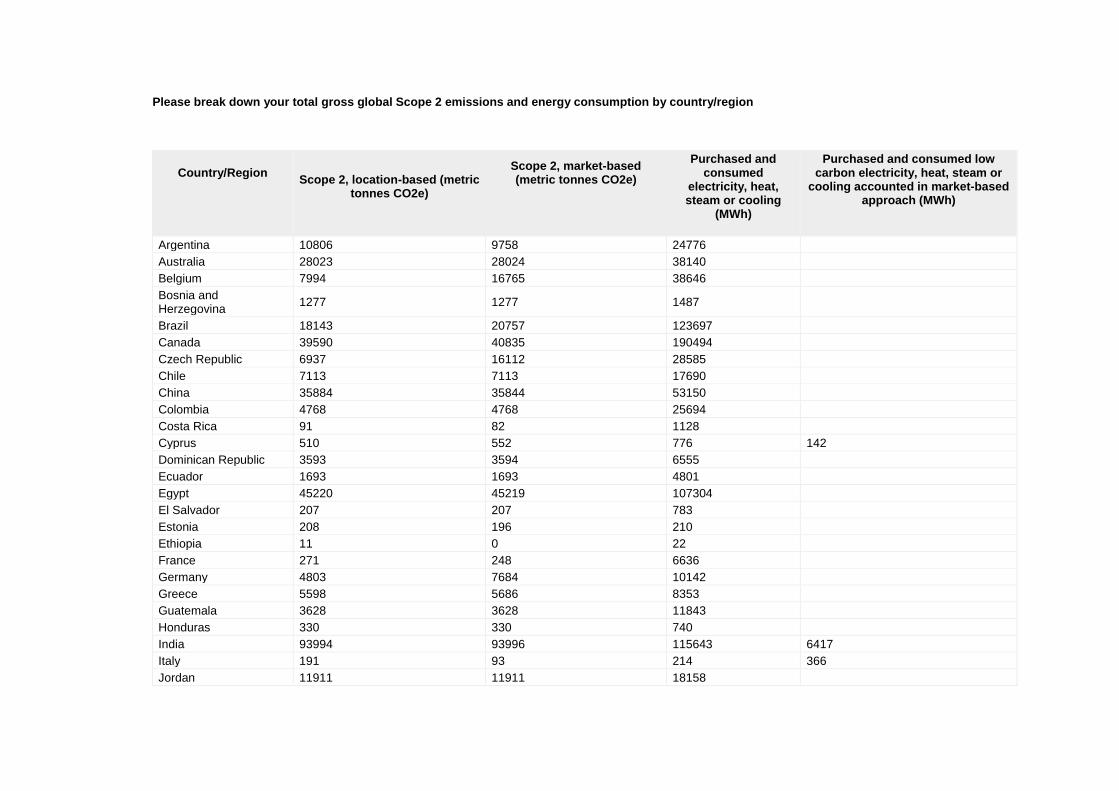
Please break down your total gross global Scope 2 emissions and energy consumption by country/region
Country/Region
Scope 2, location-based (metric
tonnes CO2e)
Scope 2, market-based (metric tonnes CO2e)
Purchased and consumed
electricity, heat, steam or cooling
(MWh)
Purchased and consumed low carbon electricity, heat, steam or
cooling accounted in market-based approach (MWh)
Argentina 10806 9758 24776
Australia 28023 28024 38140
Belgium 7994 16765 38646
Bosnia and Herzegovina
1277 1277 1487
Brazil 18143 20757 123697
Canada 39590 40835 190494
Czech Republic 6937 16112 28585
Chile 7113 7113 17690
China 35884 35844 53150
Colombia 4768 4768 25694
Costa Rica 91 82 1128
Cyprus 510 552 776 142
Dominican Republic 3593 3594 6555
Ecuador 1693 1693 4801
Egypt 45220 45219 107304
El Salvador 207 207 783
Estonia 208 196 210
Ethiopia 11 0 22
France 271 248 6636
Germany 4803 7684 10142
Greece 5598 5686 8353
Guatemala 3628 3628 11843
Honduras 330 330 740
India 93994 93996 115643 6417
Italy 191 93 214 366
Jordan 11911 11911 18158
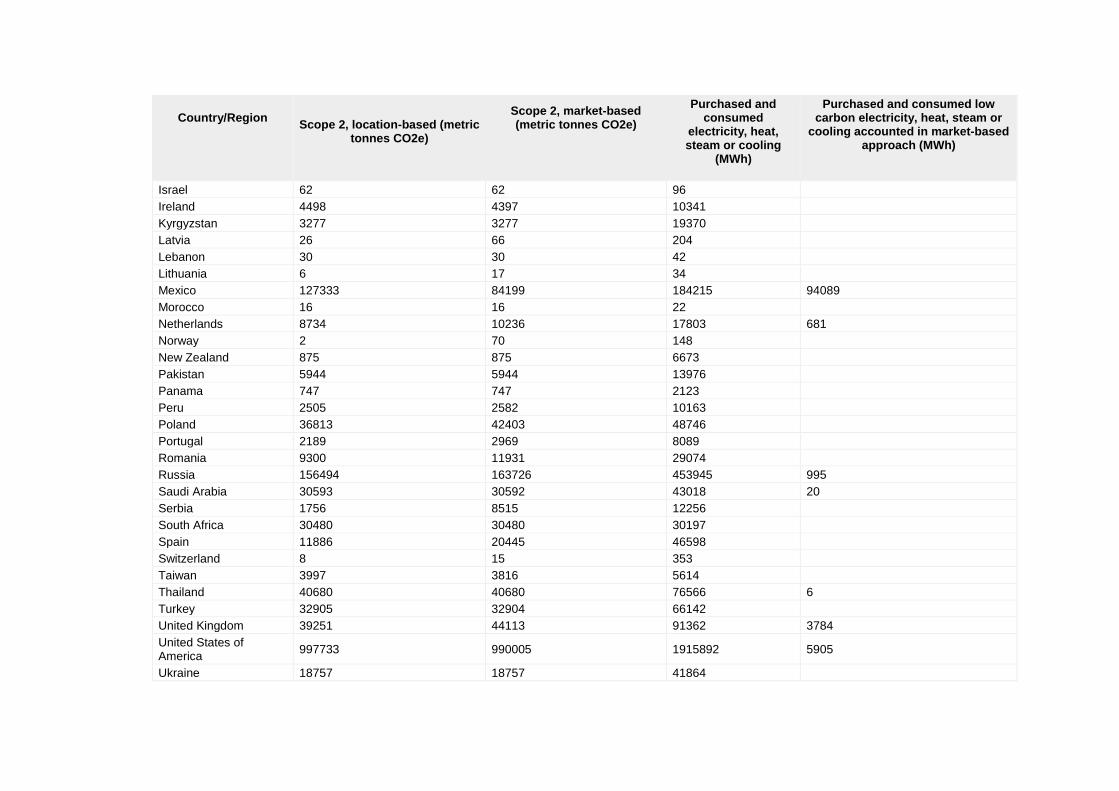
Country/Region
Scope 2, location-based (metric
tonnes CO2e)
Scope 2, market-based (metric tonnes CO2e)
Purchased and consumed
electricity, heat, steam or cooling
(MWh)
Purchased and consumed low carbon electricity, heat, steam or
cooling accounted in market-based approach (MWh)
Israel 62 62 96
Ireland 4498 4397 10341
Kyrgyzstan 3277 3277 19370
Latvia 26 66 204
Lebanon 30 30 42
Lithuania 6 17 34
Mexico 127333 84199 184215 94089
Morocco 16 16 22
Netherlands 8734 10236 17803 681
Norway 2 70 148
New Zealand 875 875 6673
Pakistan 5944 5944 13976
Panama 747 747 2123
Peru 2505 2582 10163
Poland 36813 42403 48746
Portugal 2189 2969 8089
Romania 9300 11931 29074
Russia 156494 163726 453945 995
Saudi Arabia 30593 30592 43018 20
Serbia 1756 8515 12256
South Africa 30480 30480 30197
Spain 11886 20445 46598
Switzerland 8 15 353
Taiwan 3997 3816 5614
Thailand 40680 40680 76566 6
Turkey 32905 32904 66142
United Kingdom 39251 44113 91362 3784
United States of America
997733 990005 1915892 5905
Ukraine 18757 18757 41864
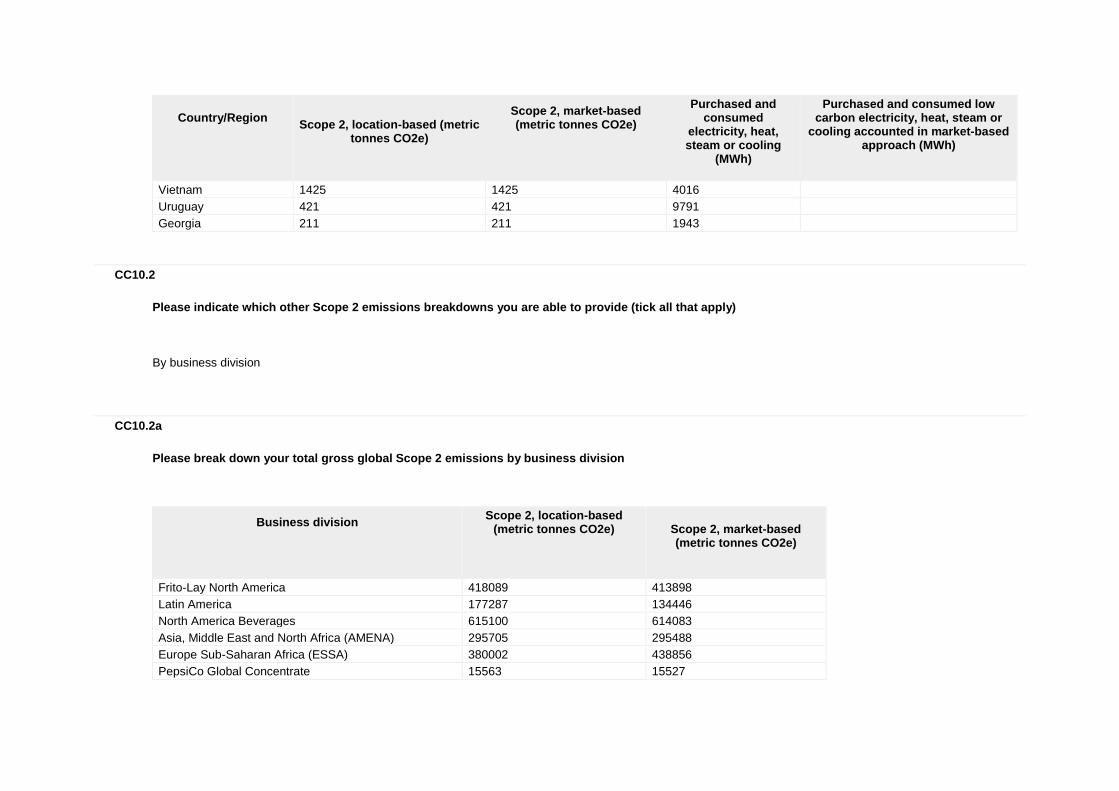
Country/Region
Scope 2, location-based (metric
tonnes CO2e)
Scope 2, market-based (metric tonnes CO2e)
Purchased and consumed
electricity, heat, steam or cooling
(MWh)
Purchased and consumed low carbon electricity, heat, steam or
cooling accounted in market-based approach (MWh)
Vietnam 1425 1425 4016
Uruguay 421 421 9791
Georgia 211 211 1943
CC10.2
Please indicate which other Scope 2 emissions breakdowns you are able to provide (tick all that apply)
By business division
CC10.2a
Please break down your total gross global Scope 2 emissions by business division
Business division
Scope 2, location-based (metric tonnes CO2e)
Scope 2, market-based (metric tonnes CO2e)
Frito-Lay North America 418089 413898
Latin America 177287 134446
North America Beverages 615100 614083
Asia, Middle East and North Africa (AMENA) 295705 295488
Europe Sub-Saharan Africa (ESSA) 380002 438856
PepsiCo Global Concentrate 15563 15527
CC10.2b
Please break down your total gross global Scope 2 emissions by facility
Facility
Scope 2, location-based (metric tonnes CO2e)
Scope 2, market-based (metric tonnes CO2e)
CC10.2c
Please break down your total gross global Scope 2 emissions by activity
Activity
Scope 2, location-based (metric tonnes CO2e)
Scope 2, market-based (metric tonnes CO2e)
Further Information
Page: CC11. Energy
CC11.1
What percentage of your total operational spend in the reporting year was on energy?
More than 0% but less than or equal to 5%
CC11.2
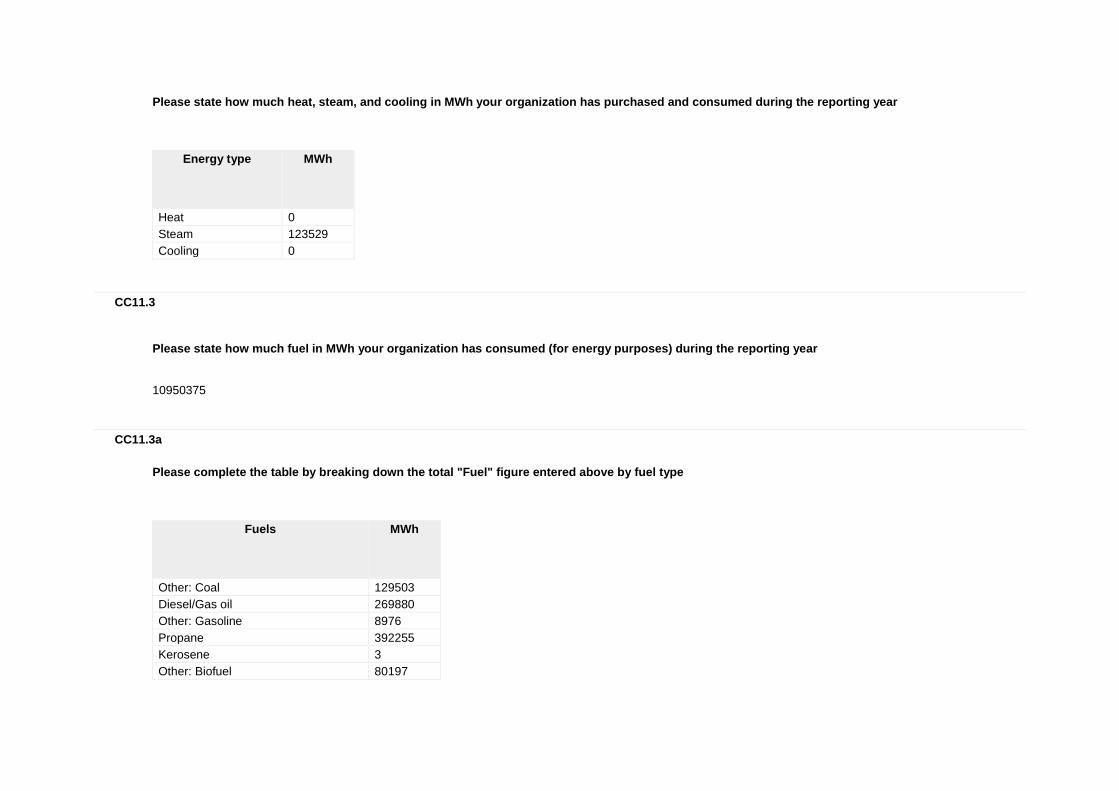
Please state how much heat, steam, and cooling in MWh your organization has purchased and consumed during the reporting year
Energy type
MWh
Heat 0
Steam 123529
Cooling 0
CC11.3
Please state how much fuel in MWh your organization has consumed (for energy purposes) during the reporting year
10950375
CC11.3a
Please complete the table by breaking down the total "Fuel" figure entered above by fuel type
Fuels
MWh
Other: Coal 129503
Diesel/Gas oil 269880
Other: Gasoline 8976
Propane 392255
Kerosene 3
Other: Biofuel 80197
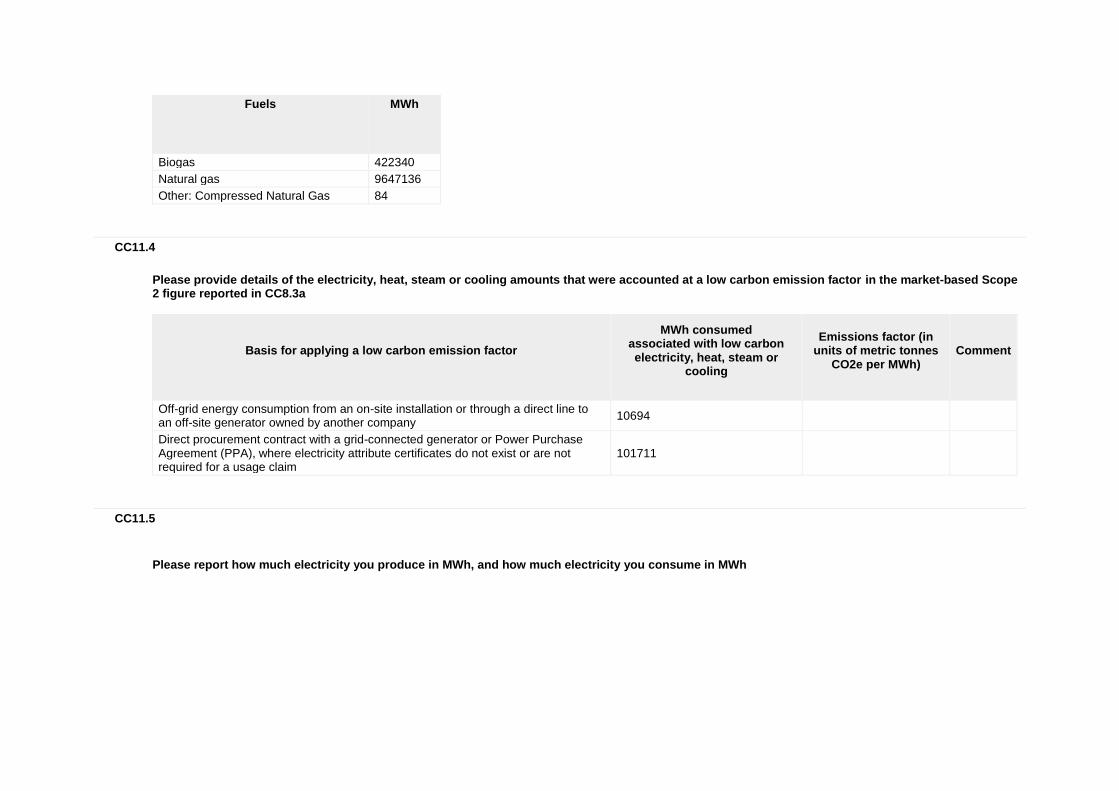
Fuels
MWh
Biogas 422340
Natural gas 9647136
Other: Compressed Natural Gas 84
CC11.4
Please provide details of the electricity, heat, steam or cooling amounts that were accounted at a low carbon emission factor in the market-based Scope 2 figure reported in CC8.3a
Basis for applying a low carbon emission factor
MWh consumed associated with low carbon electricity, heat, steam or
cooling
Emissions factor (in
units of metric tonnes CO2e per MWh)
Comment
Off-grid energy consumption from an on-site installation or through a direct line to an off-site generator owned by another company
10694
Direct procurement contract with a grid-connected generator or Power Purchase Agreement (PPA), where electricity attribute certificates do not exist or are not required for a usage claim
101711
CC11.5
Please report how much electricity you produce in MWh, and how much electricity you consume in MWh
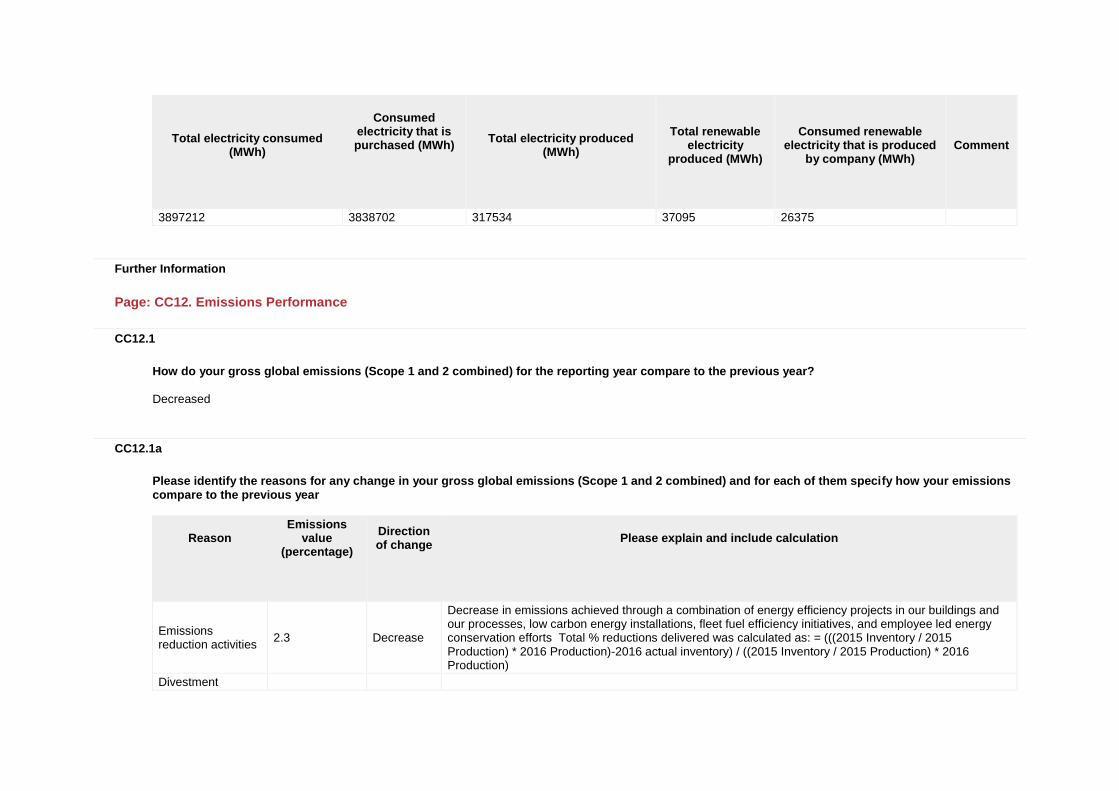
Total electricity consumed
(MWh)
Consumed
electricity that is purchased (MWh)
Total electricity produced
(MWh)
Total renewable
electricity produced (MWh)
Consumed renewable
electricity that is produced by company (MWh)
Comment
3897212 3838702 317534 37095 26375
Further Information
Page: CC12. Emissions Performance
CC12.1
How do your gross global emissions (Scope 1 and 2 combined) for the reporting year compare to the previous year?
Decreased
CC12.1a
Please identify the reasons for any change in your gross global emissions (Scope 1 and 2 combined) and for each of them specify how your emissions compare to the previous year
Reason
Emissions value
(percentage)
Direction of change
Please explain and include calculation
Emissions reduction activities
2.3 Decrease
Decrease in emissions achieved through a combination of energy efficiency projects in our buildings and our processes, low carbon energy installations, fleet fuel efficiency initiatives, and employee led energy conservation efforts Total % reductions delivered was calculated as: = (((2015 Inventory / 2015 Production) * 2016 Production)-2016 actual inventory) / ((2015 Inventory / 2015 Production) * 2016 Production)
Divestment
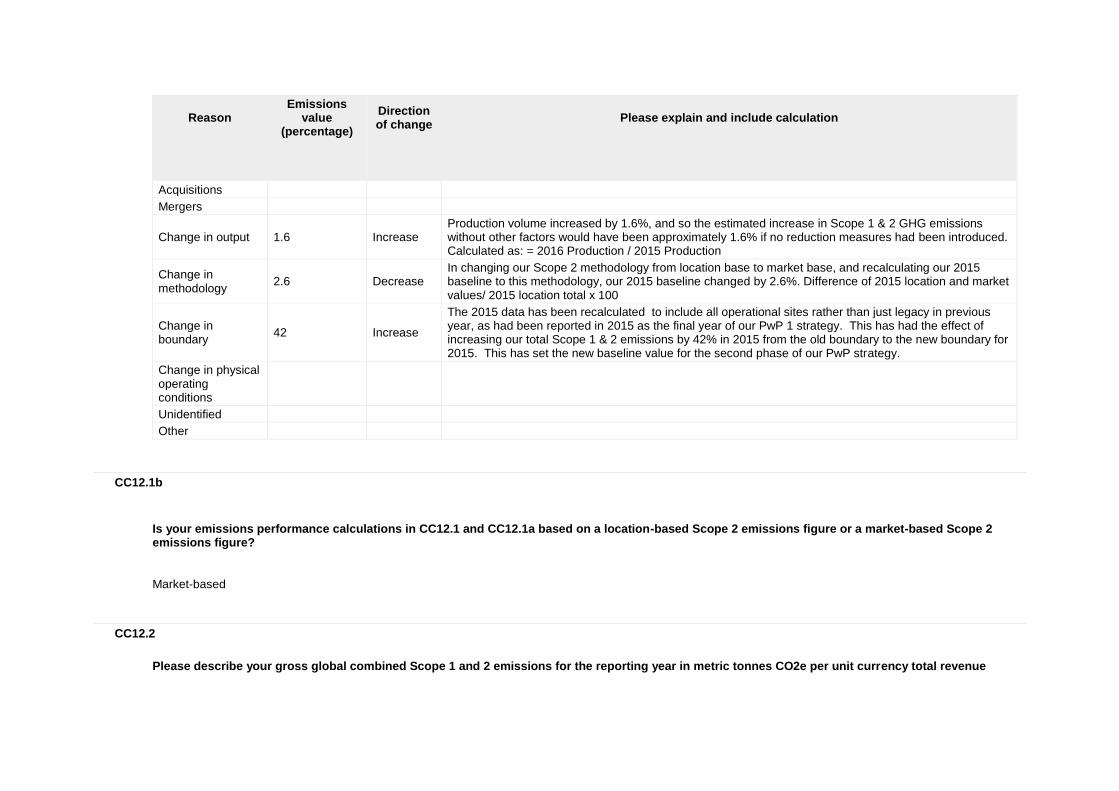
Reason
Emissions value
(percentage)
Direction of change
Please explain and include calculation
Acquisitions
Mergers
Change in output 1.6 Increase Production volume increased by 1.6%, and so the estimated increase in Scope 1 & 2 GHG emissions without other factors would have been approximately 1.6% if no reduction measures had been introduced. Calculated as: = 2016 Production / 2015 Production
Change in methodology
2.6 Decrease In changing our Scope 2 methodology from location base to market base, and recalculating our 2015 baseline to this methodology, our 2015 baseline changed by 2.6%. Difference of 2015 location and market values/ 2015 location total x 100
Change in boundary
42 Increase
The 2015 data has been recalculated to include all operational sites rather than just legacy in previous year, as had been reported in 2015 as the final year of our PwP 1 strategy. This has had the effect of increasing our total Scope 1 & 2 emissions by 42% in 2015 from the old boundary to the new boundary for 2015. This has set the new baseline value for the second phase of our PwP strategy.
Change in physical operating conditions
Unidentified
Other
CC12.1b
Is your emissions performance calculations in CC12.1 and CC12.1a based on a location-based Scope 2 emissions figure or a market-based Scope 2 emissions figure?
Market-based
CC12.2
Please describe your gross global combined Scope 1 and 2 emissions for the reporting year in metric tonnes CO2e per unit currency total revenue
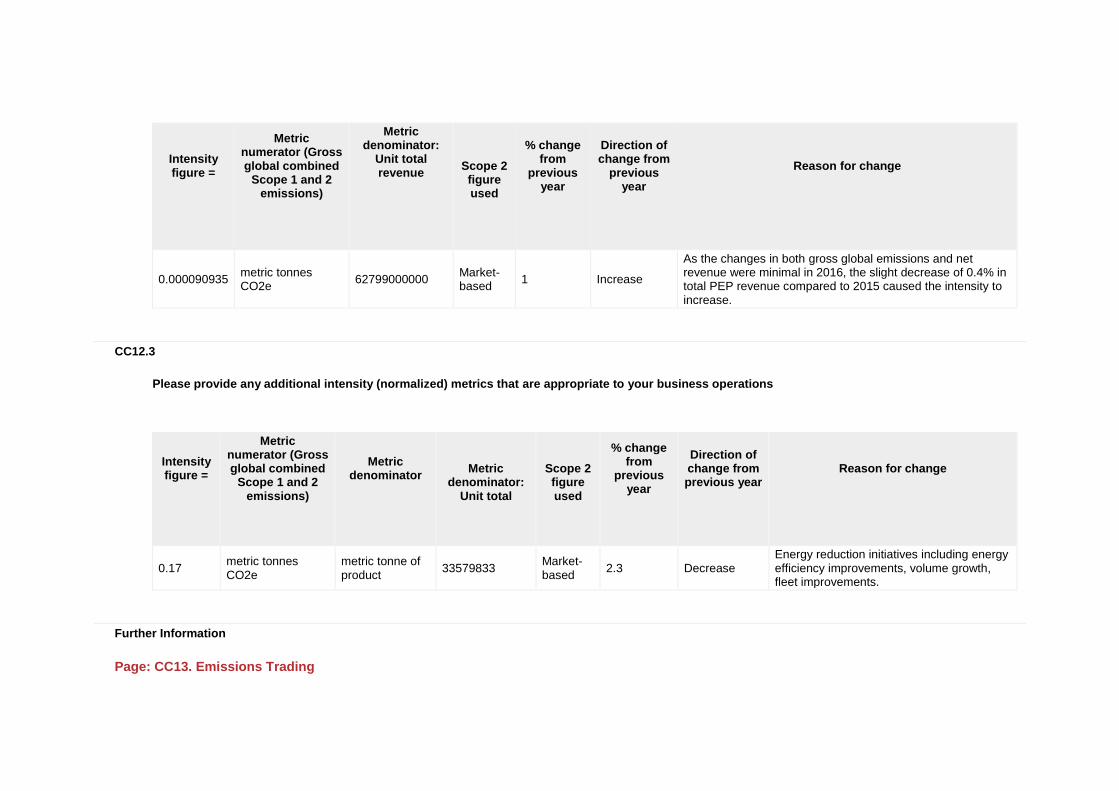
Intensity figure =
Metric numerator (Gross global combined
Scope 1 and 2 emissions)
Metric denominator:
Unit total revenue
Scope 2 figure used
% change from
previous year
Direction of change from
previous year
Reason for change
0.000090935 metric tonnes CO2e
62799000000 Market-based
1 Increase
As the changes in both gross global emissions and net revenue were minimal in 2016, the slight decrease of 0.4% in total PEP revenue compared to 2015 caused the intensity to increase.
CC12.3
Please provide any additional intensity (normalized) metrics that are appropriate to your business operations
Intensity figure =
Metric numerator (Gross global combined
Scope 1 and 2 emissions)
Metric denominator
Metric
denominator: Unit total
Scope 2 figure used
% change from
previous year
Direction of change from previous year
Reason for change
0.17 metric tonnes CO2e
metric tonne of product
33579833 Market-based
2.3 Decrease Energy reduction initiatives including energy efficiency improvements, volume growth, fleet improvements.
Further Information
Page: CC13. Emissions Trading
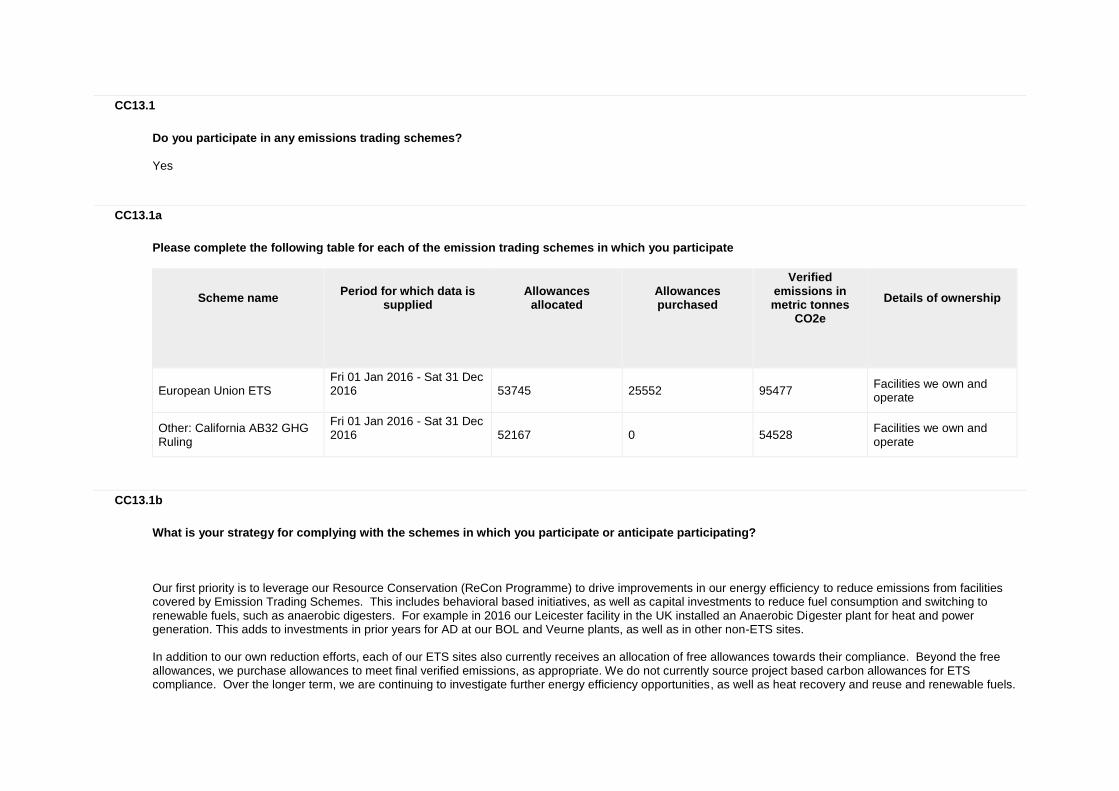
CC13.1
Do you participate in any emissions trading schemes?
Yes
CC13.1a
Please complete the following table for each of the emission trading schemes in which you participate
Scheme name
Period for which data is supplied
Allowances allocated
Allowances purchased
Verified emissions in metric tonnes
CO2e
Details of ownership
European Union ETS Fri 01 Jan 2016 - Sat 31 Dec 2016
53745 25552 95477 Facilities we own and operate
Other: California AB32 GHG Ruling
Fri 01 Jan 2016 - Sat 31 Dec 2016
52167 0 54528 Facilities we own and operate
CC13.1b
What is your strategy for complying with the schemes in which you participate or anticipate participating?
Our first priority is to leverage our Resource Conservation (ReCon Programme) to drive improvements in our energy efficiency to reduce emissions from facilities covered by Emission Trading Schemes. This includes behavioral based initiatives, as well as capital investments to reduce fuel consumption and switching to renewable fuels, such as anaerobic digesters. For example in 2016 our Leicester facility in the UK installed an Anaerobic Digester plant for heat and power generation. This adds to investments in prior years for AD at our BOL and Veurne plants, as well as in other non-ETS sites. In addition to our own reduction efforts, each of our ETS sites also currently receives an allocation of free allowances towards their compliance. Beyond the free allowances, we purchase allowances to meet final verified emissions, as appropriate. We do not currently source project based carbon allowances for ETS compliance. Over the longer term, we are continuing to investigate further energy efficiency opportunities, as well as heat recovery and reuse and renewable fuels.
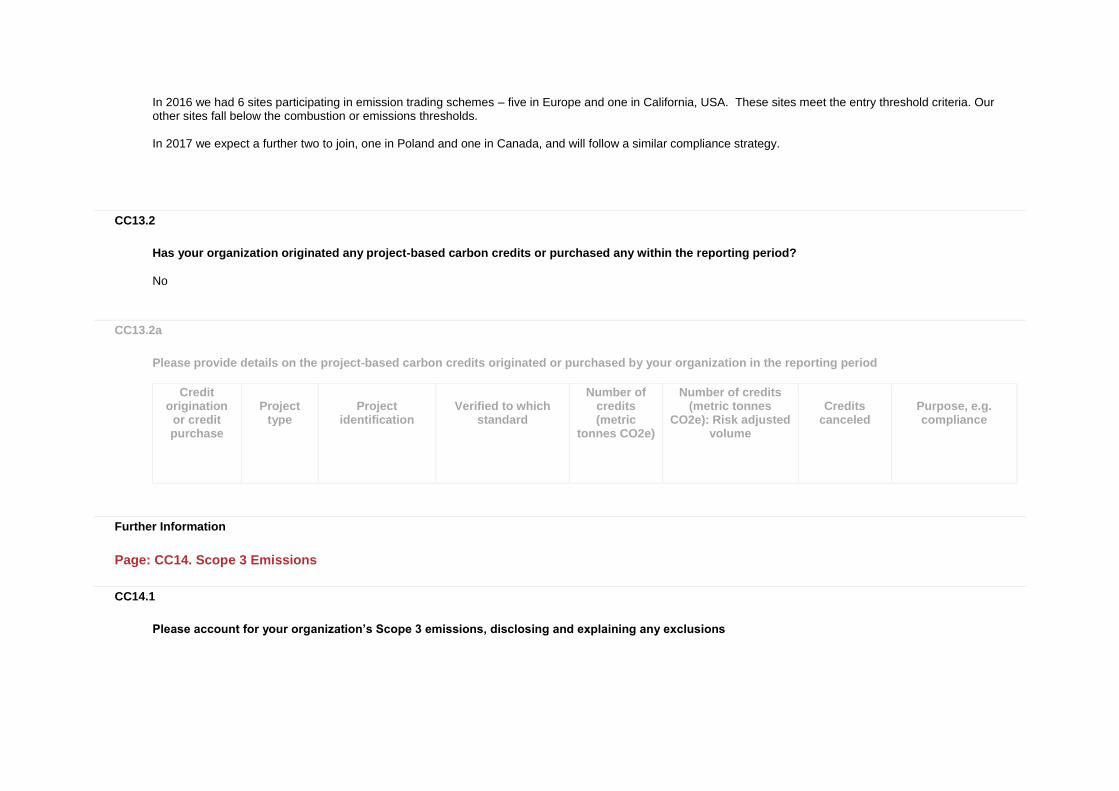
In 2016 we had 6 sites participating in emission trading schemes – five in Europe and one in California, USA. These sites meet the entry threshold criteria. Our other sites fall below the combustion or emissions thresholds. In 2017 we expect a further two to join, one in Poland and one in Canada, and will follow a similar compliance strategy.
CC13.2
Has your organization originated any project-based carbon credits or purchased any within the reporting period?
No
CC13.2a
Please provide details on the project-based carbon credits originated or purchased by your organization in the reporting period
Credit origination
or credit purchase
Project type
Project identification
Verified to which standard
Number of credits (metric
tonnes CO2e)
Number of credits (metric tonnes
CO2e): Risk adjusted volume
Credits canceled
Purpose, e.g. compliance
Further Information
Page: CC14. Scope 3 Emissions
CC14.1
Please account for your organization’s Scope 3 emissions, disclosing and explaining any exclusions
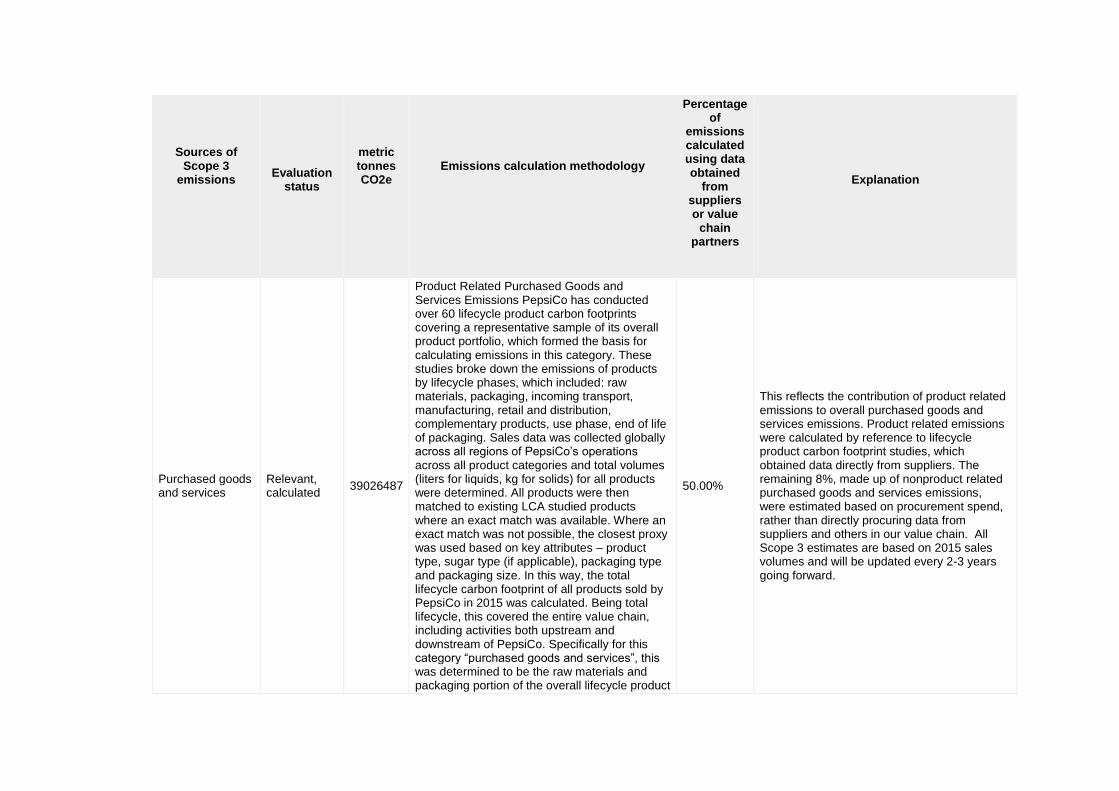
Sources of Scope 3
emissions
Evaluation status
metric tonnes CO2e
Emissions calculation methodology
Percentage of
emissions calculated using data obtained
from suppliers or value
chain partners
Explanation
Purchased goods and services
Relevant, calculated
39026487
Product Related Purchased Goods and Services Emissions PepsiCo has conducted over 60 lifecycle product carbon footprints covering a representative sample of its overall product portfolio, which formed the basis for calculating emissions in this category. These studies broke down the emissions of products by lifecycle phases, which included: raw materials, packaging, incoming transport, manufacturing, retail and distribution, complementary products, use phase, end of life of packaging. Sales data was collected globally across all regions of PepsiCo’s operations across all product categories and total volumes (liters for liquids, kg for solids) for all products were determined. All products were then matched to existing LCA studied products where an exact match was available. Where an exact match was not possible, the closest proxy was used based on key attributes – product type, sugar type (if applicable), packaging type and packaging size. In this way, the total lifecycle carbon footprint of all products sold by PepsiCo in 2015 was calculated. Being total lifecycle, this covered the entire value chain, including activities both upstream and downstream of PepsiCo. Specifically for this category “purchased goods and services”, this was determined to be the raw materials and packaging portion of the overall lifecycle product
50.00%
This reflects the contribution of product related emissions to overall purchased goods and services emissions. Product related emissions were calculated by reference to lifecycle product carbon footprint studies, which obtained data directly from suppliers. The remaining 8%, made up of nonproduct related purchased goods and services emissions, were estimated based on procurement spend, rather than directly procuring data from suppliers and others in our value chain. All Scope 3 estimates are based on 2015 sales volumes and will be updated every 2-3 years going forward.
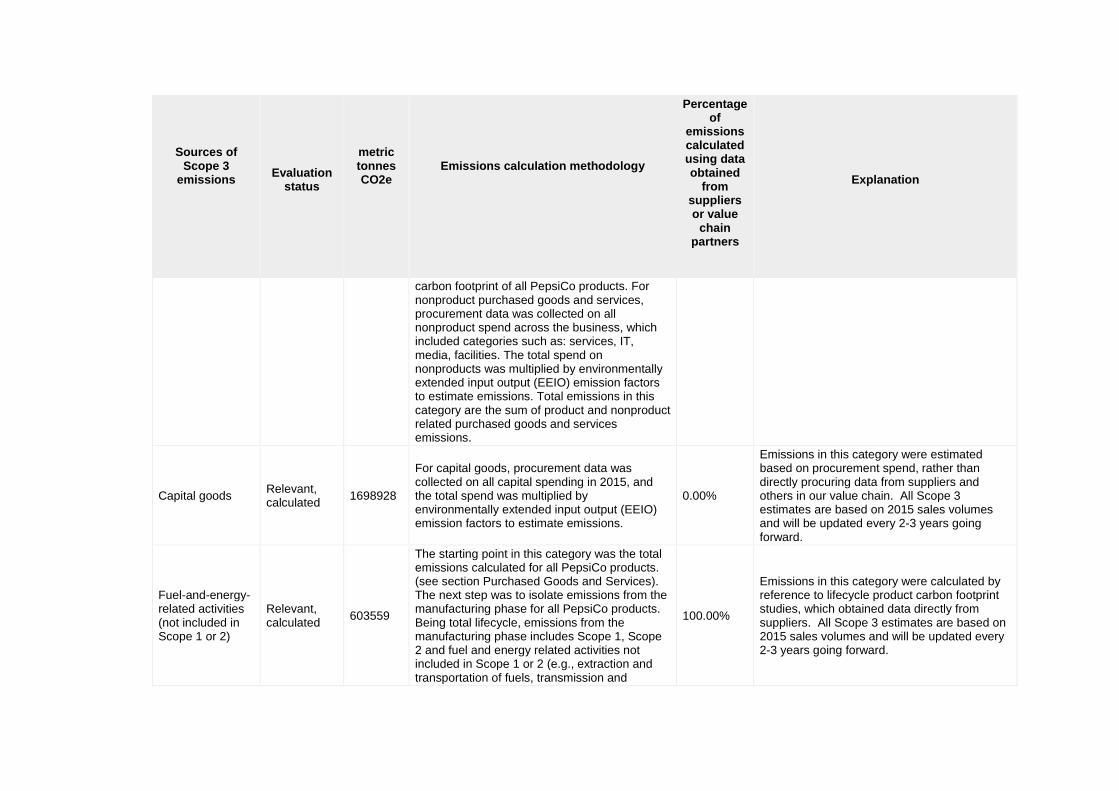
Sources of Scope 3
emissions
Evaluation status
metric tonnes CO2e
Emissions calculation methodology
Percentage of
emissions calculated using data obtained
from suppliers or value
chain partners
Explanation
carbon footprint of all PepsiCo products. For nonproduct purchased goods and services, procurement data was collected on all nonproduct spend across the business, which included categories such as: services, IT, media, facilities. The total spend on nonproducts was multiplied by environmentally extended input output (EEIO) emission factors to estimate emissions. Total emissions in this category are the sum of product and nonproduct related purchased goods and services emissions.
Capital goods Relevant, calculated
1698928
For capital goods, procurement data was collected on all capital spending in 2015, and the total spend was multiplied by environmentally extended input output (EEIO) emission factors to estimate emissions.
0.00%
Emissions in this category were estimated based on procurement spend, rather than directly procuring data from suppliers and others in our value chain. All Scope 3 estimates are based on 2015 sales volumes and will be updated every 2-3 years going forward.
Fuel-and-energy-related activities (not included in Scope 1 or 2)
Relevant, calculated
603559
The starting point in this category was the total emissions calculated for all PepsiCo products. (see section Purchased Goods and Services). The next step was to isolate emissions from the manufacturing phase for all PepsiCo products. Being total lifecycle, emissions from the manufacturing phase includes Scope 1, Scope 2 and fuel and energy related activities not included in Scope 1 or 2 (e.g., extraction and transportation of fuels, transmission and
100.00%
Emissions in this category were calculated by reference to lifecycle product carbon footprint studies, which obtained data directly from suppliers. All Scope 3 estimates are based on 2015 sales volumes and will be updated every 2-3 years going forward.
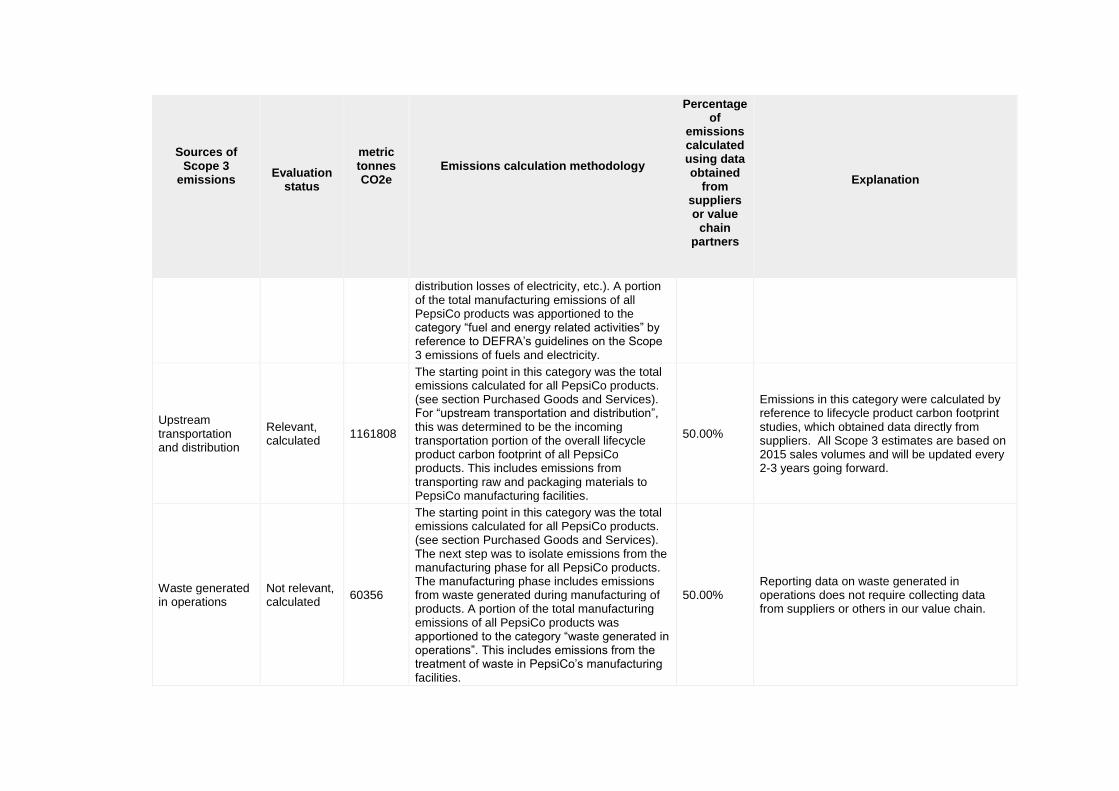
Sources of Scope 3
emissions
Evaluation status
metric tonnes CO2e
Emissions calculation methodology
Percentage of
emissions calculated using data obtained
from suppliers or value
chain partners
Explanation
distribution losses of electricity, etc.). A portion of the total manufacturing emissions of all PepsiCo products was apportioned to the category “fuel and energy related activities” by reference to DEFRA’s guidelines on the Scope 3 emissions of fuels and electricity.
Upstream transportation and distribution
Relevant, calculated
1161808
The starting point in this category was the total emissions calculated for all PepsiCo products. (see section Purchased Goods and Services). For “upstream transportation and distribution”, this was determined to be the incoming transportation portion of the overall lifecycle product carbon footprint of all PepsiCo products. This includes emissions from transporting raw and packaging materials to PepsiCo manufacturing facilities.
50.00%
Emissions in this category were calculated by reference to lifecycle product carbon footprint studies, which obtained data directly from suppliers. All Scope 3 estimates are based on 2015 sales volumes and will be updated every 2-3 years going forward.
Waste generated in operations
Not relevant, calculated
60356
The starting point in this category was the total emissions calculated for all PepsiCo products. (see section Purchased Goods and Services). The next step was to isolate emissions from the manufacturing phase for all PepsiCo products. The manufacturing phase includes emissions from waste generated during manufacturing of products. A portion of the total manufacturing emissions of all PepsiCo products was apportioned to the category “waste generated in operations”. This includes emissions from the treatment of waste in PepsiCo’s manufacturing facilities.
50.00% Reporting data on waste generated in operations does not require collecting data from suppliers or others in our value chain.
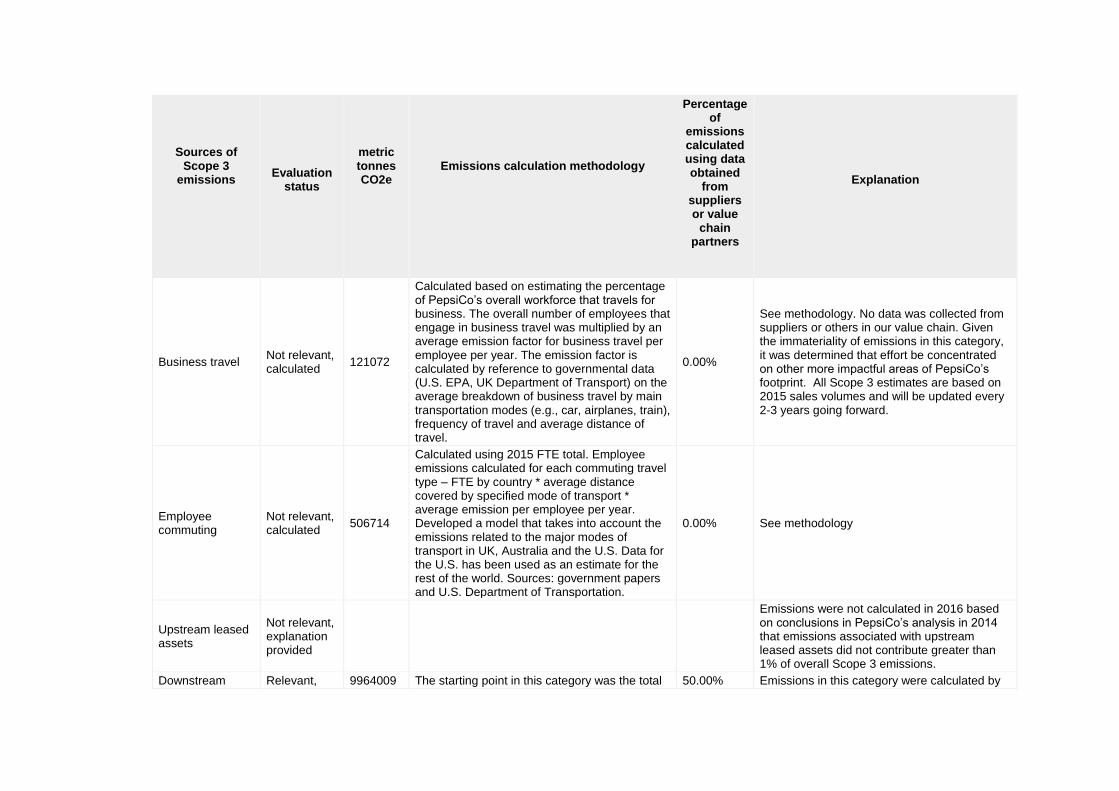
Sources of Scope 3
emissions
Evaluation status
metric tonnes CO2e
Emissions calculation methodology
Percentage of
emissions calculated using data obtained
from suppliers or value
chain partners
Explanation
Business travel Not relevant, calculated
121072
Calculated based on estimating the percentage of PepsiCo’s overall workforce that travels for business. The overall number of employees that engage in business travel was multiplied by an average emission factor for business travel per employee per year. The emission factor is calculated by reference to governmental data (U.S. EPA, UK Department of Transport) on the average breakdown of business travel by main transportation modes (e.g., car, airplanes, train), frequency of travel and average distance of travel.
0.00%
See methodology. No data was collected from suppliers or others in our value chain. Given the immateriality of emissions in this category, it was determined that effort be concentrated on other more impactful areas of PepsiCo’s footprint. All Scope 3 estimates are based on 2015 sales volumes and will be updated every 2-3 years going forward.
Employee commuting
Not relevant, calculated
506714
Calculated using 2015 FTE total. Employee emissions calculated for each commuting travel type – FTE by country * average distance covered by specified mode of transport * average emission per employee per year. Developed a model that takes into account the emissions related to the major modes of transport in UK, Australia and the U.S. Data for the U.S. has been used as an estimate for the rest of the world. Sources: government papers and U.S. Department of Transportation.
0.00% See methodology
Upstream leased assets
Not relevant, explanation provided
Emissions were not calculated in 2016 based on conclusions in PepsiCo’s analysis in 2014 that emissions associated with upstream leased assets did not contribute greater than 1% of overall Scope 3 emissions.
Downstream Relevant, 9964009 The starting point in this category was the total 50.00% Emissions in this category were calculated by
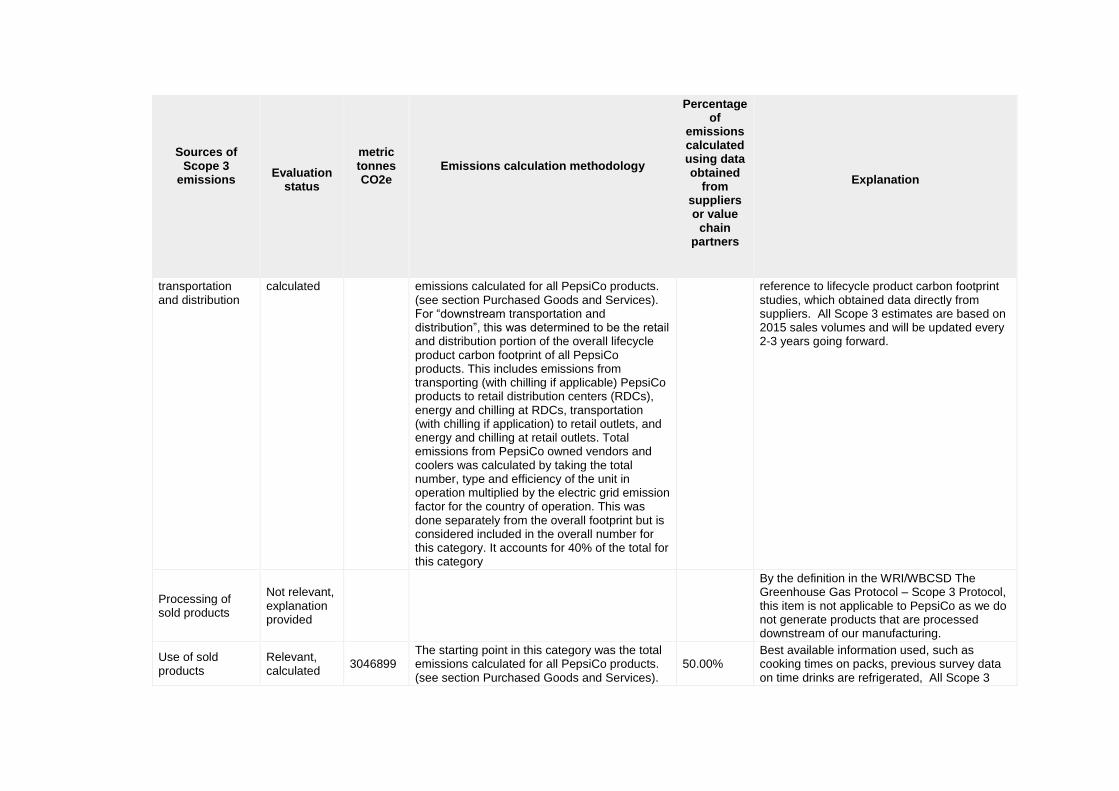
Sources of Scope 3
emissions
Evaluation status
metric tonnes CO2e
Emissions calculation methodology
Percentage of
emissions calculated using data obtained
from suppliers or value
chain partners
Explanation
transportation and distribution
calculated emissions calculated for all PepsiCo products. (see section Purchased Goods and Services). For “downstream transportation and distribution”, this was determined to be the retail and distribution portion of the overall lifecycle product carbon footprint of all PepsiCo products. This includes emissions from transporting (with chilling if applicable) PepsiCo products to retail distribution centers (RDCs), energy and chilling at RDCs, transportation (with chilling if application) to retail outlets, and energy and chilling at retail outlets. Total emissions from PepsiCo owned vendors and coolers was calculated by taking the total number, type and efficiency of the unit in operation multiplied by the electric grid emission factor for the country of operation. This was done separately from the overall footprint but is considered included in the overall number for this category. It accounts for 40% of the total for this category
reference to lifecycle product carbon footprint studies, which obtained data directly from suppliers. All Scope 3 estimates are based on 2015 sales volumes and will be updated every 2-3 years going forward.
Processing of sold products
Not relevant, explanation provided
By the definition in the WRI/WBCSD The Greenhouse Gas Protocol – Scope 3 Protocol, this item is not applicable to PepsiCo as we do not generate products that are processed downstream of our manufacturing.
Use of sold products
Relevant, calculated
3046899 The starting point in this category was the total emissions calculated for all PepsiCo products. (see section Purchased Goods and Services).
50.00% Best available information used, such as cooking times on packs, previous survey data on time drinks are refrigerated, All Scope 3
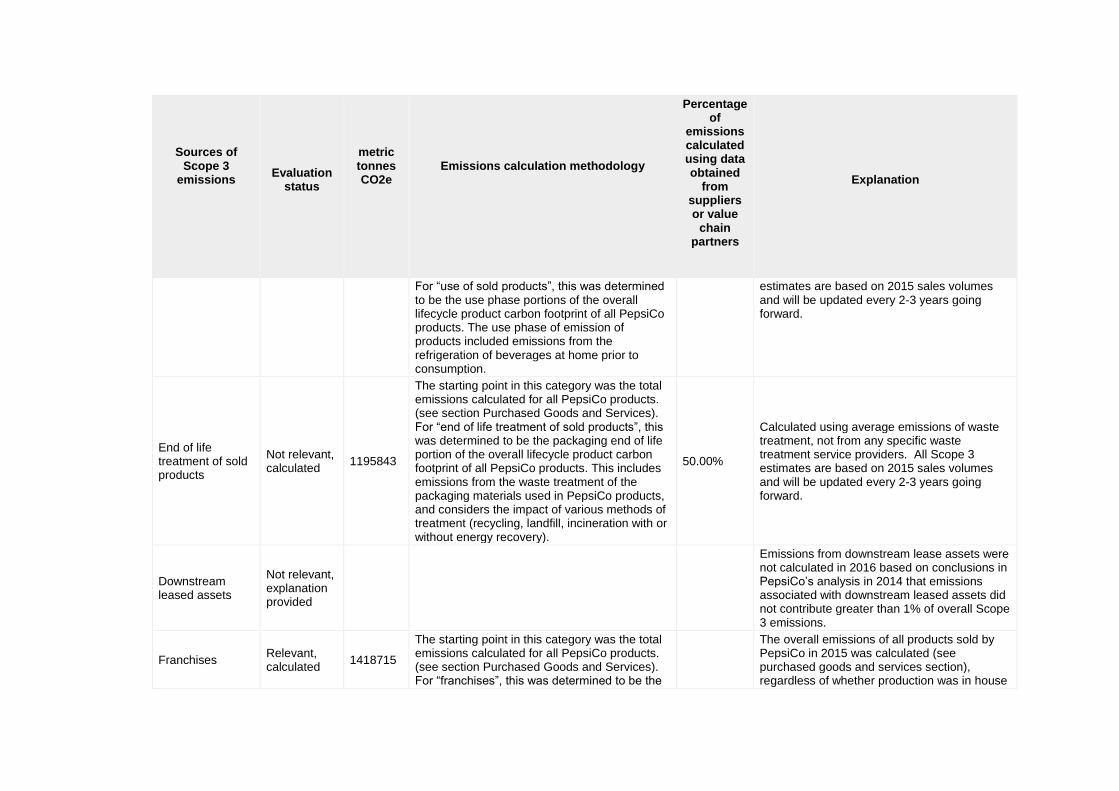
Sources of Scope 3
emissions
Evaluation status
metric tonnes CO2e
Emissions calculation methodology
Percentage of
emissions calculated using data obtained
from suppliers or value
chain partners
Explanation
For “use of sold products”, this was determined to be the use phase portions of the overall lifecycle product carbon footprint of all PepsiCo products. The use phase of emission of products included emissions from the refrigeration of beverages at home prior to consumption.
estimates are based on 2015 sales volumes and will be updated every 2-3 years going forward.
End of life treatment of sold products
Not relevant, calculated
1195843
The starting point in this category was the total emissions calculated for all PepsiCo products. (see section Purchased Goods and Services). For “end of life treatment of sold products”, this was determined to be the packaging end of life portion of the overall lifecycle product carbon footprint of all PepsiCo products. This includes emissions from the waste treatment of the packaging materials used in PepsiCo products, and considers the impact of various methods of treatment (recycling, landfill, incineration with or without energy recovery).
50.00%
Calculated using average emissions of waste treatment, not from any specific waste treatment service providers. All Scope 3 estimates are based on 2015 sales volumes and will be updated every 2-3 years going forward.
Downstream leased assets
Not relevant, explanation provided
Emissions from downstream lease assets were not calculated in 2016 based on conclusions in PepsiCo’s analysis in 2014 that emissions associated with downstream leased assets did not contribute greater than 1% of overall Scope 3 emissions.
Franchises Relevant, calculated
1418715
The starting point in this category was the total emissions calculated for all PepsiCo products. (see section Purchased Goods and Services). For “franchises”, this was determined to be the
The overall emissions of all products sold by PepsiCo in 2015 was calculated (see purchased goods and services section), regardless of whether production was in house
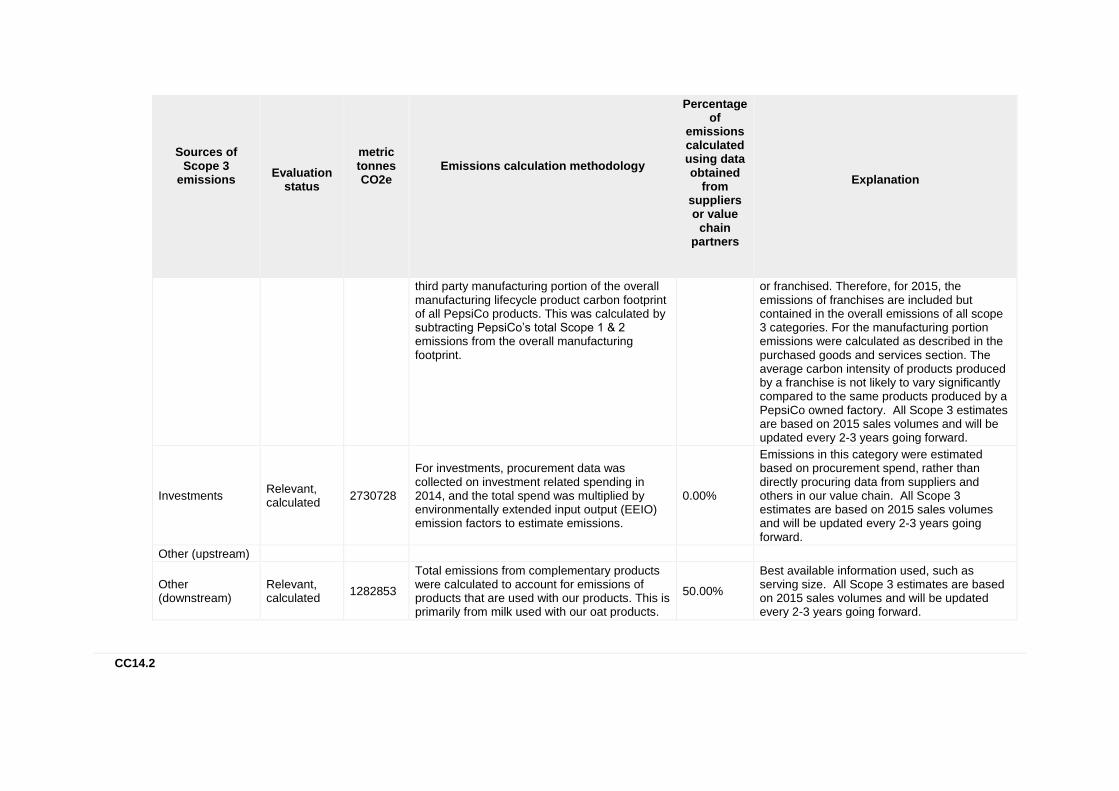
Sources of Scope 3
emissions
Evaluation status
metric tonnes CO2e
Emissions calculation methodology
Percentage of
emissions calculated using data obtained
from suppliers or value
chain partners
Explanation
third party manufacturing portion of the overall manufacturing lifecycle product carbon footprint of all PepsiCo products. This was calculated by subtracting PepsiCo’s total Scope 1 & 2 emissions from the overall manufacturing footprint.
or franchised. Therefore, for 2015, the emissions of franchises are included but contained in the overall emissions of all scope 3 categories. For the manufacturing portion emissions were calculated as described in the purchased goods and services section. The average carbon intensity of products produced by a franchise is not likely to vary significantly compared to the same products produced by a PepsiCo owned factory. All Scope 3 estimates are based on 2015 sales volumes and will be updated every 2-3 years going forward.
Investments Relevant, calculated
2730728
For investments, procurement data was collected on investment related spending in 2014, and the total spend was multiplied by environmentally extended input output (EEIO) emission factors to estimate emissions.
0.00%
Emissions in this category were estimated based on procurement spend, rather than directly procuring data from suppliers and others in our value chain. All Scope 3 estimates are based on 2015 sales volumes and will be updated every 2-3 years going forward.
Other (upstream)
Other (downstream)
Relevant, calculated
1282853
Total emissions from complementary products were calculated to account for emissions of products that are used with our products. This is primarily from milk used with our oat products.
50.00%
Best available information used, such as serving size. All Scope 3 estimates are based on 2015 sales volumes and will be updated every 2-3 years going forward.
CC14.2
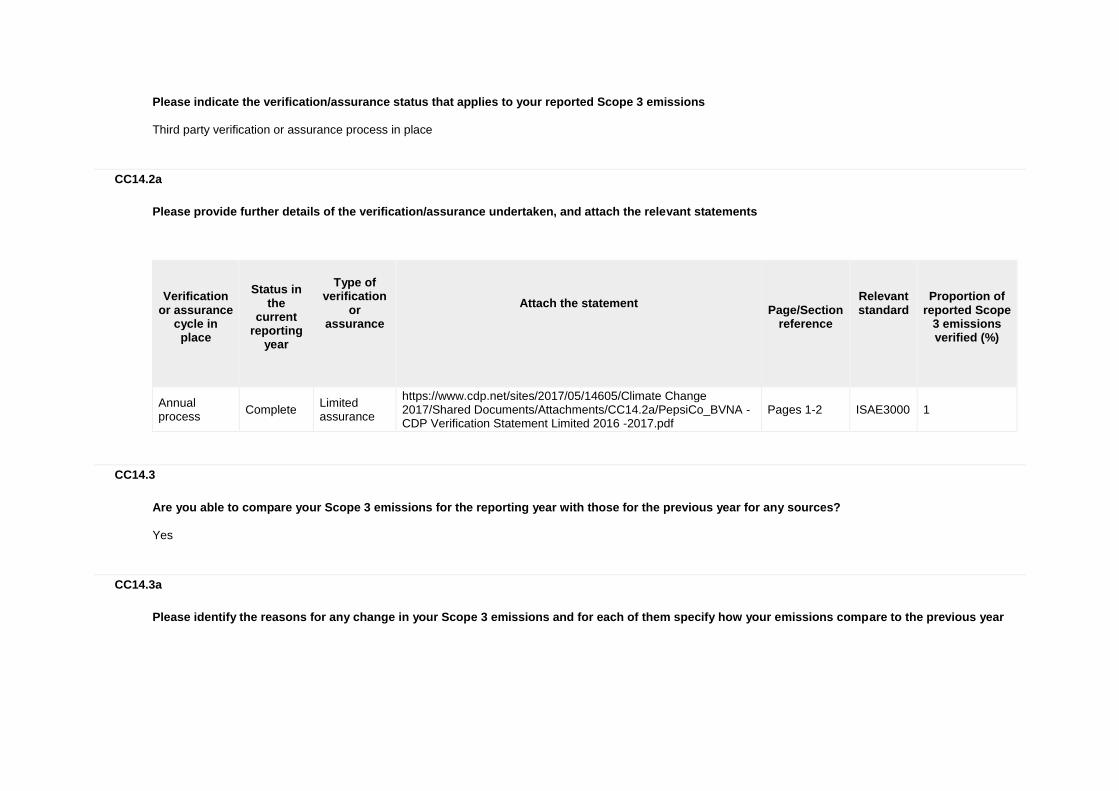
Please indicate the verification/assurance status that applies to your reported Scope 3 emissions
Third party verification or assurance process in place
CC14.2a
Please provide further details of the verification/assurance undertaken, and attach the relevant statements
Verification
or assurance cycle in
place
Status in
the current
reporting year
Type of
verification or
assurance
Attach the statement
Page/Section
reference
Relevant standard
Proportion of
reported Scope 3 emissions verified (%)
Annual process
Complete Limited assurance
https://www.cdp.net/sites/2017/05/14605/Climate Change 2017/Shared Documents/Attachments/CC14.2a/PepsiCo_BVNA - CDP Verification Statement Limited 2016 -2017.pdf
Pages 1-2 ISAE3000 1
CC14.3
Are you able to compare your Scope 3 emissions for the reporting year with those for the previous year for any sources?
Yes
CC14.3a
Please identify the reasons for any change in your Scope 3 emissions and for each of them specify how your emissions compare to the previous year
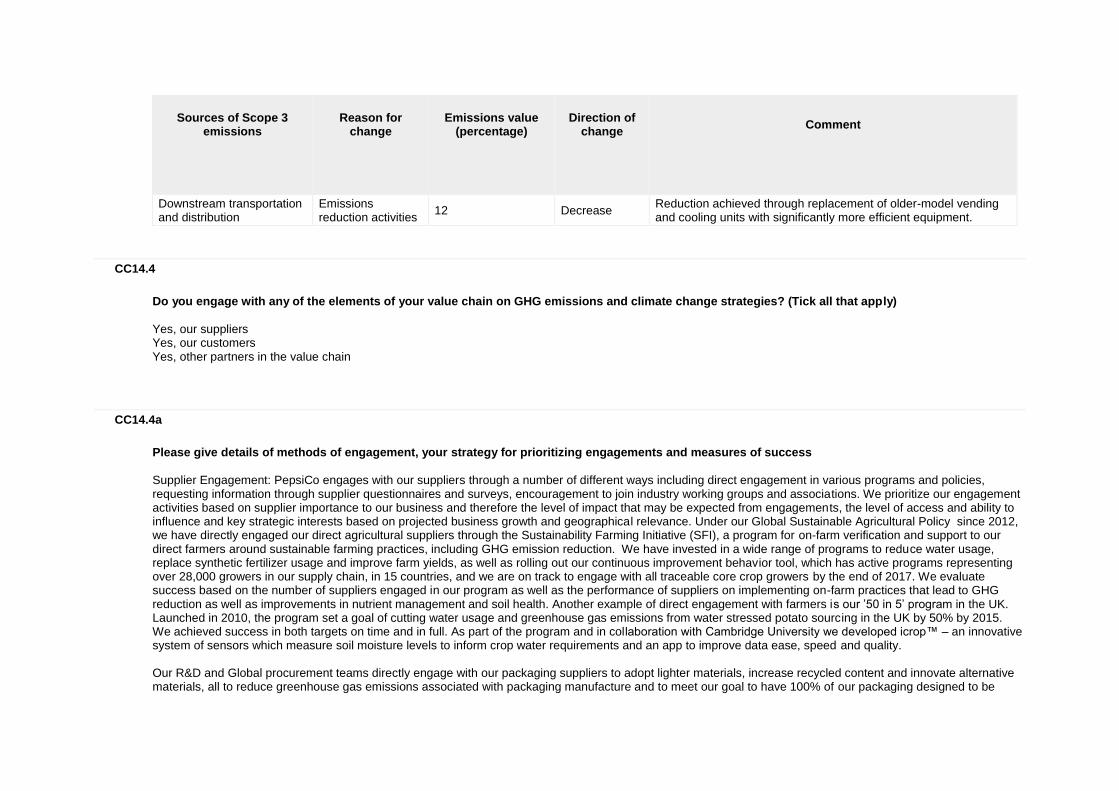
Sources of Scope 3
emissions
Reason for
change
Emissions value
(percentage)
Direction of
change
Comment
Downstream transportation and distribution
Emissions reduction activities
12 Decrease Reduction achieved through replacement of older-model vending and cooling units with significantly more efficient equipment.
CC14.4
Do you engage with any of the elements of your value chain on GHG emissions and climate change strategies? (Tick all that apply)
Yes, our suppliers Yes, our customers Yes, other partners in the value chain
CC14.4a
Please give details of methods of engagement, your strategy for prioritizing engagements and measures of success
Supplier Engagement: PepsiCo engages with our suppliers through a number of different ways including direct engagement in various programs and policies, requesting information through supplier questionnaires and surveys, encouragement to join industry working groups and associations. We prioritize our engagement activities based on supplier importance to our business and therefore the level of impact that may be expected from engagements, the level of access and ability to influence and key strategic interests based on projected business growth and geographical relevance. Under our Global Sustainable Agricultural Policy since 2012, we have directly engaged our direct agricultural suppliers through the Sustainability Farming Initiative (SFI), a program for on-farm verification and support to our direct farmers around sustainable farming practices, including GHG emission reduction. We have invested in a wide range of programs to reduce water usage, replace synthetic fertilizer usage and improve farm yields, as well as rolling out our continuous improvement behavior tool, which has active programs representing over 28,000 growers in our supply chain, in 15 countries, and we are on track to engage with all traceable core crop growers by the end of 2017. We evaluate success based on the number of suppliers engaged in our program as well as the performance of suppliers on implementing on-farm practices that lead to GHG reduction as well as improvements in nutrient management and soil health. Another example of direct engagement with farmers is our ’50 in 5’ program in the UK. Launched in 2010, the program set a goal of cutting water usage and greenhouse gas emissions from water stressed potato sourcing in the UK by 50% by 2015. We achieved success in both targets on time and in full. As part of the program and in collaboration with Cambridge University we developed icrop™ – an innovative system of sensors which measure soil moisture levels to inform crop water requirements and an app to improve data ease, speed and quality. Our R&D and Global procurement teams directly engage with our packaging suppliers to adopt lighter materials, increase recycled content and innovate alternative materials, all to reduce greenhouse gas emissions associated with packaging manufacture and to meet our goal to have 100% of our packaging designed to be
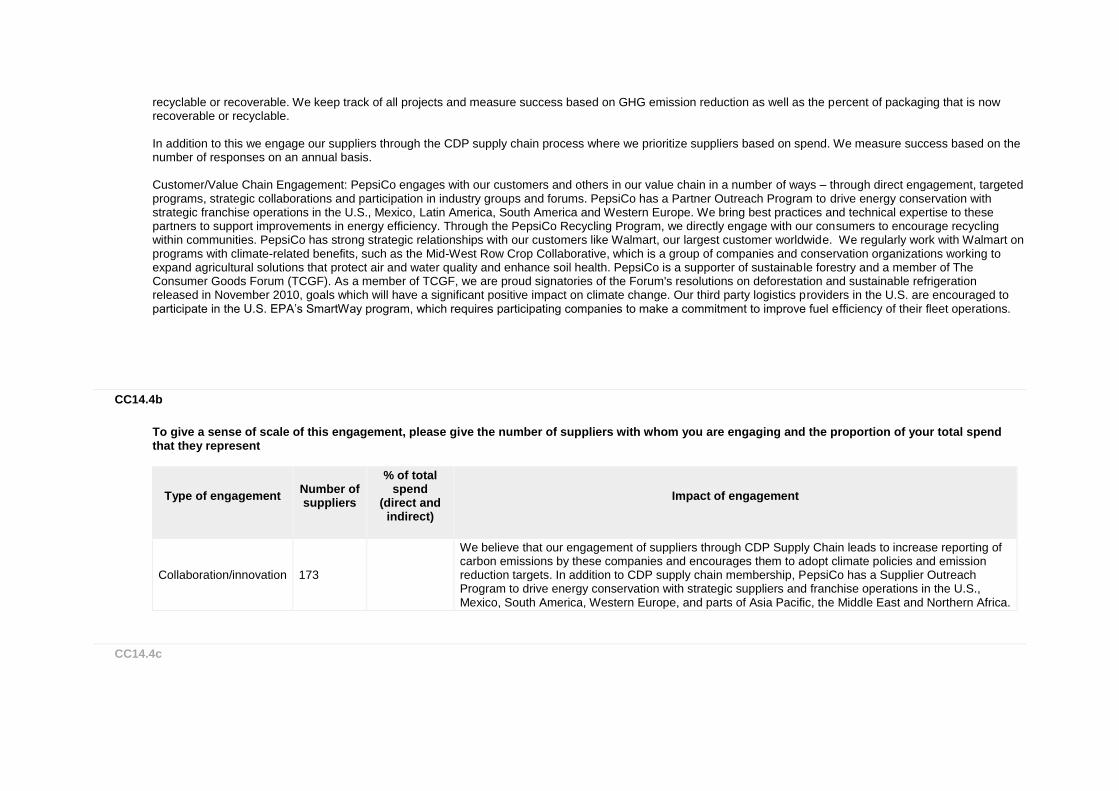
recyclable or recoverable. We keep track of all projects and measure success based on GHG emission reduction as well as the percent of packaging that is now recoverable or recyclable. In addition to this we engage our suppliers through the CDP supply chain process where we prioritize suppliers based on spend. We measure success based on the number of responses on an annual basis. Customer/Value Chain Engagement: PepsiCo engages with our customers and others in our value chain in a number of ways – through direct engagement, targeted programs, strategic collaborations and participation in industry groups and forums. PepsiCo has a Partner Outreach Program to drive energy conservation with strategic franchise operations in the U.S., Mexico, Latin America, South America and Western Europe. We bring best practices and technical expertise to these partners to support improvements in energy efficiency. Through the PepsiCo Recycling Program, we directly engage with our consumers to encourage recycling within communities. PepsiCo has strong strategic relationships with our customers like Walmart, our largest customer worldwide. We regularly work with Walmart on programs with climate-related benefits, such as the Mid-West Row Crop Collaborative, which is a group of companies and conservation organizations working to expand agricultural solutions that protect air and water quality and enhance soil health. PepsiCo is a supporter of sustainable forestry and a member of The Consumer Goods Forum (TCGF). As a member of TCGF, we are proud signatories of the Forum's resolutions on deforestation and sustainable refrigeration released in November 2010, goals which will have a significant positive impact on climate change. Our third party logistics providers in the U.S. are encouraged to participate in the U.S. EPA’s SmartWay program, which requires participating companies to make a commitment to improve fuel efficiency of their fleet operations.
CC14.4b
To give a sense of scale of this engagement, please give the number of suppliers with whom you are engaging and the proportion of your total spend that they represent
Type of engagement
Number of suppliers
% of total spend
(direct and indirect)
Impact of engagement
Collaboration/innovation 173
We believe that our engagement of suppliers through CDP Supply Chain leads to increase reporting of carbon emissions by these companies and encourages them to adopt climate policies and emission reduction targets. In addition to CDP supply chain membership, PepsiCo has a Supplier Outreach Program to drive energy conservation with strategic suppliers and franchise operations in the U.S., Mexico, South America, Western Europe, and parts of Asia Pacific, the Middle East and Northern Africa.
CC14.4c
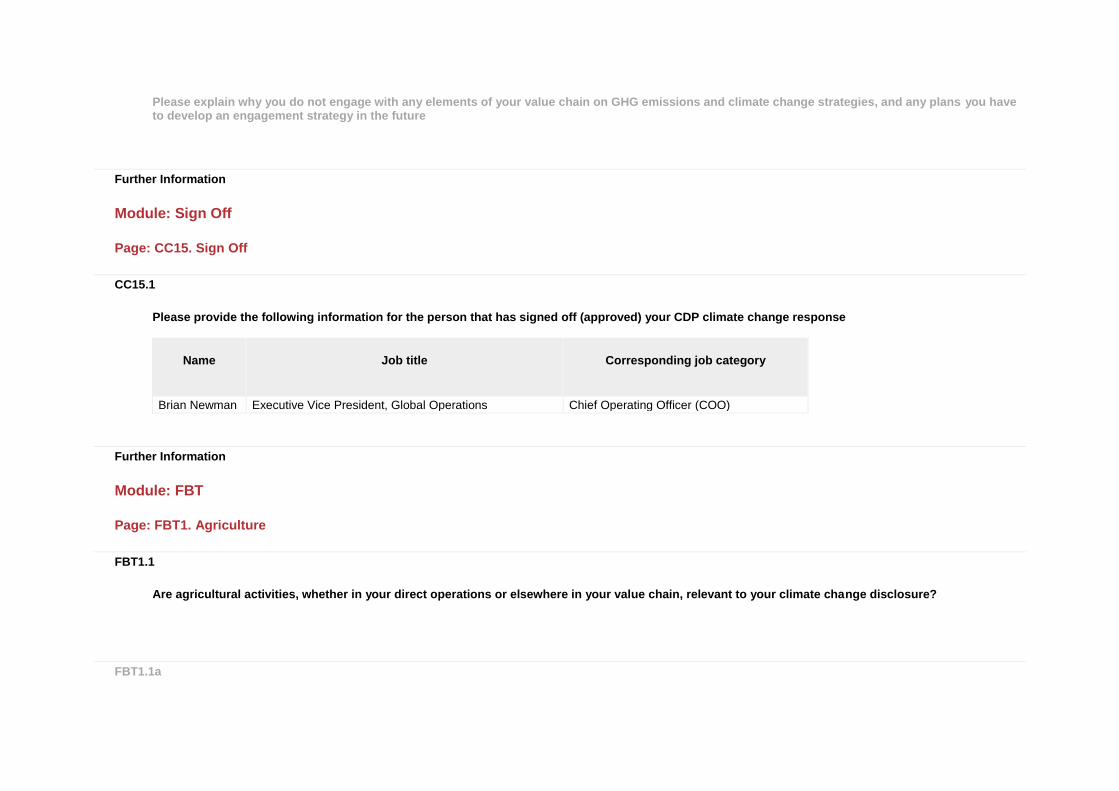
Please explain why you do not engage with any elements of your value chain on GHG emissions and climate change strategies, and any plans you have to develop an engagement strategy in the future
Further Information
Module: Sign Off
Page: CC15. Sign Off
CC15.1
Please provide the following information for the person that has signed off (approved) your CDP climate change response
Name
Job title
Corresponding job category
Brian Newman Executive Vice President, Global Operations Chief Operating Officer (COO)
Further Information
Module: FBT
Page: FBT1. Agriculture
FBT1.1
Are agricultural activities, whether in your direct operations or elsewhere in your value chain, relevant to your climate change disclosure?
FBT1.1a
Please explain why agricultural activities are not relevant to your climate change disclosure
FBT1.2
Are the agricultural activities that you have identified as relevant undertaken on your own farm(s), elsewhere in your value chain, or both?
FBT1.2a
Please explain why agricultural emissions from your own farms are not relevant
FBT1.3
Do you account for greenhouse gas emissions from agricultural activities undertaken on your own farm(s) as part of the global gross Scope 1 emissions figure reported in CC8.2, and/or the Scope 2 figure reported in CC8.3a of the core climate change questionnaire?
FBT1.3a
Please select the form(s) in which you wish to report the greenhouse gas emissions produced by agricultural activities (agricultural emissions) undertaken on your own farm(s)
FBT1.3b
Please report your total agricultural emissions produced on your own farm(s) and identify any exclusions in the table below
Scope
Agricultural emissions (metric
tonnes CO2e)
Methodology
Exclusions
Explanation
Comment
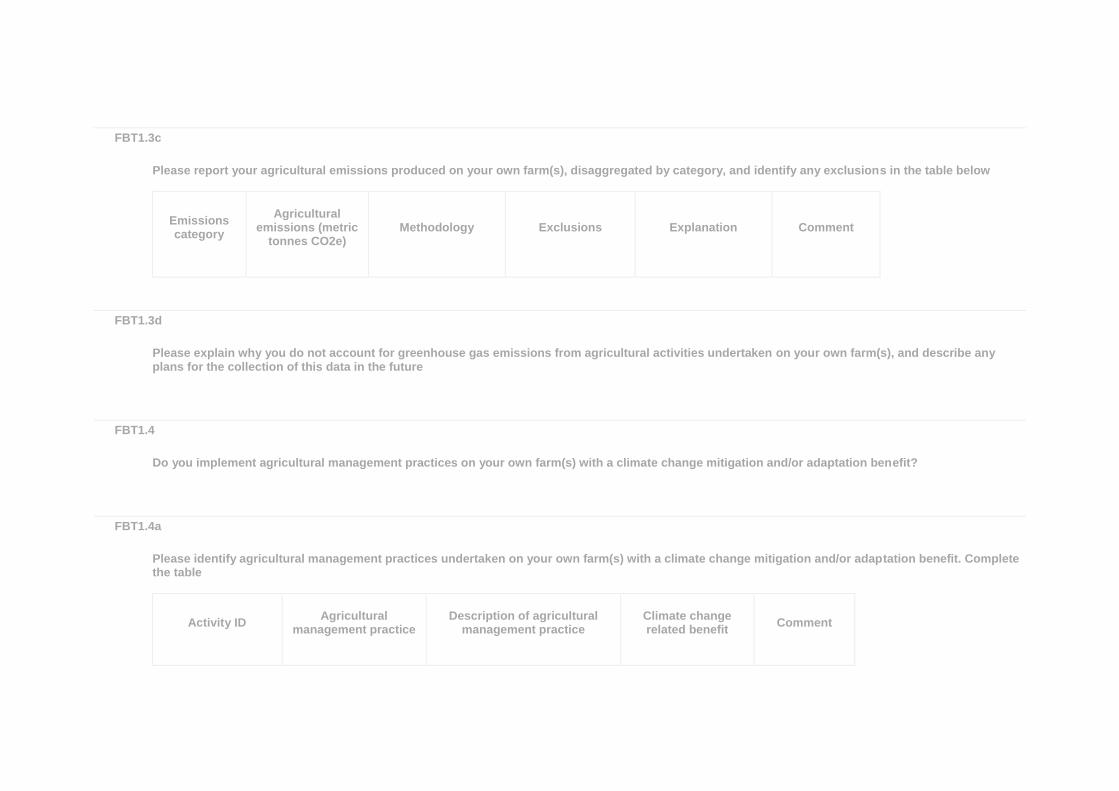
FBT1.3c
Please report your agricultural emissions produced on your own farm(s), disaggregated by category, and identify any exclusions in the table below
Emissions category
Agricultural
emissions (metric tonnes CO2e)
Methodology
Exclusions
Explanation
Comment
FBT1.3d
Please explain why you do not account for greenhouse gas emissions from agricultural activities undertaken on your own farm(s), and describe any plans for the collection of this data in the future
FBT1.4
Do you implement agricultural management practices on your own farm(s) with a climate change mitigation and/or adaptation benefit?
FBT1.4a
Please identify agricultural management practices undertaken on your own farm(s) with a climate change mitigation and/or adaptation benefit. Complete the table
Activity ID
Agricultural
management practice
Description of agricultural management practice
Climate change related benefit
Comment
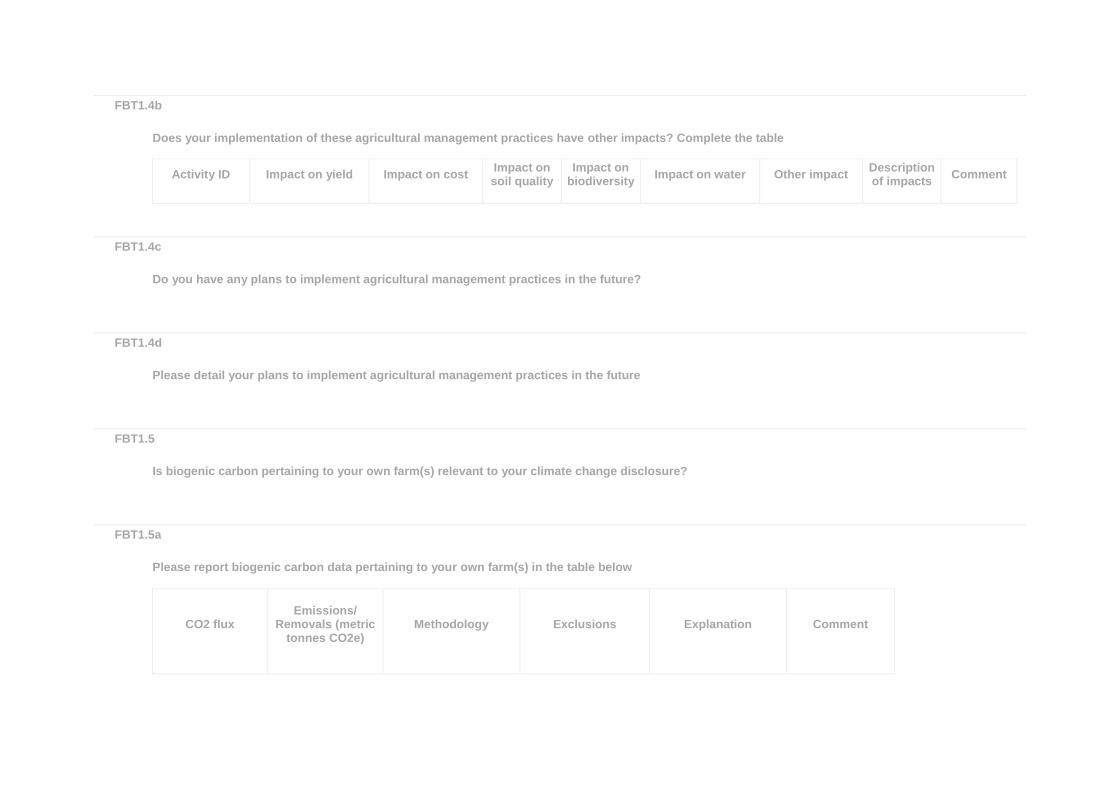
FBT1.4b
Does your implementation of these agricultural management practices have other impacts? Complete the table
Activity ID
Impact on yield
Impact on cost
Impact on soil quality
Impact on biodiversity
Impact on water
Other impact
Description of impacts
Comment
FBT1.4c
Do you have any plans to implement agricultural management practices in the future?
FBT1.4d
Please detail your plans to implement agricultural management practices in the future
FBT1.5
Is biogenic carbon pertaining to your own farm(s) relevant to your climate change disclosure?
FBT1.5a
Please report biogenic carbon data pertaining to your own farm(s) in the table below
CO2 flux
Emissions/
Removals (metric tonnes CO2e)
Methodology
Exclusions
Explanation
Comment
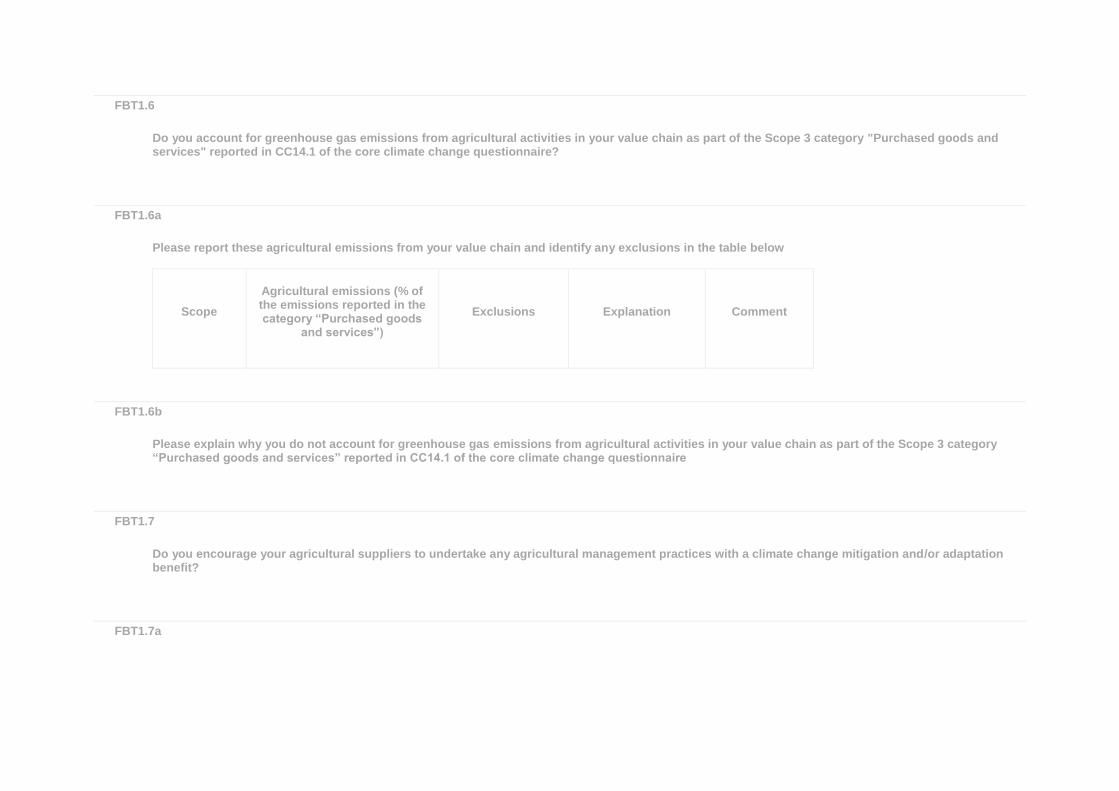
FBT1.6
Do you account for greenhouse gas emissions from agricultural activities in your value chain as part of the Scope 3 category "Purchased goods and services" reported in CC14.1 of the core climate change questionnaire?
FBT1.6a
Please report these agricultural emissions from your value chain and identify any exclusions in the table below
Scope
Agricultural emissions (% of the emissions reported in the category “Purchased goods
and services”)
Exclusions
Explanation
Comment
FBT1.6b
Please explain why you do not account for greenhouse gas emissions from agricultural activities in your value chain as part of the Scope 3 category “Purchased goods and services” reported in CC14.1 of the core climate change questionnaire
FBT1.7
Do you encourage your agricultural suppliers to undertake any agricultural management practices with a climate change mitigation and/or adaptation benefit?
FBT1.7a
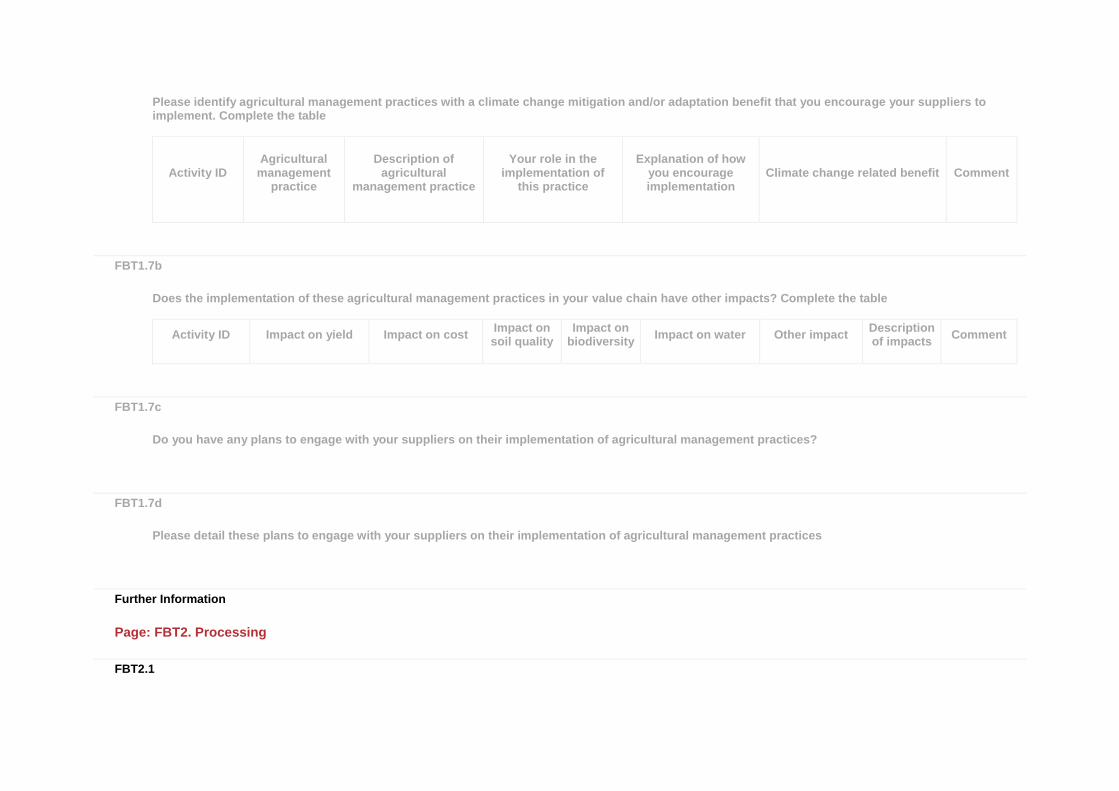
Please identify agricultural management practices with a climate change mitigation and/or adaptation benefit that you encourage your suppliers to implement. Complete the table
Activity ID
Agricultural
management practice
Description of agricultural
management practice
Your role in the implementation of
this practice
Explanation of how you encourage implementation
Climate change related benefit
Comment
FBT1.7b
Does the implementation of these agricultural management practices in your value chain have other impacts? Complete the table
Activity ID
Impact on yield
Impact on cost
Impact on soil quality
Impact on biodiversity
Impact on water
Other impact
Description of impacts
Comment
FBT1.7c
Do you have any plans to engage with your suppliers on their implementation of agricultural management practices?
FBT1.7d
Please detail these plans to engage with your suppliers on their implementation of agricultural management practices
Further Information
Page: FBT2. Processing
FBT2.1
Are processing activities, whether in your direct operations or elsewhere in your value chain, relevant to your climate change disclosure?
FBT2.1a
Please explain why processing activities are not relevant to your climate change disclosure
FBT2.2
Are the processing activities that you have identified as relevant undertaken in your direct operations, elsewhere in your value chain, or both?
FBT2.2a
Please explain why emissions from processing activities in your direct operations are not relevant
FBT2.3
Do you account for emissions from processing activities in your direct operations as part of the global gross Scope 1 emissions figure reported in CC8.2 and/or the Scope 2 figure reported in CC8.3a of the core climate change questionnaire?
FBT2.3a
Please report these emissions from processing activities in your direct operations and identify any exclusions in the table below
Scope
Emissions from processing activities (metric tonnes CO2e)
Exclusions
Explanation
Comment
FBT2.3b
Please explain why you do not account for emissions from processing activities in your direct operations, and describe any plans for the collection of this data in the future
FBT2.4
Do you account for emissions from processing activities in your value chain as part of the Scope 3 category "Purchased goods and services" and/or "Processing of sold products" reported in CC14.1 of the core climate change questionnaire?
Further Information
Page: FBT3. Distribution
FBT3.1
Are distribution activities, whether in your direct operations or elsewhere in your value chain, relevant to your climate change disclosure?
FBT3.1a
Please explain why distribution activities are not relevant to your climate change disclosure
FBT3.2
Are the distribution activities that you have identified as relevant undertaken in your direct operations, elsewhere in your value chain, or both?
FBT3.2a
Please explain why emissions from distribution activities in your direct operations are not relevant
FBT3.3
Do you account for emissions from distribution activities in your direct operations as part of the global gross Scope 1 emissions figure reported in CC8.2 and/or the Scope 2 figure reported in CC8.3a of the core climate change questionnaire?
FBT3.3a
Please report these emissions from distribution activities in your direct operations and identify any exclusions in the table below
Scope
Emissions from distribution activities (metric tonnes CO2e)
Exclusions
Explanation
Comment
FBT3.3b
Please explain why you do not account for emissions from distribution activities in your direct operations, and describe any plans for the collection of this data in the future
FBT3.4
Do you account for emissions from distribution activities in your value chain as part of the Scope 3 category "Upstream transportation and distribution" and/or "Downstream transportation and distribution" in CC14.1 of the core climate change questionnaire?
Further Information
Page: FBT4. Consumption
FBT4.1
Are emissions from the consumption of your products relevant to your climate change disclosure?
FBT4.1b
Please explain why emissions from the consumption of your products are not relevant to your climate change disclosure
FBT4.1a
Do you account for emissions from the consumption of your products as part of the Scope 3 category "Use of sold products" and/or "End of life treatment of sold products" in CC14.1 of the core climate change questionnaire?
CDP