Embed Size (px)
Citation preview

CDP CDP 2016 Climate Change 2016 Information Request
Mondelez International Inc
Module: Introduction
Page: Introduction
CC0.1
Introduction
Please give a general description and introduction to your organization. Mondelēz International, Inc. (NASDAQ: MDLZ) is a global snacking powerhouse, with 2015 revenue of $29.6 billion. Creating del icious moments of joy in 165 countries, Mondelēz International is a world leader in chocolate, biscuits, gum, candy and powdered beverages, with billion-dollar brands such as Cadbury, Cadbury Dairy Milk and Milka chocolate, LU, Nabisco and Oreo biscuits, Tang powdered beverages and Trident gum. Mondelēz International is a proud member of the Standard and Poor’s 500, NASDAQ 100 and Dow Jones Sustainability Index. Visit www.mondelezinternational.com and www.facebook.com/mondelezinternational. Today, people around the globe are increasingly interested in well-being and ensuring a sustainable future – for themselves, their families and their communities. We know people expect more from companies and the products they make and sell. That’s why we launched our Call For Well-being platform in 2013. We strongly believe our growth is directly linked to enhancing the well-being of the planet, the people who make and enjoy our products, and the communities we serve. As explained in our annual report, the Call For Well-Being supports one of our five global growth strategies: “Protect the Well-being of Our Planet.” It is focused on four areas that are critical to the well-being of the world and where we can make the greatest impact: well-being snacks (previously known as mindful snacking), sustainability, community and safety. Our collective efforts in these areas are designed to enable our business to grow, operate more efficiently and help create a sustainable future for our farmers and consumers. Sustainability is about preserving our world and its people. We need to find ways to use less fossil-fuel energy, water and other resources, switching to renewable energy where feasible, as well as reduce the waste we generate. For many years, we’ve listened to and worked with smallholder farmers to promote sustainable supply chains. With our partners we help increase the farmers’ output, improve their livelihoods, build thriving communities and protect the environment. We know we can’t do everything, so our focus is in those areas where we can have the greatest impact: sustainable agriculture and reducing the environmental footprint of our own operations. To reduce our environmental footprint by 2015, we set the following goals: • Cut our energy and water use in manufacturing by 15% per tonne of production versus 2010

• Reduce our greenhouse gas emissions and waste from manufacturing by 15% per tonne of production versus 2010 • Make 60% of our production in Zero Waste to Landfill sites • Eliminate 50 million pounds (22,500 tons) of packaging material We set goals to help transform and secure our agricultural supply • All cocoa will ultimately be sustainably sourced • 75% of Western European biscuits volume made with Harmony wheat by 2015 • Palm oil: 100% RSPO by 2015 For a number of years now, sustainability has been a strategic business priority for Mondelēz International, having first set aggressive five-year goals to reduce energy, carbon dioxide emissions, water, waste and packaging in 2006, under our former name, Kraft Foods Inc. Our focus on climate change is also consistent with our environmental policy, which states: “Mondelēz International is committed to reducing the environmental impact of our activities, preventing pollution and promoting the sustainability of the natural resources upon which we depend, while providing quality products that meet the needs of our consumers. We also are committed to the continuous improvement of our environmental performance and to meeting or exceeding the requirements of all applicable environmental laws and regulations. We expect all Mondelēz International employees to carry out their job responsibilities in accordance with this policy and to report any environmental concerns they have to management." In 2015, we established new 2020 sustainability goals that placed us at the forefront of the fight against climate change and support our 2020 ambition to be the leader in well-being snacks while driving down costs and creating efficiencies to accelerate our growth. We adopted science-based targets to reduce absolute CO2 emissions from manufacturing as part of our ambitious end-to-end approach. This represents a transition from normalized (to production) targets to an absolute target. We will also implement deforestation interventions in key agriculture supply programs, such as Cocoa Life, and as progress is made on the ground, will publicly report the resulting end-to-end carbon footprint reduction. Done right, we know building sustainability into our business is good for the planet, people and, ultimately, our profits.
CC0.2
Reporting Year
Please state the start and end date of the year for which you are reporting data. The current reporting year is the latest/most recent 12-month period for which data is reported. Enter the dates of this year first. We request data for more than one reporting period for some emission accounting questions. Please provide data for the three years prior to the current reporting year if you have not provided this information before, or if this is the first time you have answered a CDP information request. (This does not apply if you have been offered and selected the option of answering the shorter questionnaire). If you are going to provide additional years of data, please give the dates of those reporting periods here. Work backwards from the most recent reporting year. Please enter dates in following format: day(DD)/month(MM)/year(YYYY) (i.e. 31/01/2001).
Enter Periods that will be disclosed
Thu 01 Jan 2015 - Thu 31 Dec 2015
CC0.3
Country list configuration
Please select the countries for which you will be supplying data. If you are responding to the Electric Utilities module, this selection will be carried forward to assist you in completing your response.
Select country
CC0.4
Currency selection
Please select the currency in which you would like to submit your response. All financial information contained in the response should be in this currency. USD($)
CC0.6
Modules
As part of the request for information on behalf of investors, electric utilities, companies with electric utility activities or assets, companies in the automobile or auto component manufacture sub-industries, companies in the oil and gas sub-industries, companies in the information technology and telecommunications sectors and companies in the food, beverage and tobacco industry group should complete supplementary questions in addition to the main questionnaire.

If you are in these sector groupings (according to the Global Industry Classification Standard (GICS)), the corresponding sector modules will not appear below but will automatically appear in the navigation bar when you save this page. If you want to query your classification, please email [email protected]. If you have not been presented with a sector module that you consider would be appropriate for your company to answer, please select the module below. If you wish to view the questions first, please see https://www.cdp.net/en-US/Programmes/Pages/More-questionnaires.aspx.
Further Information
Attachments
https://www.cdp.net/sites/2016/37/42037/Climate Change 2016/Shared Documents/Attachments/ClimateChange2016/CC0.Introduction/CFWB 2015 Progress Report Infographic_FINAL.pdf https://www.cdp.net/sites/2016/37/42037/Climate Change 2016/Shared Documents/Attachments/ClimateChange2016/CC0.Introduction/CFWB 2015 Progress Report_HIGH RES_FINAL.pdf
Module: Management
Page: CC1. Governance
CC1.1
Where is the highest level of direct responsibility for climate change within your organization?
Board or individual/sub-set of the Board or other committee appointed by the Board
CC1.1a
Please identify the position of the individual or name of the committee with this responsibility
For Mondelēz International, sustainability is one part of our Call For Well-being, a set of coordinated actions that supports one of our five global strategies: “Protect the Well-being of Our Planet and Its People.” Our collective efforts are designed to enable our business to grow, operate more efficiently and help create a sustainable future for our suppliers, farmers and consumers. We take a comprehensive approach to well-being, integrating it throughout our business processes. Our CEO is engaged in the review and progress of our Well-

being strategy in conjunction with the Governance, Membership and Public Affairs Committee (“Governance Committee”) of our Board of Directors, which is responsible for overseeing sustainability as part of our strategy to Protect the Well-being of Our Planet and Its People. We have a global Well-being leadership team that has oversight from our Chief Growth Officer and is co-chaired by our Chief R&D & Nutrition Officer, and Vice President of Global Well-being & Sustainability. The team includes global category presidents, as well as the Executive VP & Region President. The team sets the direction of our global well-being business strategy. It also includes senior representatives from strategy, marketing, consumer insights, government & public affairs, supply chain, and scientific & regulatory affairs. Our sustainability goals are part of the strategic planning process at Mondelēz International, and therefore, progress and key activities are regularly reported to the Board and the business unit leadership teams. CO2 and hence energy are key focus areas in our sustainability strategy. In 2015, we established new 2020 sustainability goals that placed us at the forefront of the fight against climate change and support our 2020 ambition to be the leader in well-being snacks while driving down costs and creating efficiencies to accelerate our growth. We adopted science-based targets to reduce absolute CO2 emissions from manufacturing as part of our ambitious end-to-end approach. This represents a transition from normalized (to production) targets to an absolute target. We will also implement deforestation interventions in key agriculture supply programs, such as Cocoa Life, and as progress is made on the ground, will publicly report the resulting end-to-end carbon footprint reduction. Clear business goals have been set as part of the sustainability strategy led by the Vice President, External Affairs. In addition, each business unit is responsible for integrating sustainability into their strategic plans, including our operational goals such as CO2 reduction. They are responsible for developing a plan that will enable them to deliver sustainability performance that will contribute to the overall corporate sustainability goals.
CC1.2
Do you provide incentives for the management of climate change issues, including the attainment of targets?
Yes
CC1.2a
Please provide further details on the incentives provided for the management of climate change issues
Who is entitled to benefit from these
incentives?
The type of incentives
Incentivized performance
indicator
Comment

Who is entitled to benefit from these
incentives?
The type of incentives
Incentivized performance
indicator
Comment
All employees Recognition (non-monetary)
Incentives come in the form of internal recognition and external recognition (through press releases, customers, etc.).
All employees Monetary reward
Achievement of sustainability goals (including energy/CO2 reduction) as part of overall business unit goals may translate into monetary reward through standard monetary incentives at all levels and functions and according to performance.
Further Information
Page: CC2. Strategy
CC2.1
Please select the option that best describes your risk management procedures with regard to climate change risks and opportunities
Integrated into multi-disciplinary company wide risk management processes
CC2.1a
Please provide further details on your risk management procedures with regard to climate change risks and opportunities
Frequency of monitoring
To whom are results
reported?
Geographical
areas considered
How far into
the future are risks
considered?
Comment
Six-monthly or more
Board or individual/sub-set of the Board or
Global > 6 years We have a robust Enterprise Risk Management (ERM) process for identifying, measuring, monitoring, and managing risks, with oversight by the Risk and

Frequency of monitoring
To whom are results
reported?
Geographical
areas considered
How far into
the future are risks
considered?
Comment
frequently committee appointed by the Board
Compliance Committee (MRCC), which reports annually to the Audit Committee. The executive sponsors of the MRCC are the EVP and Chief Financial Officer, and the EVP and General Counsel. The purpose of the MRCC is to manage our process to identify and assess the most significant inherent risks to us so we may adequately mitigate them and/or monitor them across the company. All identified risks are vetted by the MRCC and remain under the MRCC’s governance. Ownership of specific risks is assigned at the Leadership Team (MLT) level (MLT members report directly to the CEO). As owners of each specific risk, MLT members are responsible for verifying that appropriate mitigation controls and monitoring systems are in place. The risk universe considered during this process is wide and varied. Climate change is included in this risk universe.
CC2.1b
Please describe how your risk and opportunity identification processes are applied at both company and asset level
Our ERM methodology is governed by the MRCC and includes annual reviews with all business regions as described above. The ERM process results in the identification of a variety of risks. The results of climate change risk and water-related risks are captured in commodities, reputation and brand image, unanticipated business disruptions, and changes in laws and regulations. We do business continuity planning for a variety of business matters. We have a well thought-out business plan to react to disruptions caused by a given crisis, including potential facility interruptions, key sourcing interruptions and system interruptions. We use other risk analysis tools for financial and business risks. Other examples come from operations, information systems, global environmental and safety (E&S) standards and agricultural commodities. For E&S standards, we operate a Global E&S Standards and Management System. The system includes several global E&S standards that involve crisis preparedness / risk management. Facilities worldwide are required to assess E&S risks and implement these standards and address those risks. We also conduct sensitivity and stress testing analysis on changes in water availability/quality. We map water use and water stress using the WBCSD tool, and the WRI Aqueduct Water Risk Mapping tool to map our sites in terms of overall water risk, including water availability, water quality and legislative/media risk. Given the nature of challenges linked to sourcing agricultural commodities, we have developed specific ways of looking at longer-term challenges and risks. Notably, we have assessed with the World Wildlife Fund the long-term sustainability risks for many of our main commodities, including cocoa, palm oil and sugar. Also, with another third party, we mapped our total environmental footprint: carbon (air), land and water. This work provided us with a better understanding of the impacts across our supply chain and will enable us to focus activities.

CC2.1c
How do you prioritize the risks and opportunities identified?
We use various multi-dimensional tools and models throughout the company to support the identification of corporate risks, to facilitate timely and effective risk response, and to have an adequate level of controls and safeguards, including SWOT analysis (Strength/Weakness/Opportunity/Threat), risk maps and third-party sources. For the corporation to assess the most important risks at a senior management level, we use a risk mapping process to help identify the impact and likelihood of the risk, based upon a uniform framework. The mapping process also includes an assessment of the controls in place to mitigate the risk. This allows senior management to rank financial, operational, compliance and strategic risks to verify the proper resources (including people, capital, time, and oversight) are in place. The MRCC is responsible for driving the risk culture through standard measurement and language for risk exposure. The Region Presidents and their staff are responsible for integrating the culture and measurement into existing business practices. To verify this process is being adhered to, the Internal Audit department verifies the control expectations set up by the MRCC through the course of the audits performed during the year and regional internal audit leads also participate as members of Region Risk and Compliance Committees. Manufacturing: plants with the highest operating income (OI) impact must improve their property protection (against fire, flood, wind and earthquake losses to their property) to protect the company from loss. This focuses the capital dollars on the plants with the highest impact. Procurement: critical single and sole source suppliers are prioritized for risk mitigation through contractual agreements, business continuity planning or qualification of secondary suppliers. Specific focus is given to suppliers supporting strategic product categories.
CC2.1d
Please explain why you do not have a process in place for assessing and managing risks and opportunities from climate change, and whether you plan to introduce such a process in future
Main reason for not having a process
Do you plan to introduce a process?
Comment
CC2.2
Is climate change integrated into your business strategy?

Yes
CC2.2a
Please describe the process of how climate change is integrated into your business strategy and any outcomes of this process
Today, people around the globe are increasingly interested in well-being and ensuring a sustainable future – for themselves, their families and their communities. We know people expect more from companies and the products they make and sell. That’s why we launched our Call For Well-being platform in 2013. We strongly believe our growth is directly linked to enhancing the well-being of the planet, the people who make and enjoy our products, and the communities we serve. As explained in our annual report, the Call For Well-Being supports one of our five global growth strategies: “Protect the Well-being of Our Planet.” It is focused on four areas that are critical to the well-being of the world and where we can make the greatest impact: mindful snacking, sustainability, community and safety. Our collective efforts in these areas are designed to enable our business to grow, operate more efficiently and help create a sustainable future for our farmers and consumers. Sustainability is about preserving our world and its people. We all depend on just one planet. So all of us need to work together and find ways to use less energy, water and other resources, as well as reduce the waste we generate. For many years, we’ve listened to and worked with smallho lder farmers to promote sustainable supply chains. With our partners we help increase the farmers’ output, improve their livelihoods, build thriving communities and protect the environment. We’re using our resources to amplify this ongoing conversation. Our sustainability journey has put us on a path that is making a real difference. But we know we can’t do everything. So our focus is in those areas where we can have the greatest impact: sustainable agriculture and reducing the environmental footprint of our own operations. To reduce our environmental footprint by 2015, we set the following goals: • Cut our energy and water use in manufacturing by 15% per tonne of production versus 2010 • Reduce our greenhouse gas emissions and waste from manufacturing by 15% per tonne of production versus 2010 • Make 60% of our production in Zero Waste to Landfill sites • Eliminate 50 million pounds (22,500 tons) of packaging material We set goals to help transform and secure our agricultural supply • All cocoa will ultimately be sustainably sourced • 75% of Western European biscuits volume made with Harmony wheat by 2015 • Palm oil: 100% RSPO by 2015 Our sustainability goals are applied across our business units and are included in their strategic plans. We performed a comprehensive and groundbreaking analysis of our environmental footprint, which includes carbon (air), water and land impacts across our whole

lifecycle. This work has provided us with a better understanding of the impacts across our supply chain and will enable us to focus activities where it matters: CO2, water and land use. This review was initially conducted for Kraft Foods Global, Inc. in 2011. We update this analysis annually to help further refine our strategy. For more info, see our Call For Well-being 2015 Progress Report (at page 9): http://www.mondelezinternational.com/~/media/MondelezCorporate/uploads/downloads/cfwbprogressreport.pdf We look at two key impact areas to reduce GHG emissions: direct and indirect control. Matters within our direct control are a relatively minor portion of our total footprint, but we have direct influence. We have ambitious manufacturing goals (above) to reduce manufacturing energy use and CO2 emissions related to energy use: From 2005-2010, we reduced energy use by 16% normalized to production. From 2010-2015 we reduced energy use an additional 11% when normalized to production. From 2005-2010 we reduced energy-related emissions by 18% when normalized to production. From 2010-2015 we reduced energy-related GHG emissions 19% when normalized to production. For areas beyond our direct control, notably agriculture, which accounts for the largest share of our CO2e footprint, we have a longer-term strategy and consider both the impact of climate change on our ability to secure the agricultural commodities we need to make our products and on the impact that those agricultural commodities have on global warming. We have focused where we may have better influence and opportunity to drive change. In late 2012, through our Cocoa Life initiative, we have committed $400 million over 10 years to this large and our most comprehensive program to date to support sustainable production and improve the livelihoods of 200,000 cocoa farmers. We are also tackling other commodities, such as sugar, palm oil, wheat and dairy. We also expanded our buying of GreenPalm certificates and segregated palm oil during 2013 to cover 100 percent of our palm oil purchases – two years ahead of our commitment. GreenPalm is an RSPO-endorsed certificate-trading program that provides incentives to producers whose plantations conform to its criteria. In 2014, we launched an ambitious action plan laying out steps so that the palm oil we buy is produced on legally held land, doesn’t lead to deforestation or loss of peat land and respects human rights. We are using life-cycle thinking to help uncover ways to eliminate waste in manufacturing, measure how product and packaging innovations improve on previous designs, and provide a common system to measure and explain those benefits. We're leveraging our consumers and partners where we can and we have several success stories: In Asia Pacific, we saved 1084 metric tonnes by moving from cartons to flexible film for Chips Ahoy! In Latin America, we had 2,500 fewer trucks on the road per year and a savings of 1,300 metric tonnes of packaging by changing Tang packaging – including primary pack, secondary pack and case packer. In Europe, we removed 92 metric tonnes and had 35 fewer trucks on the road by harmonizing our gum bottles to a smaller range, optimized for the consumer. By the end of 2015, our European wheat sustainability program, Harmony, has grown to include 2,269 wheat farmers, 13 millers and 37 cooperatives across Europe. And today, 75 percent of our biscuits in Western Europe are made with Harmony wheat, including brands such as Prince and Petit Lu.
CC2.2b

Please explain why climate change is not integrated into your business strategy
CC2.2c
Does your company use an internal price of carbon?
No, and we currently don't anticipate doing so in the next 2 years
CC2.2d
Please provide details and examples of how your company uses an internal price of carbon
CC2.3
Do you engage in activities that could either directly or indirectly influence public policy on climate change through any of the following? (tick all that apply)
Direct engagement with policy makers Trade associations Other
CC2.3a
On what issues have you been engaging directly with policy makers?
Focus of legislation
Corporate Position
Details of engagement
Proposed legislative solution
Other: Sustainable
Support We shared our commitment at the UN Climate Summit in September 2014 to extend our support for UNDP’s plans to work with the Government of Indonesia and companies to
The goal is to support the scale up sustainable palm oil in Indonesia via a

Focus of legislation
Corporate Position
Details of engagement
Proposed legislative solution
palm oil support the scale up of sustainable palm oil in Indonesia via a commodity platform approach. In addition, we co-chair the Consumer Goods Forum’s Palm Oil Working Group – which published palm oil sourcing guidelines for members during 2015, we work with the Roundtable on Sustainable Palm Oil and we supported the NY Declaration on Forests.
commodity platform approach.
Other: Food security
Support
We are members of the project board of the New Vision for Agriculture Initiative, created by the Consumer Industries of the World Economic Forum with the overarching goal to provide food security for all in an environmentally sustainable way, while generating economic growth and opportunity.
We have the overarching goal of providing food security for all in an environmentally sustainable way, while generating economic growth and opportunity.
Climate finance
Support
We announced our commitment to combat deforestation in cocoa at the UN Climate Summit COP21, where world leaders met in Paris to negotiate a new climate agreement. Mondelēz International committed to lead private sector action in Côte d’Ivoire’s national program to combat deforestation in cocoa. These actions will initially focus in two areas of eastern and central Côte d’Ivoire and will contribute to the national United Nations sponsored REDD+ program, with financial support from the World Bank Forest Investment Program. We have voiced support for the World Bank’s BioCarbon Fund million initiative for sustainable forest landscapes. See:http://www.worldbank.org/en/news/feature/2013/11/20/biocarbon-fund-initiative-promote-sustainable-forest-landscapes
In Cote d’Ivoire, We will work together with the Ivorian government and other experts to map and monitor forested areas, and train farmers in good agricultural practices and agroforestry. The $280 million Initiative for Sustainable Forest Landscapes, launched in November 2013, seeks to scale up land-management practices across large landscapes to protect forests and securing green supply chains.
CC2.3b
Are you on the Board of any trade associations or provide funding beyond membership?
Yes
CC2.3c
Please enter the details of those trade associations that are likely to take a position on climate change legislation

Trade association
Is your position on
climate change
consistent with
theirs?
Please explain the trade association's position
How have you, or are you attempting to, influence the position?
Consumer Goods Forum
Consistent
In 2010, we supported the Consumer Goods Forum’s resolutions to fight climate change by addressing deforestation and promoting sustainable refrigeration. In particular with regard to deforestation, policy plays an essential role.
We actively help develop CGF's refrigeration and deforestation positions and we resolved to do our part in achieving the Forum‘s goal of assisting countries achieve net-zero deforestation. We remain active in helping CGF develop its work in this area and co-chaired the development of sourcing guidelines for palm oil - published during 2015 - and contributed to discussions between CGF and the Tropical Forest Alliance.
SAI Platform Consistent
This global organization's vision is that sustainable agriculture is "the efficient production of safe, high quality agricultural products, in a way that protects and improves the natural environment, the social and economic conditions of farmers, their employees and local communities, and safeguards the health and welfare of all farmed species."
We actively participate in SAI's position and projects.
CC2.3d
Do you publicly disclose a list of all the research organizations that you fund?
CC2.3e
Please provide details of the other engagement activities that you undertake
N/A
CC2.3f

What processes do you have in place to ensure that all of your direct and indirect activities that influence policy are consistent with your overall climate change strategy?
Engagement is coordinated by a corporate sustainability team, which includes key functions involved in setting and delivering sustainability strategy, including the Corporate and Government Affairs function, which has responsibility for external engagement. Decisions to participate in engagement relating to climate change are reviewed by key members of the sustainability team and the Vice President External Affairs.
CC2.3g
Please explain why you do not engage with policy makers
Further Information
Attachments
https://www.cdp.net/sites/2016/37/42037/Climate Change 2016/Shared Documents/Attachments/ClimateChange2016/CC2.Strategy/CFWB 2015 Progress Report Infographic_FINAL.pdf https://www.cdp.net/sites/2016/37/42037/Climate Change 2016/Shared Documents/Attachments/ClimateChange2016/CC2.Strategy/CFWB 2015 Progress Report_HIGH RES_FINAL.pdf
Page: CC3. Targets and Initiatives
CC3.1
Did you have an emissions reduction or renewable energy consumption or production target that was active (ongoing or reached completion) in the reporting year?
Absolute target Intensity target
CC3.1a

Please provide details of your absolute target
ID
Scope
% of emissions in
scope
% reduction from base
year
Base year
Base year emissions covered by
target (metric tonnes CO2e)
Target year
Is this a science-based target?
Comment
Abs1
Scope 1+2 (market-based)
95% 15% 2013 1711778 2020 Yes
In 2015, we established new 2020 sustainability goals that placed us at the forefront of the fight against climate change and support our 2020 ambition to be the leader in well-being snacks while driving down costs and creating efficiencies to accelerate our growth. We adopted science-based targets to reduce absolute CO2 emissions from manufacturing as part of our ambitious end-to-end approach. This represents a transition from normalized (to production) targets to an absolute target.
CC3.1b
Please provide details of your intensity target
ID
Scope
% of emissions in
scope
% reduction
from base year
Metric
Base year
Normalized base year emissions covered by
target
Target year
Is this a science-based target?
Comment
Int1 Scope 1+2 (market-based)
95% 15% Metric tonnes CO2e per metric tonne of product
2010 0.324 2015 No, but we are reporting another target which is science-based
CC3.1c

Please also indicate what change in absolute emissions this intensity target reflects
ID
Direction of change
anticipated in absolute Scope 1+2 emissions
at target completion?
% change anticipated in absolute Scope 1+2 emissions
Direction of change
anticipated in absolute Scope 3 emissions at
target completion?
% change anticipated in absolute
Scope 3 emissions
Comment
Int1 Decrease 18
Starting in 2011, the new CO2e normalized reduction target is for manufacturing only with 2010 as the base year. The goal was reset in 2011 following two major acquisitions of LU and Cadbury. Scope 3 emissions are not within the scope of our emission reduction target as defined in question 3.1b above. Currently, our emission reduction intensity target is for scope 1 and 2 emissions from manufacturing.
CC3.1d
Please provide details of your renewable energy consumption and/or production target
ID
Energy types
covered by target
Base year
Base year energy for energy type covered
(MWh)
% renewable
energy in base year
Target year
% renewable
energy in target year
Comment
CC3.1e

For all of your targets, please provide details on the progress made in the reporting year
ID
% complete
(time)
% complete (emissions or
renewable energy)
Comment
Int1 100% 100%
In 2011, we reset our goals with a new baseline of 2010, to include the Cadbury and LU businesses. Our aggressive CO2 reduction target of 15% reduction by 2015 is emissions normalized to production and tied to plant performance goals. We met and then exceeded that target early; so we achieved 127% of our emissions reduction goal by year end 2015.
Abs1 28% 40%
In 2015, we established new 2020 sustainability goals that placed us at the forefront of the fight against climate change and support our 2020 ambition to be the leader in well-being snacks while driving down costs and creating efficiencies to accelerate our growth. We adopted science-based targets to reduce absolute CO2 emissions from manufacturing by 15% from base year 2013 as part of our ambitious end-to-end approach. This represents a transition from normalized (to production) targets to an absolute target. We achieved 40% of our emissions reduction goal by year end 2015.
CC3.1f
Please explain (i) why you do not have a target; and (ii) forecast how your emissions will change over the next five years
CC3.2
Do you classify any of your existing goods and/or services as low carbon products or do they enable a third party to avoid GHG emissions?
Yes
CC3.2a

Please provide details of your products and/or services that you classify as low carbon products or that enable a third party to avoid GHG emissions
Level of
aggregation
Description of product/Group of
products
Are you
reporting low carbon
product/s or avoided
emissions?
Taxonomy, project or
methodology used to classify
product/s as low carbon or to calculate
avoided emissions
% revenue from low carbon
product/s in the
reporting year
% R&D in
low carbon
product/s in the
reporting year
Comment
Group of products
We have changed packaging on numerous products. These changes have resulted in emissions avoidance because of the materials used and more efficient transportation.
Low carbon product
Other: 9%
Our Eco-Calc packaging tool is based on lifecycle principles to assess effects of packaging reduction, end of life (EOL), and sourcing It encourages material reduction, more recycled content, efficiency, and less CO2e and energy use.
CC3.3
Did you have emissions reduction initiatives that were active within the reporting year (this can include those in the planning and/or implementation phases)
Yes
CC3.3a
Please identify the total number of projects at each stage of development, and for those in the implementation stages, the estimated CO2e savings

Stage of development
Number of projects
Total estimated annual CO2e savings in metric tonnes CO2e (only for rows marked *)
Under investigation 60
To be implemented*
Implementation commenced*
Implemented* 98 35787
Not to be implemented
CC3.3b
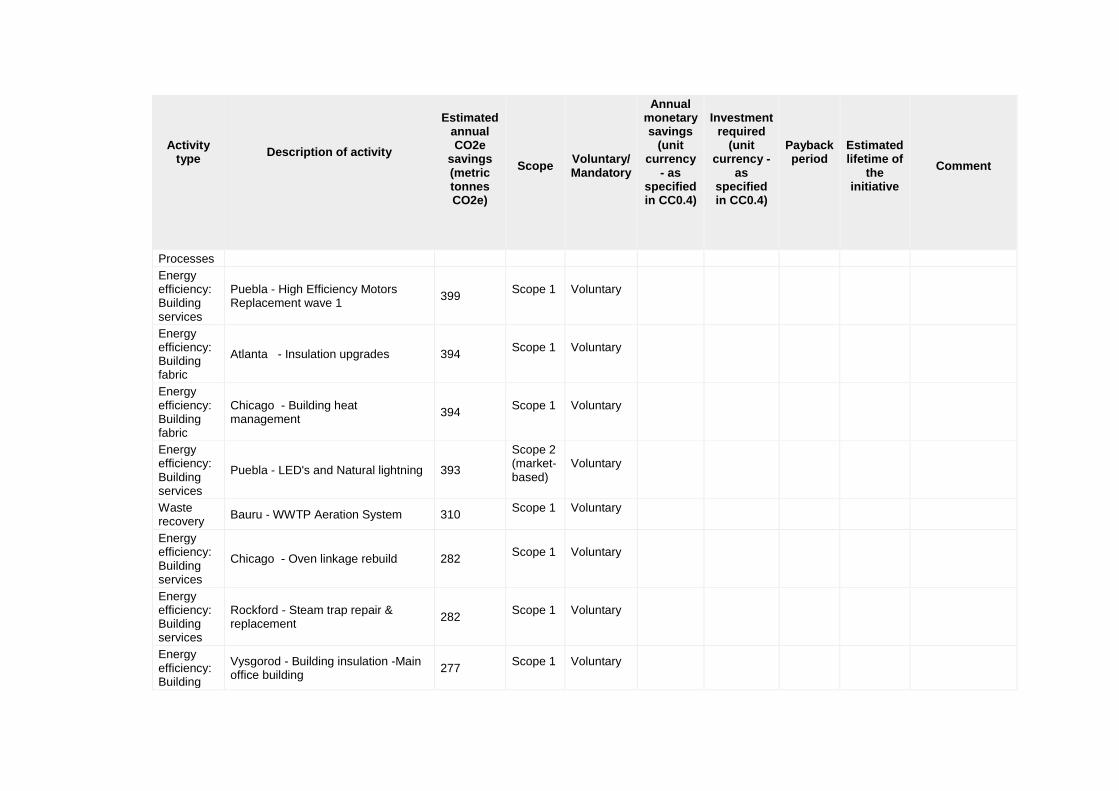
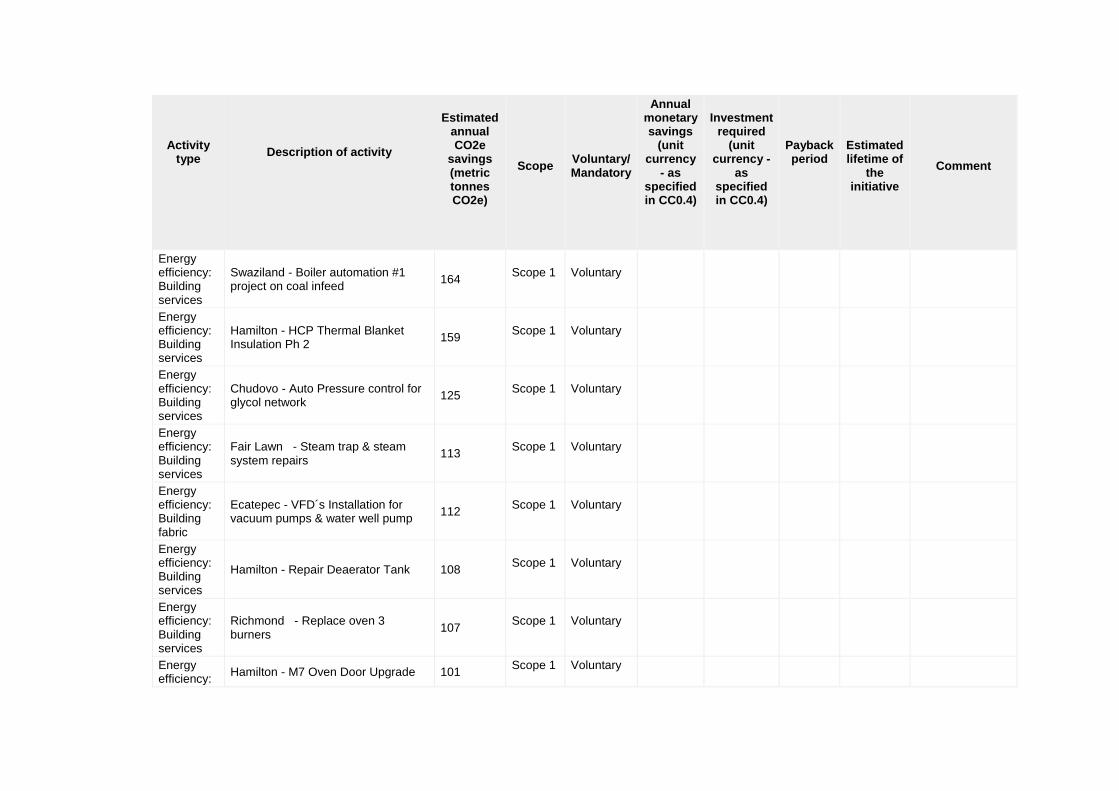
For those initiatives implemented in the reporting year, please provide details in the table below
Activity type
Description of activity
Estimated annual CO2e
savings (metric tonnes CO2e)
Scope
Voluntary/ Mandatory
Annual monetary savings
(unit currency
- as specified in CC0.4)
Investment required
(unit currency -
as specified in CC0.4)
Payback period
Estimated lifetime of
the initiative
Comment
Low carbon energy purchase
Purchased additional 13511 MWh of Guarantees of Origin relative to 2014 (505931 MWh Guarantees of Origin total in 2015)
24960
Scope 2 (market-based)
Voluntary
<1 year
Our company has purchased Guarantees of Origin since 2014. Guarantees of Origin purchases now represent 9.4 percent of our annual energy

Activity type
Description of activity
Estimated annual CO2e
savings (metric tonnes CO2e)
Scope
Voluntary/ Mandatory
Annual monetary savings
(unit currency
- as specified in CC0.4)
Investment required
(unit currency -
as specified in CC0.4)
Payback period
Estimated lifetime of
the initiative
Comment
consumption.
Energy efficiency: Building fabric
V Stani - Replace faulty steam traps 1084 Scope 1
Voluntary
Energy efficiency: Building services
Chicago - Oven burner profile consistency
631 Scope 1
Voluntary
Energy efficiency: Building services
Chicago - steam trap maintenance 591 Scope 1
Voluntary
Energy efficiency: Building services
Vysgorod - Installation of Air knife for Natural Gas reduction
539 Scope 1
Voluntary
Energy efficiency: Processes
Managua - Energetic Audit 536 Scope 1
Voluntary
Energy efficiency: Building services
Hamilton - Boiler tuning 511 Scope 1
Voluntary
Energy efficiency: Building services
Upplands Vasby - Converted heavy fuel oil burners to use waste vegetable oil
500 Scope 1
Voluntary
Energy efficiency:
Manama - Ammonia Compressor Runtime Optimization
472 Scope 1
Voluntary
Activity type
Description of activity
Estimated annual CO2e
savings (metric tonnes CO2e)
Scope
Voluntary/ Mandatory
Annual monetary savings
(unit currency
- as specified in CC0.4)
Investment required
(unit currency -
as specified in CC0.4)
Payback period
Estimated lifetime of
the initiative
Comment
Processes
Energy efficiency: Building services
Puebla - High Efficiency Motors Replacement wave 1
399 Scope 1
Voluntary
Energy efficiency: Building fabric
Atlanta - Insulation upgrades 394 Scope 1
Voluntary
Energy efficiency: Building fabric
Chicago - Building heat management
394 Scope 1
Voluntary
Energy efficiency: Building services
Puebla - LED's and Natural lightning 393
Scope 2 (market-based)
Voluntary
Waste recovery
Bauru - WWTP Aeration System 310 Scope 1
Voluntary
Energy efficiency: Building services
Chicago - Oven linkage rebuild 282 Scope 1
Voluntary
Energy efficiency: Building services
Rockford - Steam trap repair & replacement
282 Scope 1
Voluntary
Energy efficiency: Building
Vysgorod - Building insulation -Main office building
277 Scope 1
Voluntary

Activity type
Description of activity
Estimated annual CO2e
savings (metric tonnes CO2e)
Scope
Voluntary/ Mandatory
Annual monetary savings
(unit currency
- as specified in CC0.4)
Investment required
(unit currency -
as specified in CC0.4)
Payback period
Estimated lifetime of
the initiative
Comment
fabric
Energy efficiency: Building services
Hamilton - Insulation upgrades 273 Scope 1
Voluntary
Energy efficiency: Building fabric
Valencia - Install a new high voltage capacitors bank, Ground system replacement and transformer relocation at Cheese and Viscous building
253 Scope 1
Voluntary
Energy efficiency: Building services
Gladstone - Boiler Condensate Return
236 Scope 1
Voluntary
Energy efficiency: Building services
Hamilton - Oven Door Sealing Improvement
234 Scope 1
Voluntary
Energy efficiency: Building fabric
Vysgorod - Thermal insulation of Blancer on Line 7004
229 Scope 1
Voluntary
Energy efficiency: Building services
Portland - Steam Trap Repairs 225 Scope 1
Voluntary
Energy efficiency: Building services
Chicago - Steam coil repair 185 Scope 1
Voluntary
Activity type
Description of activity
Estimated annual CO2e
savings (metric tonnes CO2e)
Scope
Voluntary/ Mandatory
Annual monetary savings
(unit currency
- as specified in CC0.4)
Investment required
(unit currency -
as specified in CC0.4)
Payback period
Estimated lifetime of
the initiative
Comment
Energy efficiency: Building services
Swaziland - Boiler automation #1 project on coal infeed
164 Scope 1
Voluntary
Energy efficiency: Building services
Hamilton - HCP Thermal Blanket Insulation Ph 2
159 Scope 1
Voluntary
Energy efficiency: Building services
Chudovo - Auto Pressure control for glycol network
125 Scope 1
Voluntary
Energy efficiency: Building services
Fair Lawn - Steam trap & steam system repairs
113 Scope 1
Voluntary
Energy efficiency: Building fabric
Ecatepec - VFD´s Installation for vacuum pumps & water well pump
112 Scope 1
Voluntary
Energy efficiency: Building services
Hamilton - Repair Deaerator Tank 108 Scope 1
Voluntary
Energy efficiency: Building services
Richmond - Replace oven 3 burners
107 Scope 1
Voluntary
Energy efficiency:
Hamilton - M7 Oven Door Upgrade 101 Scope 1
Voluntary

Activity type
Description of activity
Estimated annual CO2e
savings (metric tonnes CO2e)
Scope
Voluntary/ Mandatory
Annual monetary savings
(unit currency
- as specified in CC0.4)
Investment required
(unit currency -
as specified in CC0.4)
Payback period
Estimated lifetime of
the initiative
Comment
Building services
Energy efficiency: Building services
Naperville - Steam Trap Repairs 96 Scope 1
Voluntary
Energy efficiency: Building services
VSA - Utilities Automation 89 Scope 1
Voluntary
Energy efficiency: Building services
East York - Boiler Condensate Return
84 Scope 1
Voluntary
Energy efficiency: Building services
Naperville - Boiler Condensate Return
81 Scope 1
Voluntary
Energy efficiency: Building services
Atlanta - Boiler Optimization 75 Scope 1
Voluntary
Energy efficiency: Building services
Bauru - Bauru Utilities quick wins 74 Scope 1
Voluntary
Energy efficiency: Building services
Fair Lawn - Oven #3 optimization 68 Scope 1
Voluntary

Activity type
Description of activity
Estimated annual CO2e
savings (metric tonnes CO2e)
Scope
Voluntary/ Mandatory
Annual monetary savings
(unit currency
- as specified in CC0.4)
Investment required
(unit currency -
as specified in CC0.4)
Payback period
Estimated lifetime of
the initiative
Comment
Energy efficiency: Building services
VSA - Lighting automation 62
Scope 2 (market-based)
Voluntary
Energy efficiency: Building services
Richmond - Boiler Condensate Return
62 Scope 1
Voluntary
Energy efficiency: Building services
Richmond - Boiler Controls Upgrade
56 Scope 1
Voluntary
Energy efficiency: Building services
Bauru - Lighting Phase I (Ware Housing, Office, Pilot Line IL6s)
53
Scope 2 (market-based)
Voluntary
Energy efficiency: Building services
Other voluntary Energy efficiency building service projects < 50 metric tonne CO2e each, Scope 1
310 Scope 1
Voluntary
Energy efficiency: Building services
Other voluntary Energy efficiency building service projects < 50 metric tonne CO2e each, Scope 2
2
Scope 2 (market-based)
Voluntary
CC3.3c

What methods do you use to drive investment in emissions reduction activities?
Method
Comment
Compliance with regulatory requirements/standards
At production facility level. Examples: EU Emission Trading Scheme (see relevant section of CDP); European IPPC legislation; UK Climate legislation
Employee engagement Some examples: Earth Week initiatives, environmental volunteering initiatives, Green Teams, carpool networks, incentives for biking and running to work, parking spots dedicated for hybrid vehicles. Our annual Health Safety Environmental Month employee engagement program at all of our manufacturing sites worldwide includes energy/CO2 awareness activities.
CC3.3d
If you do not have any emissions reduction initiatives, please explain why not
Further Information
3.3a Under investigation: Energy Management System implementation (metering and monitoring and hence reduction of energy use in top 60 factories in terms of CO2 emissions as of 2015)
Page: CC4. Communication
CC4.1
Have you published information about your organization’s response to climate change and GHG emissions performance for this reporting year in places other than in your CDP response? If so, please attach the publication(s)
Publication
Status
Page/Section reference
Attach the document
Comment

Publication
Status
Page/Section reference
Attach the document
Comment
In mainstream reports (including an integrated report) but have not used the CDSB Framework
Complete Annual report 10k filing, page 10-18, risk factors
https://www.cdp.net/sites/2016/37/42037/Climate Change 2016/Shared Documents/Attachments/CC4.1/10K_2015.pdf
In voluntary communications Complete
2015 Call for Well Being Progress Report (pages 6, 8-9, 20, 26-27, 31-32) and infographic
https://www.cdp.net/sites/2016/37/42037/Climate Change 2016/Shared Documents/Attachments/CC4.1/CFWB 2015 Progress Report_HIGH RES_FINAL.pdf
In voluntary communications Complete Cocoa Life Progress Report (pages 3, 33-36, 62)
https://www.cdp.net/sites/2016/37/42037/Climate Change 2016/Shared Documents/Attachments/CC4.1/Cocoa Life Progress Report.pdf
In voluntary communications Complete Palm oil: action plan https://www.cdp.net/sites/2016/37/42037/Climate Change 2016/Shared Documents/Attachments/CC4.1/palm oil action plan_FINAL_20140603.pdf
In voluntary communications Complete
Pages 3-4 of the easy-to-find corporate fact sheet (in About Us section of company site)
https://www.cdp.net/sites/2016/37/42037/Climate Change 2016/Shared Documents/Attachments/CC4.1/Corporate fact sheet 2016.pdf
In voluntary communications Complete 2020 sustainability goals announcement (press release and infographic)
https://www.cdp.net/sites/2016/37/42037/Climate Change 2016/Shared Documents/Attachments/CC4.1/2020 GLOBAL SUSTAINABILITY GOALS_External.pdf
Further Information
Module: Risks and Opportunities
Page: CC5. Climate Change Risks
CC5.1
Have you identified any inherent climate change risks that have the potential to generate a substantive change in your business operations, revenue or expenditure? Tick all that apply

Risks driven by changes in regulation Risks driven by changes in physical climate parameters Risks driven by changes in other climate-related developments
CC5.1a
Please describe your inherent risks that are driven by changes in regulation
Risk driver
Description
Potential impact
Timeframe
Direct/ Indirect
Likelihood
Magnitude of impact
Estimated financial
implications
Management method
Cost of
management
Other regulatory drivers
The main risks for Mondelēz International and other food companies are the following: cost of complying with regulatory targets.
Increased operational cost
Unknown Direct Unknown Unknown
Mondelēz International’s sustainability strategy and our targets to reduce energy consumption and CO2 emission in our operations constitute a concrete approach to mitigating these risks by anticipating regulatory requirements.
Fuel/energy taxes and regulations
Increased cost to generate and purchase energy.
Increased operational cost
Unknown Direct Unknown Unknown
Mondelēz International’s sustainability strategy and our targets to reduce energy consumption and CO2 emission in our operations constitute a concrete approach to mitigating these risks by anticipating regulatory requirements.
Renewable energy regulation
Increased raw material cost due, among others, to
Increased operational cost
Unknown Indirect (Client)
Unknown Unknown
Mondelēz International’s sustainability strategy and our targets to reduce

Risk driver
Description
Potential impact
Timeframe
Direct/ Indirect
Likelihood
Magnitude of impact
Estimated financial
implications
Management method
Cost of
management
the distortive effects of biofuel incentives.
energy consumption and CO2 emission in our operations constitute a concrete approach to mitigating these risks by anticipating regulatory requirements.
CC5.1b
Please describe your inherent risks that are driven by changes in physical climate parameters
Risk driver
Description
Potential impact
Timeframe
Direct/ Indirect
Likelihood
Magnitude of impact
Estimated financial
implications
Management
method
Cost of
management
Other physical climate drivers
In our 2015 10K Annual Report risk factors, we report “that severe weather, the potential longer-term consequences of climate change on agricultural productivity … and changes in governmental trade, alternative
Increased operational cost
>6 years Indirect (Supply chain)
Unknown Unknown
“We use hedging techniques to limit the impact of fluctuations in the cost of our principal raw materials. However, we cannot fully hedge against changes in commodity costs, and our
Transforming our agricultural supply chains is an essential foundation for a sustainable future. We’ve launched innovative, industry-leading holistic programs in key commodities like cocoa and
$400 million committed over 10 years to agricultural signature program, Cocoa Life.
Risk driver
Description
Potential impact
Timeframe
Direct/ Indirect
Likelihood
Magnitude of impact
Estimated financial
implications
Management
method
Cost of
management
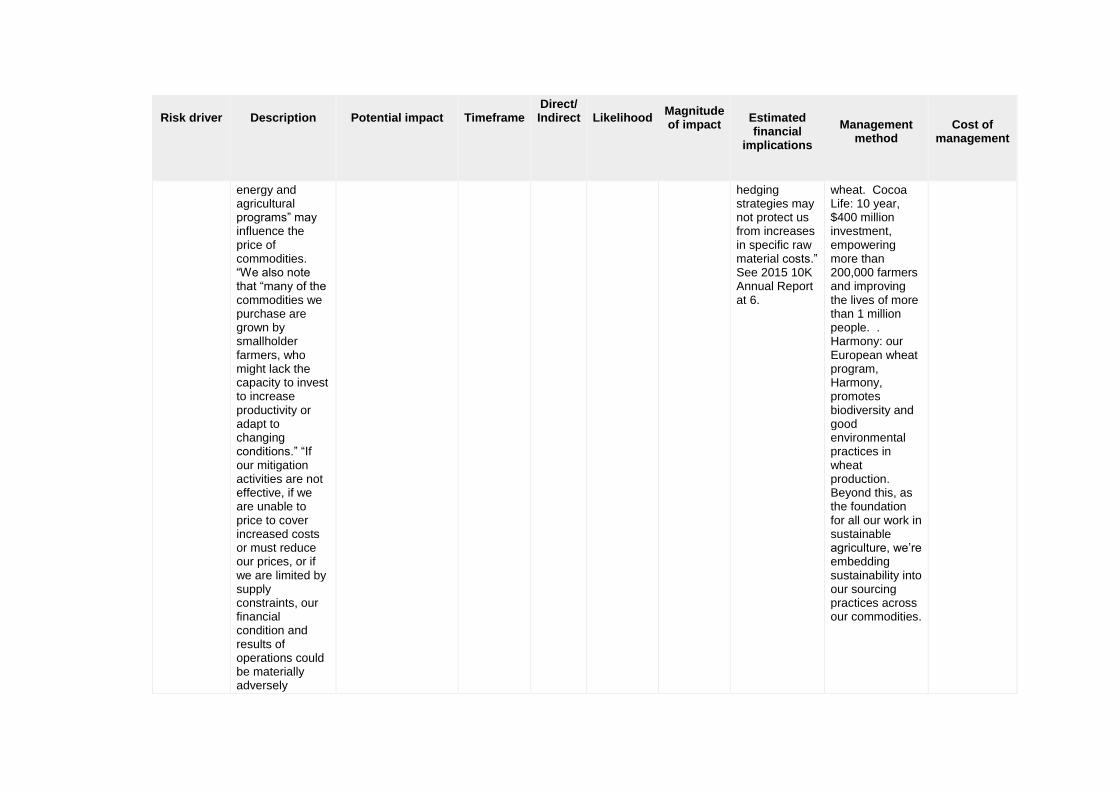
energy and agricultural programs” may influence the price of commodities. “We also note that “many of the commodities we purchase are grown by smallholder farmers, who might lack the capacity to invest to increase productivity or adapt to changing conditions.” “If our mitigation activities are not effective, if we are unable to price to cover increased costs or must reduce our prices, or if we are limited by supply constraints, our financial condition and results of operations could be materially adversely
hedging strategies may not protect us from increases in specific raw material costs.” See 2015 10K Annual Report at 6.
wheat. Cocoa Life: 10 year, $400 million investment, empowering more than 200,000 farmers and improving the lives of more than 1 million people. . Harmony: our European wheat program, Harmony, promotes biodiversity and good environmental practices in wheat production. Beyond this, as the foundation for all our work in sustainable agriculture, we’re embedding sustainability into our sourcing practices across our commodities.

Risk driver
Description
Potential impact
Timeframe
Direct/ Indirect
Likelihood
Magnitude of impact
Estimated financial
implications
Management
method
Cost of
management
affected.” See 2015 10K Annual Report at 13.
Change in precipitation extremes and droughts
In addition, localized episodic extreme weather events such as floods and severe storms have the potential to temporarily disrupt Mondelēz International’s business operations (including raw material sourcing, manufacturing and product distribution) in affected areas.
Reduction/disruption in production capacity
Unknown
Unknown Unknown
Mondelēz International has in place several protocols, including special situations management and emergency preparedness and response procedures. These allow us to address and help mitigate adverse effects.
CC5.1c
Please describe your inherent risks that are driven by changes in other climate-related developments
Risk driver
Description
Potential impact
Timeframe
Direct/ Indirect
Likelihood
Magnitude of impact
Estimated financial
implications
Management method
Cost of
management
Risk driver
Description
Potential impact
Timeframe
Direct/ Indirect
Likelihood
Magnitude of impact
Estimated financial
implications
Management method
Cost of
management
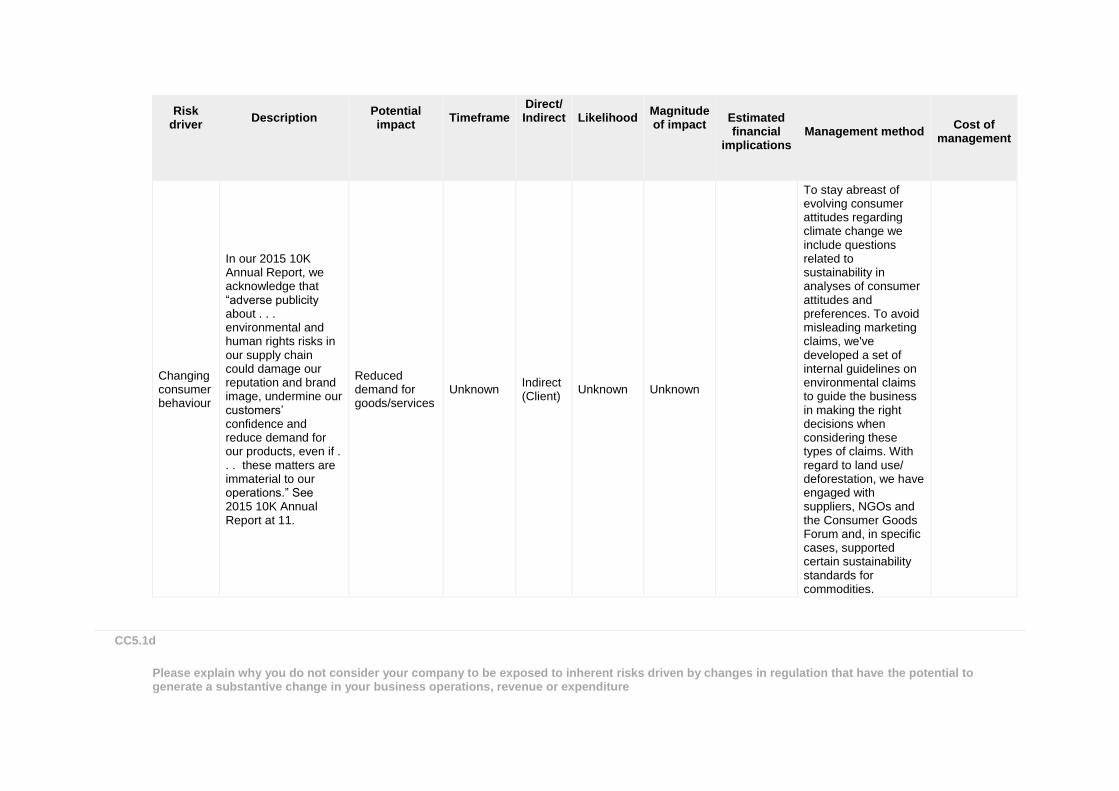
Changing consumer behaviour
In our 2015 10K Annual Report, we acknowledge that “adverse publicity about . . . environmental and human rights risks in our supply chain could damage our reputation and brand image, undermine our customers’ confidence and reduce demand for our products, even if . . . these matters are immaterial to our operations.” See 2015 10K Annual Report at 11.
Reduced demand for goods/services
Unknown Indirect (Client)
Unknown Unknown
To stay abreast of evolving consumer attitudes regarding climate change we include questions related to sustainability in analyses of consumer attitudes and preferences. To avoid misleading marketing claims, we've developed a set of internal guidelines on environmental claims to guide the business in making the right decisions when considering these types of claims. With regard to land use/ deforestation, we have engaged with suppliers, NGOs and the Consumer Goods Forum and, in specific cases, supported certain sustainability standards for commodities.
CC5.1d
Please explain why you do not consider your company to be exposed to inherent risks driven by changes in regulation that have the potential to generate a substantive change in your business operations, revenue or expenditure

CC5.1e
Please explain why you do not consider your company to be exposed to inherent risks driven by physical climate parameters that have the potential to generate a substantive change in your business operations, revenue or expenditure
CC5.1f
Please explain why you do not consider your company to be exposed to inherent risks driven by changes in other climate-related developments that have the potential to generate a substantive change in your business operations, revenue or expenditure
Further Information
Page: CC6. Climate Change Opportunities
CC6.1
Have you identified any inherent climate change opportunities that have the potential to generate a substantive change in your business operations, revenue or expenditure? Tick all that apply
CC6.1a

Please describe your inherent opportunities that are driven by changes in regulation
Opportunity driver
Description
Potential impact
Timeframe
Direct/Indirect
Likelihood
Magnitude of impact
Estimated financial
implications
Management
method
Cost of
management
CC6.1b
Please describe the inherent opportunities that are driven by changes in physical climate parameters
Opportunity driver
Description
Potential impact
Timeframe
Direct/ Indirect
Likelihood
Magnitude of impact
Estimated financial
implications
Management
method
Cost of
management
CC6.1c
Please describe the inherent opportunities that are driven by changes in other climate-related developments
Opportunity driver
Description
Potential impact
Timeframe
Direct/ Indirect
Likelihood
Magnitude of impact
Estimated financial
implications
Management
method
Cost of
management
CC6.1d
Please explain why you do not consider your company to be exposed to inherent opportunities driven by changes in regulation that have the potential to generate a substantive change in your business operations, revenue or expenditure
There may be opportunities linked to climate change regulation. However, based on our understanding of the CDP definition of “significance,” we conclude that opportunities cited in this question cannot be categorized as having the potential to generate substantive change in our business. Due to our ongoing efforts to reduce energy use and CO2e emissions and the ambitious targets we set, we may be in a better position to anticipate regulatory requirements, avoid cost and gain competitive advantage. Carbon offsets may provide financial incentives for farmers in our supply chain, while also mitigating climate change effects and providing marketing opportunities for our brands by communicating to conscious consumers about improved farming practices. Further tightening of emission caps and a clarification of international rules could make these opportunities more attractive from a cost/benefit perspective. Promotion of more efficient biofuels that do not use food crops may limit the impact that biofuels incentives may have on our agricultural supply chain. We work with some of our partners on activities aimed at preventing deforestation and mitigating related climate change effects. We announced our commitment to combat deforestation in cocoa at the UN Climate Summit COP21, where world leaders met in Paris to negotiate a new climate agreement. Mondelēz International committed to lead private sector action in Côte d’Ivoire’s national program to combat deforestation in cocoa. These actions will contribute to the national United Nations sponsored REDD+ program. We have voiced support for the World Bank’s BioCarbon Fund, which seeks to scale up land management practices across large landscapes to protect forests and secure green supply chains. As a member of the Consumer Goods Forum, we supported a call for governments to secure a binding global climate deal and implement UN REDD+. We shared our commitment at the UN Climate Summit in September 2014 to extend support for UNDP’s to support sustainable palm oil in Indonesia via a commodity platform approach. We also work with the Roundtable on Sustainable Palm Oil and support the NY Declaration on Forests.
CC6.1e
Please explain why you do not consider your company to be exposed to inherent opportunities driven by physical climate parameters that have the potential to generate a substantive change in your business operations, revenue or expenditure
We have opportunities to strengthen supplier relationships to seek common, non-competitive, solutions to face potential climate change challenges like weather, water and crop-specific uncertainties in yields and production locations.
CC6.1f
Please explain why you do not consider your company to be exposed to inherent opportunities driven by changes in other climate-related developments that have the potential to generate a substantive change in your business operations, revenue or expenditure
Climate change presents opportunities in the way we develop and market our products, especially in the EU and US. For example:

• We're working to bring more products to market that have sustainably grown ingredients.
Further Information
Module: GHG Emissions Accounting, Energy and Fuel Use, and Trading
Page: CC7. Emissions Methodology
CC7.1
Please provide your base year and base year emissions (Scopes 1 and 2)
Scope
Base year
Base year emissions (metric tonnes CO2e)
Scope 1 Fri 01 Jan 2010 - Fri 31 Dec 2010
766443
Scope 2 (location-based) Fri 01 Jan 2010 - Fri 31 Dec 2010
914986
Scope 2 (market-based) Fri 01 Jan 2010 - Fri 31 Dec 2010
914986
CC7.2
Please give the name of the standard, protocol or methodology you have used to collect activity data and calculate Scope 1 and Scope 2 emissions

Please select the published methodologies that you use
The Greenhouse Gas Protocol: A Corporate Accounting and Reporting Standard (Revised Edition)
US EPA Climate Leaders: Direct Emissions from Stationary Combustion
US EPA Climate Leaders: Indirect Emissions from Purchases/Sales of Electricity and Steam
US EPA Climate Leaders: Direct HFC and PFC Emissions from Use of Refrigeration and Air Conditioning Equipment
Other
CC7.2a
If you have selected "Other" in CC7.2 please provide details of the standard, protocol or methodology you have used to collect activity data and calculate Scope 1 and Scope 2 emissions
US EPA Climate Leaders: Direct Emissions from Mobile Combustion Sources US EPA Climate Leaders: Design Principles US EPA GHG Reporting Regulations: 40 CFR 98
CC7.3
Please give the source for the global warming potentials you have used
Gas
Reference
CO2 IPCC Fourth Assessment Report (AR4 - 100 year)
CH4 IPCC Fourth Assessment Report (AR4 - 100 year)
N2O IPCC Fourth Assessment Report (AR4 - 100 year)
HFCs IPCC Fourth Assessment Report (AR4 - 100 year)

CC7.4
Please give the emissions factors you have applied and their origin; alternatively, please attach an Excel spreadsheet with this data at the bottom of this page
Fuel/Material/Energy
Emission Factor
Unit
Reference
Further Information
7.4: Emission factors are obtained from recognized sources, i.e. International Energy Agency, US EPA, Ecoinvent database, Economic Input-Output Life Cycle Assessment (EIO-LCA) model and Intergovernmental Panel on Climate Change. For electricity, country and site-specific CO2 emission factors are used.
Page: CC8. Emissions Data - (1 Jan 2015 - 31 Dec 2015)
CC8.1
Please select the boundary you are using for your Scope 1 and 2 greenhouse gas inventory
Operational control
CC8.2
Please provide your gross global Scope 1 emissions figures in metric tonnes CO2e
757010

CC8.3
Does your company have any operations in markets providing product or supplier specific data in the form of contractual instruments?
Yes
CC8.3a
Please provide your gross global Scope 2 emissions figures in metric tonnes CO2e
Scope 2, location-
based
Scope 2, market-based (if
applicable)
Comment
933641 772308 We supply both location-based and market-based Scope 2 results to both enable comparability with past years (location-based) as well as reflect the purchase of qualified low carbon contracts for electricity (market-based).
CC8.4
Are there are any sources (e.g. facilities, specific GHGs, activities, geographies, etc.) of Scope 1 and Scope 2 emissions that are within your selected reporting boundary which are not included in your disclosure?
Yes
CC8.4a
Please provide details of the sources of Scope 1 and Scope 2 emissions that are within your selected reporting boundary which are not included in your disclosure

Source
Relevance of
Scope 1 emissions from
this source
Relevance of
location-based Scope 2
emissions from this source
Relevance of market-based
Scope 2 emissions from this source (if
applicable)
Explain why the source is excluded
Non-manufacturing buildings (e.g., offices)
Emissions are relevant but not yet calculated
Emissions are relevant but not yet calculated
Some non-manufacturing buildings in Latin America (LA) and Asia Pacific (AP) regions are operationally controlled but not included in this questionnaire. GHG emissions are insignificant compared to product warehouses in North America (NA), European Union (EU) and Eastern Europe, Middle East & Africa (EEMEA) regions.
Leased product warehouses in LA and AP
Emissions are relevant but not yet calculated
Emissions are relevant but not yet calculated
Some leased product warehouses in LA and AP regions are operationally controlled but not included in this questionnaire. GHG emissions are insignificant, compared to product warehouses in NA, EU and EEMEA regions.
Leased sales Emissions are relevant but not yet calculated
Emissions are not relevant
Some sales cars in LA and Asia Pacific (AP) regions are operationally controlled but not included in this questionnaire. GHG emissions are insignificant, compared to product warehouses in NA, EU and EEMEA regions.
CC8.5
Please estimate the level of uncertainty of the total gross global Scope 1 and 2 emissions figures that you have supplied and specify the sources of uncertainty in your data gathering, handling and calculations
Scope
Uncertainty range
Main sources of
uncertainty
Please expand on the uncertainty in your data
Scope 1 More than 5% but less than or equal to 10%
Data Gaps Assumptions
1) Data variability associated with reported manufacturing data from those plants which have not yet fully implemented direct metering or sub-metering; (2) Few data gaps in warehouse energy data and sales vehicles operating in AP and LA regions.

Scope
Uncertainty range
Main sources of
uncertainty
Please expand on the uncertainty in your data
Scope 2 (location-based)
More than 5% but less than or equal to 10%
Data Gaps Assumptions
(1) Data variability associated with reported manufacturing data from those plants which have not yet fully implemented direct metering or sub-metering; (2) Few data gaps in warehouse and office energy data in non-NA and MEU regions.
Scope 2 (market-based)
More than 5% but less than or equal to 10%
Data Gaps Assumptions
(1) Data variability associated with reported manufacturing data from those plants which have not yet fully implemented direct metering or sub-metering; (2) Few data gaps in warehouse and office energy data in non-NA and MEU regions.
CC8.6
Please indicate the verification/assurance status that applies to your reported Scope 1 emissions
Third party verification or assurance process in place
CC8.6a
Please provide further details of the verification/assurance undertaken for your Scope 1 emissions, and attach the relevant statements
Verification
or assurance cycle in place
Status in
the current reporting
year
Type of verification
or assurance
Attach the statement
Page/section
reference
Relevant standard
Proportion of reported
Scope 1 emissions verified (%)
Annual process
Complete Reasonable assurance
https://www.cdp.net/sites/2016/37/42037/Climate Change 2016/Shared Documents/Attachments/CC8.6a/GHG Verification
All ISO14064-3
100

Verification
or assurance cycle in place
Status in
the current reporting
year
Type of verification
or assurance
Attach the statement
Page/section
reference
Relevant standard
Proportion of reported
Scope 1 emissions verified (%)
Statement 2015_Issued.pdf
CC8.6b
Please provide further details of the regulatory regime to which you are complying that specifies the use of Continuous Emissions Monitoring Systems (CEMS)
Regulation
% of emissions covered by the system
Compliance period
Evidence of submission
CC8.7
Please indicate the verification/assurance status that applies to at least one of your reported Scope 2 emissions figures
Third party verification or assurance process in place
CC8.7a
Please provide further details of the verification/assurance undertaken for your location-based and/or market-based Scope 2 emissions, and attach the relevant statements

Location-based or market-based figure?
Verification
or assurance
cycle in place
Status in
the current
reporting year
Type of verification
or assurance
Attach the statement
Page/Section reference
Relevant standard
Proportion
of reported Scope 2
emissions verified
(%)
Location-based
Annual process
Complete Reasonable assurance
https://www.cdp.net/sites/2016/37/42037/Climate Change 2016/Shared Documents/Attachments/CC8.7a/GHG Verification Statement 2015_Issued.pdf
All ISO14064-3
100
Market-based
Annual process
Complete Reasonable assurance
https://www.cdp.net/sites/2016/37/42037/Climate Change 2016/Shared Documents/Attachments/CC8.7a/GHG Verification Statement 2015_Issued.pdf
All ISO14064-3
100
CC8.8
Please identify if any data points have been verified as part of the third party verification work undertaken, other than the verification of emissions figures reported in CC8.6, CC8.7 and CC14.2
Additional data points verified
Comment
Year on year change in emissions (Scope 1)
Year on year change in emissions (Scope 2)
Year on year change in emissions (Scope 1 and 2)
Year on year change in emissions (Scope 3)
Year on year emissions intensity figure
CC8.9
Are carbon dioxide emissions from biologically sequestered carbon relevant to your organization?
Yes

CC8.9a
Please provide the emissions from biologically sequestered carbon relevant to your organization in metric tonnes CO2
101190
Further Information
We put more effort into biogenic accounting this year, which is the main reason why this number is quite different from previous years. An example of our renewable energy use that involves biologically sequestered carbon is at our Sucat, Philippines facility. At this facility, we’re burning rice husks and coconut shells as a renewable energy source as part of our Go Green program. Our factory in Upplands Väsby, Sweden converted heavy fuel oil burners to use waste vegetable oil instead; this switch to a lower carbon fuel significantly reduced annual CO2 emissions by16 percent in the last year.
Page: CC9. Scope 1 Emissions Breakdown - (1 Jan 2015 - 31 Dec 2015)
CC9.1
Do you have Scope 1 emissions sources in more than one country?
Yes
CC9.1a
Please break down your total gross global Scope 1 emissions by country/region

Country/Region
Scope 1 metric tonnes CO2e
North America 201759
Western Europe 273359
Latin America (LATAM) 92425
Asia Pacific (or JAPA) 94121
Eastern Europe, Middle East, and Africa (EEMEA) 95345
CC9.2
Please indicate which other Scope 1 emissions breakdowns you are able to provide (tick all that apply)
By activity
CC9.2a
Please break down your total gross global Scope 1 emissions by business division
Business division
Scope 1 emissions (metric tonnes CO2e)
CC9.2b
Please break down your total gross global Scope 1 emissions by facility

Facility
Scope 1 emissions (metric tonnes CO2e)
Latitude
Longitude
CC9.2c
Please break down your total gross global Scope 1 emissions by GHG type
GHG type
Scope 1 emissions (metric tonnes CO2e)
CC9.2d
Please break down your total gross global Scope 1 emissions by activity
Activity
Scope 1 emissions (metric tonnes CO2e)
Manufacturing 669331
Private Fleet 2658
DC - Mixing Centers 3048
DSD/Branch/Warehouses 43042
HQ/Technology-R&D Centers 3490
Executive Transportation 1660
Sales Fleet 33780

Further Information
Page: CC10. Scope 2 Emissions Breakdown - (1 Jan 2015 - 31 Dec 2015)
CC10.1
Do you have Scope 2 emissions sources in more than one country?
Yes
CC10.1a
Please break down your total gross global Scope 2 emissions and energy consumption by country/region
Country/Region
Scope 2, location-based
(metric tonnes CO2e)
Scope 2, market-based (metric tonnes CO2e)
Purchased and consumed
electricity, heat, steam or cooling
(MWh)
Purchased and consumed low carbon electricity, heat, steam
or cooling accounted in market-based approach
(MWh)
North America 253638 253232 528480
Western Europe 273209 112283 942664 505931
Latin America (LATAM) 69785 69785 296213
Asia Pacific (or JAPA) 207158 207158 352067
Eastern Europe, Middle East, and Africa (EEMEA)
129851 129851 263899
CC10.2
Please indicate which other Scope 2 emissions breakdowns you are able to provide (tick all that apply)

By activity
CC10.2a
Please break down your total gross global Scope 2 emissions by business division
Business division
Scope 2 emissions, location based (metric tonnes CO2e)
Scope 2 emissions, market-based
(metric tonnes CO2e)
CC10.2b
Please break down your total gross global Scope 2 emissions by facility
Facility
Scope 2 emissions, location based (metric tonnes CO2e)
Scope 2 emissions, market-based
(metric tonnes CO2e)
CC10.2c
Please break down your total gross global Scope 2 emissions by activity

Activity
Scope 2 emissions, location based (metric tonnes CO2e)
Scope 2 emissions, market-based
(metric tonnes CO2e)
Manufacturing 903824 740336
HQ/Technology/R&D centers 3669 3669
DC Mixing Centers 14226 16381
DSD/Branch/Warehouses 11922 11922
Further Information
Page: CC11. Energy
CC11.1
What percentage of your total operational spend in the reporting year was on energy?
More than 0% but less than or equal to 5%
CC11.2
Please state how much heat, steam, and cooling in MWh your organization has purchased and consumed during the reporting year
Energy type
Energy purchased and consumed (MWh)
Heat 10633
Steam 67503
Cooling 0

CC11.3
Please state how much fuel in MWh your organization has consumed (for energy purposes) during the reporting year
3651354
CC11.3a
Please complete the table by breaking down the total "Fuel" figure entered above by fuel type
Fuels
MWh
Natural gas 3198367
Propane 6650
Butane 31287
Other: Light fuel oil 65747
Other: Heavy fuel oil 39266
Anthracite 37722
Other: Bagasse 32291
Wood or wood waste 17597
Biogas 1477
Biodiesels 0
Other: Other biomass/biofuel 444
Motor gasoline 134701
Diesel/Gas oil 9847
Liquefied petroleum gas (LPG) 75959
CC11.4

Please provide details of the electricity, heat, steam or cooling amounts that were accounted at a low carbon emission factor in the market-based Scope 2 figure reported in CC8.3a
Basis for applying a low carbon emission factor
MWh consumed associated with low carbon electricity, heat, steam or cooling
Comment
Energy attribute certificates, Guarantees of Origin
124306.5 United Kingdom
Energy attribute certificates, Guarantees of Origin
74249.4 Poland
Energy attribute certificates, Guarantees of Origin
53150.9 Germany
Energy attribute certificates, Guarantees of Origin
35195.1 France
Energy attribute certificates, Guarantees of Origin
34810.4 Sweden
Energy attribute certificates, Guarantees of Origin
24403.7 Spain
Energy attribute certificates, Guarantees of Origin
22990.1 Austria
Energy attribute certificates, Guarantees of Origin
16596.3 Slovak Republic
Energy attribute certificates, Guarantees of Origin
16049.0 Switzerland
Energy attribute certificates, Guarantees of Origin
15309.5 Norway
Energy attribute certificates, Guarantees of Origin
12501.1 Bulgaria
Energy attribute certificates, Guarantees of Origin
9733.5 Lithuania
Energy attribute certificates, Guarantees of Origin
5599.8 Greece
Energy attribute certificates, Guarantees of Origin
1462.9 Hungary
Energy attribute certificates, Guarantees of Origin
59572.6 Belgium
CC11.5

Please report how much electricity you produce in MWh, and how much electricity you consume in MWh
Total electricity consumed
(MWh)
Consumed
electricity that is purchased (MWh)
Total electricity produced
(MWh)
Total renewable
electricity produced (MWh)
Consumed renewable
electricity that is produced by company (MWh)
Comment
2008205 2008205
Further Information
Page: CC12. Emissions Performance
CC12.1
How do your gross global emissions (Scope 1 and 2 combined) for the reporting year compare to the previous year?
Decreased
CC12.1a
Please identify the reasons for any change in your gross global emissions (Scope 1 and 2 combined) and for each of them specify how your emissions compare to the previous year
Reason
Emissions value (percentage)
Direction of change
Please explain and include calculation
Emissions reduction activities
Decrease Energy saving projects, cleaner fuel use onsite, and purchase of renewable electricity certificates.
Divestment
Decrease Divestiture of our coffee business in 2015. Historical data from coffee sites removed from our

Reason
Emissions value (percentage)
Direction of change
Please explain and include calculation
database and 2010 base year emissions recalculated.
Acquisitions
Increase Acquisition of a Vietnamese biscuit and cake business in 2015. Historical data added to our database and 2010 base year emissions recalculated.
Mergers
Not applicable
Change in output
Change in methodology
Decrease We put more effort into biogenic accounting this year.
Change in boundary
Decrease Acquisitions and divestments.
Change in physical operating conditions
Not applicable
Unidentified
Not applicable
Other 31 Decrease Sales fleet emissions comprised 2% of 2015 Scope 1 & 2 emissions. Manufacturing Scope 1 emissions decreased in 2015 relative to 2014. These emissions comprised 44% of 2015 Scope 1 & 2 emissions.
CC12.1b
Is your emissions performance calculations in CC12.1 and CC12.1a based on a location-based Scope 2 emissions figure or a market-based Scope 2 emissions figure?
Market-based
CC12.2
Please describe your gross global combined Scope 1 and 2 emissions for the reporting year in metric tonnes CO2e per unit currency total revenue

Intensity figure =
Metric numerator (Gross global combined
Scope 1 and 2 emissions)
Metric denominator:
Unit total revenue
Scope 2 figure used
% change from
previous year
Direction of change
from previous
year
Reason for change
0.0000546 metric tonnes CO2e 28000000000 Market-based
6.7 Increase
Mondelez generated 30400 Million USD net revenue with 1,556,575 MT CO2e emissions in 2014 and 28000 Million USD net revenue with 1,529,318 MT CO2e emissions in 2015. Our intensity figure increased by 6.7% from 51.2 MT CO2e/ million USD in 2014 to 54.6 MT CO2e/ million USD in 2015.
CC12.3
Please provide any additional intensity (normalized) metrics that are appropriate to your business operations
Intensity figure =
Metric numerator (Gross global combined
Scope 1 and 2 emissions)
Metric denominator
Metric
denominator: Unit total
Scope
2 figure used
% change
from previous
year
Direction of change
from previous
year
Reason for change
15.4 metric tonnes CO2e
full time equivalent (FTE) employee
99000 Market-based
1.8 Decrease
Mondelēz employed approximately 99,000 people worldwide as of December 31, 2014 and approximately 99,000 as of December 31, 2015. Our employee headcount did not decrease and our emissions decreased 1.7%; as a result, our intensity figure decreased 1.8% from 15.7 in 2014 to 15.4 in 2015.
0.285 metric tonnes CO2e metric tonne of product
5357414 Market-based
3.0 Decrease
Mondelez generated 5289115 MT of products with 1,556,575 MT CO2e emissions in 2014 and 5357414 MT of products with 1,529,318MT CO2e emissions in 2015, which is equivalent to 0.294 MT CO2/MT of products in 2014 and 0.285 MT CO2e/ MT of products

Intensity figure =
Metric numerator (Gross global combined
Scope 1 and 2 emissions)
Metric denominator
Metric
denominator: Unit total
Scope
2 figure used
% change
from previous
year
Direction of change
from previous
year
Reason for change
in 2015. The scope 1&2 emission intensity decrease of 3.0% is due to improved fuel use efficiency and purchase of low-carbon energy.
Further Information
Page: CC13. Emissions Trading
CC13.1
Do you participate in any emissions trading schemes?
Yes
CC13.1a
Please complete the following table for each of the emission trading schemes in which you participate
Scheme name
Period for which data is supplied
Allowances allocated
Allowances purchased
Verified emissions in metric tonnes
CO2e
Details of ownership
European Union ETS
Thu 01 Jan 2015 - Thu 31 Dec 2015
59312 0 122532 Facilities we own and operate
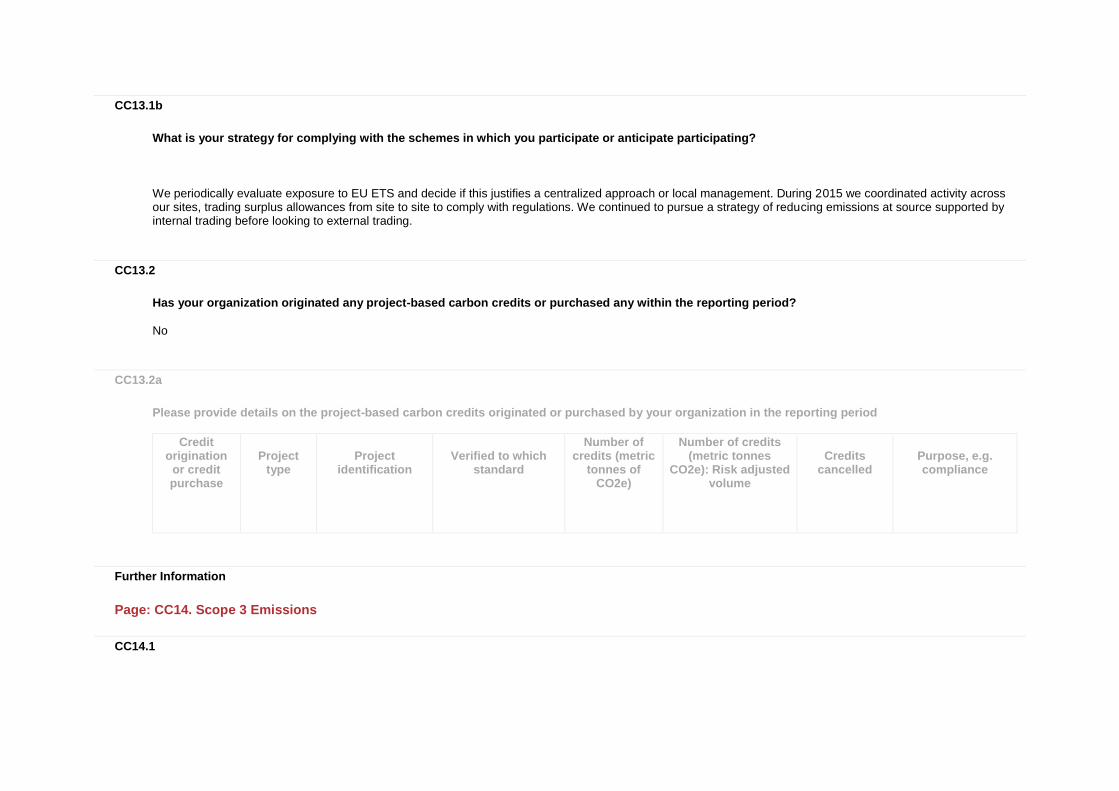
CC13.1b
What is your strategy for complying with the schemes in which you participate or anticipate participating?
We periodically evaluate exposure to EU ETS and decide if this justifies a centralized approach or local management. During 2015 we coordinated activity across our sites, trading surplus allowances from site to site to comply with regulations. We continued to pursue a strategy of reducing emissions at source supported by internal trading before looking to external trading.
CC13.2
Has your organization originated any project-based carbon credits or purchased any within the reporting period?
No
CC13.2a
Please provide details on the project-based carbon credits originated or purchased by your organization in the reporting period
Credit origination
or credit purchase
Project type
Project identification
Verified to which standard
Number of credits (metric
tonnes of CO2e)
Number of credits (metric tonnes
CO2e): Risk adjusted volume
Credits cancelled
Purpose, e.g. compliance
Further Information
Page: CC14. Scope 3 Emissions
CC14.1

Please account for your organization’s Scope 3 emissions, disclosing and explaining any exclusions
Sources of Scope 3 emissions
Evaluation status
metric tonnes CO2e
Emissions calculation methodology
Percentage of
emissions calculated using data obtained
from suppliers or value chain
partners
Explanation
Purchased goods and services
Relevant, calculated
11056117
EMISSIONS ACCURACY +/- 40% Used LCI data which also covers category ‘Purchased Goods and Services – Cradle-to-Grave Emissions’ In Mondelēz International’ supply chain, agricultural raw materials are the main source of CO2 scope 3 emissions, with packaging production contributing an important, but clearly secondary, source of emissions. The most prominent commodities for Mondelēz International are: Dairy, Sugar, Grains, Vegetable Oils, Nuts, and Cocoa. Since 2011 we have been improving the accuracy of our Scope 3 emissions for many key commodities by regionalizing emission factors and gathering more precise geo-sourcing data to improve the fit for LCI datasets. The supply chain was characterized based on the total mass of purchases of nearly 100 food input material categories and six packaging material categories. For each of these material categories, information on the life cycle GHG emissions was taken from a variety of sources, including the most prominent EcoInvent database, scientific literature and other available data. In cases where data for the exact commodity or category could not be found, the most suitable proxy available was selected to avoid large gaps. Emissions are determined as the mass purchased multiplied by these factors of GHG emissions per weight. For packaging materials, processing to produce a finished package has been assumed based on emissions information from the Ecoinvent database. In the case of agricultural commodities that require additional processing beyond the level of their representation in the database, insufficient information is available to represent such processes, except in the case that it takes place

Sources of Scope 3 emissions
Evaluation status
metric tonnes CO2e
Emissions calculation methodology
Percentage of
emissions calculated using data obtained
from suppliers or value chain
partners
Explanation
in a Mondelēz International facility. We engaged third-party experts in 2011 to review and help improve our methodology and quality of data.
Capital goods Not relevant, explanation provided
Capital goods are so far not associated with Mondelēz International’s business.
Fuel-and-energy-related activities (not included in Scope 1 or 2)
Relevant, calculated
352033
EMISSIONS ACCURACY +/- 30% Emissions from all direct uses of energy have been calculated based on amounts of electricity and fuel used throughout the company and applying cradle-to-gate emission factors from the Ecoinvent database, consistent with the methodology used throughout the Scope 3 calculations described here. From this result, the Scope 2 emissions, described above, were subtracted.
Upstream transportation and distribution
Relevant, calculated
1062374
EMISSIONS ACCURACY +/- 30% Data excludes warehouses. Mondelēz International uses third-party transportation companies (common carriers) to transport raw materials to manufacturing facilities. The primary GHG emission source from common carrier s is CO2 from diesel fuel combustion. Transportation CO2 emissions for production materials were estimated for the highest volume inputs based on a number of simplifying assumptions: average distance (e.g., source country to country of use), common modes of transport, average fuel efficiency, assumed shipment weights, etc. The calculation is based on the multiplication of life cycle emissions information for the relevant modes of transport (in units of emission per weight*distance) from the Ecoinvent database.
Waste generated in operations
Relevant, calculated
109729 EMISSIONS ACCURACY +/- 50% Landfill, incineration and recycling of operation waste, inbound packaging, etc.

Sources of Scope 3 emissions
Evaluation status
metric tonnes CO2e
Emissions calculation methodology
Percentage of
emissions calculated using data obtained
from suppliers or value chain
partners
Explanation
Business travel Relevant, calculated
122282 EMISSIONS ACCURACY +/- 20% Employee air, car and rail business travel emissions were estimated using spend data and EIO-LCA emission model
Employee commuting
Relevant, calculated
204317 EMISSIONS ACCURACY +/- 20% Passenger car, 30 miles per day, 235 days/ yr.
Upstream leased assets
Not relevant, explanation provided
Not relevant.
Downstream transportation and distribution
Relevant, calculated
1174506
EMISSIONS ACCURACY +/- 25% Data excludes warehouses. Mondelēz International uses third-party transportation companies (common carriers) to supplement its need to transport finished product from manufacturing facilities to distribution centers, warehouses and customers. The primary GHG emission source from common carriers is CO2 from diesel fuel combustion. The calculation is based on the multiplication of life cycle emissions information for the relevant modes of transport (in units of emission per weight*distance) from the Ecoinvent database.
Processing of sold products
Not relevant, explanation provided
Not relevant.
Use of sold products
Relevant, calculated
773746
EMISSIONS ACCURACY +/- 40% The emissions reported here reflect a rough prediction of the emissions from the use of products. The end-of-life of the food products themselves is not included. The emissions during the use of products include aspects of refrigeration, freezing, baking, boiling, toasting, microwaving, and stovetop preparation. For each of these categories, assumptions have been made of the proportion of total Mondelēz International products sold that are likely to undergo each use. For simplicity, it has currently been assumed that all use activities are fueled by electricity. Approximations are then made

Sources of Scope 3 emissions
Evaluation status
metric tonnes CO2e
Emissions calculation methodology
Percentage of
emissions calculated using data obtained
from suppliers or value chain
partners
Explanation
of the amount of electricity use required per kilogram of product. These approximations are made based on preliminary estimates of typical consumer behaviors and are generic among product categories. The total amount of electricity use is then estimated based on emissions factors taken from the Ecoinvent database for several countries or an adapted dataset from IEA electricity statistics.
End of life treatment of sold products
Relevant, calculated
499727
EMISSIONS ACCURACY +/- 40% The end-of-life of packaging is determined based on the amount of various categories of packaging material that have been purchased in the relevant time period (with the assumption that this is also representative of the amount of packaging disposed in the same period). The proportions of various fates (landfilling, recycling and incineration) of each material have been determined by information available for several countries, which has then been applied as an approximation of disposal routes within each of the five global sales regions. Emissions information is taken from the Ecoinvent database to determine the amount of GHG emissions occurring during the landfilling, recycling and incineration of any given material. Generally, an “avoided burden” approach is taken at the end-of-life routes that result in a beneficial co-product of disposal. For example, in the case of recycling a plastic, it is assumed that the production of virgin plastic is avoided, and for the combustion of a plastic, it is assumed that a given amount of heat and/or electricity has been recovered and therefore prevented the production of electricity or heat by other means.
Downstream leased assets
Not relevant, explanation provided
Downstream leased assets is so far not associated with Mondelēz
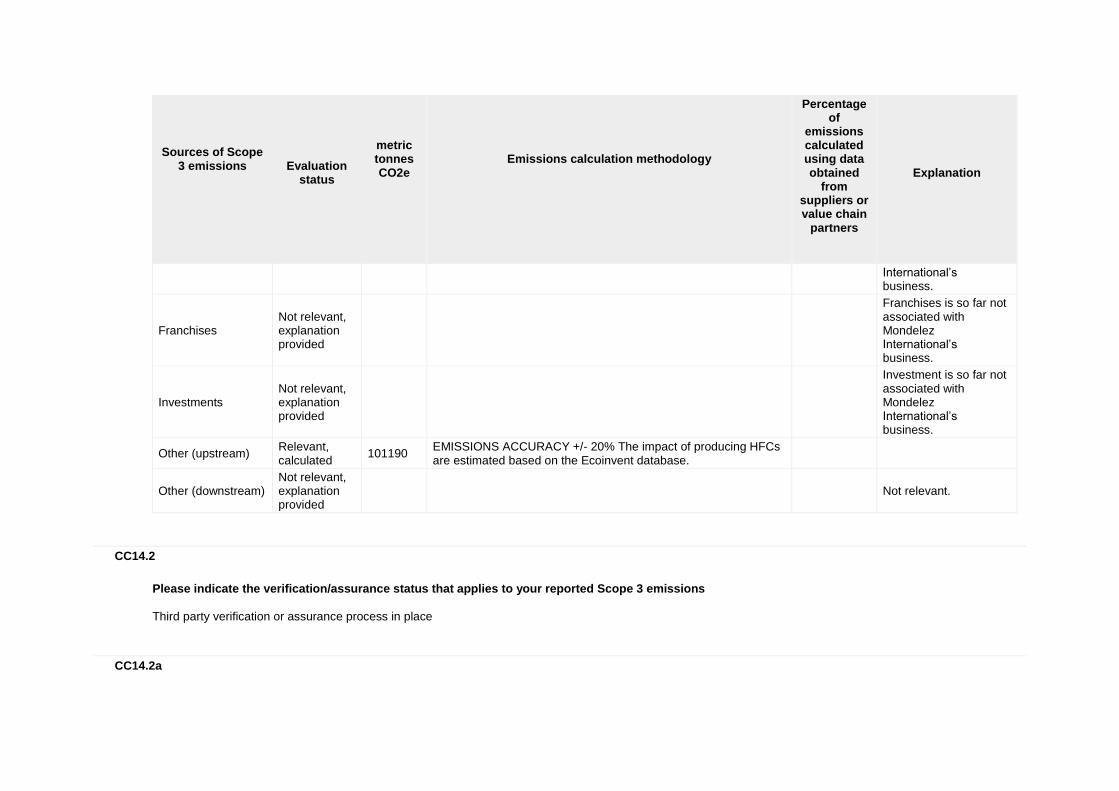
Sources of Scope 3 emissions
Evaluation status
metric tonnes CO2e
Emissions calculation methodology
Percentage of
emissions calculated using data obtained
from suppliers or value chain
partners
Explanation
International’s business.
Franchises Not relevant, explanation provided
Franchises is so far not associated with Mondelez International’s business.
Investments Not relevant, explanation provided
Investment is so far not associated with Mondelez International’s business.
Other (upstream) Relevant, calculated
101190 EMISSIONS ACCURACY +/- 20% The impact of producing HFCs are estimated based on the Ecoinvent database.
Other (downstream) Not relevant, explanation provided
Not relevant.
CC14.2
Please indicate the verification/assurance status that applies to your reported Scope 3 emissions
Third party verification or assurance process in place
CC14.2a

Please provide further details of the verification/assurance undertaken, and attach the relevant statements
Verification
or assurance cycle in place
Status in
the current reporting
year
Type of
verification or
assurance
Attach the statement
Page/Section
reference
Relevant standard
Proportion of
reported Scope 3 emissions verified (%)
Annual process
Complete Limited assurance
https://www.cdp.net/sites/2016/37/42037/Climate Change 2016/Shared Documents/Attachments/CC14.2a/GHG Verification Statement 2015_Issued.pdf
All ISO14064-3
100
CC14.3
Are you able to compare your Scope 3 emissions for the reporting year with those for the previous year for any sources?
Yes
CC14.3a
Please identify the reasons for any change in your Scope 3 emissions and for each of them specify how your emissions compare to the previous year
Sources of Scope 3 emissions
Reason for
change
Emissions value
(percentage)
Direction of
change
Comment
Fuel- and energy-related activities (not included in Scopes 1 or 2)
Change in boundary
71 Increase We have improved our accounting of non-manufacturing facility utility use relative to past years.

Sources of Scope 3 emissions
Reason for
change
Emissions value
(percentage)
Direction of
change
Comment
Upstream transportation & distribution Change in methodology
34 Decrease We refined the methodology to get more accurate information.
CC14.4
Do you engage with any of the elements of your value chain on GHG emissions and climate change strategies? (Tick all that apply)
Yes, our suppliers
CC14.4a
Please give details of methods of engagement, your strategy for prioritizing engagement and measures of success
We have undertaken a global footprinting assessment with Quantis International and reviewed by WWF. This review was initially conducted for Kraft Foods Global, Inc. in 2011. For more information, see www.mondelezinternational.com/mediacenter/country_press_releases/us/2011/multi_media_12142011.aspx. It was subsequently updated during 2012 to take account of our company split and helped to inform sustainability strategy for Mondelez International. This is an ongoing study – updated every year - that not only looks at climate change, but also water and land footprint. Across the three parameters, agriculture provides the main impact. This guides our focus on sustainable agriculture. Our sustainable agriculture programs all address environmental impacts in ways that can be expected to reduce greenhouse gas emissions over time. While we have worked on sustainable agriculture for some time beforehand, we have since added specific numeric goals for sustainable agriculture to our other sustainability goals. As part of the new 2015 goals: All cocoa will ultimately be sustainably sourced 75% of Western European biscuits volume made with Harmony wheat by 2015 Palm oil: 100% RSPO by 2015. In 2015, we were the largest buyer for Fairtrade cocoa. In November 2012, we announced Cocoa Life and our commitment to invest $400 million over 10 years to boost livelihoods and living conditions of more than 200,000 farmers and over 1 million people in cocoa farming communities. Key focus areas are farming, community, livelihoods, youth and the environment. We met our palm oil target in 2013. We continue to work on palm oil issues, including with our direct suppliers. Our palm oil action plan specifically targets

elimination of deforestation and new plantation developments on peat soil, as these are major drivers of emissions in the palm oil production sector. In 2015, we established new 2020 sustainability goals that placed us at the forefront of the fight against climate change and support our 2020 ambition to be the leader in well-being snacks while driving down costs and creating efficiencies to accelerate our growth. We adopted science-based targets to reduce absolute CO2 emissions from manufacturing as part of our ambitious end-to-end approach. This represents a transition from normalized (to production) targets to an absolute target. We will also implement deforestation interventions in key agriculture supply programs, such as Cocoa Life, and as progress is made on the ground, will publicly report the resulting end-to-end carbon footprint reduction. All of these examples include, at the least, addressing climate change strategies, including helping farmers become more resilient to potential climate changes.
CC14.4b
To give a sense of scale of this engagement, please give the number of suppliers with whom you are engaging and the proportion of your total spend that they represent
Number of
suppliers
% of total spend
(direct and indirect)
Comment
76700 21%
We engage with direct suppliers (Tier 1) and also farmers on climate change matters. The numbers here represent a portion of our engagement with farmers for just one commodity: cocoa. These are farmers who are actual or potential indirect suppliers of commodities with whom we are directly engaging. From this one program described here, we aim to reach 1 million farmers by 2022. Cocoa Life’s long-term goal is to source all cocoa sustainably, mainly via Cocoa Life, which has a goal to reach over 200,000 cocoa farmers within the cocoa supply chain. . See 14.4a above for more information. We are engaging with farmers of these and other commodities in other ways, too, such as third-party certification schemes (e.g., Fairtrade).
CC14.4c
If you have data on your suppliers’ GHG emissions and climate change strategies, please explain how you make use of that data
How you make use of
the data
Please give details
Other We conducted an environmental footprinting analysis (through a consultant, Quantis) across our entire supply chain, from farm to consumption.

How you make use of
the data
Please give details
The analysis assessed impacts to land, water and GHGs. It found that agriculture is the main impact. We use the footprint information to help inform our sustainability strategy.
CC14.4d
Please explain why you do not engage with any elements of your value chain on GHG emissions and climate change strategies, and any plans you have to develop an engagement strategy in the future
Further Information
Module: Sign Off
Page: CC15. Sign Off
CC15.1
Please provide the following information for the person that has signed off (approved) your CDP climate change response
Name
Job title
Corresponding job category
Jonathan Horrell Director, Global Sustainability Environment/Sustainability manager
Further Information
Module: FBT
Page: FBT1. Agriculture

FBT1.1
Are agricultural activities, whether in your direct operations or elsewhere in your value chain, relevant to your climate change disclosure?
FBT1.1a
Please explain why agricultural activities are not relevant to your climate change disclosure
FBT1.2
Are the agricultural activities that you have identified as relevant undertaken on your own farm(s), elsewhere in your value chain, or both?
FBT1.2a
Please explain why agricultural emissions from your own farms are not relevant
FBT1.3
Do you account for greenhouse gas emissions from agricultural activities undertaken on your own farm(s) as part of the global gross Scope 1 emissions figure reported in CC8.2, and/or the Scope 2 figure reported in CC8.3a of the core climate change questionnaire?
FBT1.3a
Please select the form(s) in which you wish to report the greenhouse gas emissions produced by agricultural activities (agricultural emissions) undertaken on your own farm(s)

FBT1.3b
Please report your total agricultural emissions produced on your own farm(s) and identify any exclusions in the table below
Scope
Agricultural emissions (metric
tonnes CO2e)
Methodology
Exclusions
Explanation
Comment
FBT1.3c
Please report your agricultural emissions produced on your own farm(s), disaggregated by category, and identify any exclusions in the table below
Emissions category
Agricultural
emissions (metric tonnes CO2e)
Methodology
Exclusions
Explanation
Comment
FBT1.3d
Please explain why you do not account for greenhouse gas emissions from agricultural activities undertaken on your own farm(s), and describe any plans for the collection of this data in the future
FBT1.4
Do you implement agricultural management practices on your own farm(s) with a climate change mitigation and/or adaptation benefit?
FBT1.4a

Please identify agricultural management practices undertaken on your own farm(s) with a climate change mitigation and/or adaptation benefit. Complete the table
Activity ID
Agricultural
management practice
Description of agricultural management practice
Climate change related benefit
Comment
FBT1.4b
Does your implementation of these agricultural management practices have other impacts? Complete the table
Activity ID
Impact on yield
Impact on cost
Impact on soil quality
Impact on biodiversity
Impact on water
Other impact
Description of impacts
Comment
FBT1.4c
Do you have any plans to implement agricultural management practices in the future?
FBT1.4d
Please detail your plans to implement agricultural management practices in the future
FBT1.5
Is biogenic carbon pertaining to your own farm(s) relevant to your climate change disclosure?
FBT1.5a

Please report biogenic carbon data pertaining to your own farm(s) in the table below
CO2 flux
Emissions/
Removals (metric tonnes CO2e)
Methodology
Exclusions
Explanation
Comment
FBT1.6
Do you account for greenhouse gas emissions from agricultural activities in your value chain as part of the Scope 3 category "Purchased goods and services" reported in CC14.1 of the core climate change questionnaire?
FBT1.6a
Please report these agricultural emissions from your value chain and identify any exclusions in the table below
Scope
Agricultural emissions (% of the emissions reported in the category “Purchased goods
and services”)
Exclusions
Explanation
Comment
FBT1.6b
Please explain why you do not account for greenhouse gas emissions from agricultural activities in your value chain as part of the Scope 3 category “Purchased goods and services” reported in CC14.1 of the core climate change questionnaire
FBT1.7

Do you encourage your agricultural suppliers to undertake any agricultural management practices with a climate change mitigation and/or adaptation benefit?
FBT1.7a
Please identify agricultural management practices with a climate change mitigation and/or adaptation benefit that you encourage your suppliers to implement. Complete the table
Activity ID
Agricultural
management practice
Description of agricultural
management practice
Your role in the implementation of
this practice
Explanation of how you encourage implementation
Climate change related benefit
Comment
FBT1.7b
Does the implementation of these agricultural management practices in your value chain have other impacts? Complete the table
Activity ID
Impact on yield
Impact on cost
Impact on soil quality
Impact on biodiversity
Impact on water
Other impact
Description of impacts
Comment
FBT1.7c
Do you have any plans to engage with your suppliers on their implementation of agricultural management practices?
FBT1.7d
Please detail these plans to engage with your suppliers on their implementation of agricultural management practices

Further Information
Page: FBT2. Processing
FBT2.1
Are processing activities, whether in your direct operations or elsewhere in your value chain, relevant to your climate change disclosure?
FBT2.1a
Please explain why processing activities are not relevant to your climate change disclosure
FBT2.2
Are the processing activities that you have identified as relevant undertaken in your direct operations, elsewhere in your value chain, or both?
FBT2.2a
Please explain why emissions from processing activities in your direct operations are not relevant
FBT2.3
Do you account for emissions from processing activities in your direct operations as part of the global gross Scope 1 emissions figure reported in CC8.2a and/or the Scope 2 figure reported in CC8.3a of the core climate change questionnaire?
FBT2.3a

Please report these emissions from processing activities in your direct operations and identify any exclusions in the table below
Scope
Emissions from processing activities (metric tonnes CO2e)
Exclusions
Explanation
Comment
FBT2.3b
Please explain why you do not account for emissions from processing activities in your direct operations, and describe any plans for the collection of this data in the future
FBT2.4
Do you account for emissions from processing activities in your value chain as part of the Scope 3 category "Purchased goods and services" and/or "Processing of sold products" reported in CC14.1 of the core climate change questionnaire?
Further Information
Page: FBT3. Distribution
FBT3.1
Are distribution activities, whether in your direct operations or elsewhere in your value chain, relevant to your climate change disclosure?
FBT3.1a
Please explain why distribution activities are not relevant to your climate change disclosure

FBT3.2
Are the distribution activities that you have identified as relevant undertaken in your direct operations, elsewhere in your value chain, or both?
FBT3.2a
Please explain why emissions from distribution activities in your direct operations are not relevant
FBT3.3
Do you account for emissions from distribution activities in your direct operations as part of the global gross Scope 1 emissions figure reported in CC8.2 and/or the Scope 2 figure reported in CC8.3a of the core climate change questionnaire?
FBT3.3a
Please report these emissions from distribution activities in your direct operations and identify any exclusions in the table below
Scope
Emissions from distribution activities (metric tonnes CO2e)
Exclusions
Explanation
Comment
FBT3.3b
Please explain why you do not account for emissions from distribution activities in your direct operations, and describe any plans for the collection of this data in the future
FBT3.4

Do you account for emissions from distribution activities in your value chain as part of the Scope 3 category "Upstream transportation and distribution" and/or "Downstream transportation and distribution" in CC14.1 of the core climate change questionnaire?
Further Information
Page: FBT4. Consumption
FBT4.1
Are emissions from the consumption of your products relevant to your climate change disclosure?
FBT4.1b
Please explain why emissions from the consumption of your products are not relevant to your climate change disclosure
FBT4.1a
Do you account for emissions from the consumption of your products as part of the Scope 3 category "Use of sold products" and/or "End of life treatment of sold products" in CC14.1 of the core climate change questionnaire?
Further Information
CDP 2016 Climate Change 2016 Information Request