Embed Size (px)
Citation preview

CDP CDP 2017 Climate Change 2017 Information Request Cellnex Telecom SA
Module: Introduction
Page: Introduction
CC0.1
Introduction Please give a general description and introduction to your organization. Cellnex Telecom is the leading European operator in w ireless telecommunications infrastructure operator, w ith more than 21,000 sites located in Italy, Spain, France, the Netherlands and the UK and providing services through its customers to more than 200 million people. The business model is based on the provision and sharing of telecommunications assets w ith service operators, acting as an independent and neutral infrastructure provider for telecommunications operators. Cellnex Telecom is the result of the spin-off of the telecommunications business of Abertis through its f lotation on the stock market, w hich took place in May 2015. Cellnex Telecom w as founded w ith the aim of becoming Europe’s leader in telecommunications infrastructure, and creating value for shareholders, customers, employees and other stakeholders through innovative, eff icient, independent and quality management. Cellnex Telecom offers to its customers the space they require in these sites in order to install and maintain their ow n communications netw ork equipment and transmit data and voice w irelessly. At the same time, the company provides highly advanced audiovisual services to broadcasters at local, regional and national level. Cellnex Telecom also develops solutions in the f ield of “smart city” projects that optimise services to the citizen via netw orks and services that facilitate municipal management. In this area, Cellnex Telecom is deploying a netw ork of intelligent communications that permits a connection betw een objects, giving rise to a solid ecosystem for the Internet of Things (IoT) in Spain. Cellnex Telecom also plays a relevant role in the deployment of safety and emergency netw orks for the security forces, know n as PPDRs (Public Protection And Disaster Relief). This line of activity summarises both the degree of expertise the company’s team of professionals and the ruggedness and reliability of the architecture of its netw orks and equipment. Cellnex Telecom’s key objective is to generate sustained value in the short, medium and long term, through responsible management of the business, based in ethical principles, respect for people and the environment and the incorporation of the interests and expectations of the company’s stakeholders In that sense, Cellnex Telecom received the aw ard for best Spanish new comer 2016 in the Climate Leadership Aw ards organised by the CDP.
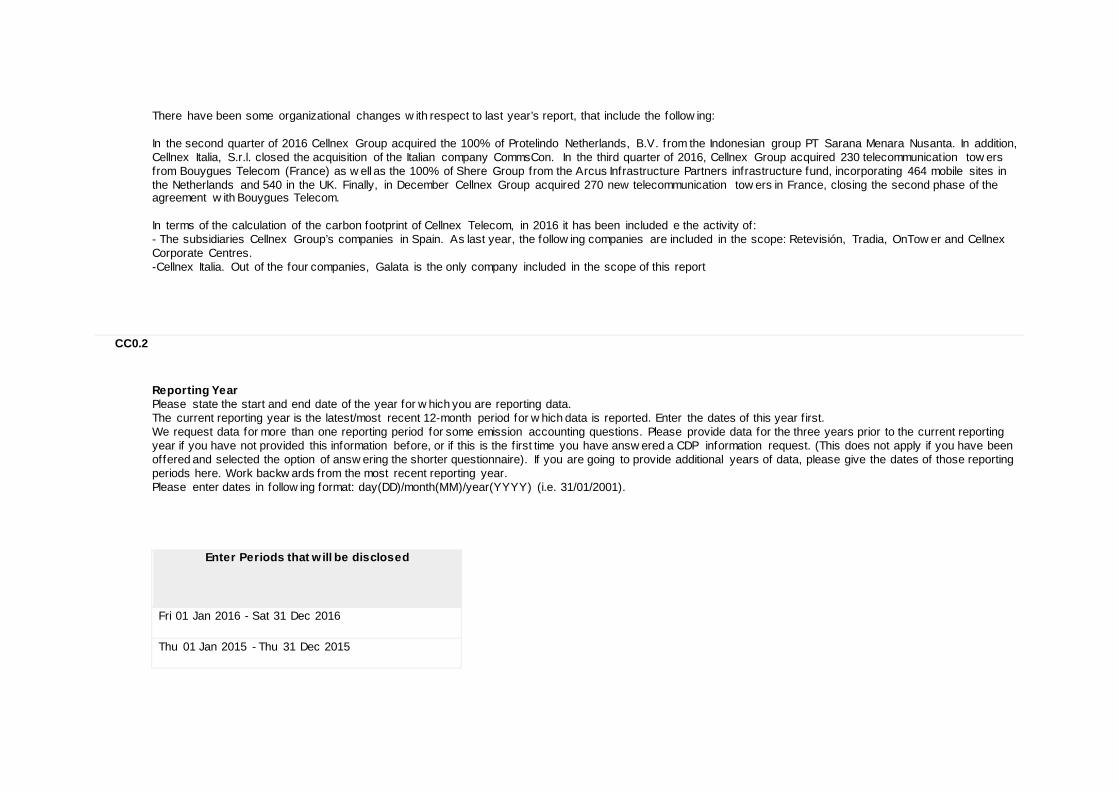
There have been some organizational changes w ith respect to last year’s report, that include the follow ing: In the second quarter of 2016 Cellnex Group acquired the 100% of Protelindo Netherlands, B.V. from the Indonesian group PT Sarana Menara Nusanta. In addition, Cellnex Italia, S.r.l. closed the acquisition of the Italian company CommsCon. In the third quarter of 2016, Cellnex Group acquired 230 telecommunication tow ers from Bouygues Telecom (France) as w ell as the 100% of Shere Group from the Arcus Infrastructure Partners infrastructure fund, incorporating 464 mobile sites in the Netherlands and 540 in the UK. Finally, in December Cellnex Group acquired 270 new telecommunication tow ers in France, closing the second phase of the agreement w ith Bouygues Telecom. In terms of the calculation of the carbon footprint of Cellnex Telecom, in 2016 it has been included e the activity of: - The subsidiaries Cellnex Group’s companies in Spain. As last year, the follow ing companies are included in the scope: Retevisión, Tradia, OnTow er and Cellnex Corporate Centres. -Cellnex Italia. Out of the four companies, Galata is the only company included in the scope of this report
CC0.2
Reporting Year Please state the start and end date of the year for w hich you are reporting data. The current reporting year is the latest/most recent 12-month period for w hich data is reported. Enter the dates of this year f irst. We request data for more than one reporting period for some emission accounting questions. Please provide data for the three years prior to the current reporting year if you have not provided this information before, or if this is the f irst time you have answ ered a CDP information request. (This does not apply if you have been offered and selected the option of answ ering the shorter questionnaire). If you are going to provide additional years of data, please give the dates of those reporting periods here. Work backw ards from the most recent reporting year. Please enter dates in follow ing format: day(DD)/month(MM)/year(YYYY) (i.e. 31/01/2001).
Enter Periods that w ill be disclosed
Fri 01 Jan 2016 - Sat 31 Dec 2016 Thu 01 Jan 2015 - Thu 31 Dec 2015
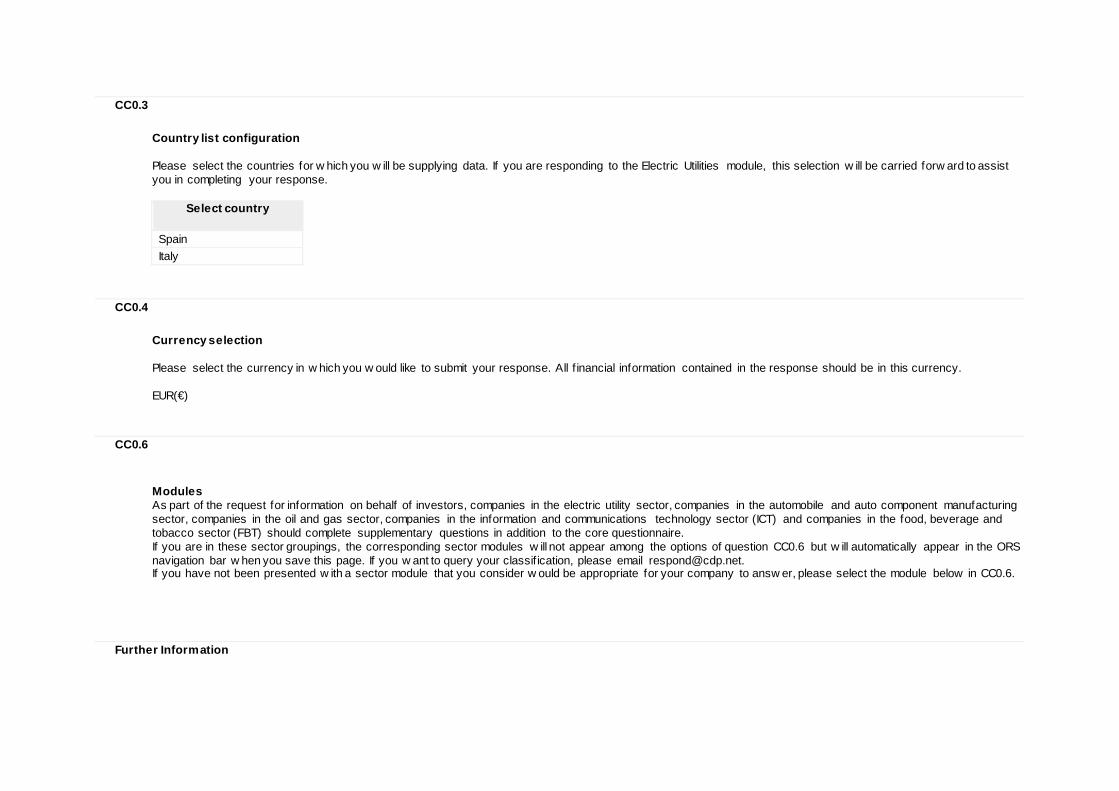
CC0.3
Country list configuration Please select the countries for w hich you w ill be supplying data. If you are responding to the Electric Utilities module, this selection w ill be carried forw ard to assist you in completing your response.
Select country
Spain Italy
CC0.4
Currency selection Please select the currency in w hich you w ould like to submit your response. All f inancial information contained in the response should be in this currency. EUR(€)
CC0.6
Modules As part of the request for information on behalf of investors, companies in the electric utility sector, companies in the automobile and auto component manufacturing sector, companies in the oil and gas sector, companies in the information and communications technology sector (ICT) and companies in the food, beverage and tobacco sector (FBT) should complete supplementary questions in addition to the core questionnaire. If you are in these sector groupings, the corresponding sector modules w ill not appear among the options of question CC0.6 but w ill automatically appear in the ORS navigation bar w hen you save this page. If you w ant to query your classif ication, please email [email protected]. If you have not been presented w ith a sector module that you consider w ould be appropriate for your company to answ er, please select the module below in CC0.6.
Further Information
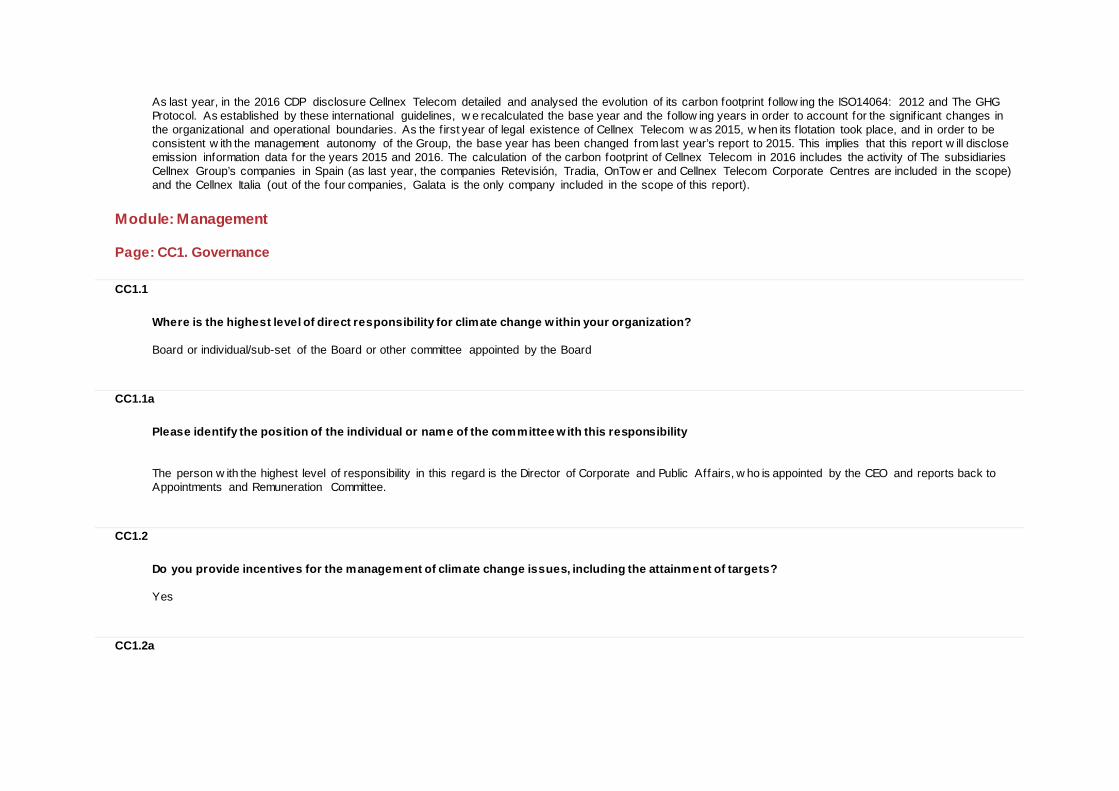
As last year, in the 2016 CDP disclosure Cellnex Telecom detailed and analysed the evolution of its carbon footprint follow ing the ISO14064: 2012 and The GHG Protocol. As established by these international guidelines, w e recalculated the base year and the follow ing years in order to account for the signif icant changes in the organizational and operational boundaries. As the f irst year of legal existence of Cellnex Telecom w as 2015, w hen its f lotation took place, and in order to be consistent w ith the management autonomy of the Group, the base year has been changed from last year’s report to 2015. This implies that this report w ill disclose emission information data for the years 2015 and 2016. The calculation of the carbon footprint of Cellnex Telecom in 2016 includes the activity of The subsidiaries Cellnex Group’s companies in Spain (as last year, the companies Retevisión, Tradia, OnTow er and Cellnex Telecom Corporate Centres are included in the scope) and the Cellnex Italia (out of the four companies, Galata is the only company included in the scope of this report).
Module: Management
Page: CC1. Governance
CC1.1
Where is the highest level of direct responsibility for climate change within your organization? Board or individual/sub-set of the Board or other committee appointed by the Board
CC1.1a
Please identify the position of the individual or name of the committee w ith this responsibility The person w ith the highest level of responsibility in this regard is the Director of Corporate and Public Affairs, w ho is appointed by the CEO and reports back to Appointments and Remuneration Committee.
CC1.2
Do you provide incentives for the management of climate change issues, including the attainment of targets? Yes
CC1.2a
Please provide further details on the incentives provided for the management of climate change issues
Who is entitled to benefit from these incentives?
The type of incentives
Incentivized performance indicator
Comment
Environment/Sustainability managers Monetary rew ard Energy reduction project
This incentive is granted for the establishment of environmental improvement plans for facilities, w hich include energy eff iciency measures.
Further Information
Page: CC2. Strategy
CC2.1
Please select the option that best describes your risk management procedures with regard to climate change risks and opportunities Integrated into multi-disciplinary company w ide risk management processes
CC2.1a
Please provide further details on your risk management procedures w ith regard to climate change risks and opportunities
Frequency of monitoring
To whom are results reported?
Geographical
areas considered
How far into the future are risks considered?
Comment
Annually Board or individual/sub-set of the Board or committee appointed by the Board Spain > 6 years Relevant risks are incorporated in the
company-w ide risk assessment monitoring.
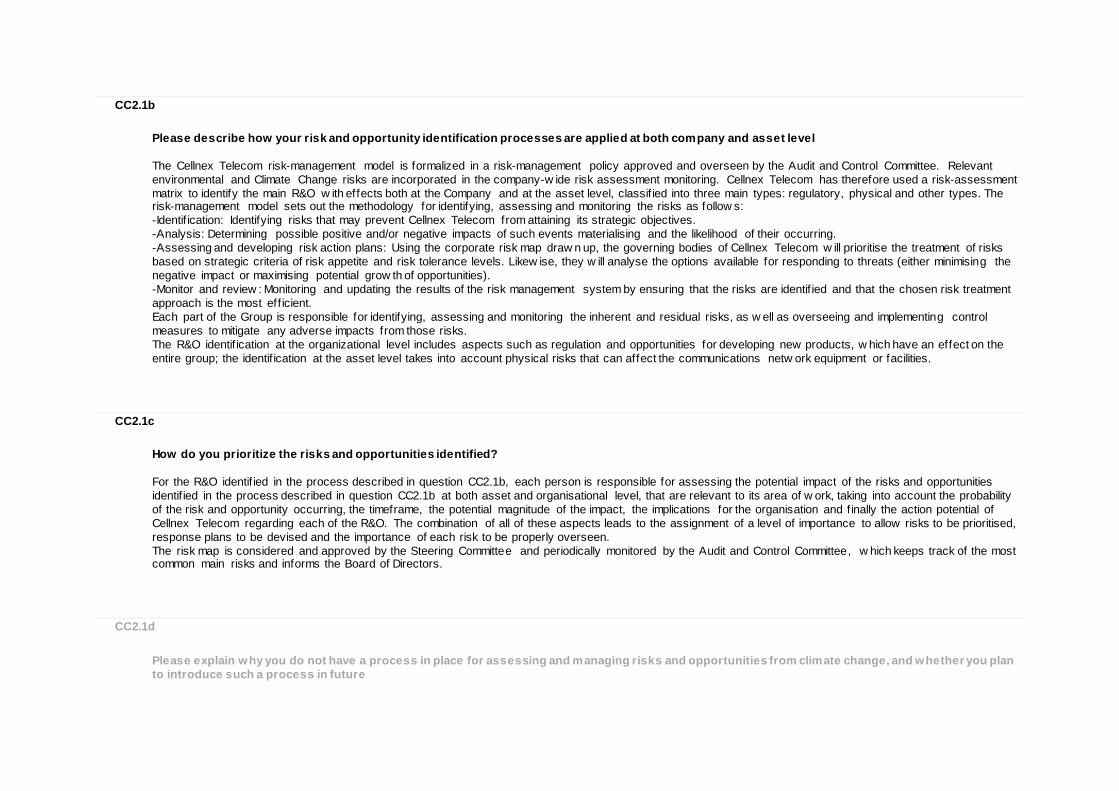
CC2.1b
Please describe how your risk and opportunity identification processes are applied at both company and asset level The Cellnex Telecom risk-management model is formalized in a risk-management policy approved and overseen by the Audit and Control Committee. Relevant environmental and Climate Change risks are incorporated in the company-w ide risk assessment monitoring. Cellnex Telecom has therefore used a risk-assessment matrix to identify the main R&O w ith effects both at the Company and at the asset level, classif ied into three main types: regulatory, physical and other types. The risk-management model sets out the methodology for identifying, assessing and monitoring the risks as follow s: -Identif ication: Identifying risks that may prevent Cellnex Telecom from attaining its strategic objectives. -Analysis: Determining possible positive and/or negative impacts of such events materialising and the likelihood of their occurring. -Assessing and developing risk action plans: Using the corporate risk map draw n up, the governing bodies of Cellnex Telecom w ill prioritise the treatment of risks based on strategic criteria of risk appetite and risk tolerance levels. Likew ise, they w ill analyse the options available for responding to threats (either minimising the negative impact or maximising potential grow th of opportunities). -Monitor and review : Monitoring and updating the results of the risk management system by ensuring that the risks are identif ied and that the chosen risk treatment approach is the most eff icient. Each part of the Group is responsible for identifying, assessing and monitoring the inherent and residual risks, as w ell as overseeing and implementing control measures to mitigate any adverse impacts from those risks. The R&O identif ication at the organizational level includes aspects such as regulation and opportunities for developing new products, w hich have an effect on the entire group; the identif ication at the asset level takes into account physical risks that can affect the communications netw ork equipment or facilities.
CC2.1c
How do you prioritize the risks and opportunities identified? For the R&O identif ied in the process described in question CC2.1b, each person is responsible for assessing the potential impact of the risks and opportunities identif ied in the process described in question CC2.1b at both asset and organisational level, that are relevant to its area of w ork, taking into account the probability of the risk and opportunity occurring, the timeframe, the potential magnitude of the impact, the implications for the organisation and f inally the action potential of Cellnex Telecom regarding each of the R&O. The combination of all of these aspects leads to the assignment of a level of importance to allow risks to be prioritised, response plans to be devised and the importance of each risk to be properly overseen. The risk map is considered and approved by the Steering Committee and periodically monitored by the Audit and Control Committee, w hich keeps track of the most common main risks and informs the Board of Directors.
CC2.1d
Please explain why you do not have a process in place for assessing and managing risks and opportunities from climate change, and whether you plan to introduce such a process in future
Main reason for not having a process
Do you plan to introduce a process?
Comment
CC2.2
Is climate change integrated into your business strategy? Yes
CC2.2a
Please describe the process of how climate change is integrated into your business strategy and any outcomes of this process i) Due to its impact on our business, Climate change has influenced our strategy in several w ays: a) Cellnex Telecom has an environmental policy based on respect for the environment through the eff icient use of resources and promoting preventive action, w hich has a direct link to climate change. This policy involves taking measures to prevent pollution and reduce the environmental impact of the Company’s activities and facilities. Linked to this, Cellnex Telecom has defined a target to reduce scope 2 emissions by 2020 through energy eff iciency measures such as Free cooling. This target is described in the relevant section CC3.1a. b) A Corporate Responsibility Plan has been defined for the period 2016-2020, and one of its pillars is the Sustainable development of the business, w hich has as main action lines to ensure that the w hole company has the same level of environmental responsibility, to take a stance on the analysis of the effects of EMR on health and to increase environmental aw areness among stakeholders. c) Cellnex Telecom has a procedure for identifying and assessing environmental risks related to the Company’s business and its environmental impacts including those related to Climate change. Environmental managers are responsible for collecting climate change information and reporting to the CSR department. Climate change information includes information such as energy primary data, w aste disposal, the group’s carbon footprint, etc. All this information is reported to the Board of Directors. ii) An example given of how the business strategy has been influenced: once a climate change-related risk is incorporated, a monitoring system is established, and plans are devised to manage and mitigate the impacts. The follow ing management and eff iciency plans are implemented according to the type of impact: Monitoring of energy consumption and carbon footprint, Energy eff iciency management and Biodiversity management. Other examples include: the implementation of energy eff iciency projects, the development and implementation of a softw are application to calculate the Group’s carbon footprint, the increase in the consumption of certif ied green energy consumed in business off ices and operational centres, among others. iii) Aspects of climate change that have influenced the strategy are regulatory changes associated w ith limits on CO2e emissions, need for adaptation since Cellnex Telecom could be affected by extreme temperatures and w eather events or opportunities to develop green business, among others. Generally, risks associated w ith climate change are incorporated in the company-w ide risk analysis, w hich defines risk according to four typologies (Strategic, Financial, Operational and Compliance). Of these, climate change risks and opportunities are relevant in: Strategic R&O: through regulatory compliance and cost control associated R&O.
Operational R&O: through interaction w ith the environment, infrastructure, dependence on suppliers and potential interruption of business associated R&O. Compliance R&O: through information and legal compliance associated R&O. iv)The establishment of the Environmental management System, w hich includes the management of emissions, the definition of the Corporate responsibility plan 2016-2020, explained in section i) and the implementation of the First Experience of Free Cooling energy eff iciency in Italy are clear examples of the influence climate change is having in the corporate strategy. In relation to this, Cellnex Telecom aims at continuing w ith the establishment of annual targets to minimise the carbon footprint, such as the scope 1, 2 and 3 emission reduction targets defined in CC3.1a. v)With the definition of the Master Plan Cellnex Telecom establishes a long-term vision, w ith commitments in accordance w ith internationally recognised standards that place it on the same level as the major infrastructure companies operating in Europe. Cellnex Telecom participates in several R+D+i projects, w hich may develop into new business opportunities that enable the mitigation of climate change w hile strengthening connectivity. This search for new business options and products that may arise from technologies that allow for climate change management is part of the incorporation of climate change in the long run. Some of the key future actions to be developed by Cellnex Telecom are to design and develop a pilot project on voluntary compensation of CO2 emissions caused by a particular activity of the Company as w ell as implementing a plan to protect the environment and biodiversity applicable in natural spaces in w hich Cellnex Telecom operates. vi) Climate change management and the active participation in innovation platforms such as Smart Cities and the Internet of Things gains us strategic advantage through the early incorporation to new development and business opportunities. Moreover, a good GHG emissions performance strengthens our position as a supplier, w idening therefore our range of clients vii) Inf luenced by the climate change operational risks (through interaction w ith the environment, infrastructure, dependence on suppliers and potential interruption of business associated risks), risks associated w ith consumer behaviour change and opportunities to develop green business, one of the most substantial business decision made during the reporting year has been the definition of a Corporate Responsibility Plan for the period 2016-2020, from w hich one of the pillars of the plan is the Sustainable development of the business, w hich has a direct link to climate change. Some of the goals defined in the Plan as part of the Sustainable Business Development pillar are promoting energy eff iciency and increasing the use of renew able energy, among others. In addition, another substantial business decision has been the creation of Cellnex Telecom’s Innovation and Product Strategy Department, inf luenced by the physical R&O. The Department has established an R&D+i management model based on tw o types, technological surveillance and R&D+i activities. viii) Cellnex Telecom is very aw are of the importance of taking action against climate and has been taking action for several years, not only since it w as created in 2015 but also w hen it w as part of the company Abertis. The Paris Agreement has reaff irmed this importance and Cellnex Telecom has defined the Corporate Responsibility Plan for the period 2016-2020 and has kept pursuing efforts in order to reduce greenhouse gas emissions to limit the temperature increase. Included in the mentioned plan are actions such as increasing the use of renew able energy, implementing a Zero Waste culture and progressively reducing Cellnex Telecom’s carbon footprint. ix) We are in the process of developing a deep w ork regarding the R&O derived from climate change and therefore w e have not yet used forw ard-looking scenario analyses to inform our organization’s business, strategy, and/or f inancial planning.
CC2.2b
Please explain why climate change is not integrated into your business strategy
CC2.2c
Does your company use an internal price on carbon? No, and w e currently don't anticipate doing so in the next 2 years
CC2.2d
Please provide details and examples of how your company uses an internal price on carbon
CC2.3
Do you engage in activities that could either directly or indirectly influence public policy on climate change through any of the following? (tick all that apply) Direct engagement w ith policy makers Trade associations Funding research organizations
CC2.3a
On what issues have you been engaging directly w ith policy makers?
Focus of legislation
Corporate Position
Details of engagement
Proposed legislative solution
Energy eff iciency Support
Cellnex Telecom strives to create innovative IT solutions that drive the cities’ development; this is done through research in new technologic applications in management and sustainable urban mobility. We have an agreement w ith the Barcelona City Council, in order to test how to set up a more eff icient city management system model; and at the same time, provide citizens public services that improve their daily lives in
The agreement w ith the Barcelona City Council can lead to new legislative solutions aiming at reducing CO2 emissions in the management of cities. At the moment, Cellnex Telecom is collaborating w ith them in testing new solutions that w ould allow the city to generate less CO2 emissions in the daily. The agreement consists in the study of integrated electronic, computer and sensor-based tools for the intelligent management of the city that could lead to a decrease in urban CO2 emissions. We are collaborating w ith them through tw o projects: (1) i-City Project: The i-City project aims to develop an European test environment w ithin the framew ork of 'Smart Cities', through the creation of Smart City 'pilot cities' in Barcelona, London, Geneva and Bologna, to test applications and services of clear interest for citizens and public authorities. Cellnex Telecom is an iCity Project IT Partner w ith the category of IT
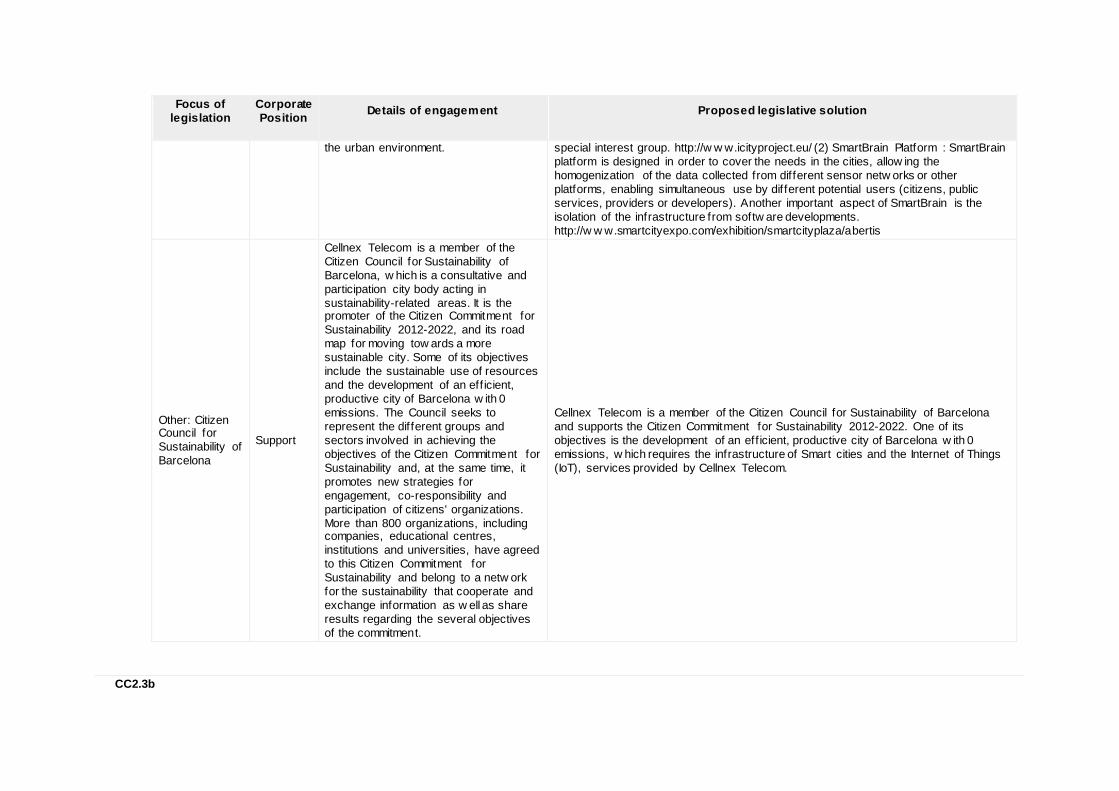
Focus of legislation
Corporate Position
Details of engagement
Proposed legislative solution
the urban environment. special interest group. http://w w w.icityproject.eu/ (2) SmartBrain Platform : SmartBrain platform is designed in order to cover the needs in the cities, allow ing the homogenization of the data collected from different sensor netw orks or other platforms, enabling simultaneous use by different potential users (citizens, public services, providers or developers). Another important aspect of SmartBrain is the isolation of the infrastructure from softw are developments. http://w w w.smartcityexpo.com/exhibition/smartcityplaza/abertis
Other: Citizen Council for Sustainability of Barcelona
Support
Cellnex Telecom is a member of the Citizen Council for Sustainability of Barcelona, w hich is a consultative and participation city body acting in sustainability-related areas. It is the promoter of the Citizen Commitment for Sustainability 2012-2022, and its road map for moving tow ards a more sustainable city. Some of its objectives include the sustainable use of resources and the development of an eff icient, productive city of Barcelona w ith 0 emissions. The Council seeks to represent the different groups and sectors involved in achieving the objectives of the Citizen Commitment for Sustainability and, at the same time, it promotes new strategies for engagement, co-responsibility and participation of citizens' organizations. More than 800 organizations, including companies, educational centres, institutions and universities, have agreed to this Citizen Commitment for Sustainability and belong to a netw ork for the sustainability that cooperate and exchange information as w ell as share results regarding the several objectives of the commitment.
Cellnex Telecom is a member of the Citizen Council for Sustainability of Barcelona and supports the Citizen Commitment for Sustainability 2012-2022. One of its objectives is the development of an eff icient, productive city of Barcelona w ith 0 emissions, w hich requires the infrastructure of Smart cities and the Internet of Things (IoT), services provided by Cellnex Telecom.
CC2.3b
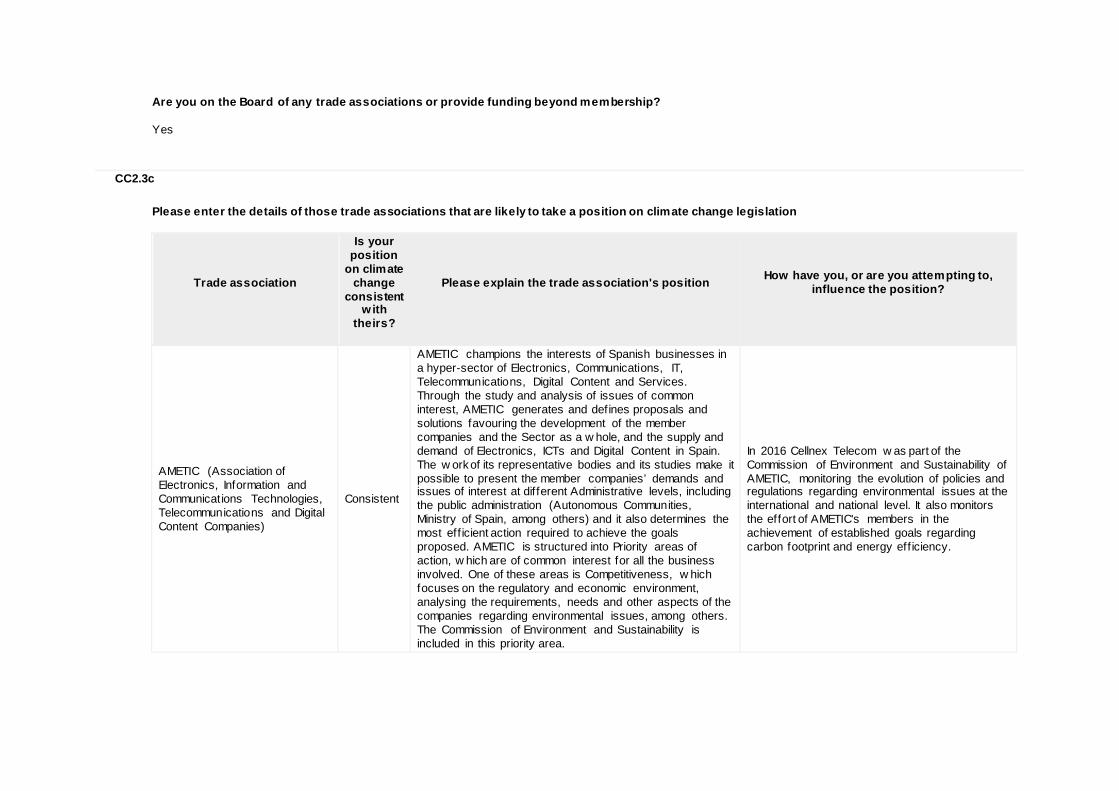
Are you on the Board of any trade associations or provide funding beyond membership? Yes
CC2.3c
Please enter the details of those trade associations that are likely to take a position on climate change legislation
Trade association
Is your position
on climate change
consistent w ith
theirs?
Please explain the trade association's position
How have you, or are you attempting to, influence the position?
AMETIC (Association of Electronics, Information and Communications Technologies, Telecommunications and Digital Content Companies)
Consistent
AMETIC champions the interests of Spanish businesses in a hyper-sector of Electronics, Communications, IT, Telecommunications, Digital Content and Services. Through the study and analysis of issues of common interest, AMETIC generates and defines proposals and solutions favouring the development of the member companies and the Sector as a w hole, and the supply and demand of Electronics, ICTs and Digital Content in Spain. The w ork of its representative bodies and its studies make it possible to present the member companies’ demands and issues of interest at different Administrative levels, including the public administration (Autonomous Communities, Ministry of Spain, among others) and it also determines the most eff icient action required to achieve the goals proposed. AMETIC is structured into Priority areas of action, w hich are of common interest for all the business involved. One of these areas is Competitiveness, w hich focuses on the regulatory and economic environment, analysing the requirements, needs and other aspects of the companies regarding environmental issues, among others. The Commission of Environment and Sustainability is included in this priority area.
In 2016 Cellnex Telecom w as part of the Commission of Environment and Sustainability of AMETIC, monitoring the evolution of policies and regulations regarding environmental issues at the international and national level. It also monitors the effort of AMETIC's members in the achievement of established goals regarding carbon footprint and energy eff iciency.
CC2.3d
Do you publicly disclose a list of all the research organizations that you fund? No
CC2.3e
Please provide details of the other engagement activities that you undertake
CC2.3f
What processes do you have in place to ensure that all of your direct and indirect activities that influence policy are consistent w ith your overall climate change strategy? Our climate change strategy is subjected to our code of ethics, w hich explicitly states its commitment to protecting the environment. Our priorities are to reduce our carbon footprint by implementing carbon emission targets and increase low carbon services through innovation. The Risk and Opportunity assessment of different projects undertaken by Cellnex Telecom ensures that they meet the quality and standards the company requires prior to its involvement, including its coherence w ith the internal Code of Ethics. The Cellnex Group’s Ethics and Compliance Committee w as established in 2016 and this Committee represents the highest body that guarantees compliance w ith the Code of Ethics and the Corruption Prevention Procedure of the Cellnex Group and the internal rules that enact them. In addition to its executive role, this Committee is the advisory and management body for all issues relating to ethical rules and compliance of the Cellnex Group. All of the direct and indirect activities that inf luence policy are consistent w ith our overall climate change strategy as they are in line w ith the goals defined in the Sustainable Business Development pillar of the Corporate Responsibility Plan (2016-2020), approved by the Board of Directors. For example, the engagement w ith the Barcelona City Council to test how to set up a more eff icient city management system model is in line w ith Cellnex Telecom's goal of promoting energy eff iciency, goal defined in the Plan as part of the Sustainable Business Development pillar.
CC2.3g
Please explain why you do not engage with policy makers
Further Information
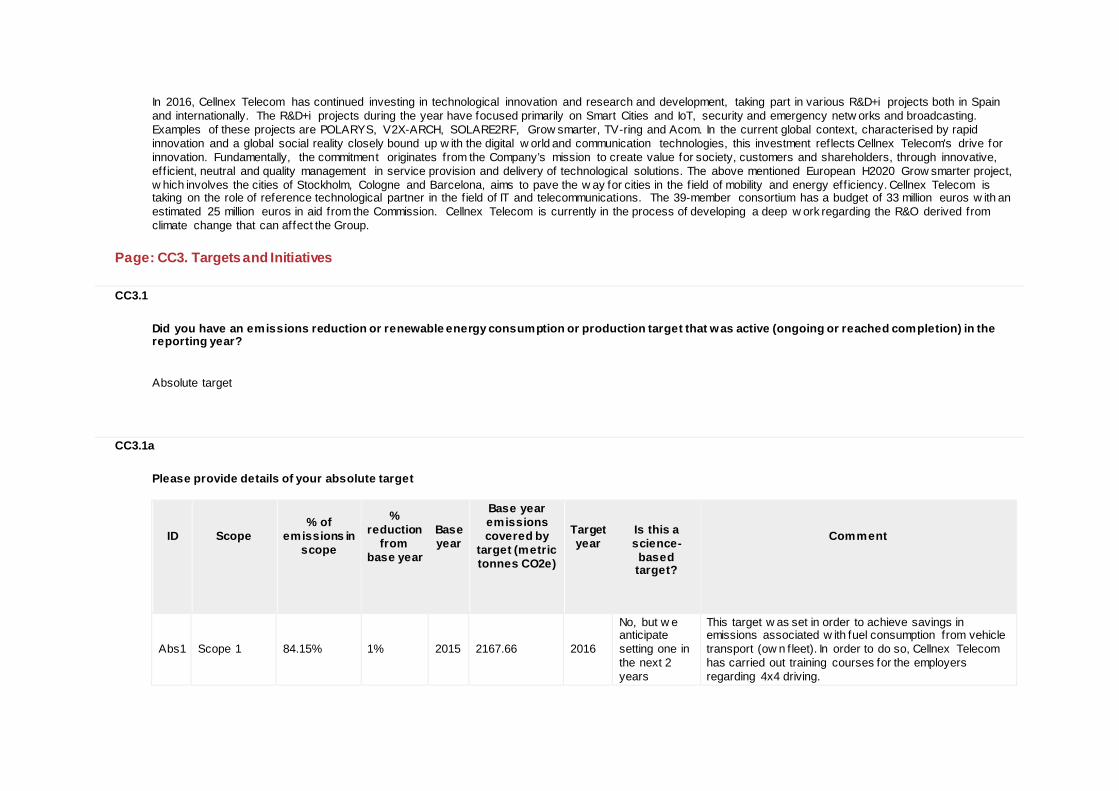
In 2016, Cellnex Telecom has continued investing in technological innovation and research and development, taking part in various R&D+i projects both in Spain and internationally. The R&D+i projects during the year have focused primarily on Smart Cities and IoT, security and emergency netw orks and broadcasting. Examples of these projects are POLARYS, V2X-ARCH, SOLARE2RF, Grow smarter, TV-ring and Acom. In the current global context, characterised by rapid innovation and a global social reality closely bound up w ith the digital w orld and communication technologies, this investment reflects Cellnex Telecom's drive for innovation. Fundamentally, the commitment originates from the Company’s mission to create value for society, customers and shareholders, through innovative, eff icient, neutral and quality management in service provision and delivery of technological solutions. The above mentioned European H2020 Grow smarter project, w hich involves the cities of Stockholm, Cologne and Barcelona, aims to pave the w ay for cities in the f ield of mobility and energy eff iciency. Cellnex Telecom is taking on the role of reference technological partner in the f ield of IT and telecommunications. The 39-member consortium has a budget of 33 million euros w ith an estimated 25 million euros in aid from the Commission. Cellnex Telecom is currently in the process of developing a deep w ork regarding the R&O derived from climate change that can affect the Group.
Page: CC3. Targets and Initiatives
CC3.1
Did you have an emissions reduction or renewable energy consumption or production target that was active (ongoing or reached completion) in the reporting year? Absolute target
CC3.1a
Please provide details of your absolute target
ID
Scope
% of emissions in
scope
% reduction
from base year
Base year
Base year emissions covered by
target (metric tonnes CO2e)
Target year
Is this a science-based target?
Comment
Abs1 Scope 1 84.15% 1% 2015 2167.66 2016
No, but w e anticipate setting one in the next 2 years
This target w as set in order to achieve savings in emissions associated w ith fuel consumption from vehicle transport (ow n fleet). In order to do so, Cellnex Telecom has carried out training courses for the employers regarding 4x4 driving.
ID
Scope
% of emissions in
scope
% reduction
from base year
Base year
Base year emissions covered by
target (metric tonnes CO2e)
Target year
Is this a science-based target?
Comment
Abs2 Scope 2 (market-based)
100% 30% 2015 51458.34 2020
No, but w e anticipate setting one in the next 2 years
This medium term target aims at reducing 30% of our scope 2 emissions by 2020 compared to 2015, w hich are associated w ith our electricity consumption. The target aims at reducing the Group's electricity consumption through the implementation of several energy eff iciency measures, such as: the acquisition of higher eff icient UPS (Uninterruptible pow er supply); the substitution of separator transformers by electrical protections; the management of the energy consumption related to cooling machines (tracking information about w eather conditions affecting the sites) in order to be alerted in the event of over-consumption or over-cooling; and the development of a free cooling system that exploits natural refrigeration and maximises the advantages provided by climatic conditions (to reduce the energy consumption of air conditioning), among other initiatives.
Abs3
Scope 3: Waste generated in operations
100% 70% 2015 227.05 2016
No, but w e anticipate setting one in the next 2 years
This target is under the environmental management framew ork and aims at revalorizing the w aste generated in our operations. The low er emission factor of revalorization treatments (as opposed to landfills or incineration) leads to an emissions reduction.
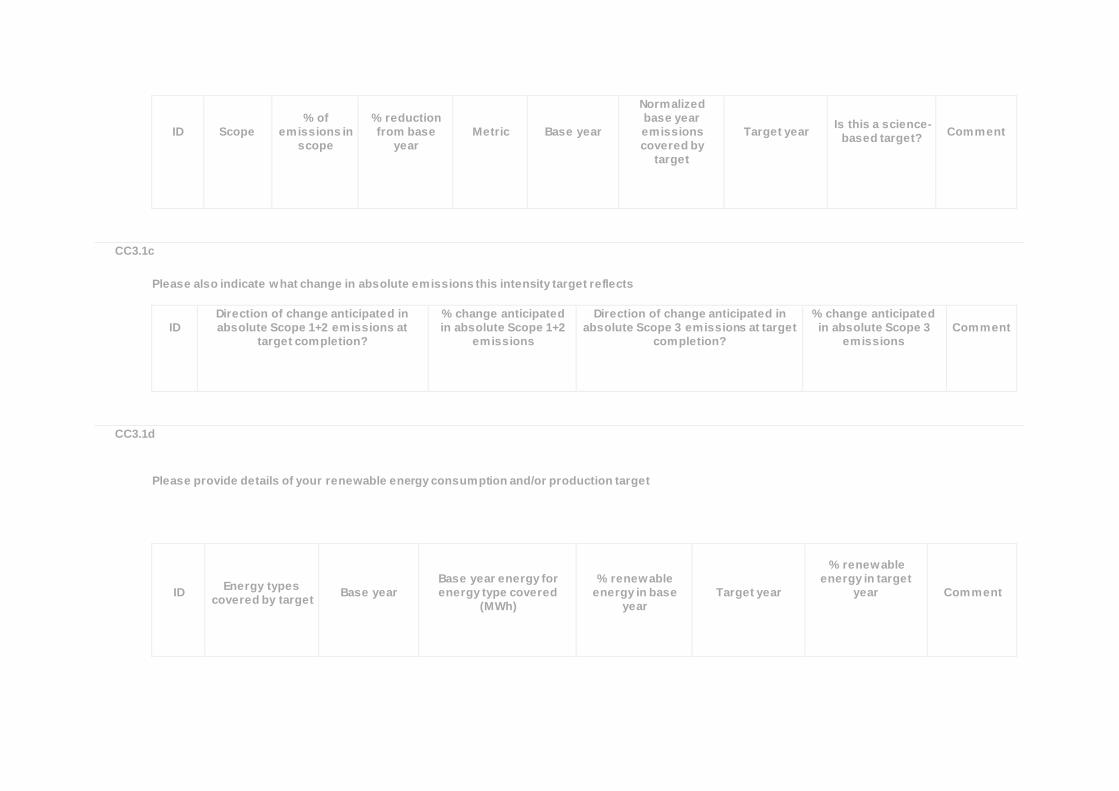
CC3.1b
Please provide details of your intensity target
ID
Scope
% of emissions in
scope
% reduction from base
year
Metric
Base year
Normalized base year emissions covered by
target
Target year
Is this a science-based target?
Comment
CC3.1c
Please also indicate what change in absolute emissions this intensity target reflects
ID
Direction of change anticipated in absolute Scope 1+2 emissions at
target completion?
% change anticipated in absolute Scope 1+2
emissions
Direction of change anticipated in absolute Scope 3 emissions at target
completion?
% change anticipated in absolute Scope 3
emissions
Comment
CC3.1d
Please provide details of your renewable energy consumption and/or production target
ID
Energy types
covered by target
Base year
Base year energy for energy type covered
(MWh)
% renewable
energy in base year
Target year
% renewable
energy in target year
Comment
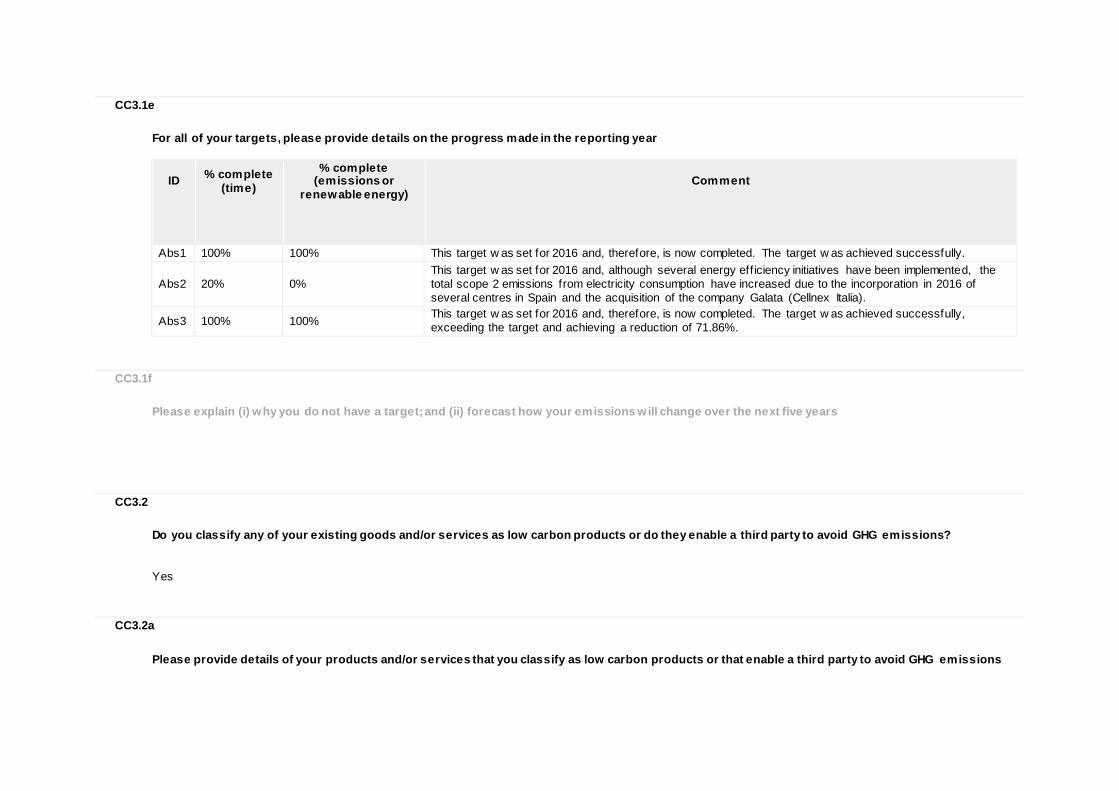
CC3.1e
For all of your targets, please provide details on the progress made in the reporting year
ID
% complete (time)
% complete (emissions or
renewable energy)
Comment
Abs1 100% 100% This target w as set for 2016 and, therefore, is now completed. The target w as achieved successfully.
Abs2 20% 0% This target w as set for 2016 and, although several energy eff iciency initiatives have been implemented, the total scope 2 emissions from electricity consumption have increased due to the incorporation in 2016 of several centres in Spain and the acquisition of the company Galata (Cellnex Italia).
Abs3 100% 100% This target w as set for 2016 and, therefore, is now completed. The target w as achieved successfully, exceeding the target and achieving a reduction of 71.86%.
CC3.1f
Please explain (i) why you do not have a target; and (ii) forecast how your emissions will change over the next five years
CC3.2
Do you classify any of your existing goods and/or services as low carbon products or do they enable a third party to avoid GHG emissions? Yes
CC3.2a
Please provide details of your products and/or services that you classify as low carbon products or that enable a third party to avoid GHG emissions
Level of
aggregation
Description of product/Group of products
Are you
reporting low carbon product/s or avoided
emissions?
Taxonomy, project or
methodology used to classify product/s as low
carbon or to calculate avoided
emissions
%
revenue from low carbon
product/s in the
reporting year
% R&D in
low carbon
product/s in the
reporting year
Comment
Group of products
Smart Cities. As a result of the priority for the sustainable development of cities, Cellnex Telecom has developed innovative technological solutions around the concept of Smart Cities that specif ically aim at allow ing cities to make more eff icient use of resources so as to improve the quality of life of citizens and reduce their environmental footprint, thanks to information and communication technologies (ICT).
Low carbon product
Other: Projected emissions over scenario w ithout the product
0.32% Less than or equal to 10%
An example is the irrigation management system in cities, w hich combine data from satellites w ith those from terrestrial sensors, enable savings of betw een 15 and 20% and a reduction in w ater consumption of up to 35%.
Group of products
Infrastructure sharing/co-location (compartición de estructuras). Cellnex Telecom facilitates the sharing betw een the major telephone operators, w hich allow s for the maximum and eff icient use of the installed netw ork capacity, minimising redundancy and duplication. Thus, this model is characterized by its reduced impact and presence in the urban fabric, and therefore improves eff icient use of resources such as energy, w hich in turn reduces the carbon footprint.
Avoided emissions
Other: Projected emissions over scenario w ithout the product
49.2%
CC3.3
Did you have emissions reduction initiatives that were active w ithin the reporting year (this can include those in the planning and/or implementation phases)

Yes
CC3.3a
Please identify the total number of projects at each stage of development, and for those in the implementation stages, the estimated CO2e savings
Stage of development
Number of projects
Total estimated annual CO2e savings in metric tonnes CO2e (only for rows marked *)
Under investigation 0 0 To be implemented* 4 860.28 Implementation commenced* 1 91.8 Implemented* 7 2255.62 Not to be implemented 0 0
CC3.3b
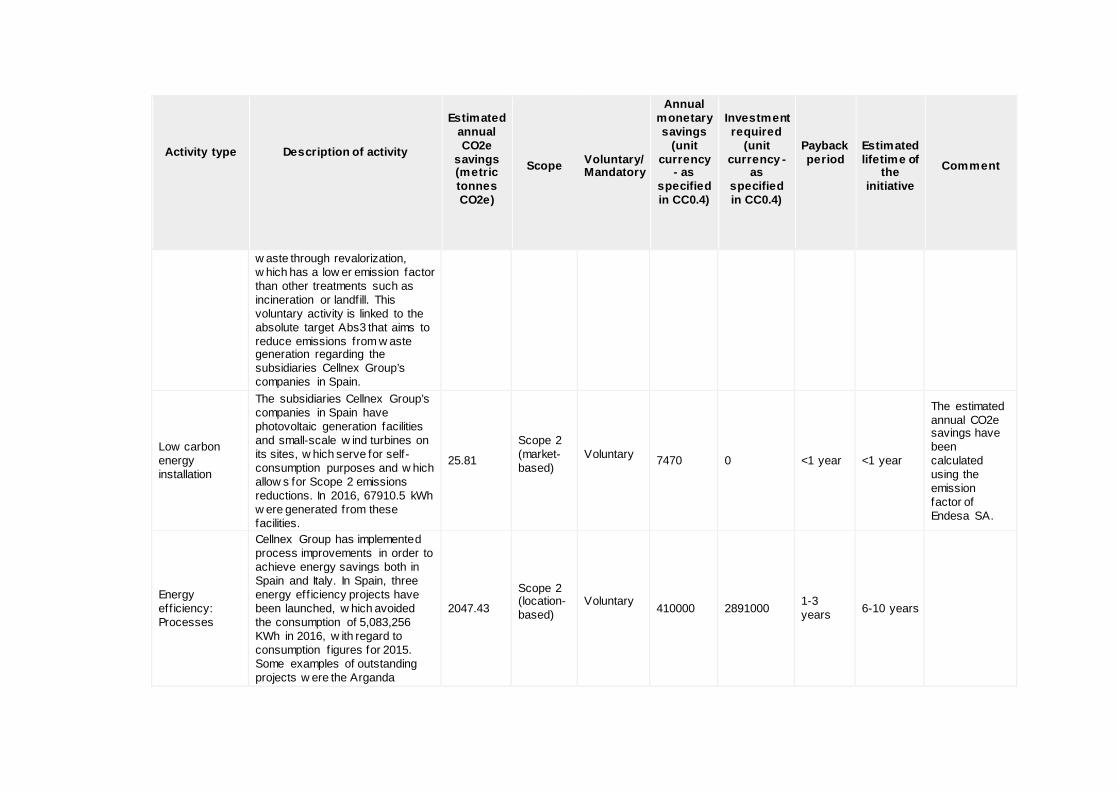
For those initiatives implemented in the reporting year, please provide details in the table below
Activity type
Description of activity
Estimated annual CO2e
savings (metric tonnes CO2e)
Scope
Voluntary/ Mandatory
Annual monetary savings
(unit currency
- as specified in CC0.4)
Investment required
(unit currency -
as specified in CC0.4)
Payback period
Estimated lifetime of
the initiative
Comment
Waste recovery This initiative aims at treating 163.15 Scope 3 Voluntary 0 0 <1 year <1 year
Activity type
Description of activity
Estimated annual CO2e
savings (metric tonnes CO2e)
Scope
Voluntary/ Mandatory
Annual monetary savings
(unit currency
- as specified in CC0.4)
Investment required
(unit currency -
as specified in CC0.4)
Payback period
Estimated lifetime of
the initiative
Comment
w aste through revalorization, w hich has a low er emission factor than other treatments such as incineration or landfill. This voluntary activity is linked to the absolute target Abs3 that aims to reduce emissions from w aste generation regarding the subsidiaries Cellnex Group’s companies in Spain.
Low carbon energy installation
The subsidiaries Cellnex Group’s companies in Spain have photovoltaic generation facilities and small-scale w ind turbines on its sites, w hich serve for self-consumption purposes and w hich allow s for Scope 2 emissions reductions. In 2016, 67910.5 kWh w ere generated from these facilities.
25.81
Scope 2 (market-based)
Voluntary 7470 0 <1 year <1 year
The estimated annual CO2e savings have been calculated using the emission factor of Endesa SA.
Energy eff iciency: Processes
Cellnex Group has implemented process improvements in order to achieve energy savings both in Spain and Italy. In Spain, three energy eff iciency projects have been launched, w hich avoided the consumption of 5,083,256 KWh in 2016, w ith regard to consumption f igures for 2015. Some examples of outstanding projects w ere the Arganda
2047.43
Scope 2 (location-based)
Voluntary 410000 2891000 1-3
years 6-10 years
Activity type
Description of activity
Estimated annual CO2e
savings (metric tonnes CO2e)
Scope
Voluntary/ Mandatory
Annual monetary savings
(unit currency
- as specified in CC0.4)
Investment required
(unit currency -
as specified in CC0.4)
Payback period
Estimated lifetime of
the initiative
Comment
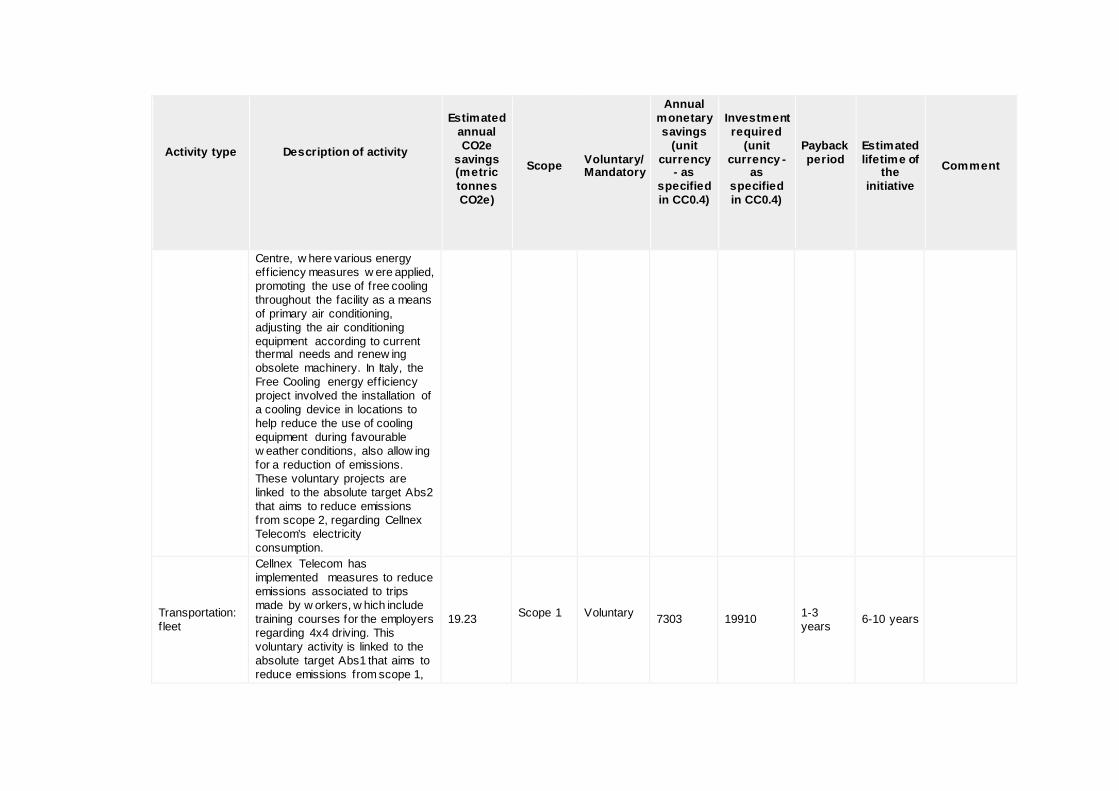
Centre, w here various energy eff iciency measures w ere applied, promoting the use of free cooling throughout the facility as a means of primary air conditioning, adjusting the air conditioning equipment according to current thermal needs and renew ing obsolete machinery. In Italy, the Free Cooling energy eff iciency project involved the installation of a cooling device in locations to help reduce the use of cooling equipment during favourable w eather conditions, also allow ing for a reduction of emissions. These voluntary projects are linked to the absolute target Abs2 that aims to reduce emissions from scope 2, regarding Cellnex Telecom’s electricity consumption.
Transportation: f leet
Cellnex Telecom has implemented measures to reduce emissions associated to trips made by w orkers, w hich include training courses for the employers regarding 4x4 driving. This voluntary activity is linked to the absolute target Abs1 that aims to reduce emissions from scope 1,
19.23 Scope 1
Voluntary 7303 19910 1-3
years 6-10 years
Activity type
Description of activity
Estimated annual CO2e
savings (metric tonnes CO2e)
Scope
Voluntary/ Mandatory
Annual monetary savings
(unit currency
- as specified in CC0.4)
Investment required
(unit currency -
as specified in CC0.4)
Payback period
Estimated lifetime of
the initiative
Comment
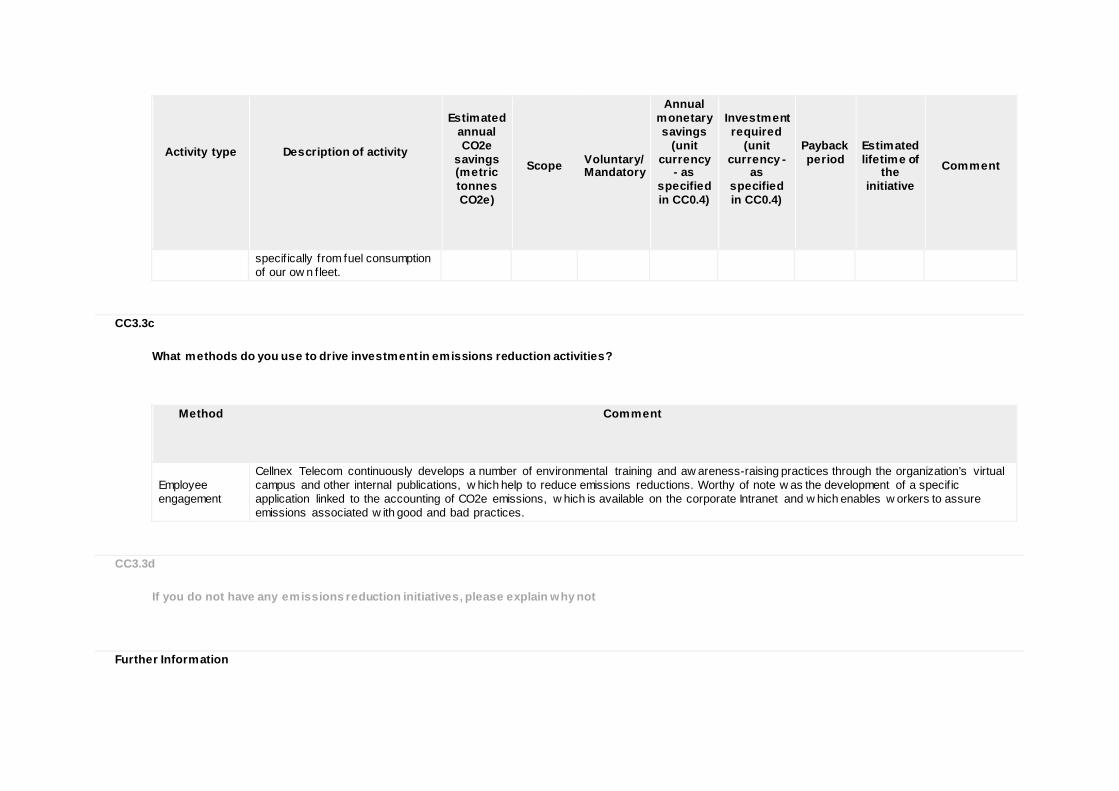
specif ically from fuel consumption of our ow n fleet.
CC3.3c
What methods do you use to drive investment in emissions reduction activities?
Method
Comment
Employee engagement
Cellnex Telecom continuously develops a number of environmental training and aw areness-raising practices through the organization’s virtual campus and other internal publications, w hich help to reduce emissions reductions. Worthy of note w as the development of a specif ic application linked to the accounting of CO2e emissions, w hich is available on the corporate Intranet and w hich enables w orkers to assure emissions associated w ith good and bad practices.
CC3.3d
If you do not have any emissions reduction initiatives, please explain why not
Further Information
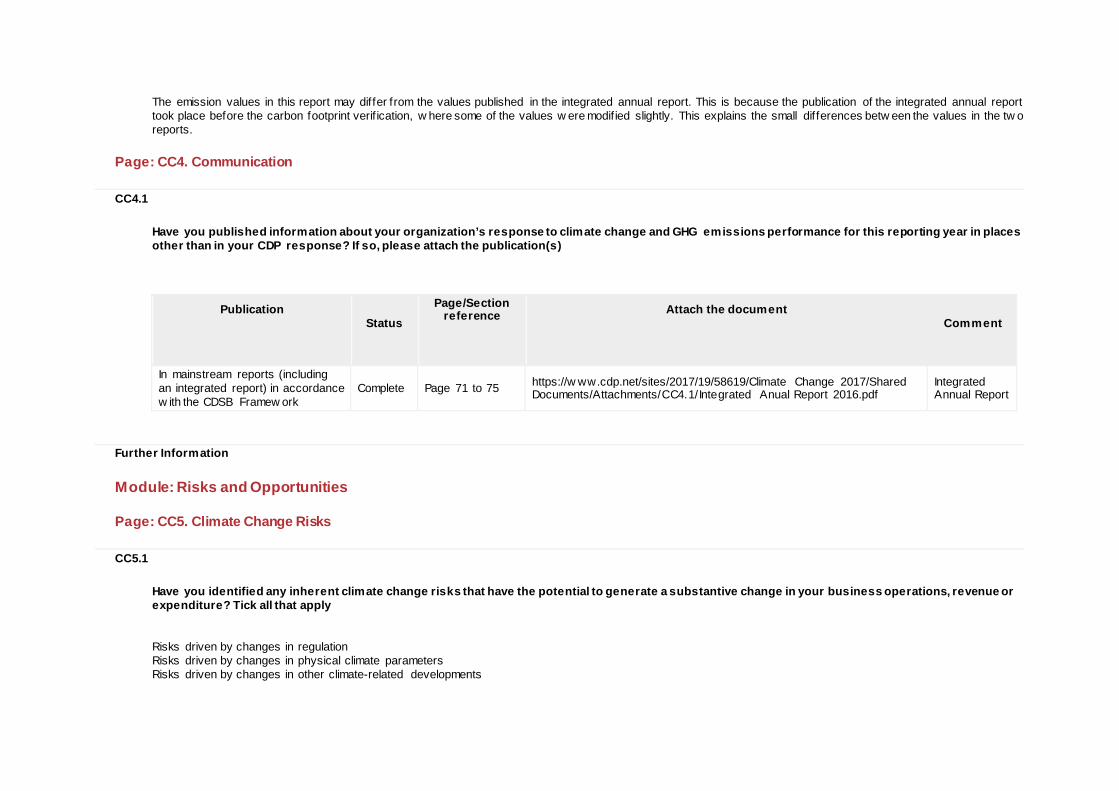
The emission values in this report may differ from the values published in the integrated annual report. This is because the publication of the integrated annual report took place before the carbon footprint verif ication, w here some of the values w ere modif ied slightly. This explains the small differences betw een the values in the tw o reports.
Page: CC4. Communication
CC4.1
Have you published information about your organization’s response to climate change and GHG emissions performance for this reporting year in places other than in your CDP response? If so, please attach the publication(s)
Publication
Status
Page/Section reference
Attach the document
Comment
In mainstream reports (including an integrated report) in accordance w ith the CDSB Framew ork
Complete Page 71 to 75 https://w ww.cdp.net/sites/2017/19/58619/Climate Change 2017/Shared Documents/Attachments/CC4.1/Integrated Anual Report 2016.pdf
Integrated Annual Report
Further Information
Module: Risks and Opportunities
Page: CC5. Climate Change Risks
CC5.1
Have you identified any inherent climate change risks that have the potential to generate a substantive change in your business operations, revenue or expenditure? Tick all that apply Risks driven by changes in regulation Risks driven by changes in physical climate parameters Risks driven by changes in other climate-related developments
CC5.1a
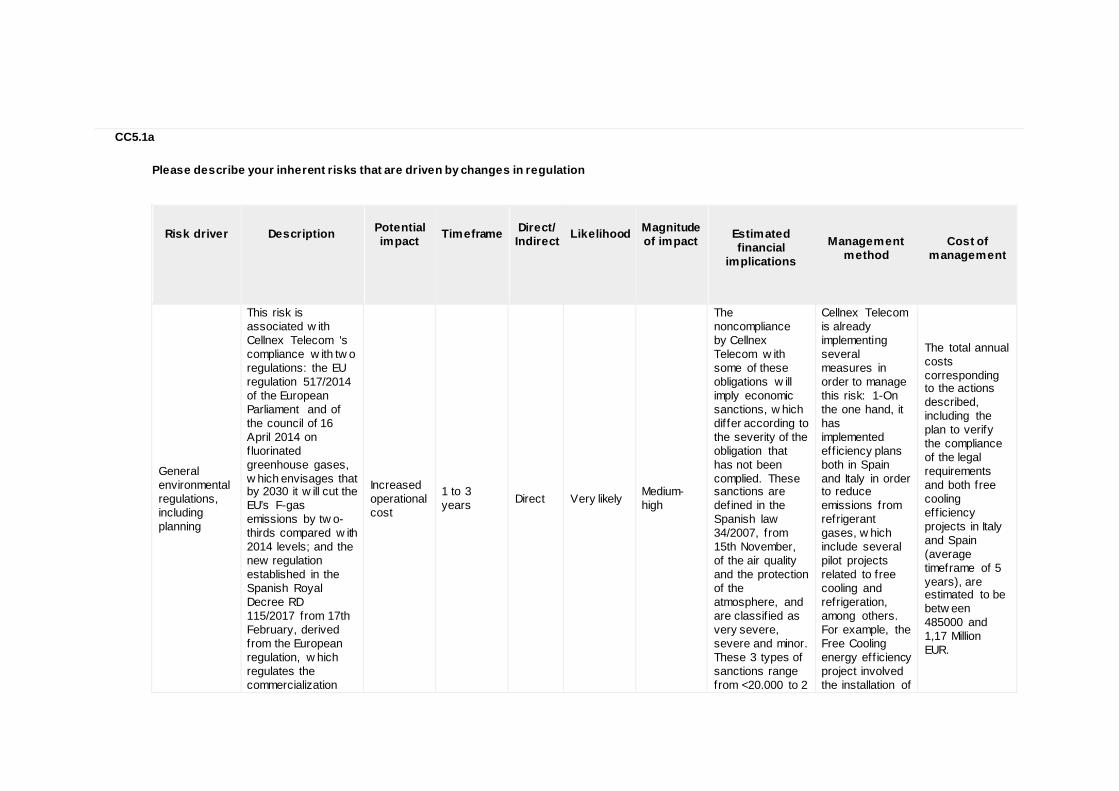
Please describe your inherent risks that are driven by changes in regulation
Risk driver
Description
Potential impact
Timeframe
Direct/ Indirect
Likelihood
Magnitude of impact
Estimated financial
implications
Management
method
Cost of
management
General environmental regulations, including planning
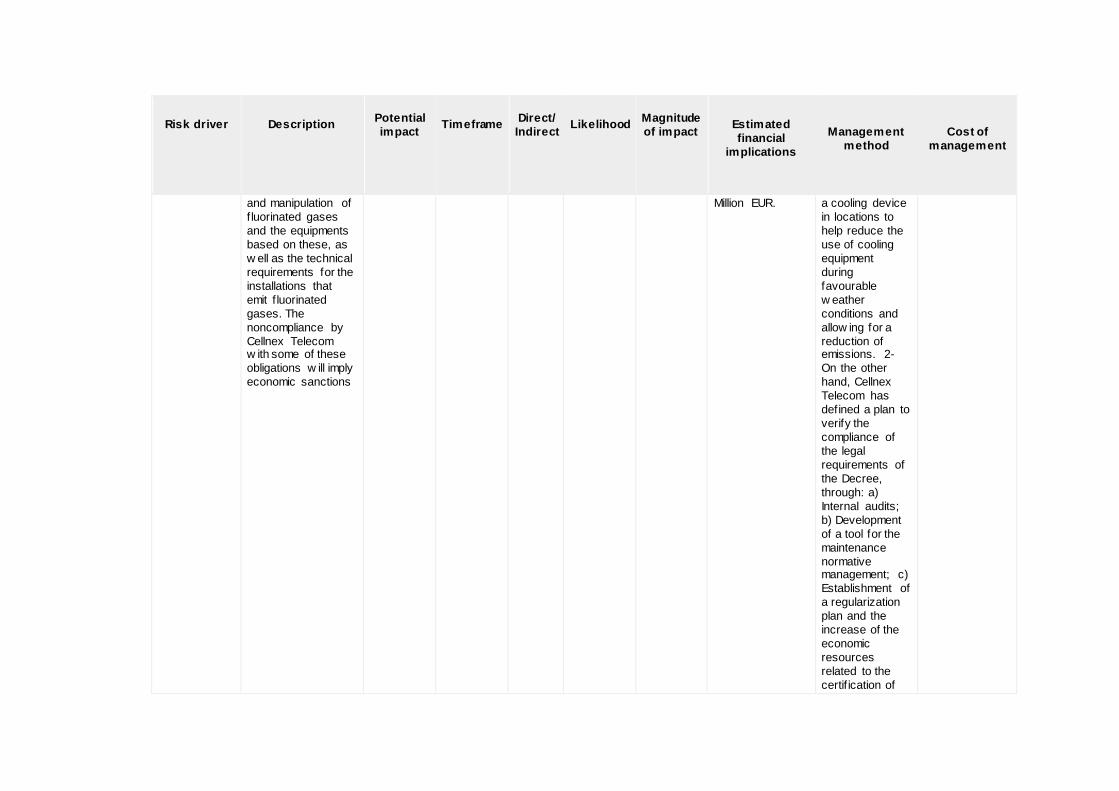
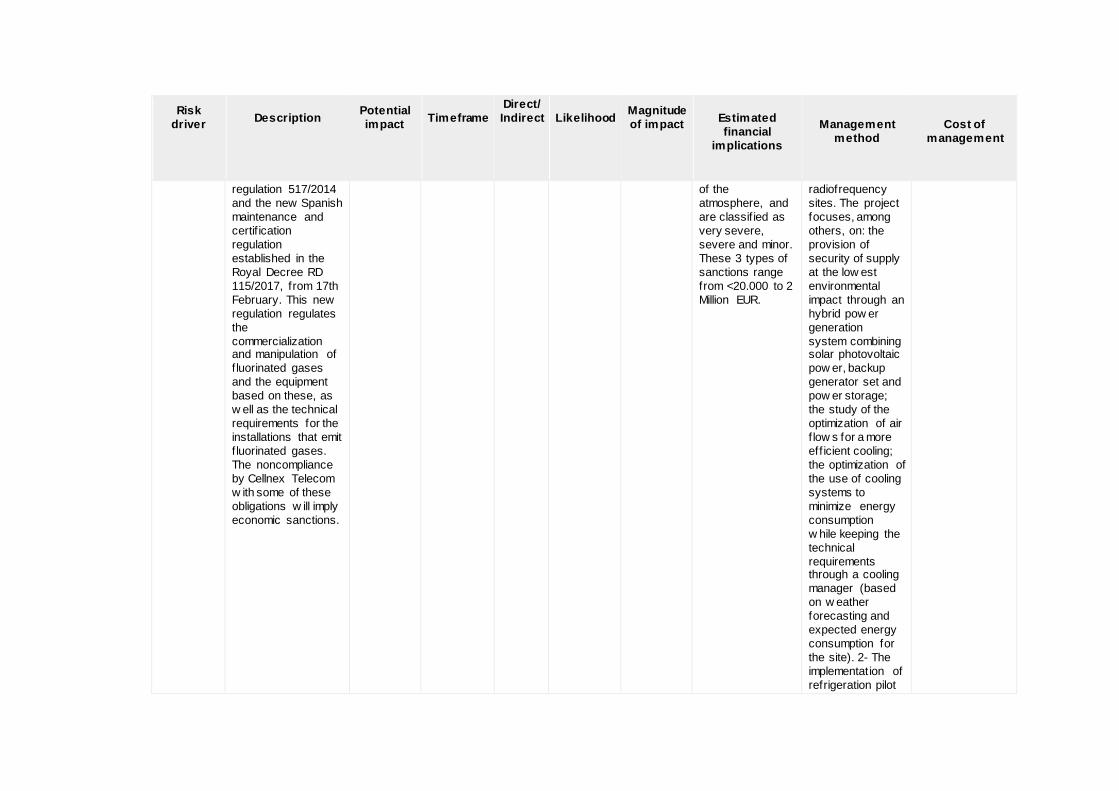
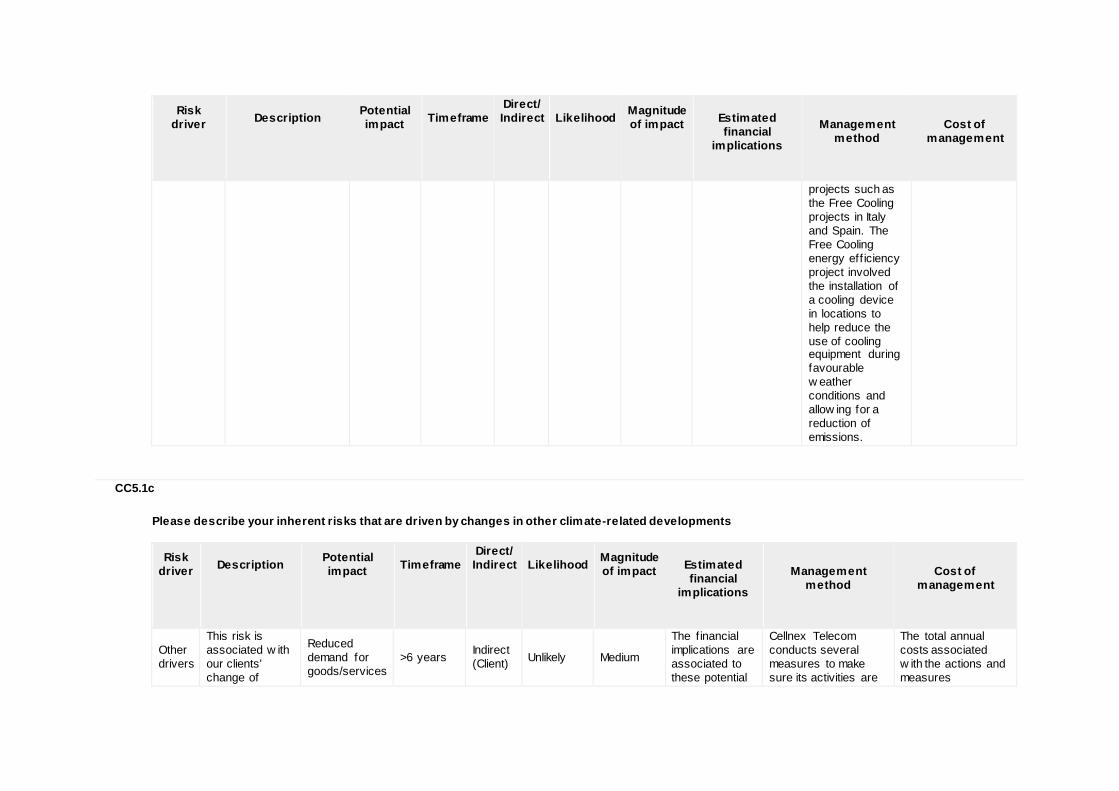
This risk is associated w ith Cellnex Telecom 's compliance w ith tw o regulations: the EU regulation 517/2014 of the European Parliament and of the council of 16 April 2014 on f luorinated greenhouse gases, w hich envisages that by 2030 it w ill cut the EU’s F-gas emissions by tw o-thirds compared w ith 2014 levels; and the new regulation established in the Spanish Royal Decree RD 115/2017 from 17th February, derived from the European regulation, w hich regulates the commercialization
Increased operational cost
1 to 3 years Direct Very likely Medium-
high
The noncompliance by Cellnex Telecom w ith some of these obligations w ill imply economic sanctions, w hich differ according to the severity of the obligation that has not been complied. These sanctions are defined in the Spanish law 34/2007, from 15th November, of the air quality and the protection of the atmosphere, and are classif ied as very severe, severe and minor. These 3 types of sanctions range from <20.000 to 2
Cellnex Telecom is already implementing several measures in order to manage this risk: 1-On the one hand, it has implemented eff iciency plans both in Spain and Italy in order to reduce emissions from refrigerant gases, w hich include several pilot projects related to free cooling and refrigeration, among others. For example, the Free Cooling energy eff iciency project involved the installation of
The total annual costs corresponding to the actions described, including the plan to verify the compliance of the legal requirements and both free cooling eff iciency projects in Italy and Spain (average timeframe of 5 years), are estimated to be betw een 485000 and 1,17 Million EUR.
Risk driver
Description
Potential impact
Timeframe
Direct/ Indirect
Likelihood
Magnitude of impact
Estimated financial
implications
Management
method
Cost of
management
and manipulation of f luorinated gases and the equipments based on these, as w ell as the technical requirements for the installations that emit f luorinated gases. The noncompliance by Cellnex Telecom w ith some of these obligations w ill imply economic sanctions
Million EUR. a cooling device in locations to help reduce the use of cooling equipment during favourable w eather conditions and allow ing for a reduction of emissions. 2- On the other hand, Cellnex Telecom has defined a plan to verify the compliance of the legal requirements of the Decree, through: a) Internal audits; b) Development of a tool for the maintenance normative management; c) Establishment of a regularization plan and the increase of the economic resources related to the certif ication of
Risk driver
Description
Potential impact
Timeframe
Direct/ Indirect
Likelihood
Magnitude of impact
Estimated financial
implications
Management
method
Cost of
management
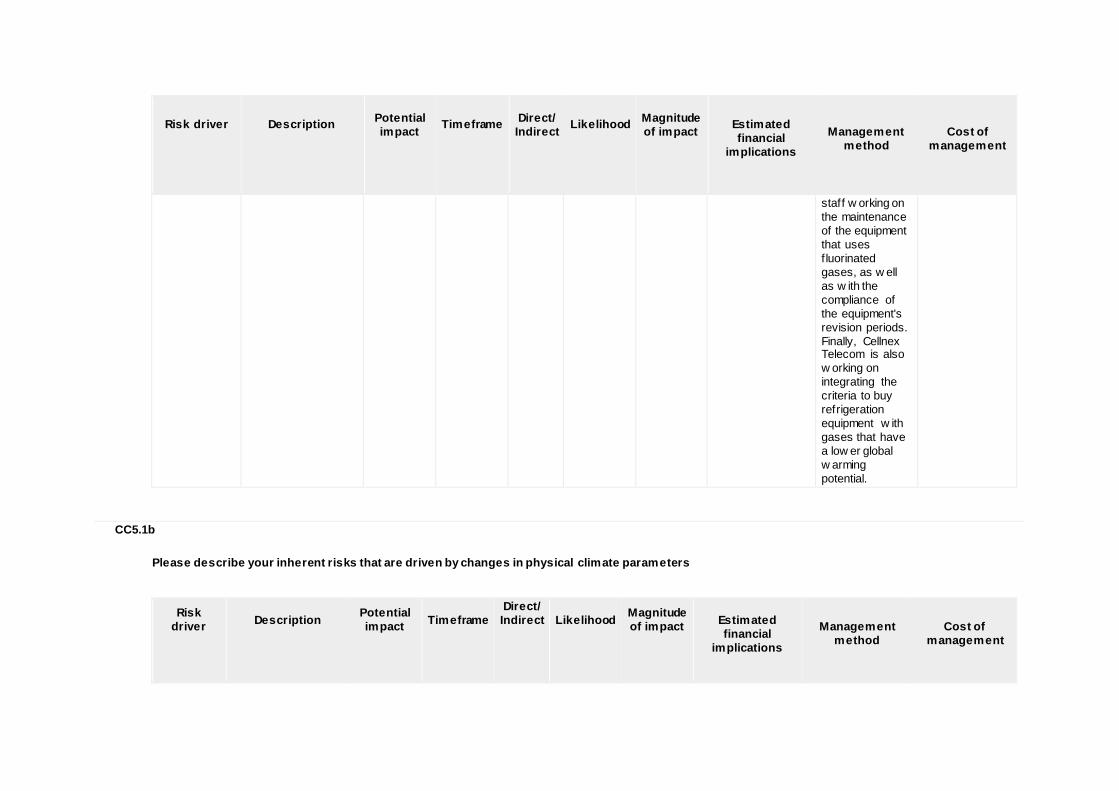
staff w orking on the maintenance of the equipment that uses f luorinated gases, as w ell as w ith the compliance of the equipment's revision periods. Finally, Cellnex Telecom is also w orking on integrating the criteria to buy refrigeration equipment w ith gases that have a low er global w arming potential.
CC5.1b
Please describe your inherent risks that are driven by changes in physical climate parameters
Risk driver
Description
Potential impact
Timeframe
Direct/ Indirect
Likelihood
Magnitude of impact
Estimated financial
implications
Management
method
Cost of
management
Risk driver
Description
Potential impact
Timeframe
Direct/ Indirect
Likelihood
Magnitude of impact
Estimated financial
implications
Management
method
Cost of
management
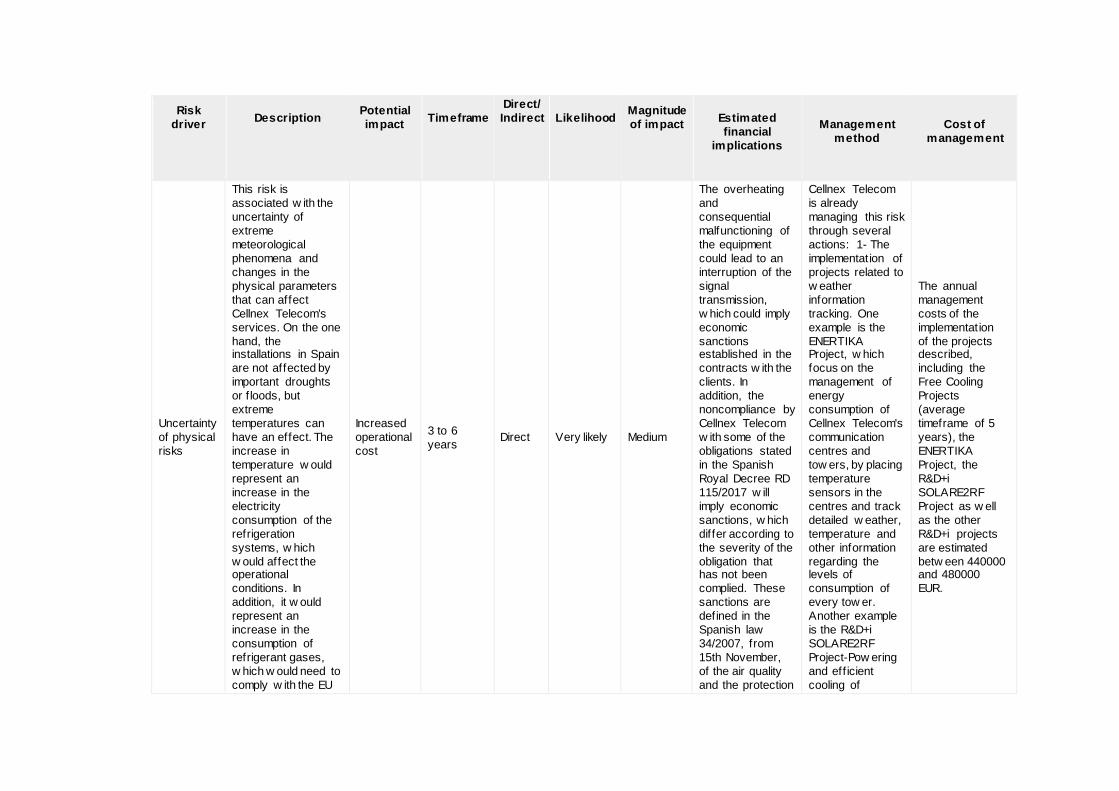
Uncertainty of physical risks
This risk is associated w ith the uncertainty of extreme meteorological phenomena and changes in the physical parameters that can affect Cellnex Telecom’s services. On the one hand, the installations in Spain are not affected by important droughts or f loods, but extreme temperatures can have an effect. The increase in temperature w ould represent an increase in the electricity consumption of the refrigeration systems, w hich w ould affect the operational conditions. In addition, it w ould represent an increase in the consumption of refrigerant gases, w hich w ould need to comply w ith the EU
Increased operational cost
3 to 6 years Direct Very likely Medium
The overheating and consequential malfunctioning of the equipment could lead to an interruption of the signal transmission, w hich could imply economic sanctions established in the contracts w ith the clients. In addition, the noncompliance by Cellnex Telecom w ith some of the obligations stated in the Spanish Royal Decree RD 115/2017 w ill imply economic sanctions, w hich differ according to the severity of the obligation that has not been complied. These sanctions are defined in the Spanish law 34/2007, from 15th November, of the air quality and the protection
Cellnex Telecom is already managing this risk through several actions: 1- The implementation of projects related to w eather information tracking. One example is the ENERTIKA Project, w hich focus on the management of energy consumption of Cellnex Telecom's communication centres and tow ers, by placing temperature sensors in the centres and track detailed w eather, temperature and other information regarding the levels of consumption of every tow er. Another example is the R&D+i SOLARE2RF Project-Pow ering and eff icient cooling of
The annual management costs of the implementation of the projects described, including the Free Cooling Projects (average timeframe of 5 years), the ENERTIKA Project, the R&D+i SOLARE2RF Project as w ell as the other R&D+i projects are estimated betw een 440000 and 480000 EUR.
Risk driver
Description
Potential impact
Timeframe
Direct/ Indirect
Likelihood
Magnitude of impact
Estimated financial
implications
Management
method
Cost of
management
regulation 517/2014 and the new Spanish maintenance and certif ication regulation established in the Royal Decree RD 115/2017, from 17th February. This new regulation regulates the commercialization and manipulation of f luorinated gases and the equipment based on these, as w ell as the technical requirements for the installations that emit f luorinated gases. The noncompliance by Cellnex Telecom w ith some of these obligations w ill imply economic sanctions.
of the atmosphere, and are classif ied as very severe, severe and minor. These 3 types of sanctions range from <20.000 to 2 Million EUR.
radiofrequency sites. The project focuses, among others, on: the provision of security of supply at the low est environmental impact through an hybrid pow er generation system combining solar photovoltaic pow er, backup generator set and pow er storage; the study of the optimization of air f low s for a more eff icient cooling; the optimization of the use of cooling systems to minimize energy consumption w hile keeping the technical requirements through a cooling manager (based on w eather forecasting and expected energy consumption for the site). 2- The implementation of refrigeration pilot
Risk driver
Description
Potential impact
Timeframe
Direct/ Indirect
Likelihood
Magnitude of impact
Estimated financial
implications
Management
method
Cost of
management
projects such as the Free Cooling projects in Italy and Spain. The Free Cooling energy eff iciency project involved the installation of a cooling device in locations to help reduce the use of cooling equipment during favourable w eather conditions and allow ing for a reduction of emissions.
CC5.1c
Please describe your inherent risks that are driven by changes in other climate-related developments
Risk driver
Description
Potential impact
Timeframe
Direct/ Indirect
Likelihood
Magnitude of impact
Estimated financial
implications
Management
method
Cost of
management
Other drivers
This risk is associated w ith our clients' change of
Reduced demand for goods/services
>6 years Indirect (Client) Unlikely Medium
The f inancial implications are associated to these potential
Cellnex Telecom conducts several measures to make sure its activities are
The total annual costs associated w ith the actions and measures
Risk driver
Description
Potential impact
Timeframe
Direct/ Indirect
Likelihood
Magnitude of impact
Estimated financial
implications
Management
method
Cost of
management
behaviour and Cellnex Telecom’s failure to provide them information about their environmental impact, carbon footprint, among other related issues. Our clients pay more and more attention to their consumption and environmental impact, w hich could lead them to demand higher energy eff iciency from Cellnex Telecom so they could reduce costs and consumption as w ell as demand more information about its carbon footprint. If Cellnex Telecom does not fulf il this and does not provide
economic penalizations by our clients in case Cellnex Telecom failed to provide them w ith the information they demanded, as w ell as the f inancial implications derived from not participating in the CDP questionnaire and report the required information. The f inancial implications associated are estimated to be betw een 13000 and 2 Million EUR..
sustainable and respect the environment and to inform its clients about its actions tow ards the preservation of the environment and its commitment to the f ight against climate change. Examples of these measures are: 1- Publication of the Integrated Annual Report (GRI standards); 2- Calculation and publication of our carbon footprint; 3- Implementation of the online tool Clean CO2, a softw are application that allow s the calculation of the carbon footprint and the offset of emissions of the Groups' companies and also of the services it offers. Clean CO2 gives the client company the capability to offset GHG emissions and obtain a document certifying that the service offered to the customer is neutral in
described, including the publication of the Integrated Annual Report, the calculation and publication of our carbon footprint, the implementation of the online tool Clean CO2, the annual reporting in sustainability indexes and the participation in R&D+i projects such as the GROWSMA RTER Project, are estimated to be around 820000 EUR.
Risk driver
Description
Potential impact
Timeframe
Direct/ Indirect
Likelihood
Magnitude of impact
Estimated financial
implications
Management
method
Cost of
management
the requirements requested by our clients regarding, for example, information about their carbon footprint, low carbon and eco-friendly products and services, this could potentially lead to economic penalizations by our clients.
terms of GHG emissions. 4- Annual reporting Cellnex Telecom 's environmental performance in sustainability indexes and international organisations, including Carbon Disclosure Project, Dow Jones Sustainability Index, UN Global Compact, FTSE Russell. 5- Participation in the I+D+i GROWSMA RTER Project (2015- 2019), w here Cellnex Telecom assumes the role of benchmark partner in the ICT field, contributing on the design and implementation of the telecommunications infrastructure in the City of Barcelona needed to carry out the measures, pilots and demonstrations in the f ield of Energy Eff iciency and Sustainable Urban Mobility.
CC5.1d
Please explain why you do not consider your company to be exposed to inherent risks driven by changes in regulation that have the potential to generate a substantive change in your business operations, revenue or expenditure
CC5.1e
Please explain why you do not consider your company to be exposed to inherent risks driven by changes in physical climate parameters that have the potential to generate a substantive change in your business operations, revenue or expenditure
CC5.1f
Please explain why you do not consider your company to be exposed to inherent risks driven by changes in other climate-related developments that have the potential to generate a substantive change in your business operations, revenue or expenditure
Further Information
Cellnex Telecom is currently in the process of developing a deep w ork regarding the R&O derived from climate change that can affect the Group.
Page: CC6. Climate Change Opportunities
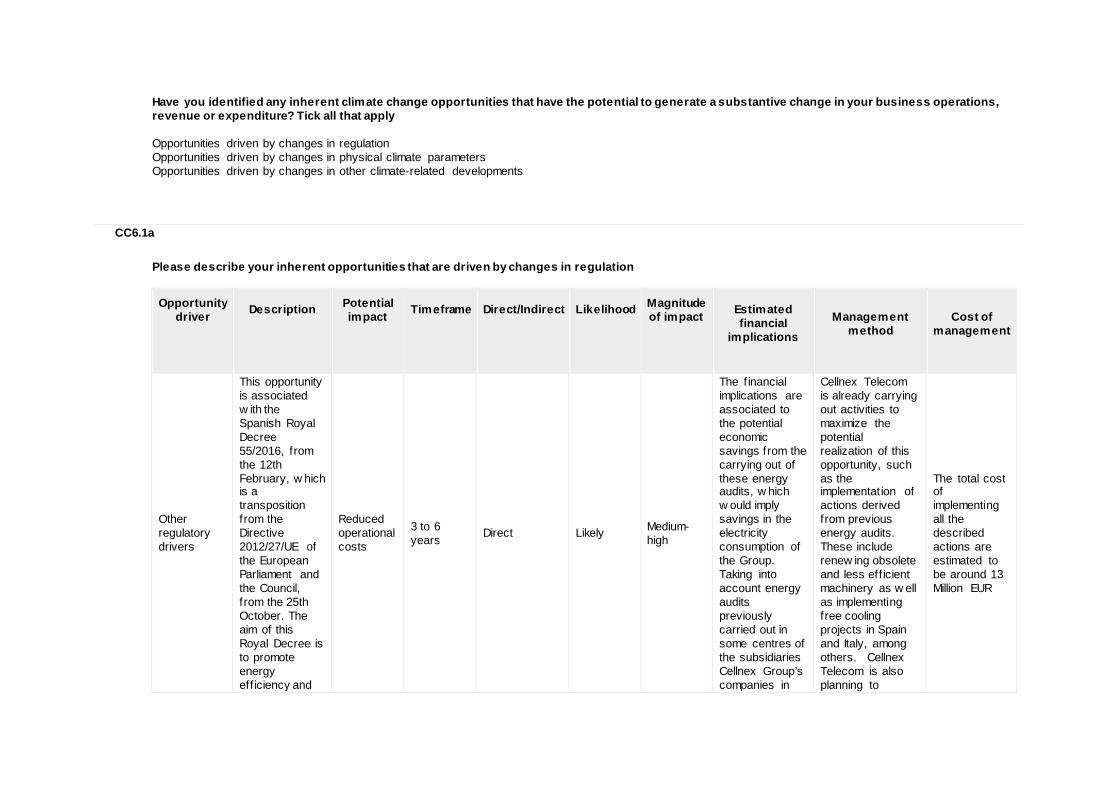
CC6.1
Have you identified any inherent climate change opportunities that have the potential to generate a substantive change in your business operations, revenue or expenditure? Tick all that apply Opportunities driven by changes in regulation Opportunities driven by changes in physical climate parameters Opportunities driven by changes in other climate-related developments
CC6.1a
Please describe your inherent opportunities that are driven by changes in regulation
Opportunity driver
Description
Potential impact
Timeframe
Direct/Indirect
Likelihood
Magnitude of impact
Estimated financial
implications
Management
method
Cost of
management
Other regulatory drivers
This opportunity is associated w ith the Spanish Royal Decree 55/2016, from the 12th February, w hich is a transposition from the Directive 2012/27/UE of the European Parliament and the Council, from the 25th October. The aim of this Royal Decree is to promote energy eff iciency and
Reduced operational costs
3 to 6 years Direct Likely Medium-
high
The f inancial implications are associated to the potential economic savings from the carrying out of these energy audits, w hich w ould imply savings in the electricity consumption of the Group. Taking into account energy audits previously carried out in some centres of the subsidiaries Cellnex Group’s companies in
Cellnex Telecom is already carrying out activities to maximize the potential realization of this opportunity, such as the implementation of actions derived from previous energy audits. These include renew ing obsolete and less eff icient machinery as w ell as implementing free cooling projects in Spain and Italy, among others. Cellnex Telecom is also planning to
The total cost of implementing all the described actions are estimated to be around 13 Million EUR
Opportunity driver
Description
Potential impact
Timeframe
Direct/Indirect
Likelihood
Magnitude of impact
Estimated financial
implications
Management
method
Cost of
management
optimize energy demand in installations, equipment or energy consuming systems and it implies the carrying out of energy audits. This is seen as an opportunity for Cellnex Telecom as the carrying out of energy audits w ould imply energy savings for the Group and it w ould also be an incentive to invest in energy eff iciency even more.
Spain, the potential annual energy savings per centre w ould be around 6% on average. This energy saving w ould allow Cellnex Telecom to potentially save around 2-3 million EUR annually.
undertake several energy eff iciency measures in the next years, included in the 2015-2020 target related to energy eff iciency explained in question CC3.1a. These include the acquisition of higher eff icient UPS (Uninterruptible pow er supply), the substitution of separator transformers by electrical protections, among others, w hich w ill allow for a reduction of electricity consumption.
CC6.1b
Please describe your inherent opportunities that are driven by changes in physical climate parameters
Opportunity driver
Description
Potential impact
Timeframe
Direct/ Indirect
Likelihood
Magnitude of impact
Estimated financial
implications
Management
method
Cost of
management
Other physical climate opportunities
This opportunity is associated to changes in physical parameters such as temperature that could affect the communication centres leading to higher energy consumption or functioning problems resulting in the disturbance or interruption of the transmission signal. This is seen as an investment opportunity to develop new products and services for our clients that can track w eather conditions information in order to be alerted in the event of over-consumption and thus be able to manage energy consumption. In addition to develop new monitoring technologies, it is also an opportunity to support research projects related to
Investment opportunities
1 to 3 years Direct Very
unlikely Medium
The f inancial implications are related to the estimated profit from the demand of these new products and services related to climate monitoring. This profit is estimated from the income of similar products developed in the previous year. Therefore, the estimated f inancial implications of this opportunity are around 2 Million EUR.
Cellnex Telecom already participates in several R&D+i projects such as the SOLARE2RF Project (pow ering and eff icient cooling of radiofrequency sites) and ENERTIKA (management of energy consumption of Cellnex Telecom’s communication centres and tow ers). Cellnex Telecom's commitment to R&D+i represents one of the main challenges for the Group in the current global context and to respond to these challenges in an effective and structured w ay, Cellnex Telecom formally set up its Innovation and Product Strategy Department in 2016. That decision reflects an
The total cost of implementing the described actions are estimated betw een 700000 and 9 Million EUR in a timeframe of 5 years.
Opportunity driver
Description
Potential impact
Timeframe
Direct/ Indirect
Likelihood
Magnitude of impact
Estimated financial
implications
Management
method
Cost of
management
the transmission of signals.
aw areness that innovation is a critical activity w hich commits areas to cross-cutting product and service creation processes. The Innovation and Product Strategy Department has established an R&D+i management model based on tw o types: 1-Technological surveillance, based on an evaluation of the current technological context to identify potential opportunities for the company. 2-R&D+i activities, consisting mainly of research, development and the creation of new solutions.
CC6.1c
Please describe your inherent opportunities that are driven by changes in other climate-related developments
Opportunity driver
Description
Potential impact
Timeframe
Direct/ Indirect
Likelihood
Magnitude of impact
Estimated financial
implications
Management
method
Cost of
management
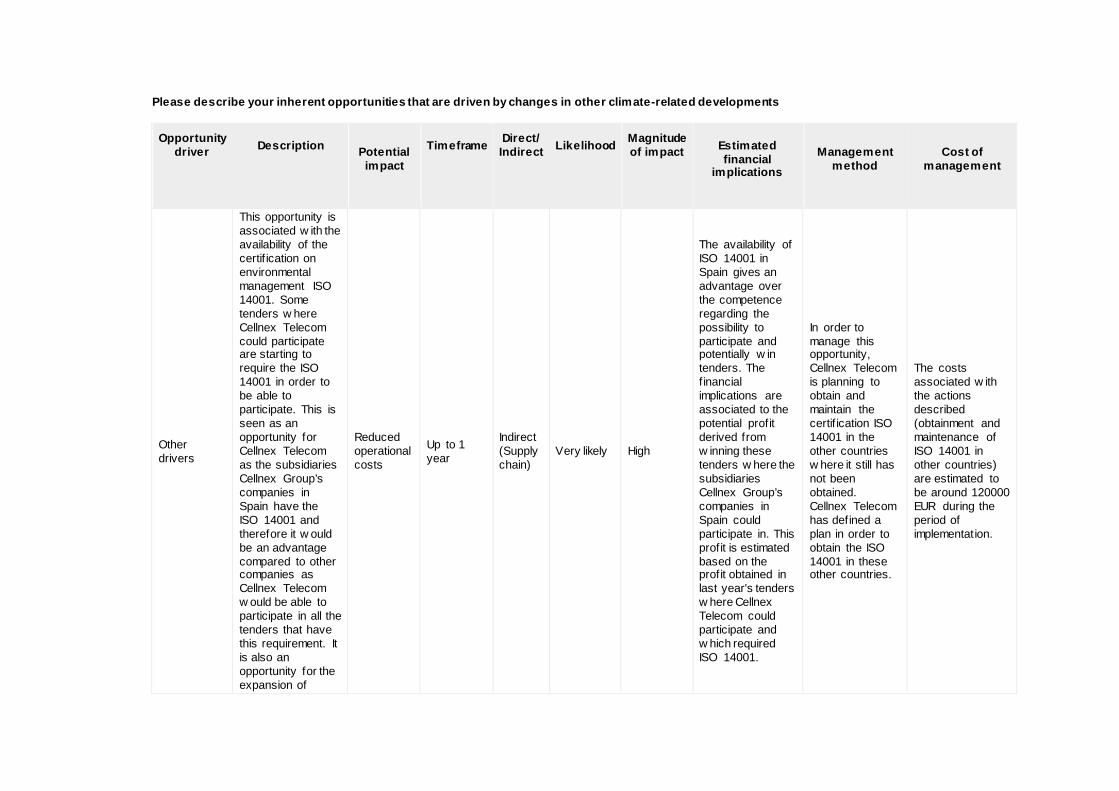
Other drivers
This opportunity is associated w ith the availability of the certif ication on environmental management ISO 14001. Some tenders w here Cellnex Telecom could participate are starting to require the ISO 14001 in order to be able to participate. This is seen as an opportunity for Cellnex Telecom as the subsidiaries Cellnex Group’s companies in Spain have the ISO 14001 and therefore it w ould be an advantage compared to other companies as Cellnex Telecom w ould be able to participate in all the tenders that have this requirement. It is also an opportunity for the expansion of
Reduced operational costs
Up to 1 year
Indirect (Supply chain)
Very likely High
The availability of ISO 14001 in Spain gives an advantage over the competence regarding the possibility to participate and potentially w in tenders. The f inancial implications are associated to the potential profit derived from w inning these tenders w here the subsidiaries Cellnex Group’s companies in Spain could participate in. This profit is estimated based on the profit obtained in last year's tenders w here Cellnex Telecom could participate and w hich required ISO 14001.
In order to manage this opportunity, Cellnex Telecom is planning to obtain and maintain the certif ication ISO 14001 in the other countries w here it still has not been obtained. Cellnex Telecom has defined a plan in order to obtain the ISO 14001 in these other countries.
The costs associated w ith the actions described (obtainment and maintenance of ISO 14001 in other countries) are estimated to be around 120000 EUR during the period of implementation.
Opportunity driver
Description
Potential impact
Timeframe
Direct/ Indirect
Likelihood
Magnitude of impact
Estimated financial
implications
Management
method
Cost of
management
Cellnex Telecom's activities to have the ISO 14001 available, w hich again w ould allow them to have an advantage compared to other companies as they w ould be able to participate in more tenders.
CC6.1d
Please explain why you do not consider your company to be exposed to inherent opportunities driven by changes in regulation that have the potential to generate a substantive change in your business operations, revenue or expenditure
CC6.1e
Please explain why you do not consider your company to be exposed to inherent opportunities driven by changes in physical climate parameters that have the potential to generate a substantive change in your business operations, revenue or expenditure
CC6.1f
Please explain why you do not consider your company to be exposed to inherent opportunities driven by changes in other climate-related developments that have the potential to generate a substantive change in your business operations, revenue or expenditure
Further Information
Cellnex Telecom is currently in the process of developing a deep w ork regarding the R&O derived from climate change that can affect the Group.
Module: GHG Emissions Accounting, Energy and Fuel Use, and Trading
Page: CC7. Emissions Methodology
CC7.1
Please provide your base year and base year emissions (Scopes 1 and 2)
Scope
Base year
Base year emissions (metric tonnes CO2e)
Scope 1 Thu 01 Jan 2015 - Thu 31 Dec 2015
2575.89
Scope 2 (location-based)
Scope 2 (market-based) Thu 01 Jan 2015 - Thu 31 Dec 2015
51458.34
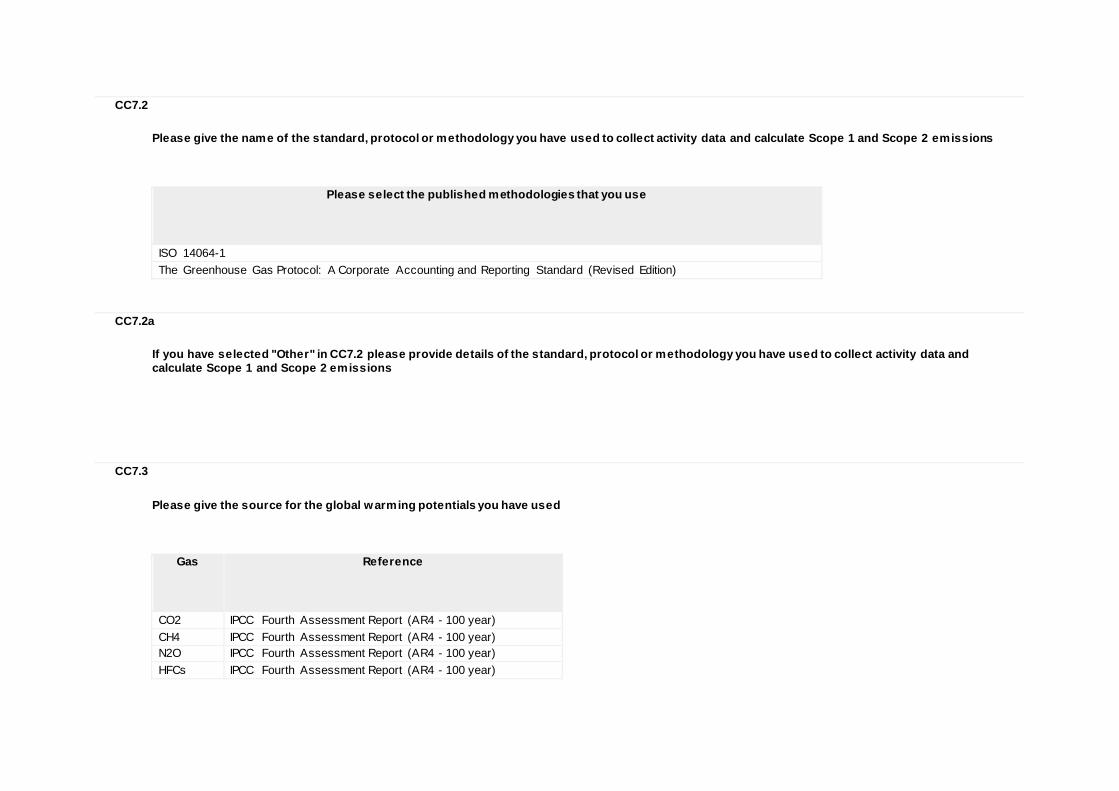
CC7.2
Please give the name of the standard, protocol or methodology you have used to collect activity data and calculate Scope 1 and Scope 2 emissions
Please select the published methodologies that you use
ISO 14064-1 The Greenhouse Gas Protocol: A Corporate Accounting and Reporting Standard (Revised Edition)
CC7.2a
If you have selected "Other" in CC7.2 please provide details of the standard, protocol or methodology you have used to collect activity data and calculate Scope 1 and Scope 2 emissions
CC7.3
Please give the source for the global warming potentials you have used
Gas
Reference
CO2 IPCC Fourth Assessment Report (AR4 - 100 year) CH4 IPCC Fourth Assessment Report (AR4 - 100 year) N2O IPCC Fourth Assessment Report (AR4 - 100 year) HFCs IPCC Fourth Assessment Report (AR4 - 100 year)
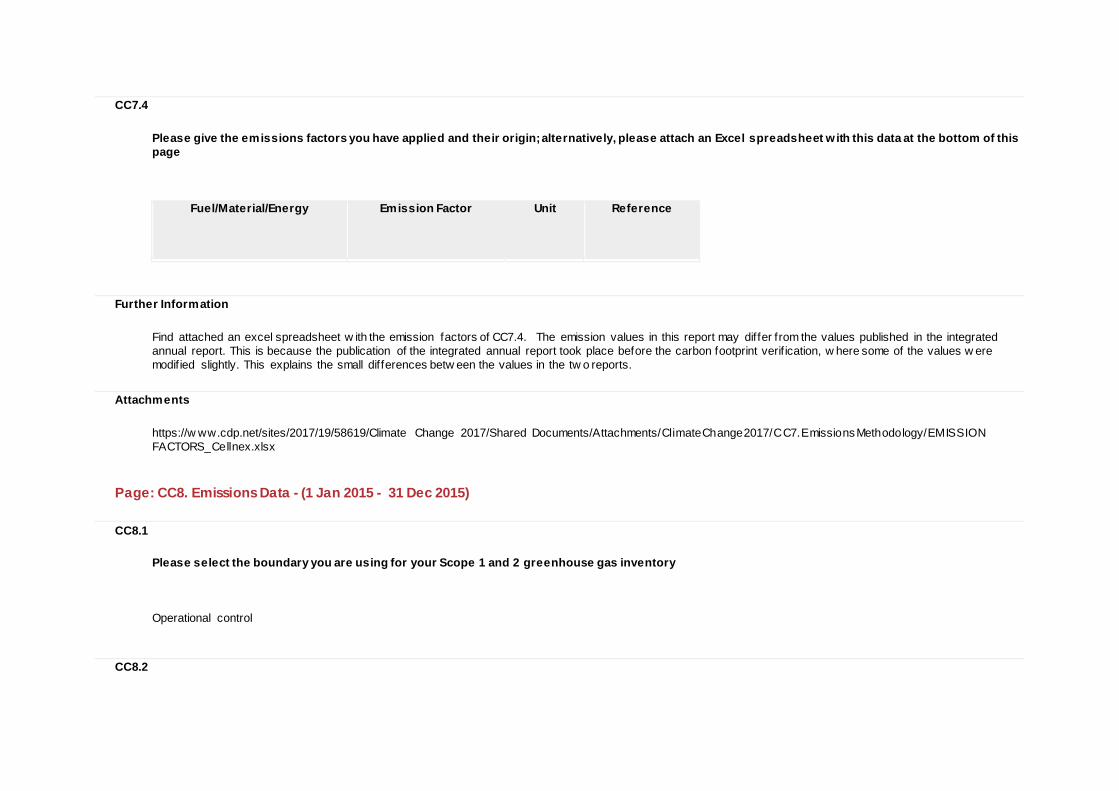
CC7.4
Please give the emissions factors you have applied and their origin; alternatively, please attach an Excel spreadsheet w ith this data at the bottom of this page
Fuel/Material/Energy
Emission Factor
Unit
Reference
Further Information
Find attached an excel spreadsheet w ith the emission factors of CC7.4. The emission values in this report may differ from the values published in the integrated annual report. This is because the publication of the integrated annual report took place before the carbon footprint verif ication, w here some of the values w ere modif ied slightly. This explains the small differences betw een the values in the tw o reports.
Attachments
https://w ww.cdp.net/sites/2017/19/58619/Climate Change 2017/Shared Documents/Attachments/ClimateChange2017/CC7.EmissionsMethodology/EMISSION FACTORS_Cellnex.xlsx
Page: CC8. Emissions Data - (1 Jan 2015 - 31 Dec 2015)
CC8.1
Please select the boundary you are using for your Scope 1 and 2 greenhouse gas inventory Operational control
CC8.2

Please provide your gross global Scope 1 emissions figures in metric tonnes CO2e 2575.89
CC8.3
Please describe your approach to reporting Scope 2 emissions
Scope 2, location-based
Scope 2, market-based
Comment
We are not reporting a Scope 2, location-based f igure We are reporting a Scope 2, market-based f igure
CC8.3a
Please provide your gross global Scope 2 emissions figures in metric tonnes CO2e
Scope 2, location-based
Scope 2, market-based (if applicable)
Comment
51458.34
CC8.4
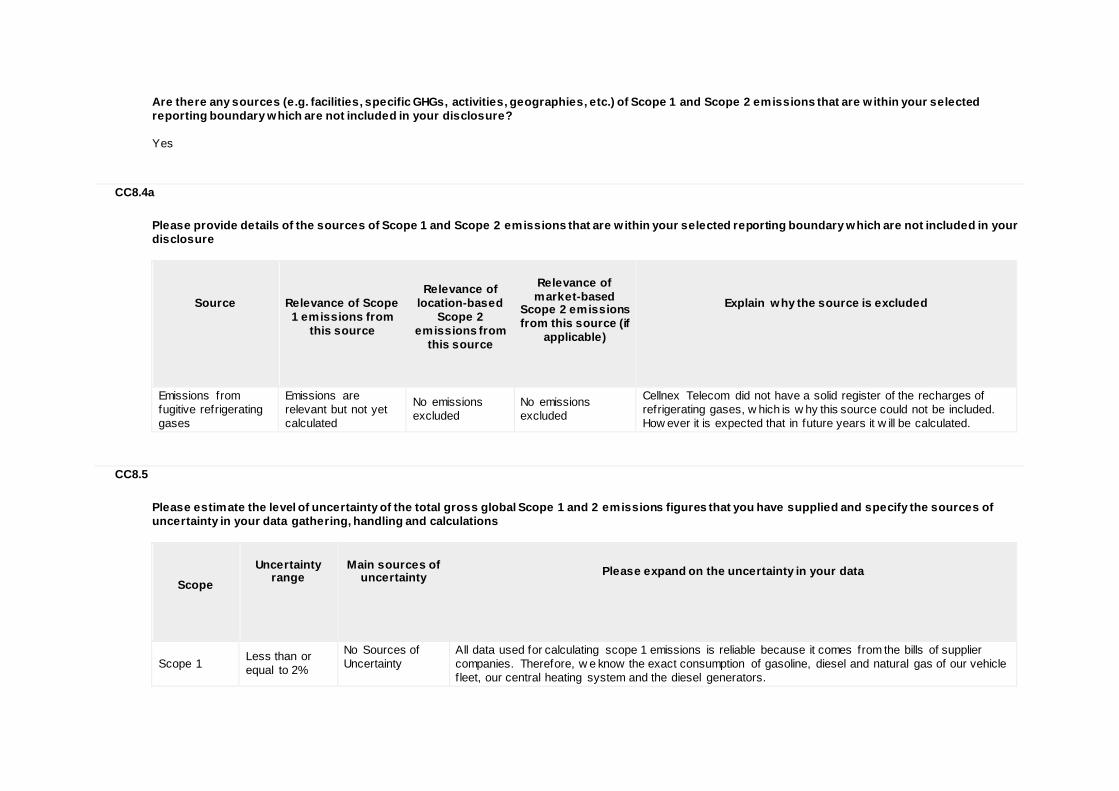
Are there any sources (e.g. facilities, specific GHGs, activities, geographies, etc.) of Scope 1 and Scope 2 emissions that are w ithin your selected reporting boundary which are not included in your disclosure? Yes
CC8.4a
Please provide details of the sources of Scope 1 and Scope 2 emissions that are w ithin your selected reporting boundary which are not included in your disclosure
Source
Relevance of Scope 1 emissions from
this source
Relevance of
location-based Scope 2
emissions from this source
Relevance of market-based
Scope 2 emissions from this source (if
applicable)
Explain why the source is excluded
Emissions from fugitive refrigerating gases
Emissions are relevant but not yet calculated
No emissions excluded
No emissions excluded
Cellnex Telecom did not have a solid register of the recharges of refrigerating gases, w hich is w hy this source could not be included. How ever it is expected that in future years it w ill be calculated.
CC8.5
Please estimate the level of uncertainty of the total gross global Scope 1 and 2 emissions figures that you have supplied and specify the sources of uncertainty in your data gathering, handling and calculations
Scope
Uncertainty
range
Main sources of
uncertainty
Please expand on the uncertainty in your data
Scope 1 Less than or equal to 2%
No Sources of Uncertainty
All data used for calculating scope 1 emissions is reliable because it comes from the bills of supplier companies. Therefore, w e know the exact consumption of gasoline, diesel and natural gas of our vehicle f leet, our central heating system and the diesel generators.
Scope
Uncertainty
range
Main sources of
uncertainty
Please expand on the uncertainty in your data
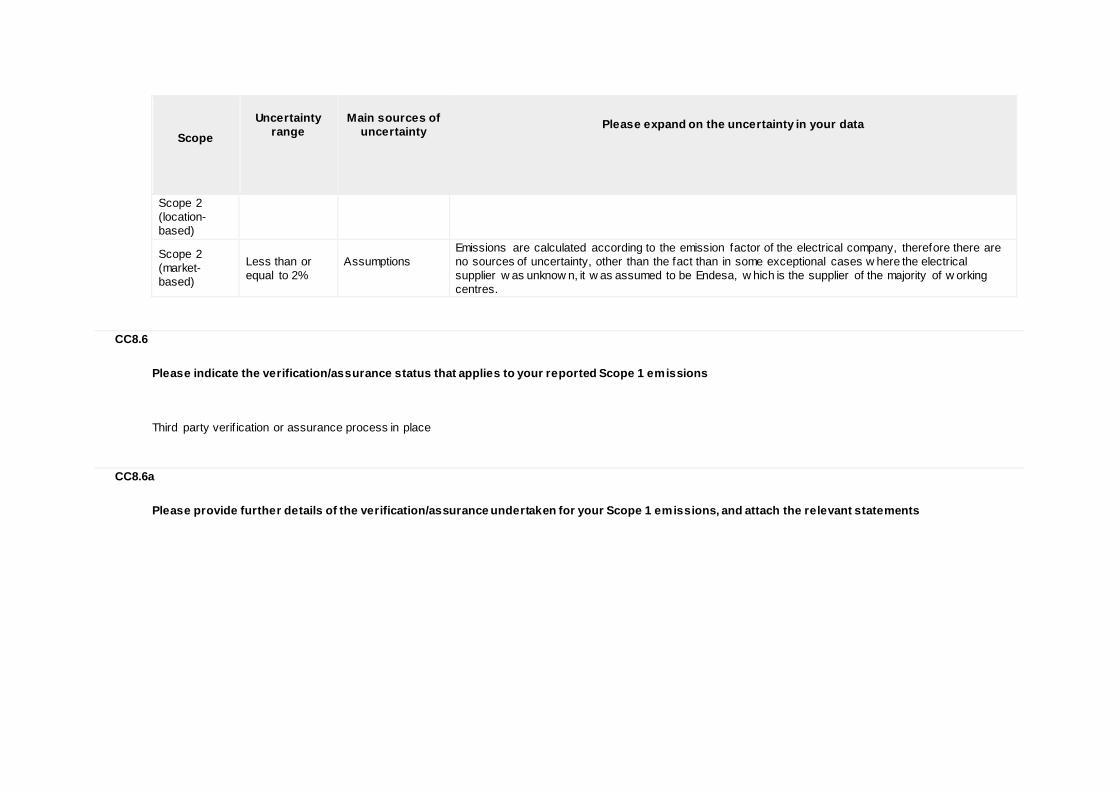
Scope 2 (location-based)
Scope 2 (market-based)
Less than or equal to 2%
Assumptions
Emissions are calculated according to the emission factor of the electrical company, therefore there are no sources of uncertainty, other than the fact than in some exceptional cases w here the electrical supplier w as unknow n, it w as assumed to be Endesa, w hich is the supplier of the majority of w orking centres.
CC8.6
Please indicate the verification/assurance status that applies to your reported Scope 1 emissions Third party verif ication or assurance process in place
CC8.6a
Please provide further details of the verification/assurance undertaken for your Scope 1 emissions, and attach the relevant statements
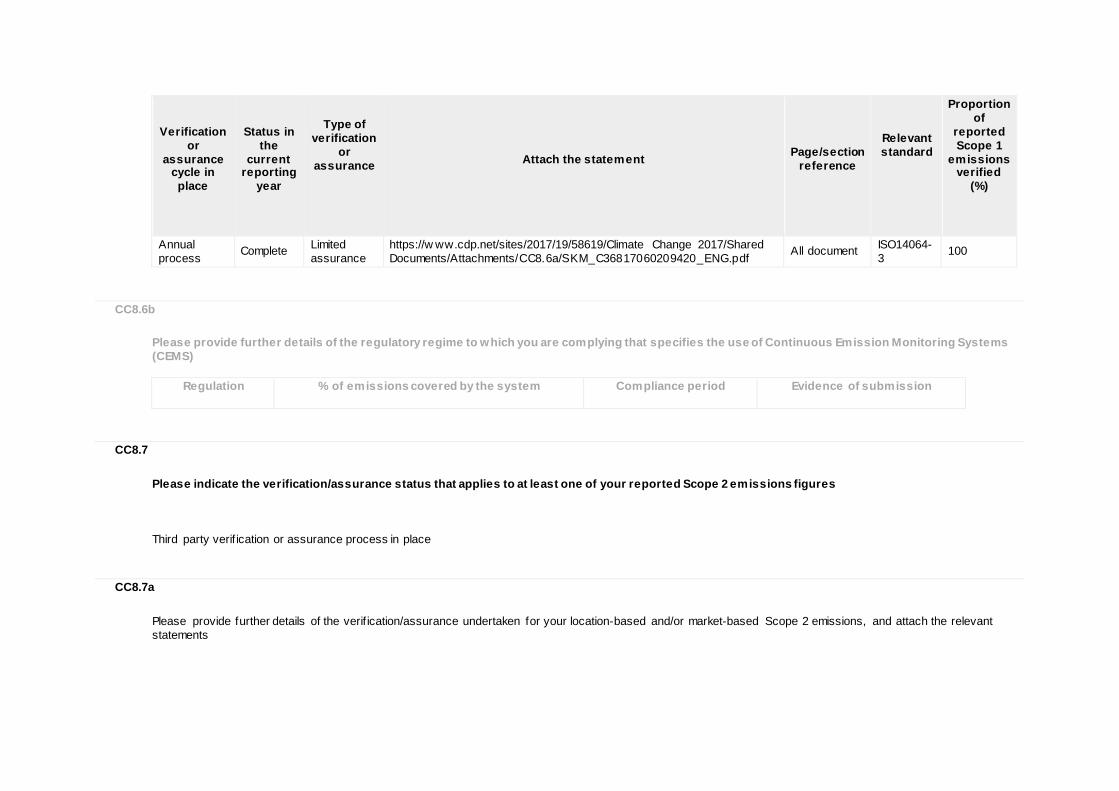
Verification
or assurance
cycle in place
Status in
the current
reporting year
Type of verification
or assurance
Attach the statement
Page/section
reference
Relevant standard
Proportion of
reported Scope 1
emissions verified
(%)
Annual process Complete Limited
assurance https://w ww.cdp.net/sites/2017/19/58619/Climate Change 2017/Shared Documents/Attachments/CC8.6a/SKM_C36817060209420_ENG.pdf All document ISO14064-
3 100
CC8.6b
Please provide further details of the regulatory regime to which you are complying that specifies the use of Continuous Emission Monitoring Systems (CEMS)
Regulation
% of emissions covered by the system
Compliance period
Evidence of submission
CC8.7
Please indicate the verification/assurance status that applies to at least one of your reported Scope 2 emissions figures Third party verif ication or assurance process in place
CC8.7a
Please provide further details of the verif ication/assurance undertaken for your location-based and/or market-based Scope 2 emissions, and attach the relevant statements
Location-based
or market-based figure?
Verificatio
n or assurance
cycle in place
Status in
the current reporting year
Type of verificatio
n or assurance
Attach the statement
Page/Section reference
Relevant standard
Proportion of
reported Scope 2
emissions verified
(%)
Market-based
Annual process Complete Limited
assurance
https://w ww.cdp.net/sites/2017/19/58619/Climate Change 2017/Shared Documents/Attachments/CC8.7a/SKM_C36817060209420_ENG.pdf
All document ISO14064-3 100
CC8.8
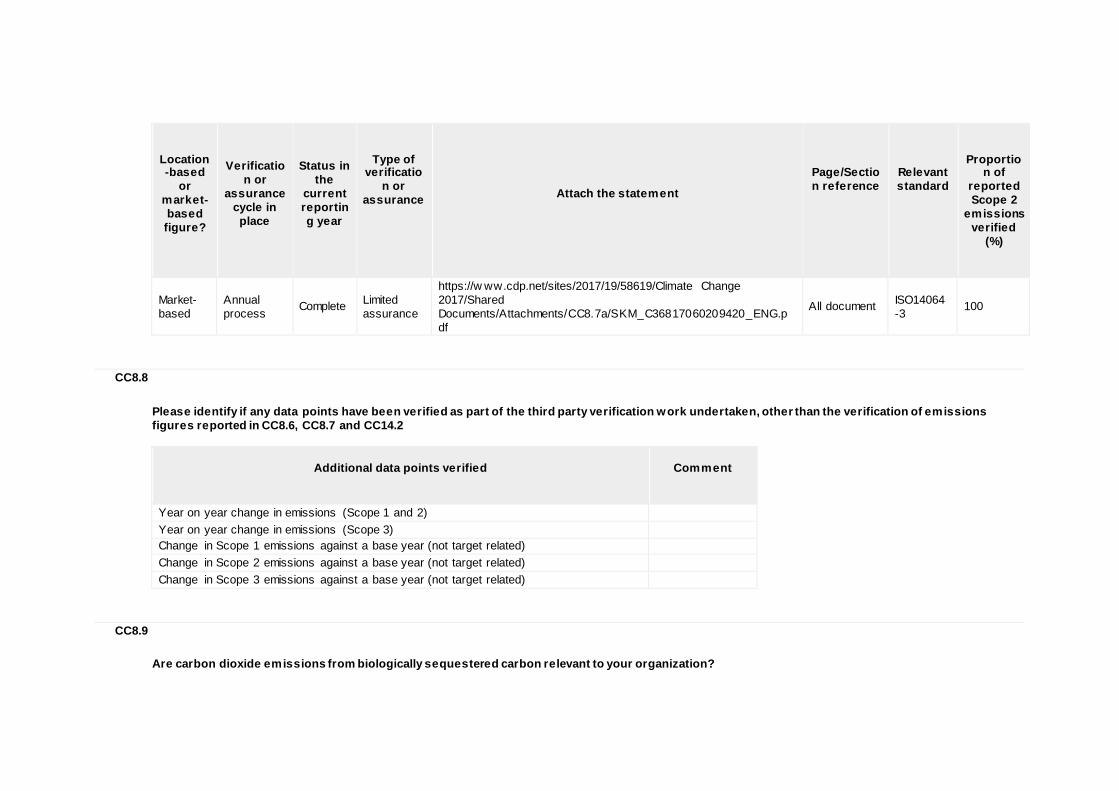
Please identify if any data points have been verified as part of the third party verification work undertaken, other than the verification of emissions figures reported in CC8.6, CC8.7 and CC14.2
Additional data points verified
Comment
Year on year change in emissions (Scope 1 and 2) Year on year change in emissions (Scope 3) Change in Scope 1 emissions against a base year (not target related) Change in Scope 2 emissions against a base year (not target related) Change in Scope 3 emissions against a base year (not target related)
CC8.9
Are carbon dioxide emissions from biologically sequestered carbon relevant to your organization?
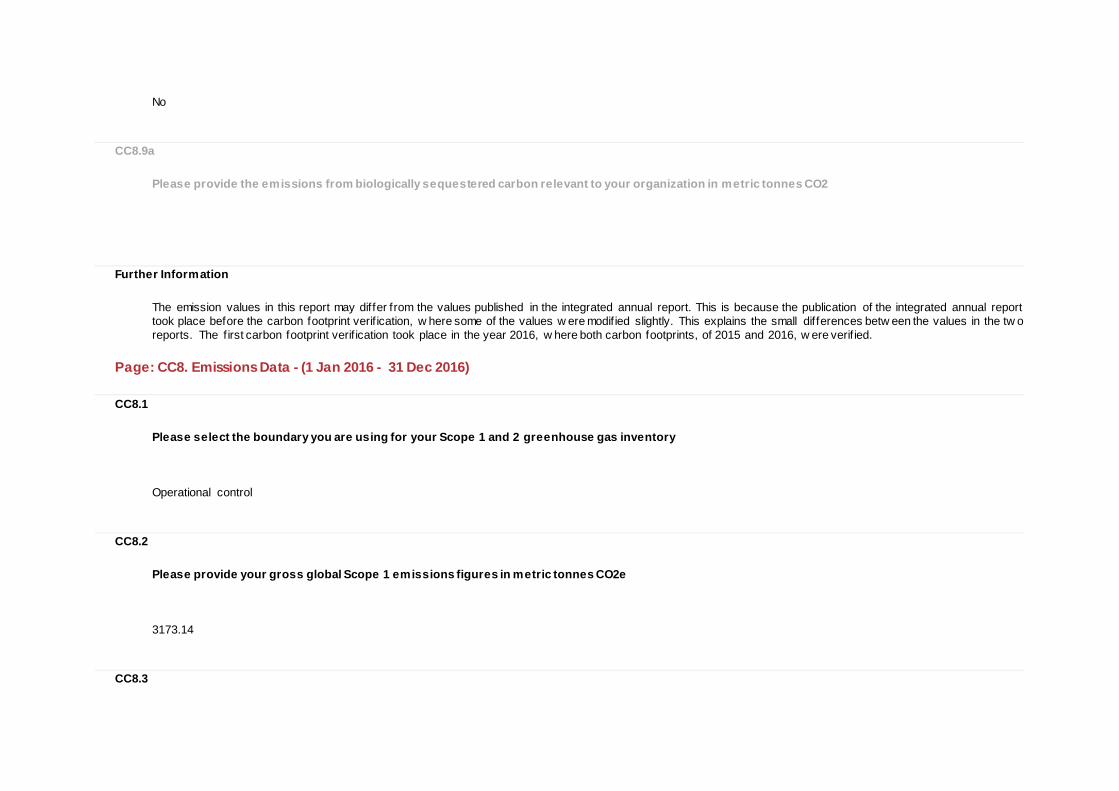
No
CC8.9a
Please provide the emissions from biologically sequestered carbon relevant to your organization in metric tonnes CO2
Further Information
The emission values in this report may differ from the values published in the integrated annual report. This is because the publication of the integrated annual report took place before the carbon footprint verif ication, w here some of the values w ere modif ied slightly. This explains the small differences betw een the values in the tw o reports. The f irst carbon footprint verif ication took place in the year 2016, w here both carbon footprints, of 2015 and 2016, w ere verif ied.
Page: CC8. Emissions Data - (1 Jan 2016 - 31 Dec 2016)
CC8.1
Please select the boundary you are using for your Scope 1 and 2 greenhouse gas inventory Operational control
CC8.2
Please provide your gross global Scope 1 emissions figures in metric tonnes CO2e 3173.14
CC8.3
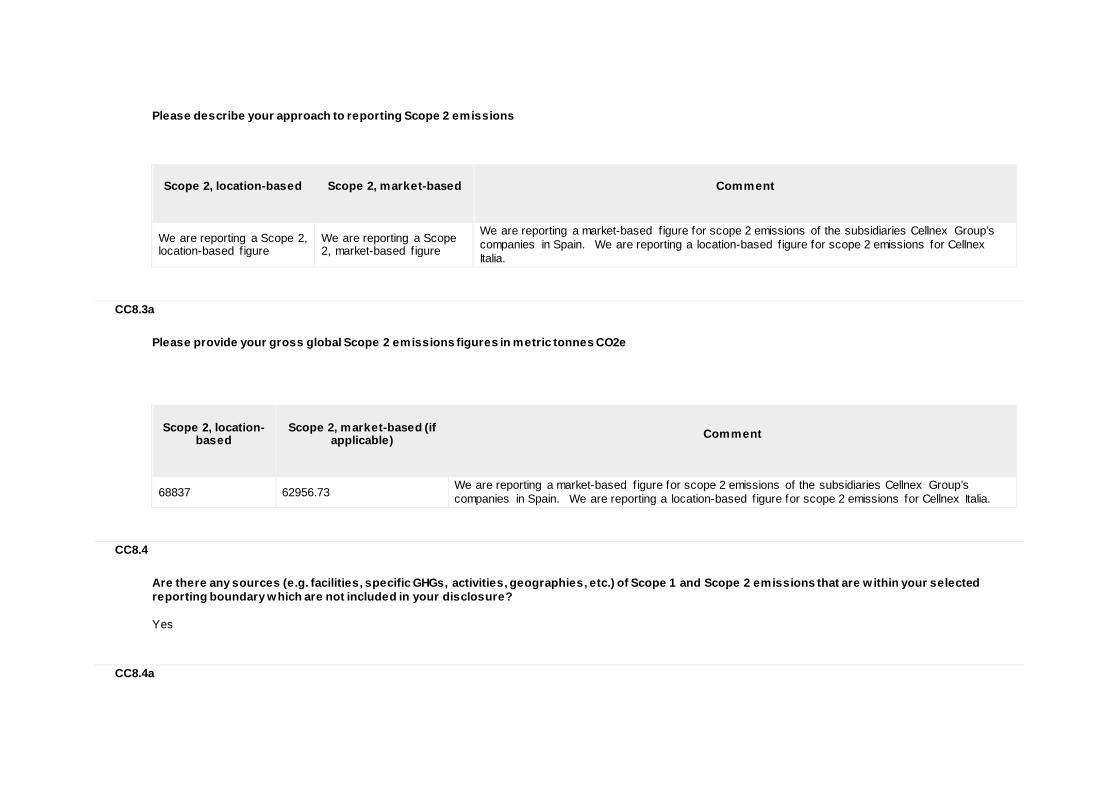
Please describe your approach to reporting Scope 2 emissions
Scope 2, location-based
Scope 2, market-based
Comment
We are reporting a Scope 2, location-based f igure
We are reporting a Scope 2, market-based f igure
We are reporting a market-based f igure for scope 2 emissions of the subsidiaries Cellnex Group’s companies in Spain. We are reporting a location-based f igure for scope 2 emissions for Cellnex Italia.
CC8.3a
Please provide your gross global Scope 2 emissions figures in metric tonnes CO2e
Scope 2, location-
based
Scope 2, market-based (if
applicable)
Comment
68837 62956.73 We are reporting a market-based f igure for scope 2 emissions of the subsidiaries Cellnex Group’s companies in Spain. We are reporting a location-based f igure for scope 2 emissions for Cellnex Italia.
CC8.4
Are there any sources (e.g. facilities, specific GHGs, activities, geographies, etc.) of Scope 1 and Scope 2 emissions that are w ithin your selected reporting boundary which are not included in your disclosure? Yes
CC8.4a
Please provide details of the sources of Scope 1 and Scope 2 emissions that are w ithin your selected reporting boundary which are not included in your disclosure
Source
Relevance of Scope 1 emissions from
this source
Relevance of
location-based Scope 2
emissions from this source
Relevance of market-based
Scope 2 emissions from this source (if
applicable)
Explain why the source is excluded
Emissions from fugitive refrigerating gases
Emissions are relevant but not yet calculated
No emissions excluded
No emissions excluded
Cellnex Telecom did not have a solid register of the recharges of refrigerating gases, w hich is w hy this source could not be included. How ever it is expected that in future years it w ill be calculated.
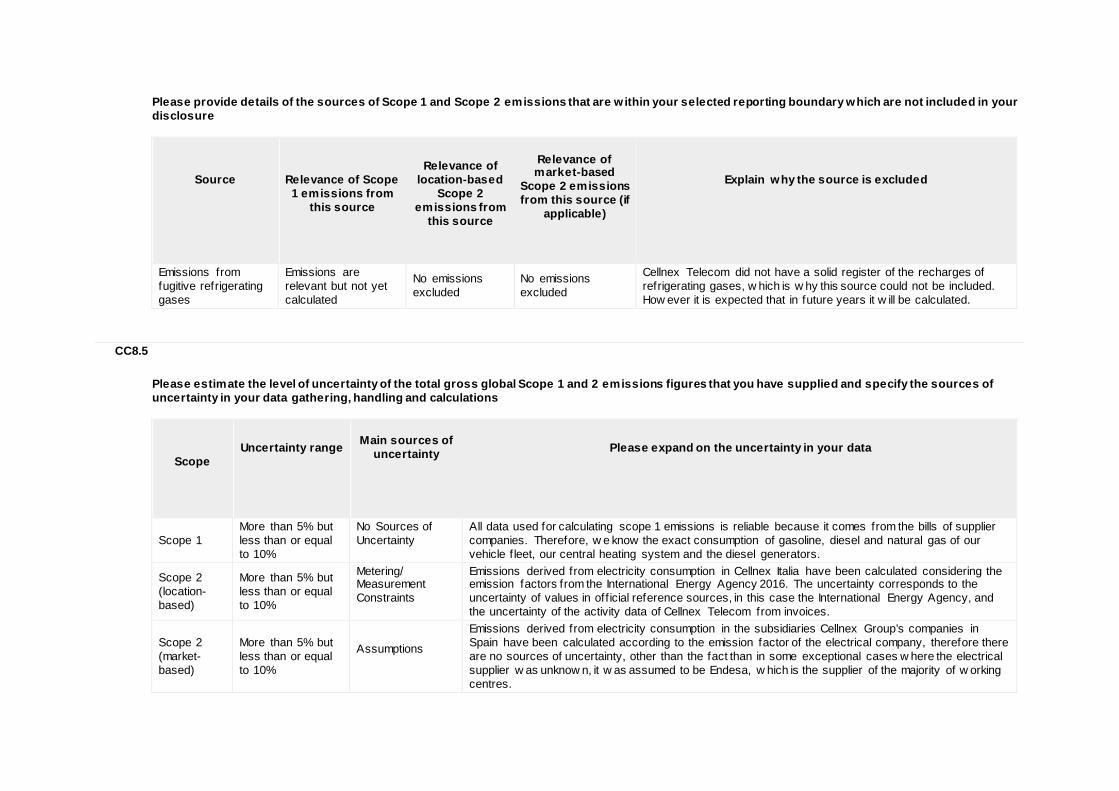
CC8.5
Please estimate the level of uncertainty of the total gross global Scope 1 and 2 emissions figures that you have supplied and specify the sources of uncertainty in your data gathering, handling and calculations
Scope
Uncertainty range
Main sources of
uncertainty
Please expand on the uncertainty in your data
Scope 1 More than 5% but less than or equal to 10%
No Sources of Uncertainty
All data used for calculating scope 1 emissions is reliable because it comes from the bills of supplier companies. Therefore, w e know the exact consumption of gasoline, diesel and natural gas of our vehicle f leet, our central heating system and the diesel generators.
Scope 2 (location-based)
More than 5% but less than or equal to 10%
Metering/ Measurement Constraints
Emissions derived from electricity consumption in Cellnex Italia have been calculated considering the emission factors from the International Energy Agency 2016. The uncertainty corresponds to the uncertainty of values in off icial reference sources, in this case the International Energy Agency, and the uncertainty of the activity data of Cellnex Telecom from invoices.
Scope 2 (market-based)
More than 5% but less than or equal to 10%
Assumptions
Emissions derived from electricity consumption in the subsidiaries Cellnex Group’s companies in Spain have been calculated according to the emission factor of the electrical company, therefore there are no sources of uncertainty, other than the fact than in some exceptional cases w here the electrical supplier w as unknow n, it w as assumed to be Endesa, w hich is the supplier of the majority of w orking centres.
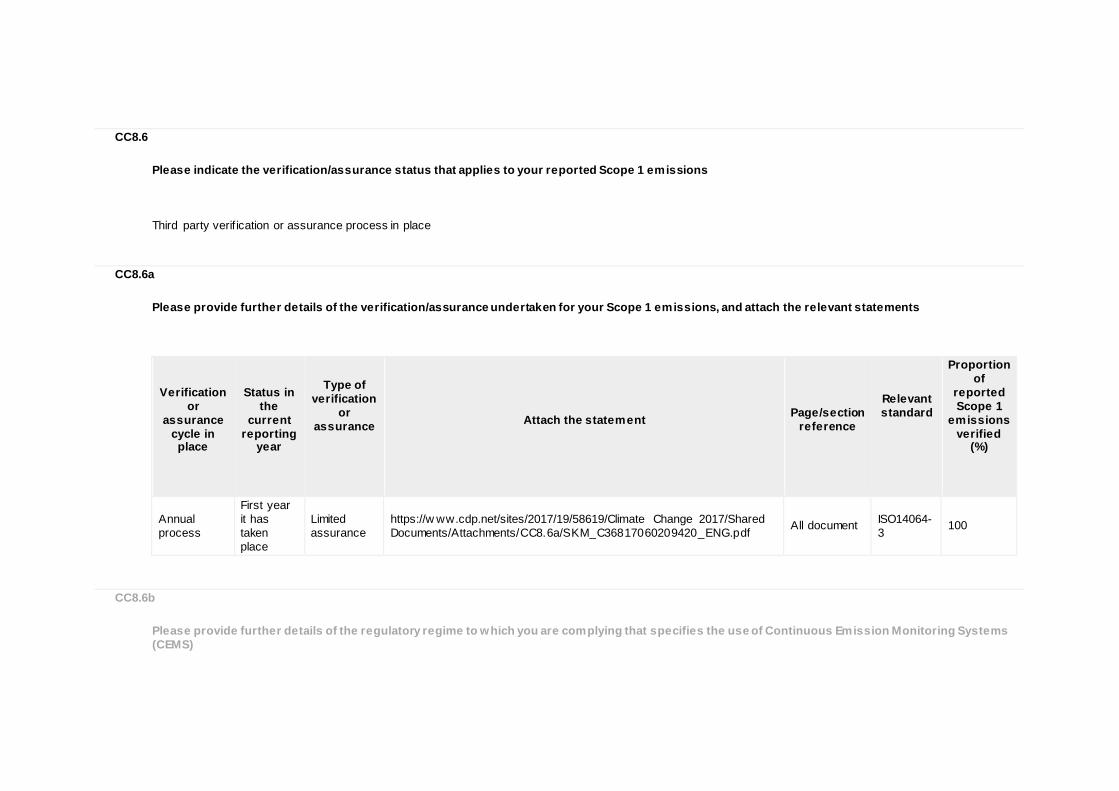
CC8.6
Please indicate the verification/assurance status that applies to your reported Scope 1 emissions Third party verif ication or assurance process in place
CC8.6a
Please provide further details of the verification/assurance undertaken for your Scope 1 emissions, and attach the relevant statements
Verification
or assurance
cycle in place
Status in
the current
reporting year
Type of verification
or assurance
Attach the statement
Page/section
reference
Relevant standard
Proportion of
reported Scope 1
emissions verified
(%)
Annual process
First year it has taken place
Limited assurance
https://w ww.cdp.net/sites/2017/19/58619/Climate Change 2017/Shared Documents/Attachments/CC8.6a/SKM_C36817060209420_ENG.pdf All document ISO14064-
3 100
CC8.6b
Please provide further details of the regulatory regime to which you are complying that specifies the use of Continuous Emission Monitoring Systems (CEMS)
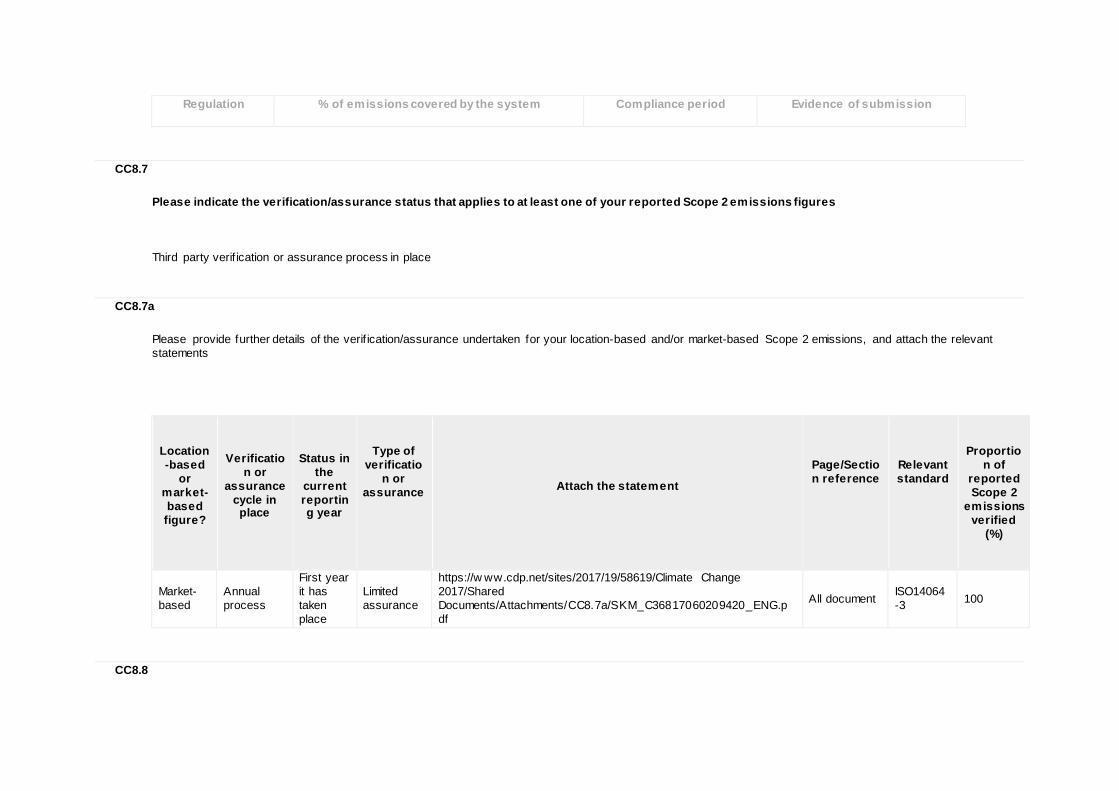
Regulation
% of emissions covered by the system
Compliance period
Evidence of submission
CC8.7
Please indicate the verification/assurance status that applies to at least one of your reported Scope 2 emissions figures Third party verif ication or assurance process in place
CC8.7a
Please provide further details of the verif ication/assurance undertaken for your location-based and/or market-based Scope 2 emissions, and attach the relevant statements
Location-based
or market-based figure?
Verificatio
n or assurance
cycle in place
Status in
the current reporting year
Type of verificatio
n or assurance
Attach the statement
Page/Section reference
Relevant standard
Proportion of
reported Scope 2
emissions verified
(%)
Market-based
Annual process
First year it has taken place
Limited assurance
https://w ww.cdp.net/sites/2017/19/58619/Climate Change 2017/Shared Documents/Attachments/CC8.7a/SKM_C36817060209420_ENG.pdf
All document ISO14064-3 100
CC8.8
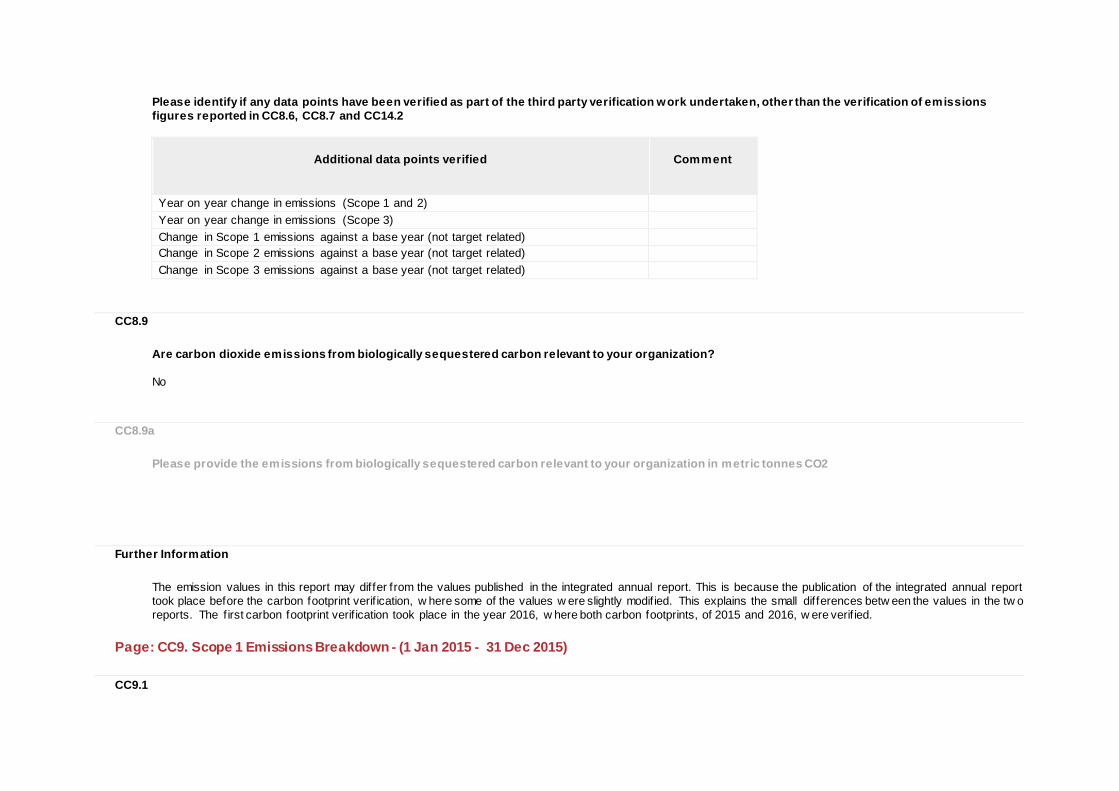
Please identify if any data points have been verified as part of the third party verification work undertaken, other than the verification of emissions figures reported in CC8.6, CC8.7 and CC14.2
Additional data points verified
Comment
Year on year change in emissions (Scope 1 and 2) Year on year change in emissions (Scope 3) Change in Scope 1 emissions against a base year (not target related) Change in Scope 2 emissions against a base year (not target related) Change in Scope 3 emissions against a base year (not target related)
CC8.9
Are carbon dioxide emissions from biologically sequestered carbon relevant to your organization? No
CC8.9a
Please provide the emissions from biologically sequestered carbon relevant to your organization in metric tonnes CO2
Further Information
The emission values in this report may differ from the values published in the integrated annual report. This is because the publication of the integrated annual report took place before the carbon footprint verif ication, w here some of the values w ere slightly modif ied. This explains the small differences betw een the values in the tw o reports. The f irst carbon footprint verif ication took place in the year 2016, w here both carbon footprints, of 2015 and 2016, w ere verif ied.
Page: CC9. Scope 1 Emissions Breakdown - (1 Jan 2015 - 31 Dec 2015)
CC9.1
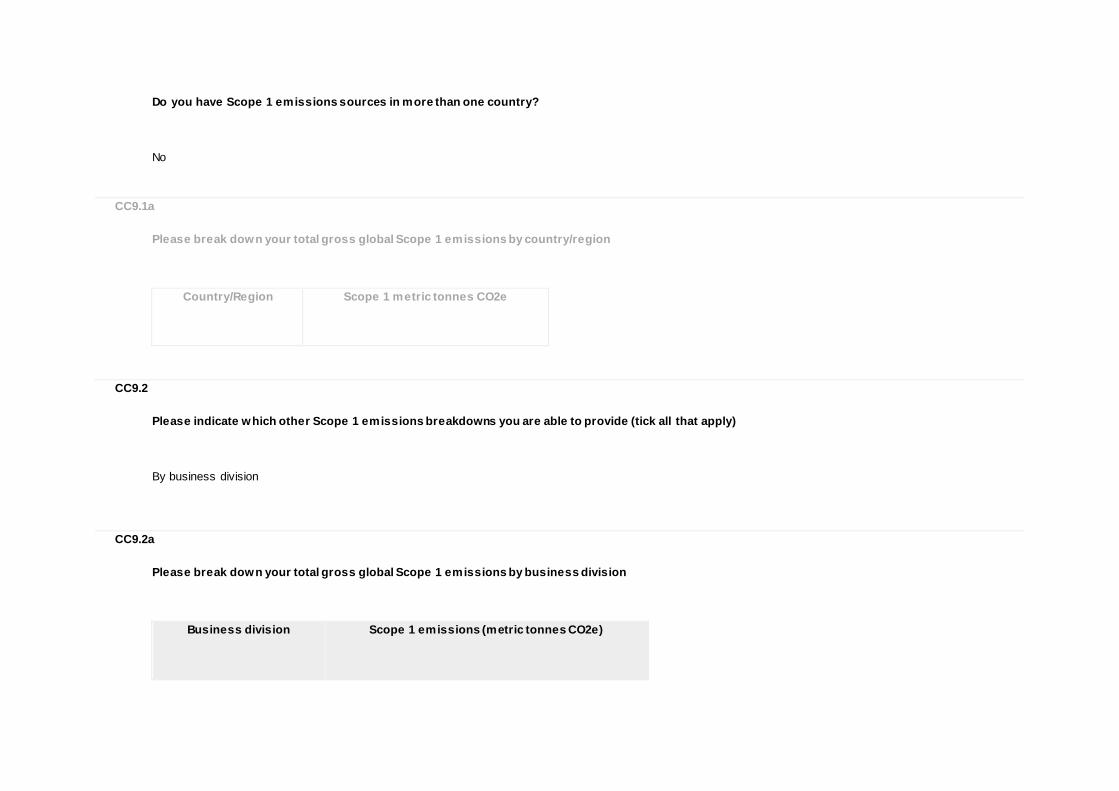
Do you have Scope 1 emissions sources in more than one country? No
CC9.1a
Please break down your total gross global Scope 1 emissions by country/region
Country/Region
Scope 1 metric tonnes CO2e
CC9.2
Please indicate which other Scope 1 emissions breakdowns you are able to provide (tick all that apply) By business division
CC9.2a
Please break down your total gross global Scope 1 emissions by business division
Business division
Scope 1 emissions (metric tonnes CO2e)
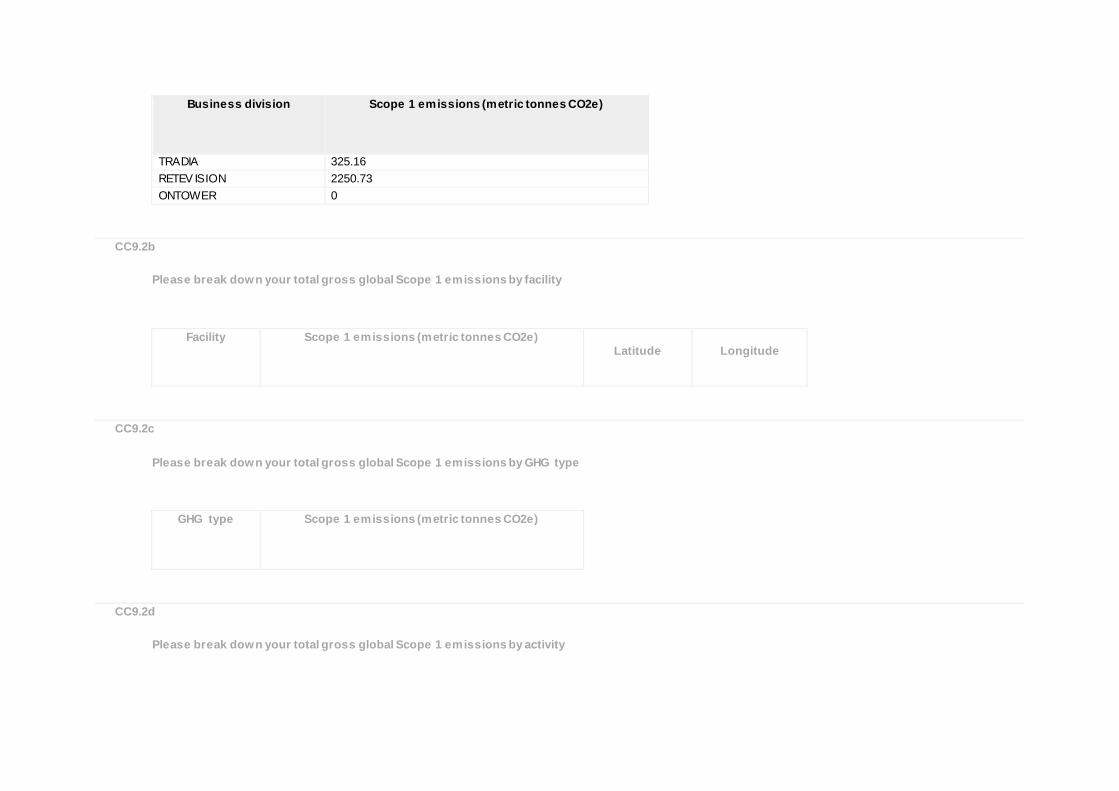
Business division
Scope 1 emissions (metric tonnes CO2e)
TRADIA 325.16 RETEV ISION 2250.73 ONTOWER 0
CC9.2b
Please break down your total gross global Scope 1 emissions by facility
Facility
Scope 1 emissions (metric tonnes CO2e)
Latitude
Longitude
CC9.2c
Please break down your total gross global Scope 1 emissions by GHG type
GHG type
Scope 1 emissions (metric tonnes CO2e)
CC9.2d
Please break down your total gross global Scope 1 emissions by activity
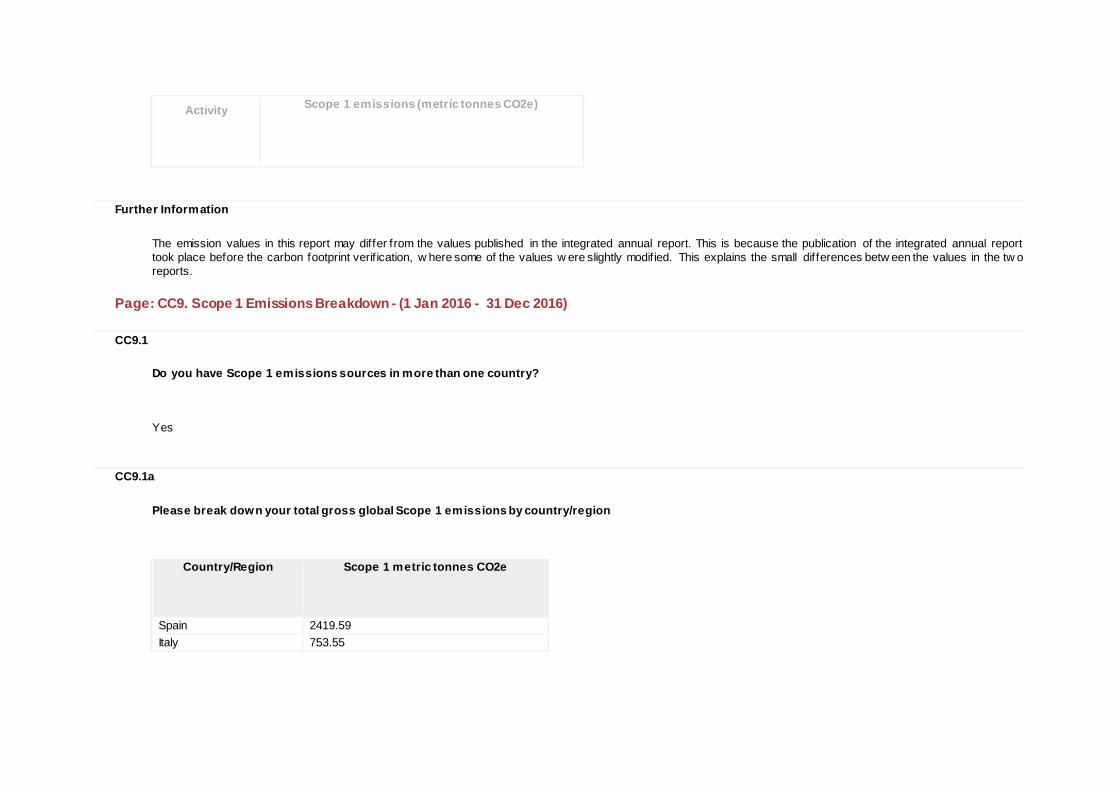
Activity
Scope 1 emissions (metric tonnes CO2e)
Further Information
The emission values in this report may differ from the values published in the integrated annual report. This is because the publication of the integrated annual report took place before the carbon footprint verif ication, w here some of the values w ere slightly modif ied. This explains the small differences betw een the values in the tw o reports.
Page: CC9. Scope 1 Emissions Breakdown - (1 Jan 2016 - 31 Dec 2016)
CC9.1
Do you have Scope 1 emissions sources in more than one country? Yes
CC9.1a
Please break down your total gross global Scope 1 emissions by country/region
Country/Region
Scope 1 metric tonnes CO2e
Spain 2419.59 Italy 753.55
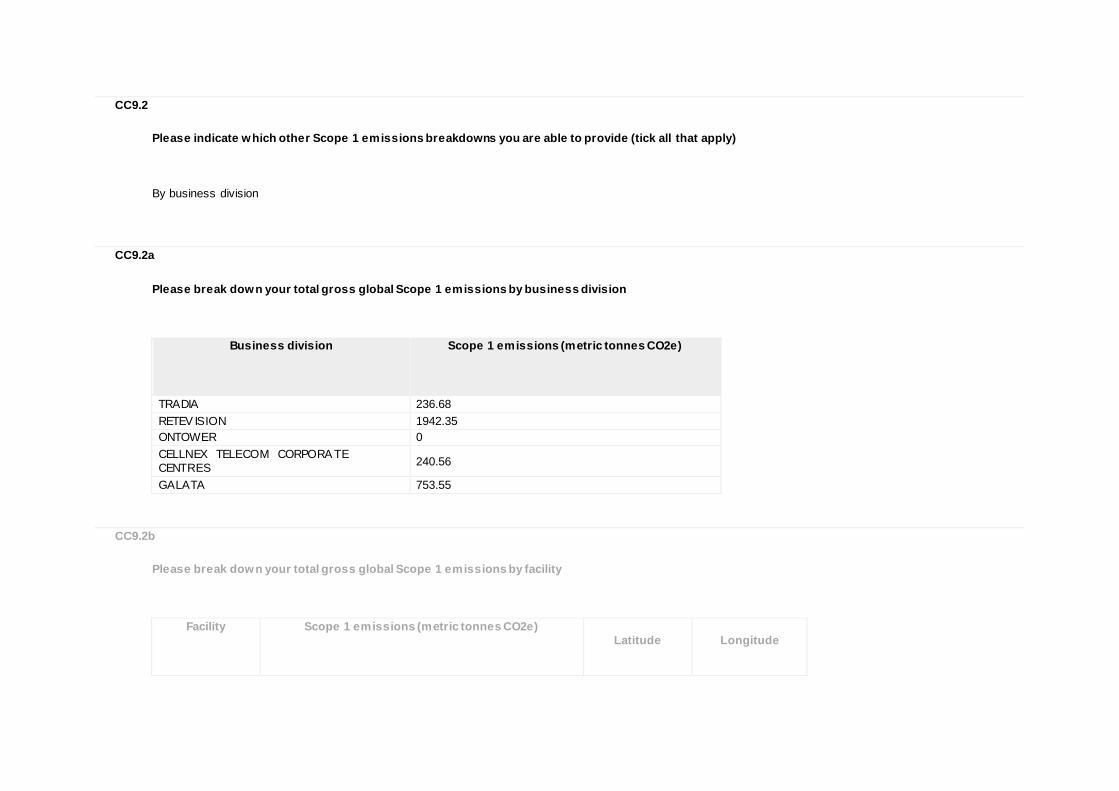
CC9.2
Please indicate which other Scope 1 emissions breakdowns you are able to provide (tick all that apply) By business division
CC9.2a
Please break down your total gross global Scope 1 emissions by business division
Business division
Scope 1 emissions (metric tonnes CO2e)
TRADIA 236.68 RETEV ISION 1942.35 ONTOWER 0 CELLNEX TELECOM CORPORA TE CENTRES 240.56
GALATA 753.55
CC9.2b
Please break down your total gross global Scope 1 emissions by facility
Facility
Scope 1 emissions (metric tonnes CO2e)
Latitude
Longitude
CC9.2c
Please break down your total gross global Scope 1 emissions by GHG type
GHG type
Scope 1 emissions (metric tonnes CO2e)
CC9.2d
Please break down your total gross global Scope 1 emissions by activity
Activity
Scope 1 emissions (metric tonnes CO2e)
Further Information
The emission values in this report may differ from the values published in the integrated annual report. This is because the publication of the integrated annual report took place before the carbon footprint verif ication, w here some of the values w ere slightly modif ied. This explains the small differences betw een the values in the tw o reports.
Page: CC10. Scope 2 Emissions Breakdown - (1 Jan 2015 - 31 Dec 2015)
CC10.1
Do you have Scope 2 emissions sources in more than one country?
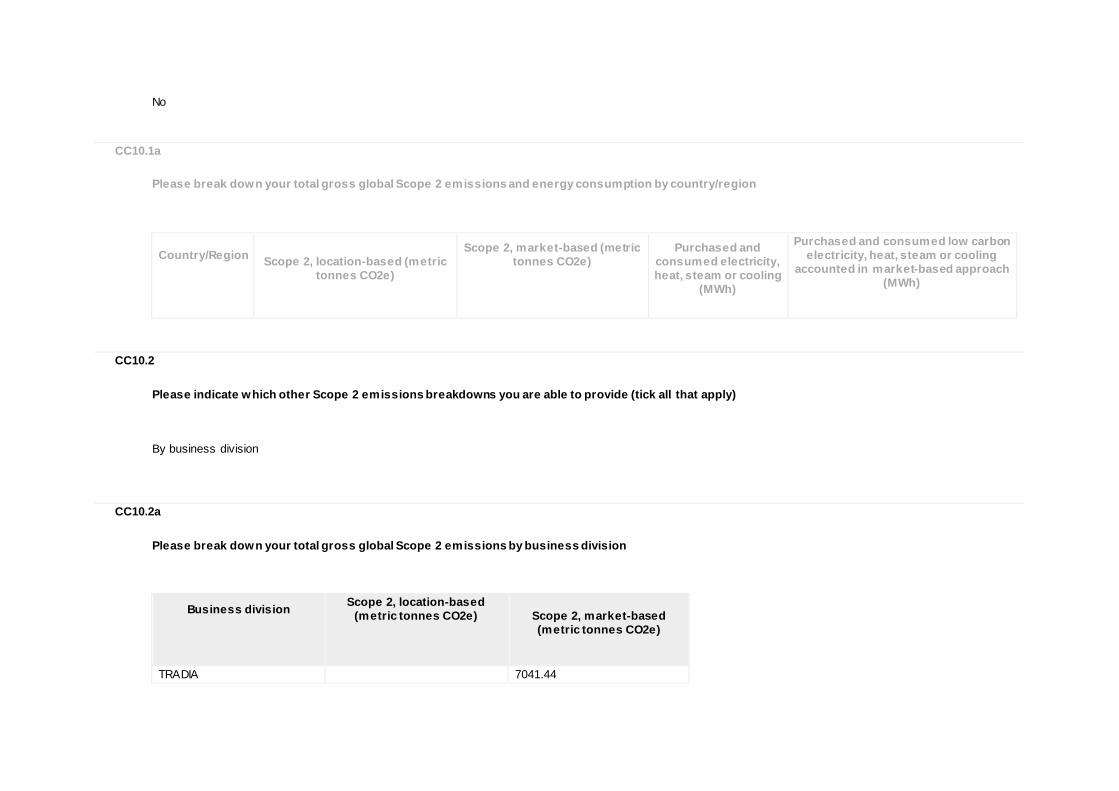
No
CC10.1a
Please break down your total gross global Scope 2 emissions and energy consumption by country/region
Country/Region
Scope 2, location-based (metric
tonnes CO2e)
Scope 2, market-based (metric tonnes CO2e)
Purchased and consumed electricity, heat, steam or cooling
(MWh)
Purchased and consumed low carbon electricity, heat, steam or cooling
accounted in market-based approach (MWh)
CC10.2
Please indicate which other Scope 2 emissions breakdowns you are able to provide (tick all that apply) By business division
CC10.2a
Please break down your total gross global Scope 2 emissions by business division
Business division
Scope 2, location-based (metric tonnes CO2e)
Scope 2, market-based (metric tonnes CO2e)
TRADIA 7041.44
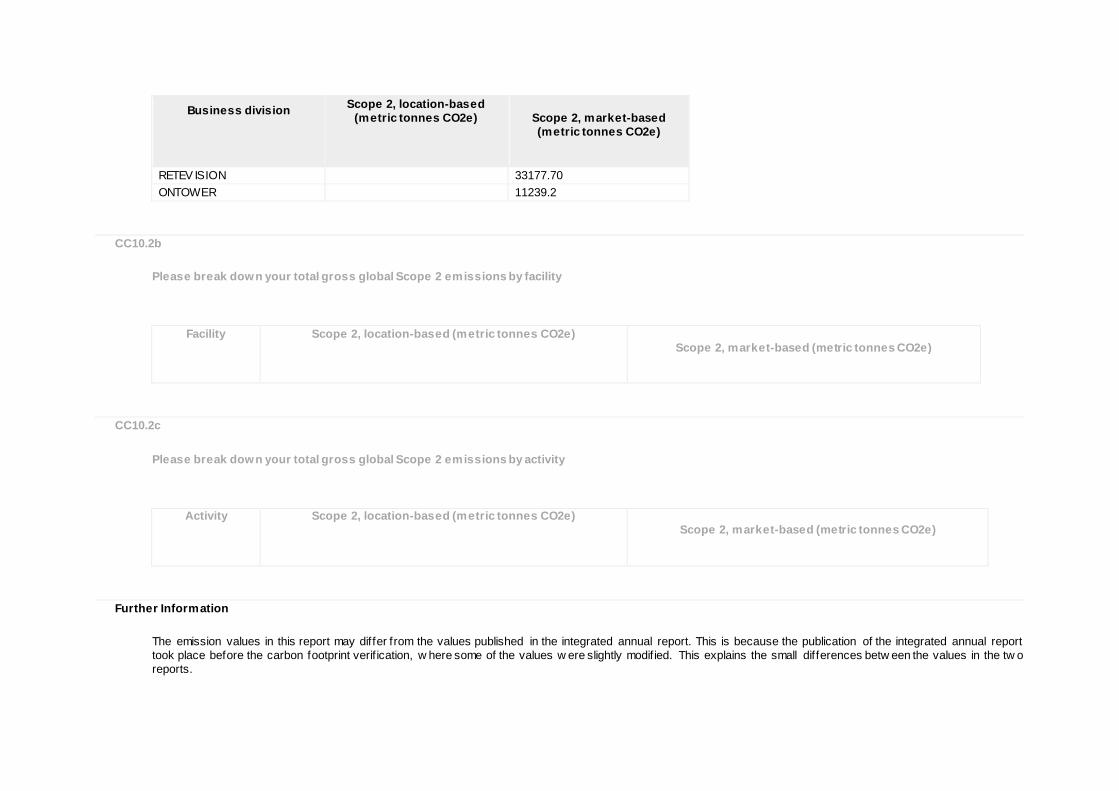
Business division
Scope 2, location-based (metric tonnes CO2e)
Scope 2, market-based (metric tonnes CO2e)
RETEV ISION 33177.70 ONTOWER 11239.2
CC10.2b
Please break down your total gross global Scope 2 emissions by facility
Facility
Scope 2, location-based (metric tonnes CO2e)
Scope 2, market-based (metric tonnes CO2e)
CC10.2c
Please break down your total gross global Scope 2 emissions by activity
Activity
Scope 2, location-based (metric tonnes CO2e)
Scope 2, market-based (metric tonnes CO2e)
Further Information
The emission values in this report may differ from the values published in the integrated annual report. This is because the publication of the integrated annual report took place before the carbon footprint verif ication, w here some of the values w ere slightly modif ied. This explains the small differences betw een the values in the tw o reports.
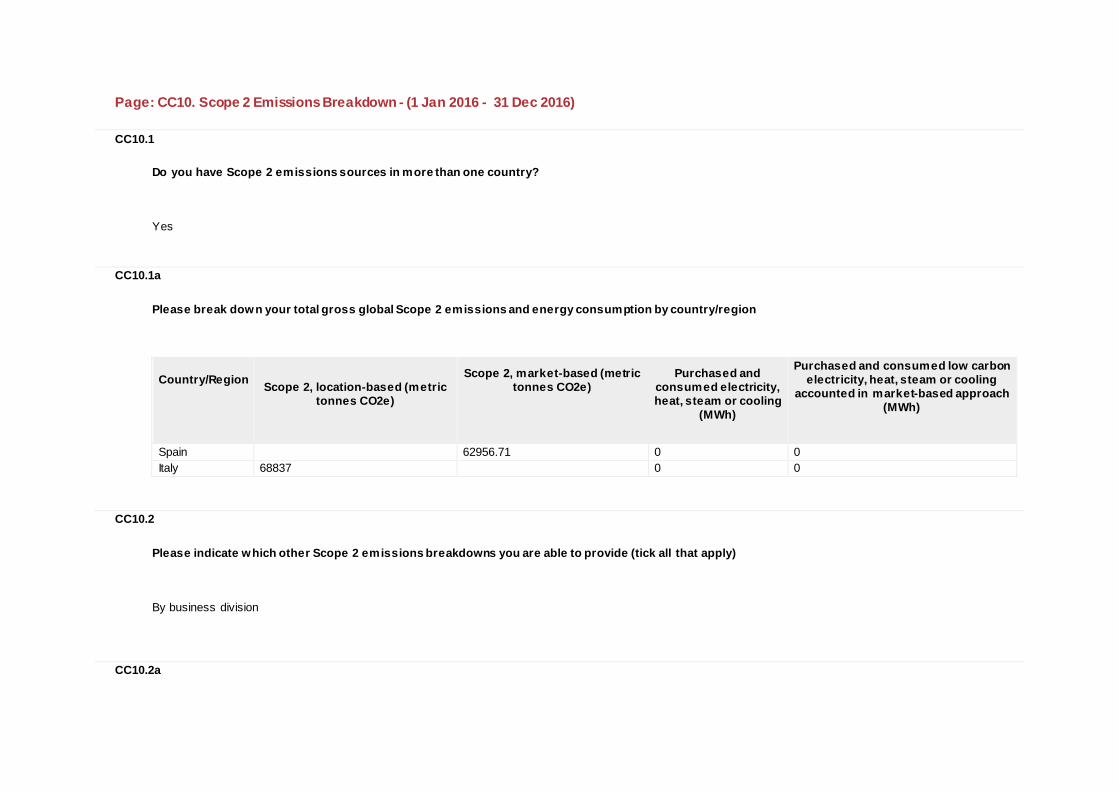
Page: CC10. Scope 2 Emissions Breakdown - (1 Jan 2016 - 31 Dec 2016)
CC10.1
Do you have Scope 2 emissions sources in more than one country? Yes
CC10.1a
Please break down your total gross global Scope 2 emissions and energy consumption by country/region
Country/Region
Scope 2, location-based (metric
tonnes CO2e)
Scope 2, market-based (metric tonnes CO2e)
Purchased and consumed electricity, heat, steam or cooling
(MWh)
Purchased and consumed low carbon electricity, heat, steam or cooling
accounted in market-based approach (MWh)
Spain 62956.71 0 0 Italy 68837 0 0
CC10.2
Please indicate which other Scope 2 emissions breakdowns you are able to provide (tick all that apply) By business division
CC10.2a
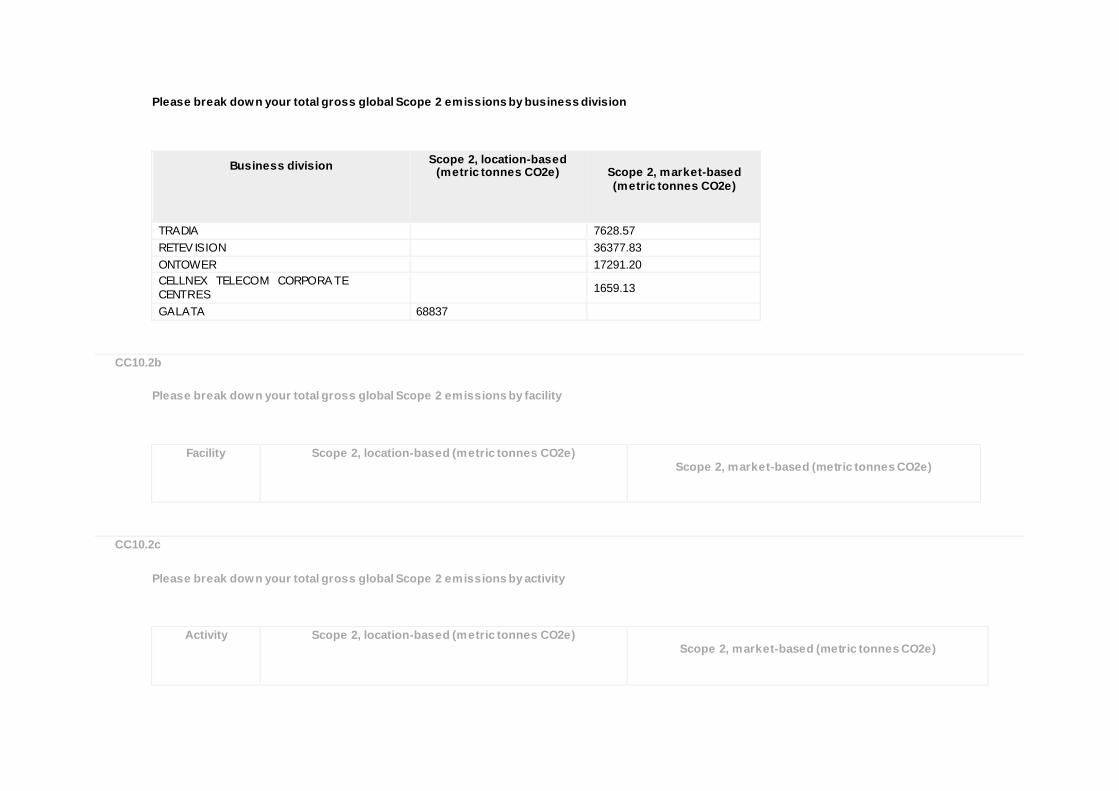
Please break down your total gross global Scope 2 emissions by business division
Business division
Scope 2, location-based (metric tonnes CO2e)
Scope 2, market-based (metric tonnes CO2e)
TRADIA 7628.57 RETEV ISION 36377.83 ONTOWER 17291.20 CELLNEX TELECOM CORPORA TE CENTRES 1659.13
GALATA 68837
CC10.2b
Please break down your total gross global Scope 2 emissions by facility
Facility
Scope 2, location-based (metric tonnes CO2e)
Scope 2, market-based (metric tonnes CO2e)
CC10.2c
Please break down your total gross global Scope 2 emissions by activity
Activity
Scope 2, location-based (metric tonnes CO2e)
Scope 2, market-based (metric tonnes CO2e)
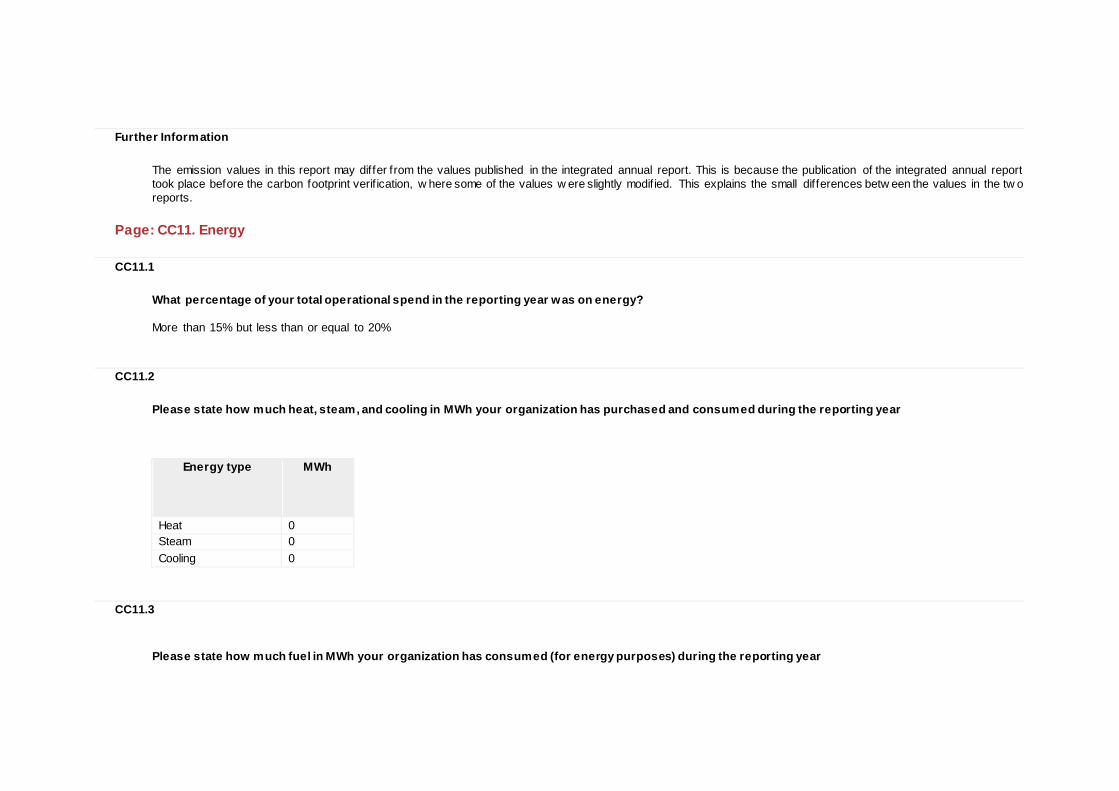
Further Information
The emission values in this report may differ from the values published in the integrated annual report. This is because the publication of the integrated annual report took place before the carbon footprint verif ication, w here some of the values w ere slightly modif ied. This explains the small differences betw een the values in the tw o reports.
Page: CC11. Energy
CC11.1
What percentage of your total operational spend in the reporting year was on energy? More than 15% but less than or equal to 20%
CC11.2
Please state how much heat, steam, and cooling in MWh your organization has purchased and consumed during the reporting year
Energy type
MWh
Heat 0 Steam 0 Cooling 0
CC11.3
Please state how much fuel in MWh your organization has consumed (for energy purposes) during the reporting year
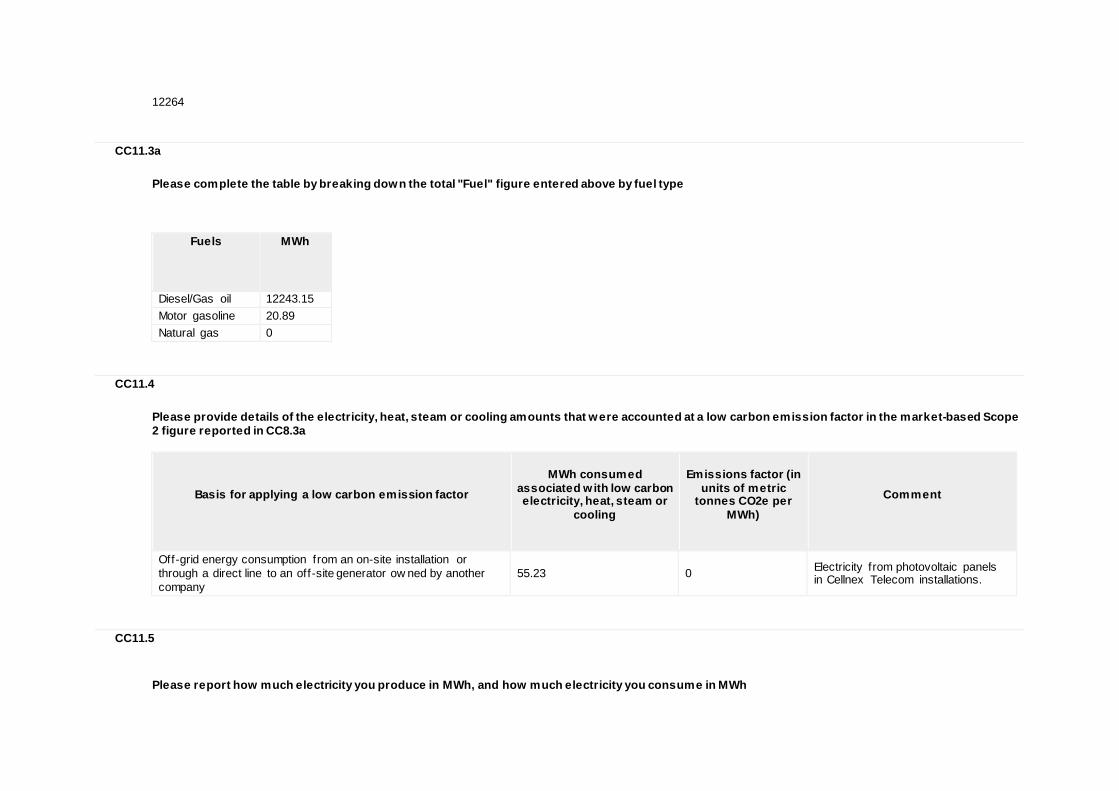
12264
CC11.3a
Please complete the table by breaking down the total "Fuel" figure entered above by fuel type
Fuels
MWh
Diesel/Gas oil 12243.15 Motor gasoline 20.89 Natural gas 0
CC11.4
Please provide details of the electricity, heat, steam or cooling amounts that were accounted at a low carbon emission factor in the market-based Scope 2 figure reported in CC8.3a
Basis for applying a low carbon emission factor
MWh consumed associated w ith low carbon electricity, heat, steam or
cooling
Emissions factor (in
units of metric tonnes CO2e per
MWh)
Comment
Off-grid energy consumption from an on-site installation or through a direct line to an off-site generator ow ned by another company
55.23 0 Electricity from photovoltaic panels in Cellnex Telecom installations.
CC11.5
Please report how much electricity you produce in MWh, and how much electricity you consume in MWh
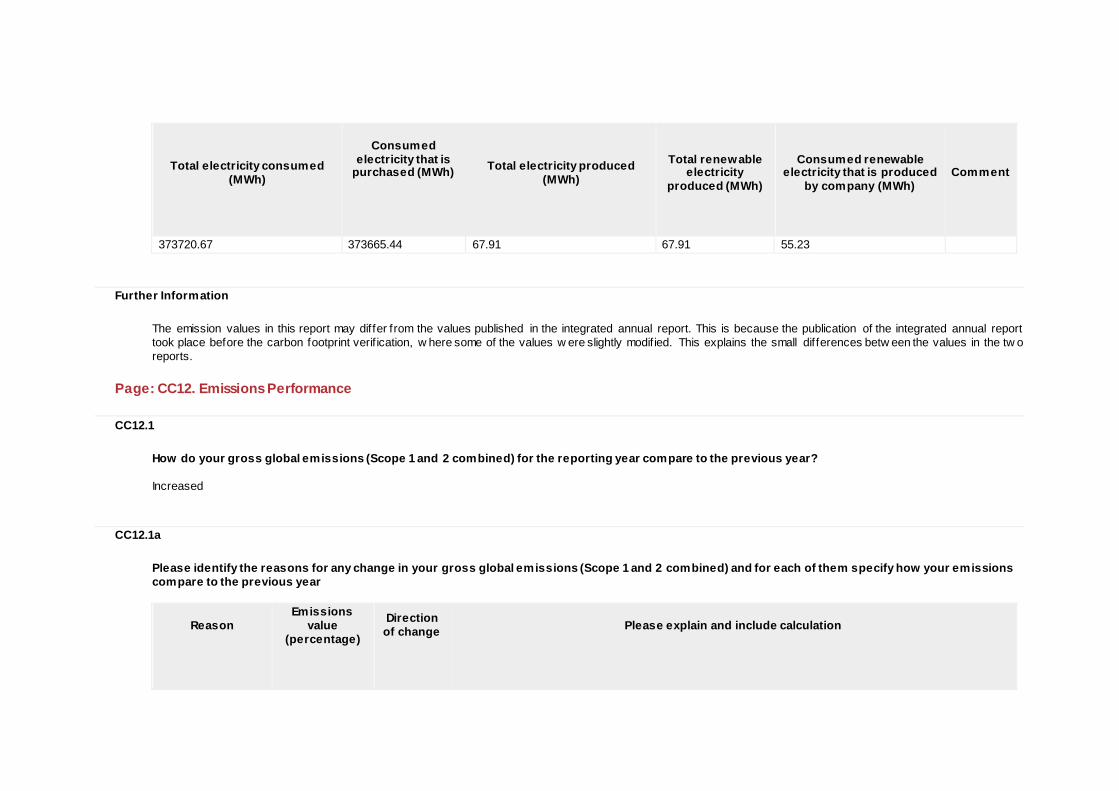
Total electricity consumed
(MWh)
Consumed
electricity that is purchased (MWh)
Total electricity produced
(MWh)
Total renewable
electricity produced (MWh)
Consumed renewable
electricity that is produced by company (MWh)
Comment
373720.67 373665.44 67.91 67.91 55.23
Further Information
The emission values in this report may differ from the values published in the integrated annual report. This is because the publication of the integrated annual report took place before the carbon footprint verif ication, w here some of the values w ere slightly modif ied. This explains the small differences betw een the values in the tw o reports.
Page: CC12. Emissions Performance
CC12.1
How do your gross global emissions (Scope 1 and 2 combined) for the reporting year compare to the previous year? Increased
CC12.1a
Please identify the reasons for any change in your gross global emissions (Scope 1 and 2 combined) and for each of them specify how your emissions compare to the previous year
Reason
Emissions value
(percentage)
Direction of change
Please explain and include calculation

Reason
Emissions value
(percentage)
Direction of change
Please explain and include calculation
Emissions reduction activities 3.8 Decrease
The implementation of several emission reduction activities such as energy eff iciency initiatives and training courses in 4x4 driving accounted for a decrease in scope 1+2 emissions. The calculation of the emissions value in % is consistent w ith the CDP guidance document (2066.66/54034.23*100=3.8).
Divestment Acquisitions Mergers Change in output Change in methodology
Change in boundary 128.8 Increase
This year the Company Galata (Cellnex Italia) w as included in the scope, w hich explains the big increase in emissions in scope1+2 compared to 2015. The calculation of the emissions value in % is consistent w ith the CDP guidance document (69590.55/54034.23*100=3.4).
Change in physical operating conditions Unidentif ied Other
CC12.1b
Is your emissions performance calculations in CC12.1 and CC12.1a based on a location-based Scope 2 emissions figure or a market-based Scope 2 emissions figure? Market-based
CC12.2
Please describe your gross global combined Scope 1 and 2 emissions for the reporting year in metric tonnes CO2e per unit currency total revenue
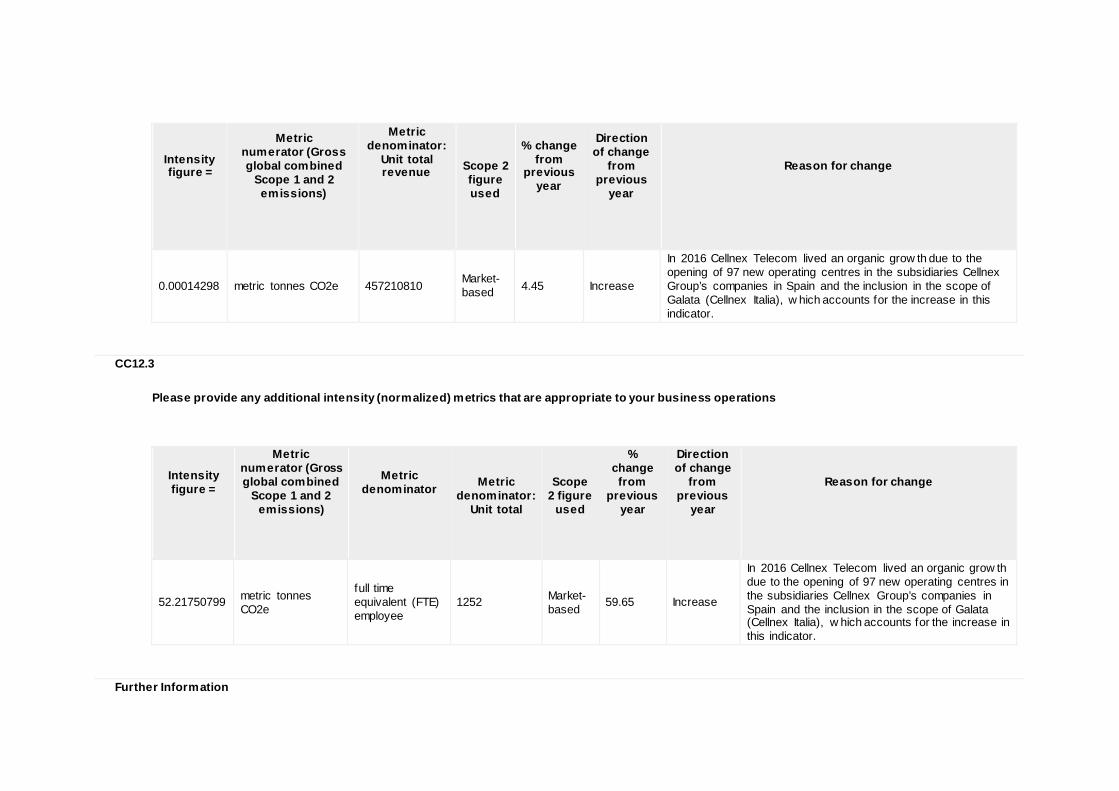
Intensity figure =
Metric numerator (Gross global combined
Scope 1 and 2 emissions)
Metric denominator:
Unit total revenue
Scope 2 figure used
% change from
previous year
Direction of change
from previous
year
Reason for change
0.00014298 metric tonnes CO2e 457210810 Market-based 4.45 Increase
In 2016 Cellnex Telecom lived an organic grow th due to the opening of 97 new operating centres in the subsidiaries Cellnex Group’s companies in Spain and the inclusion in the scope of Galata (Cellnex Italia), w hich accounts for the increase in this indicator.
CC12.3
Please provide any additional intensity (normalized) metrics that are appropriate to your business operations
Intensity figure =
Metric numerator (Gross global combined
Scope 1 and 2 emissions)
Metric denominator
Metric
denominator: Unit total
Scope
2 figure used
% change from
previous year
Direction of change
from previous
year
Reason for change
52.21750799 metric tonnes CO2e
full time equivalent (FTE) employee
1252 Market-based 59.65 Increase
In 2016 Cellnex Telecom lived an organic grow th due to the opening of 97 new operating centres in the subsidiaries Cellnex Group’s companies in Spain and the inclusion in the scope of Galata (Cellnex Italia), w hich accounts for the increase in this indicator.
Further Information
The emission values in this report may differ from the values published in the integrated annual report. This is because the publication of the integrated annual report took place before the carbon footprint verif ication, w here some of the values w ere slightly modif ied. This explains the small differences betw een the values in the tw o reports.
Page: CC13. Emissions Trading
CC13.1
Do you participate in any emissions trading schemes? No, and w e do not currently anticipate doing so in the next 2 years
CC13.1a
Please complete the following table for each of the emission trading schemes in which you participate
Scheme name
Period for which data is supplied
Allowances allocated
Allowances purchased
Verified emissions in metric tonnes CO2e
Details of ownership
CC13.1b
What is your strategy for complying with the schemes in which you participate or anticipate participating?
CC13.2
Has your organization originated any project-based carbon credits or purchased any within the reporting period? Yes
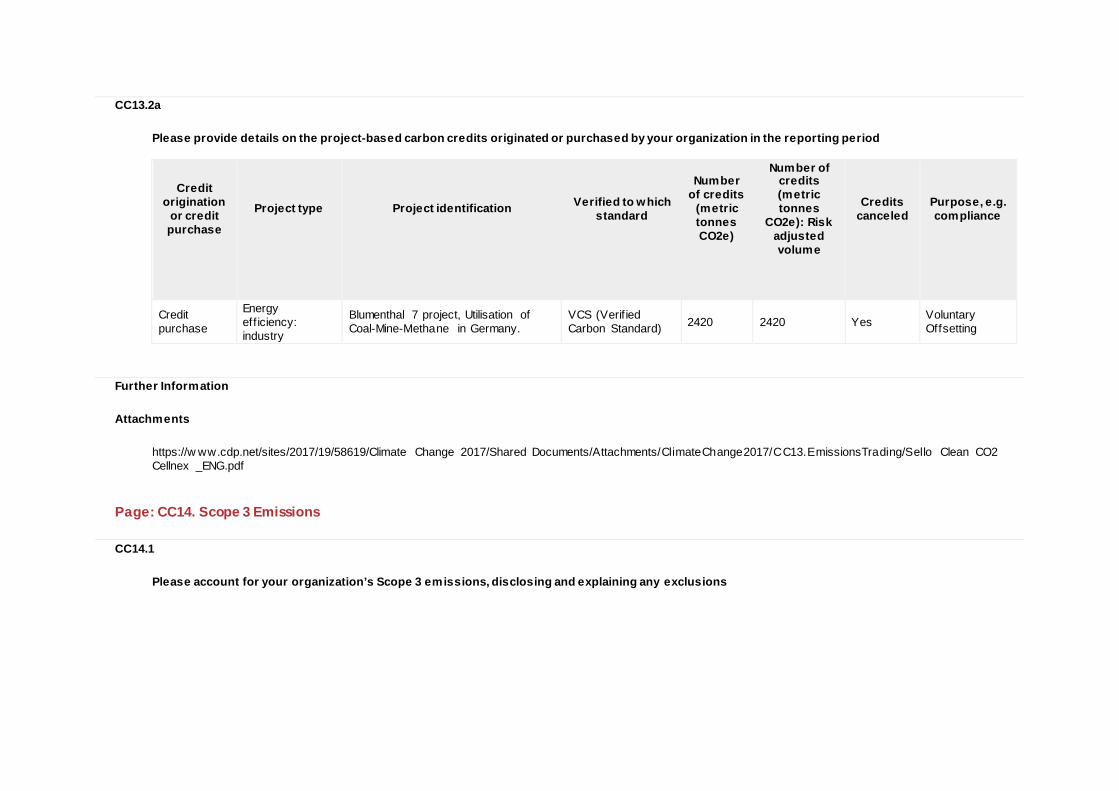
CC13.2a
Please provide details on the project-based carbon credits originated or purchased by your organization in the reporting period
Credit origination
or credit purchase
Project type
Project identification
Verified to which standard
Number of credits
(metric tonnes CO2e)
Number of credits (metric tonnes
CO2e): Risk adjusted volume
Credits canceled
Purpose, e.g. compliance
Credit purchase
Energy eff iciency: industry
Blumenthal 7 project, Utilisation of Coal-Mine-Methane in Germany.
VCS (Verif ied Carbon Standard) 2420 2420 Yes Voluntary
Offsetting
Further Information
Attachments
https://w ww.cdp.net/sites/2017/19/58619/Climate Change 2017/Shared Documents/Attachments/ClimateChange2017/CC13.EmissionsTrading/Sello Clean CO2 Cellnex _ENG.pdf
Page: CC14. Scope 3 Emissions
CC14.1
Please account for your organization’s Scope 3 emissions, disclosing and explaining any exclusions
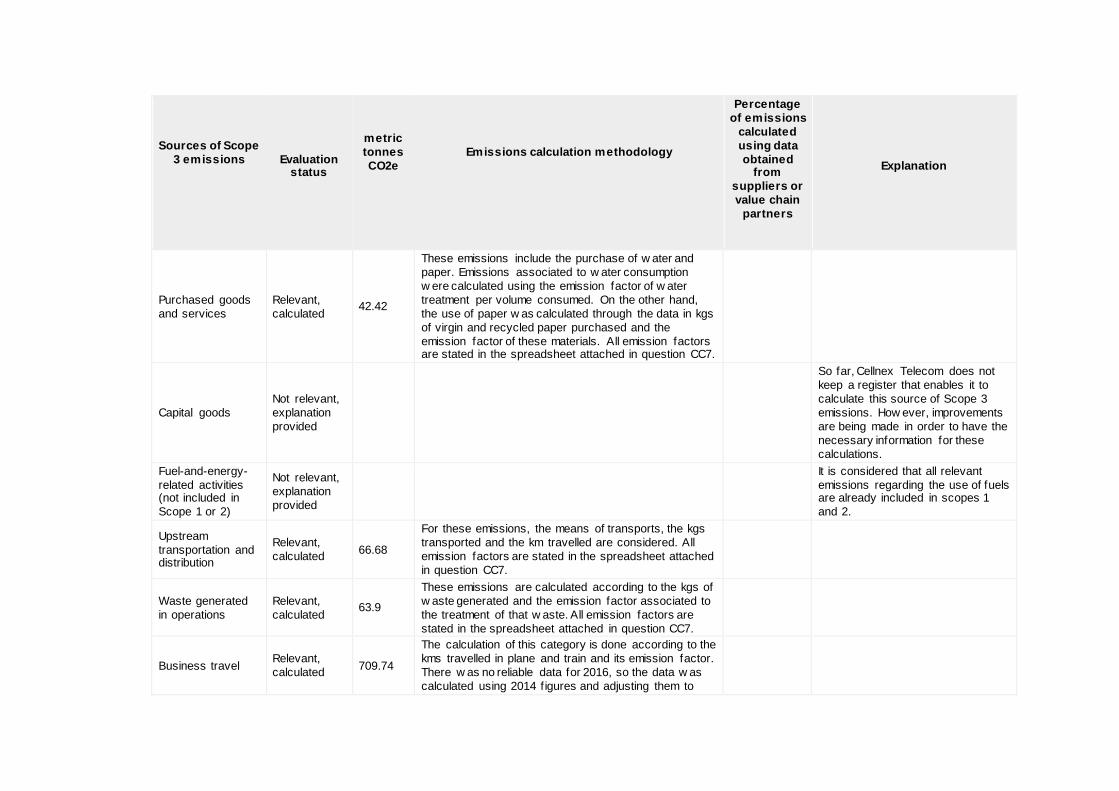
Sources of Scope 3 emissions
Evaluation status
metric tonnes CO2e
Emissions calculation methodology
Percentage of emissions
calculated using data obtained
from suppliers or value chain
partners
Explanation
Purchased goods and services
Relevant, calculated 42.42
These emissions include the purchase of w ater and paper. Emissions associated to w ater consumption w ere calculated using the emission factor of w ater treatment per volume consumed. On the other hand, the use of paper w as calculated through the data in kgs of virgin and recycled paper purchased and the emission factor of these materials. All emission factors are stated in the spreadsheet attached in question CC7.
Capital goods Not relevant, explanation provided
So far, Cellnex Telecom does not keep a register that enables it to calculate this source of Scope 3 emissions. How ever, improvements are being made in order to have the necessary information for these calculations.
Fuel-and-energy-related activities (not included in Scope 1 or 2)
Not relevant, explanation provided
It is considered that all relevant emissions regarding the use of fuels are already included in scopes 1 and 2.
Upstream transportation and distribution
Relevant, calculated 66.68
For these emissions, the means of transports, the kgs transported and the km travelled are considered. All emission factors are stated in the spreadsheet attached in question CC7.
Waste generated in operations
Relevant, calculated 63.9
These emissions are calculated according to the kgs of w aste generated and the emission factor associated to the treatment of that w aste. All emission factors are stated in the spreadsheet attached in question CC7.
Business travel Relevant, calculated 709.74
The calculation of this category is done according to the kms travelled in plane and train and its emission factor. There w as no reliable data for 2016, so the data w as calculated using 2014 f igures and adjusting them to
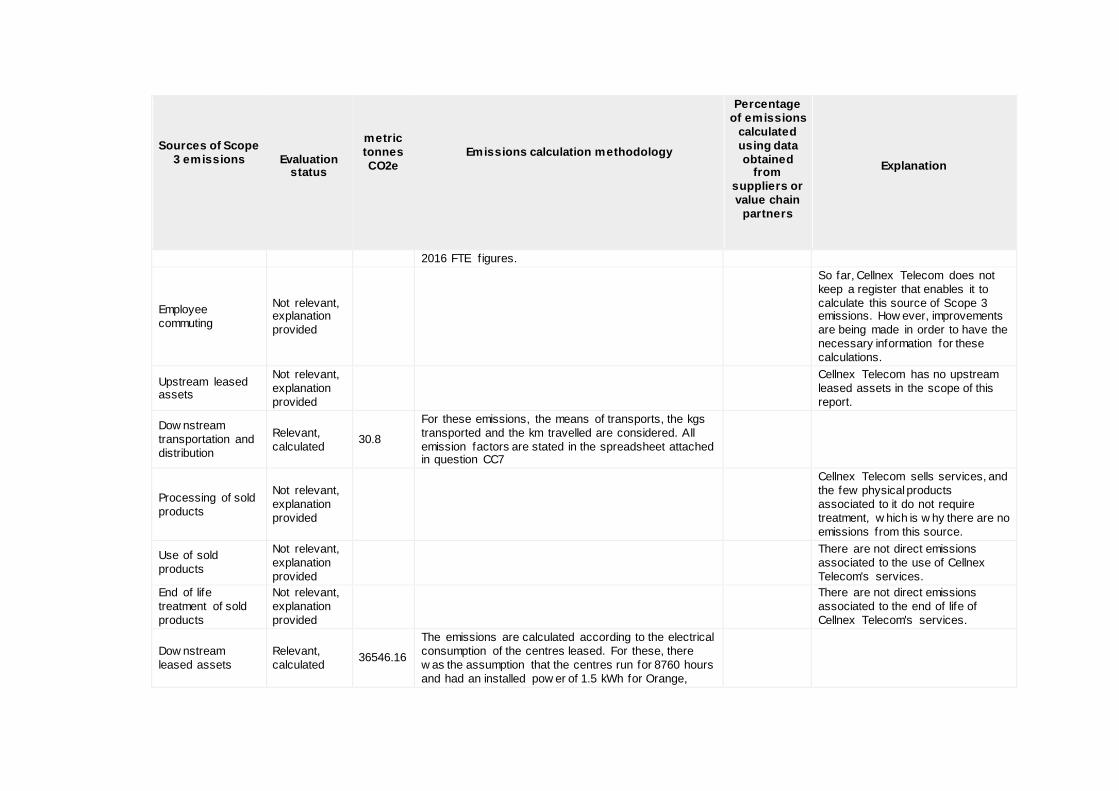
Sources of Scope 3 emissions
Evaluation status
metric tonnes CO2e
Emissions calculation methodology
Percentage of emissions
calculated using data obtained
from suppliers or value chain
partners
Explanation
2016 FTE figures.
Employee commuting
Not relevant, explanation provided
So far, Cellnex Telecom does not keep a register that enables it to calculate this source of Scope 3 emissions. How ever, improvements are being made in order to have the necessary information for these calculations.
Upstream leased assets
Not relevant, explanation provided
Cellnex Telecom has no upstream leased assets in the scope of this report.
Dow nstream transportation and distribution
Relevant, calculated 30.8
For these emissions, the means of transports, the kgs transported and the km travelled are considered. All emission factors are stated in the spreadsheet attached in question CC7
Processing of sold products
Not relevant, explanation provided
Cellnex Telecom sells services, and the few physical products associated to it do not require treatment, w hich is w hy there are no emissions from this source.
Use of sold products
Not relevant, explanation provided
There are not direct emissions associated to the use of Cellnex Telecom's services.
End of life treatment of sold products
Not relevant, explanation provided
There are not direct emissions associated to the end of life of Cellnex Telecom's services.
Dow nstream leased assets
Relevant, calculated 36546.16
The emissions are calculated according to the electrical consumption of the centres leased. For these, there w as the assumption that the centres run for 8760 hours and had an installed pow er of 1.5 kWh for Orange,
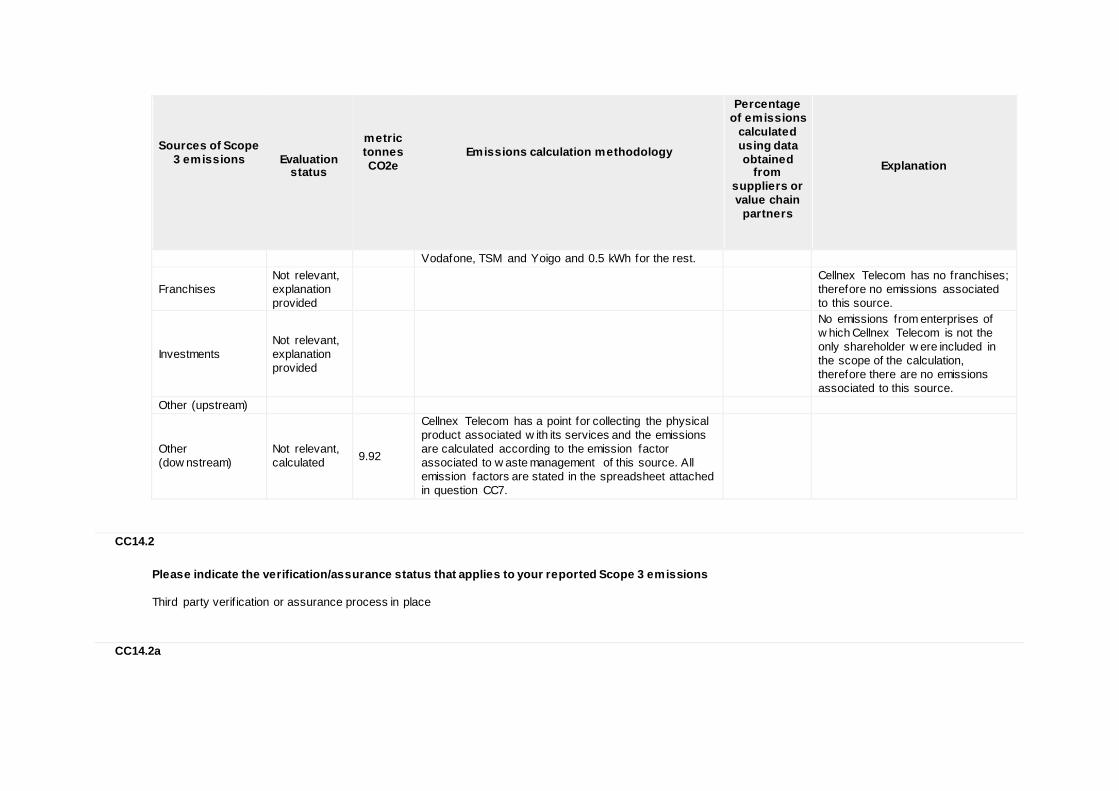
Sources of Scope 3 emissions
Evaluation status
metric tonnes CO2e
Emissions calculation methodology
Percentage of emissions
calculated using data obtained
from suppliers or value chain
partners
Explanation
Vodafone, TSM and Yoigo and 0.5 kWh for the rest.
Franchises Not relevant, explanation provided
Cellnex Telecom has no franchises; therefore no emissions associated to this source.
Investments Not relevant, explanation provided
No emissions from enterprises of w hich Cellnex Telecom is not the only shareholder w ere included in the scope of the calculation, therefore there are no emissions associated to this source.
Other (upstream)
Other (dow nstream)
Not relevant, calculated 9.92
Cellnex Telecom has a point for collecting the physical product associated w ith its services and the emissions are calculated according to the emission factor associated to w aste management of this source. All emission factors are stated in the spreadsheet attached in question CC7.
CC14.2
Please indicate the verification/assurance status that applies to your reported Scope 3 emissions Third party verif ication or assurance process in place
CC14.2a
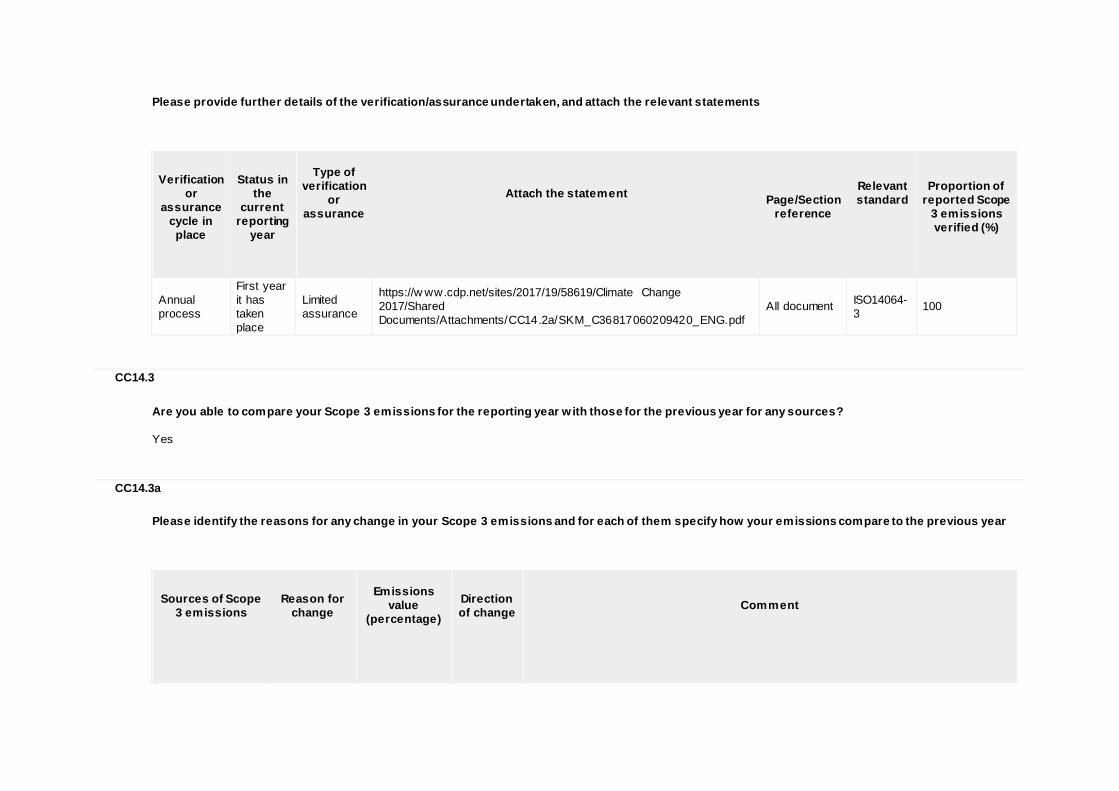
Please provide further details of the verification/assurance undertaken, and attach the relevant statements
Verification
or assurance
cycle in place
Status in
the current
reporting year
Type of
verification or
assurance
Attach the statement
Page/Section
reference
Relevant standard
Proportion of
reported Scope 3 emissions verified (%)
Annual process
First year it has taken place
Limited assurance
https://w ww.cdp.net/sites/2017/19/58619/Climate Change 2017/Shared Documents/Attachments/CC14.2a/SKM_C36817060209420_ENG.pdf
All document ISO14064-3 100
CC14.3
Are you able to compare your Scope 3 emissions for the reporting year w ith those for the previous year for any sources? Yes
CC14.3a
Please identify the reasons for any change in your Scope 3 emissions and for each of them specify how your emissions compare to the previous year
Sources of Scope
3 emissions
Reason for
change
Emissions
value (percentage)
Direction of change
Comment
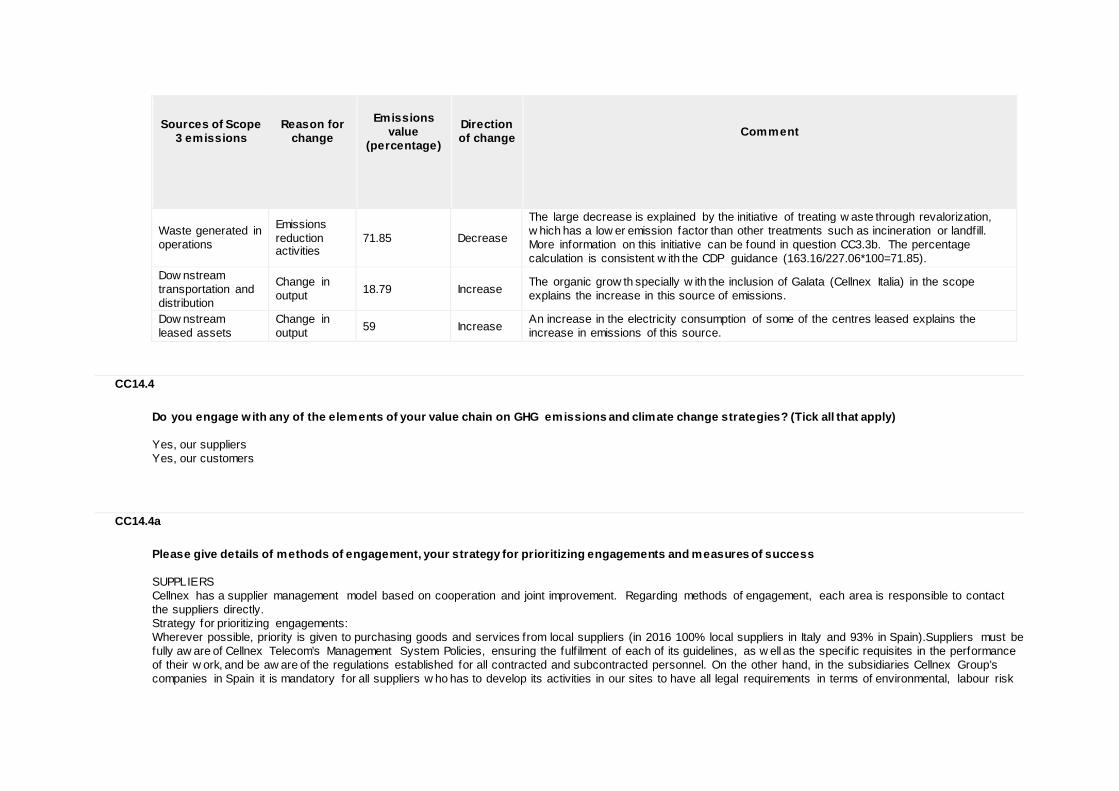
Sources of Scope
3 emissions
Reason for
change
Emissions
value (percentage)
Direction of change
Comment
Waste generated in operations
Emissions reduction activities
71.85 Decrease
The large decrease is explained by the initiative of treating w aste through revalorization, w hich has a low er emission factor than other treatments such as incineration or landfill. More information on this initiative can be found in question CC3.3b. The percentage calculation is consistent w ith the CDP guidance (163.16/227.06*100=71.85).
Dow nstream transportation and distribution
Change in output 18.79 Increase The organic grow th specially w ith the inclusion of Galata (Cellnex Italia) in the scope
explains the increase in this source of emissions.
Dow nstream leased assets
Change in output 59 Increase An increase in the electricity consumption of some of the centres leased explains the
increase in emissions of this source.
CC14.4
Do you engage with any of the elements of your value chain on GHG emissions and climate change strategies? (Tick all that apply) Yes, our suppliers Yes, our customers
CC14.4a
Please give details of methods of engagement, your strategy for prioritizing engagements and measures of success SUPPLIERS Cellnex has a supplier management model based on cooperation and joint improvement. Regarding methods of engagement, each area is responsible to contact the suppliers directly. Strategy for prioritizing engagements: Wherever possible, priority is given to purchasing goods and services from local suppliers (in 2016 100% local suppliers in Italy and 93% in Spain).Suppliers must be fully aw are of Cellnex Telecom’s Management System Policies, ensuring the fulf ilment of each of its guidelines, as w ell as the specif ic requisites in the performance of their w ork, and be aw are of the regulations established for all contracted and subcontracted personnel. On the other hand, in the subsidiaries Cellnex Group’s companies in Spain it is mandatory for all suppliers w ho has to develop its activities in our sites to have all legal requirements in terms of environmental, labour risk
prevention and labour conditions. These make it possible to fulf il the obligations under the Law on Occupational Risk Prevention and other complementary legislation to avoid generating negative environmental impacts during the course of their w ork. If these do occur, the necessary corrective measures must be implemented to address them. All this information is registered in a proprietary system named COSMOS. Cellnex Telecom measures success of engagement taking into account the most signif icant purchases, w hich go through the Audit and Control Committee. The subsidiaries Cellnex Group’s companies in Spain companies have systems for the evaluation, selection and monitoring of suppliers. On the one hand, the company has an internal procedure listing the criteria and steps to follow to become a Cellnex Telecom provider. At a later stage, suppliers’ performance is evaluated using quality and time criteria to obtain a classif ication by levels based on the result. For suppliers w ith unsatisfactory results, w hile there is a desire to continue the business relationship, an action plan is established to correct and adjust their service level to that required by Cellnex Telecom. In 2016, the subsidiaries Cellnex Group’s companies in Spain incorporate another supplier evaluation system that covers three basic areas of sustainability: ethics, respect for the environment and labour relations. This evaluation sets out to have a clearer picture, from the point of view of sustainability, of the providers from w hich the company purchases most. Incidences related to ethics, respect for the environment and labour relations are reported from the total of assessed suppliers. Regarding Cellnex Italia, tw o questionnaires are sent to all suppliers, one of them regarding environmental issues, w here they are asked w hether they have an environmental policy and an environmental audit plan, among other questions. Results from the questionnaires are evaluated and in case of a very negative result Cellnex Telecom considers carrying out an action plan. POLICY MAKERS Cellnex Telecom has a close relationship w ith the various public administrations in Spain, Italy and Europe. The services associated w ith Cellnex Telecom’s broadcasting business are regulated primarily by the State administration responsible for communications. As Cellnex Telecom is a w holesale operator w ith signif icant market pow er(SMP) for the broadcast carrier service of the television signal, the National Commission for Markets and Competition(CNMC) is also relevant to the Company. Responsibility for security, the environment and construction is also shared betw een the Autonomous Community and local administrations. Cellnex Telecom also plays an active role in defending the industry’s positions, especially w ith regard to the allocation of radio spectrum to audiovisual broadcasting services. CUSTOMERS Cellnex Telecom’s relationship w ith its customers is based on providing high added value and high quality services, through w hich it establishes close, stable and constantly improving relationships. Given the type of service is provides, Cellnex Telecom’s customer base is composed of a small number of large customers. Cellnex Telecom’s relationships w ith external customers centres around the account manager, an employee w ho has a deep understanding of all signif icant events affecting the customer. This management style is designed to provide a personalised service and to improve response time and overall customer satisfaction. One of the basic aspects of the service provided focuses on the management of incidents, complaints, inquiries and claims about the operation of the service, in real time and after it has been provided. The Company has established a number of communication channels w ith customers, such as those contained in the service-level agreement (SLA) reports or the biennial studies of perceived customer satisfaction, the outcome of w hich feeds into action and improvement plans
CC14.4b
To give a sense of scale of this engagement, please give the number of suppliers w ith whom you are engaging and the proportion of your total spend that they represent

Type of
engagement
Number of
suppliers
% of total spend
(direct and indirect)
Impact of engagement
Compliance 357 80%
The subsidiaries Cellnex Group’s companies in Spain updated and refined its suppliers' evaluation systems in 2016 using supplier evaluation in three basic areas of sustainability: ethics, respect for the environment and labour relations. This evaluation process w as addressed to suppliers that had admission through the opex/capex committee and it sets out to have a clearer picture from the point of view of sustainability. The new evaluation model w as implemented in Spain and w ork is ongoing to set these up in other countries over the coming years. Cellnex Telecom measures success of engagement taking into account the most signif icant purchases, w hich go through the Audit and Control Committee.
CC14.4c
Please explain why you do not engage with any elements of your value chain on GHG emissions and climate change strategies, and any plans you have to develop an engagement strategy in the future
Further Information
The emission values in this report may differ from the values published in the integrated annual report. This is because the publication of the integrated annual report took place before the carbon footprint verif ication, w here some of the values w ere slightly modif ied. This explains the small differences betw een the values in the tw o reports. The f irst carbon footprint verif ication took place in the year 2016, w here both carbon footprints, of 2015 and 2016, w ere verif ied.
Module: Sign Off
Page: CC15. Sign Off
CC15.1
Please provide the following information for the person that has signed off (approved) your CDP climate change response
Name
Job title
Corresponding job category
Toni Brunet Corporate & Public Affairs Director Public affairs manager
Further Information
Module: ICT
Page: ICT1. Data center activities
ICT0.1a
Please identify whether "data centers" comprise a significant component of your business within your reporting boundary No
ICT1.1
Please provide a description of the parts of your business that fall under “data centers”
ICT1.2
Please provide your absolute Scope 1 and 2 emissions and electricity consumption for the data centers component of your business
Business activity
Scope 1 emissions (metric tonnes CO2e)
Scope 2 emissions (metric tonnes CO2e)
Annual electricity consumption (MWh)
Electricity data collection method
Comment
ICT1.3
What percentage of your ICT population sits in data centers where Power Usage Effectiveness (PUE) is measured on a regular basis?
Percentage
Comment
ICT1.4
Please provide a Power Usage Effectiveness (PUE) value for your data center(s). You can provide this information as (a) an average, (b) a range or (c) by individual data center - please tick the data you wish to provide (tick all that apply)
ICT1.4a
Please provide your average PUE across your data centers
Number of data centers
Average PUE
% change from previous year
Direction of change
Comment
ICT1.4b
Please provide the range of PUE values across your data centers
Number of data centers
PUE Minimum Value
% change of PUE Minimum Value from
previous year
PUE Maximum Value
% change of PUE Maximum Value from
previous year
Direction of change
Comment
ICT1.4c
Please provide your PUE values of all your data centers
Data center reference
PUE value
% change from previous year
Direction of change
Comment
ICT1.5
Please provide details of how you have calculated your PUE value
ICT1.6
Do you use any alternative intensity metrics to assess the energy or emissions performance of your data center(s)?
ICT1.6a
Please provide details on the alternative intensity metrics you use to assess the energy or the emissions performance of your data center(s)
ICT1.7
Please identify the measures you are planning or have undertaken in the reporting year to increase the energy efficiency of your data center(s)
Status in reporting year
Energy efficiency measure
Comment
ICT1.8
Do you participate in any other data center efficiency schemes or have buildings that are sustainably certified or rated?
ICT1.8a
Please provide details on the data center efficiency schemes you participate in or the buildings that are sustainably certified or rated
Scheme name
Level/certification (or equivalent) achieved in the reporting year
Percentage of your overall facilities to which the scheme applies
ICT1.9
Do you measure the utilization rate of your data center(s)?
ICT1.9a
What methodology do you use to calculate the utilization rate of your data center(s)?
ICT1.10
Do you provide carbon emissions data to your clients regarding the data center services they procure?
ICT1.10a
How do you provide carbon emissions data to your clients regarding the data center services they procure?
ICT1.11
Please describe any efforts you have made to incorporate renewable energy into the electricity supply to your data center(s) or to re-use waste heat
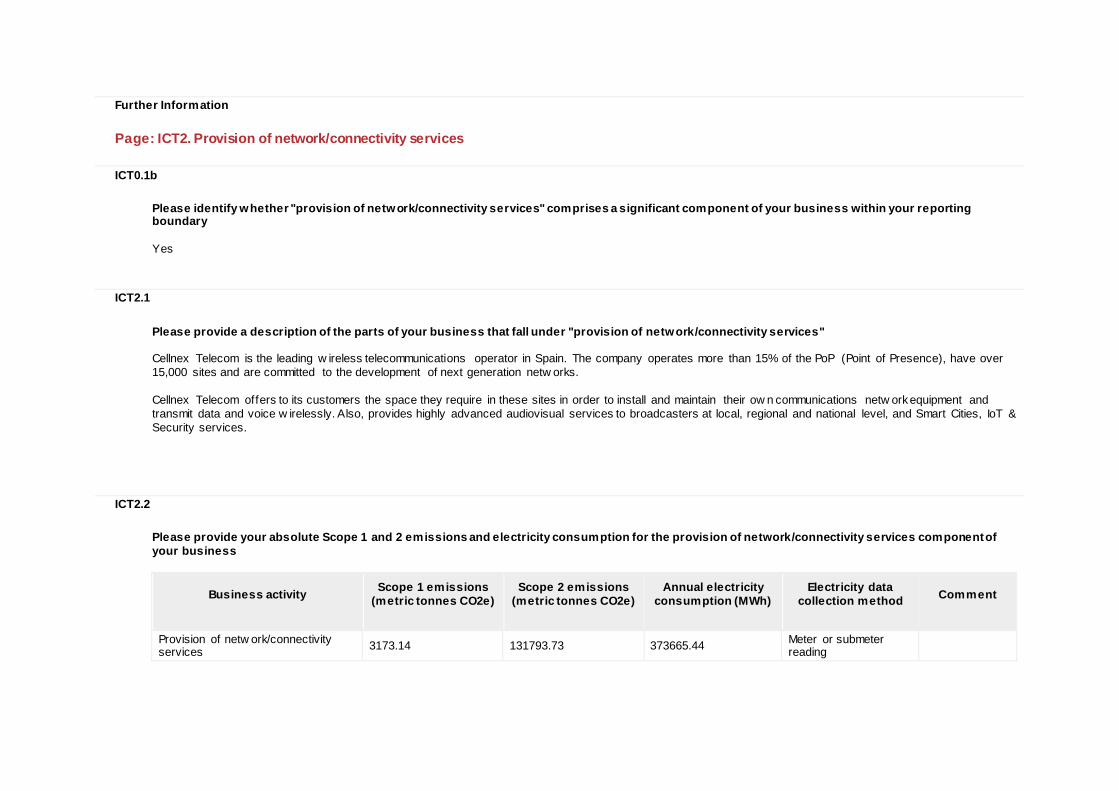
Further Information
Page: ICT2. Provision of network/connectivity services
ICT0.1b
Please identify whether "provision of network/connectivity services" comprises a significant component of your business within your reporting boundary Yes
ICT2.1
Please provide a description of the parts of your business that fall under "provision of network/connectivity services" Cellnex Telecom is the leading w ireless telecommunications operator in Spain. The company operates more than 15% of the PoP (Point of Presence), have over 15,000 sites and are committed to the development of next generation netw orks. Cellnex Telecom offers to its customers the space they require in these sites in order to install and maintain their ow n communications netw ork equipment and transmit data and voice w irelessly. Also, provides highly advanced audiovisual services to broadcasters at local, regional and national level, and Smart Cities, IoT & Security services.
ICT2.2
Please provide your absolute Scope 1 and 2 emissions and electricity consumption for the provision of network/connectivity services component of your business
Business activity
Scope 1 emissions (metric tonnes CO2e)
Scope 2 emissions (metric tonnes CO2e)
Annual electricity consumption (MWh)
Electricity data collection method
Comment
Provision of netw ork/connectivity services 3173.14 131793.73 373665.44 Meter or submeter
reading
ICT2.3
Please describe your gross combined Scope 1 and 2 emissions or electricity use for the provision of network/connectivity services component of your business as an intensity metric
Intensity figure
Metric numerator
Metric denominator
% change from
previous year
Direction of change from previous year
Reason for change
Comment
8.99 metric tonnes CO2e
Other: Netw ork Centers 25.38 Increase
This year 2016 the Company Galata (Cellnex Italia) w as included in the scope, w hich explains the big increase in emissions in scope1+2 compared to 2015, and thus the increase in the intensity f igure.
ICT2.4
Please explain how you calculated the intensity figures given in response to Question ICT2.3 This f igure w as calculated dividing the sum of Scope 1 and Scope 2 emissions (from the subsidiaries Cellnex Group’s companies in Spain and Cellnex Italia) by the total netw ork points/sites (15018).
ICT2.5
Do you provide carbon emissions data to your clients regarding the network/connectivity services they procure? Yes
ICT2.5a
How do you provide carbon emissions data to your clients regarding the network/connectivity services they procure? In 2016 Cellnex Telecom continued w orking on the softw are application Clean CO2, w hich calculates and offsets both the corporate carbon footprint of the Group’s companies and the carbon footprint of the services it offers to its customers. This tool, based on the methodologies for calculating the carbon footprint in ISO 14064-1: 2012 and the Greenhouse Gas Protocol, aims to introduce the concept of sustainability and carbon management into the services that Cellnex Telecom provides to its customers, for the calculation, management, offsetting and notif ication of the impact on climate change through the use of the services provided. Clean CO2
gives the client company the capability to offset GHG emissions and obtain the “certif ied CO2 Clean” label, a document certifying that the service offered to the customer is neutral in terms of GHG emissions.
Further Information
The emission values in this report may differ from the values published in the integrated annual report. This is because the publication of the integrated annual report took place before the carbon footprint verif ication, w here some of the values w ere modif ied slightly. This explains the small differences betw een the values in the tw o reports.
Page: ICT3. Manufacture or assembly of hardware/components
ICT0.1c
Please identify whether "manufacture or assembly of hardware/components" comprises a significant part of your business w ithin your reporting boundary No
ICT3.1
Please provide a description of the parts of your business that fall under "manufacture or assembly of hardware/components"
ICT3.2
Please provide your absolute Scope 1 and 2 emissions and electricity consumption for the manufacture or assembly of hardware/components part of your business
Business activity
Scope 1 emissions (metric tonnes CO2e)
Scope 2 emissions (metric tonnes CO2e)
Annual electricity consumption (MWh)
Electricity data collection method
Comment
ICT3.3
Please identify the percentage of your products meeting recognized energy efficiency standards/specifications by sales weighted volume (full product range)
Product type
Standard (sleep mode)
Percentage of products meeting the
standard by sales volume (sleep mode)
Standard (standby mode)
Percentage of products meeting the
standard by sales volume (standby
mode)
Standard (in use mode)
Percentage of products meeting the
standard by sales volume (in use mode)
Comment
ICT3.4
Of the new products released in the reporting year, please identify the percentage (as a percentage of all new products in that product type category) that meet recognized energy efficiency standards/specifications
Product type
Standard (sleep mode)
Percentage of new products meeting
the standard (sleep mode)
Standard (standby mode)
Percentage of new products meeting
the standard (standby mode)
Standard (in use mode)
Percentage of new products meeting
the standard (in use mode)
Comment
ICT3.5
Please describe the efforts your organization has made to improve the energy efficiency of your products
ICT3.6
Please describe the GHG emissions abatement measures you have employed specifically in your ICT manufacturing operations
ICT3.7
Do you provide carbon emissions data to your clients regarding the hardware/component products they procure?
ICT3.7a
How do you provide carbon emissions data to your clients regarding the hardware/component products they procure?
Further Information
Page: ICT4. Manufacture of software
ICT0.1d
Please identify whether "manufacture of software" comprises a significant component of your business within your reporting boundary No
ICT4.1
Please provide a description of the parts of your business that fall under "manufacture of software"
ICT4.2
Please provide your absolute Scope 1 and 2 emissions and electricity consumption for the software manufacture component of your business
Business activity
Scope 1 emissions (metric tonnes CO2e)
Scope 2 emissions (metric tonnes CO2e)
Annual electricity consumption (MWh)
Electricity data collection method
Comment
ICT4.3
Please describe your gross combined Scope 1 and 2 emissions for the software manufacture component of your business in metric tonnes CO2e per unit of production
Intensity figure
Metric numerator
Metric denominator
% change from previous year
Direction of change from previous year
Reason for change
Comment
ICT4.4
What percentage of your software sales (by volume) is in an electronic format?
ICT4.5
Do you provide carbon emissions data to your clients regarding the software products they procure?
ICT4.5a
How do you provide carbon emissions data to your clients regarding the software products they procure?
Further Information
Page: ICT5. Business services (office based activities)
ICT0.1e
Please identify whether "business services (office based activities)" comprise a significant component of your business within your reporting boundary No
ICT5.1
Please provide a description of the parts of your business that fall under "business services (office based activities)"
ICT5.2
Please provide your absolute Scope 1 and 2 emissions and electricity consumption for the business services (office based activities) component of your business
Business activity
Scope 1 emissions (metric tonnes CO2e)
Scope 2 emissions (metric tonnes CO2e)
Annual electricity consumption (MWh)
Electricity data collection method
Comment
ICT5.3
Please describe your gross combined Scope 1 and 2 emissions for the business services (office based activities) component of your business in metric tonnes per square meter
Intensity figure
Metric numerator
Metric denominator
% change from previous year
Direction of change from previous year
Reason for change
Comment
ICT5.4
Please describe your electricity use for the provision of business services (office based activities) component of your business in MWh per square meter
Intensity figure
Metric numerator
Metric denominator
% change from previous year
Direction of change from previous year
Reason for change
Comment
Further Information
Page: ICT6. Other activities
ICT0.1f
Please identify whether "other activities" comprise a significant component of your business within your reporting boundary No
ICT6.1
Please provide a description of the parts of your business that fall under "other"
ICT6.2
Please provide your absolute Scope 1 and 2 emissions and electricity consumption for the identified other activity component of your business
Activity
Scope 1 emissions (metric tonnes CO2e)
Scope 2 emissions (metric tonnes CO2e)
Annual electricity consumption (MWh)
Electricity data collection method
Comment
ICT6.3
Please describe your gross combined Scope 1 and 2 emissions for your defined additional activity using an appropriate activity based intensity metric
Activity
Intensity figure
Metric numerator
Metric denominator
% change from
previous year
Direction of change from previous year
Reason for change
Comment
ICT6.4
If appropriate, please describe your electricity use for your defined additional activity using an appropriate activity based intensity metric
Activity
Intensity figure
Metric numerator
Metric denominator
% change from
previous year
Direction of change from previous year
Reason for change
Comment
Further Information
CDP 2017 Climate Change 2017 Information Request