Embed Size (px)
Citation preview
Carousel Method
Using the Carousel Method to Collect Average Vehicle Occupancy Data for Multi-Lane Freeways
July 20, 2015 Session 2B-1
10:30 a.m. – 12:00 p.m.
Grant G. Schultz, Ph.D., P.E., PTOE Associate Professor, Department of Civil & Environmental Engineering
Samuel T. Mineer, E.I.T. Graduate Research Assistants
Using the Carousel Method to Collect Average Vehicle Occupancy
Data for Multi-Lane Freeways
Outline
• Introduction
• Carousel Method Explanation
• Comparison to Traditional Methods
• Carousel Method Procedures
• Data Collection Results
• Conclusions

Using the Carousel Method to Collect Average Vehicle Occupancy
Data for Multi-Lane Freeways
Introduction
• UDOT Express Lanes study (2013-2014)
• Need for average vehicle occupancy (AVO) data for multi-Lane freeways
• Of several methodologies, the Carousel Method was best fit for the Express Lanes study
Using the Carousel Method to Collect Average Vehicle Occupancy
Data for Multi-Lane Freeways
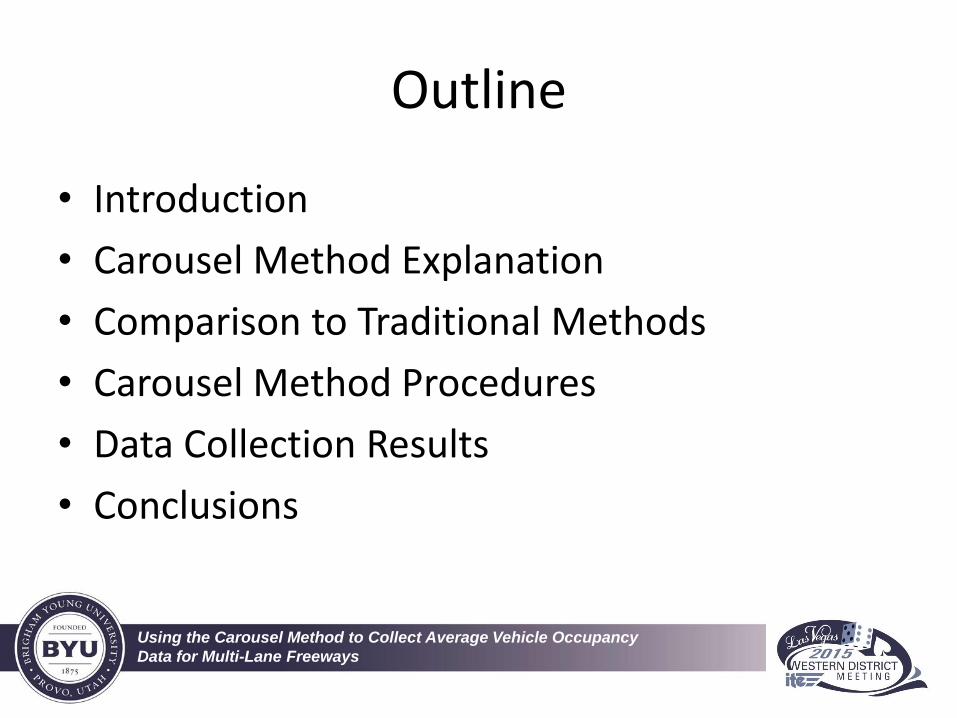
Carousel Method Explanation
• Carousel Method is almost like…
4
Photo credit: www.kaviarasu.com

Using the Carousel Method to Collect Average Vehicle Occupancy
Data for Multi-Lane Freeways
Carousel Method Explanation
• Overview of Carousel Method:
– Involves one or more observation vehicles driving concurrent with the flow of traffic
– In each observation vehicle, there is a driver and multiple observers; the driver focuses on maintaining speeds, while the observers focus on their assigned lane(s)
– The observation vehicle drives slightly slower than the flow of surrounding traffic (~5-10 mph)
5
Using the Carousel Method to Collect Average Vehicle Occupancy
Data for Multi-Lane Freeways
Comparison to Traditional Methods
• Roadside Method:
– A team of observers position themselves along the roadway of interest and count the passengers in the vehicles that pass by them
– Within the team of observers, each observer is assigned a lane to collect AVO data from
6

Using the Carousel Method to Collect Average Vehicle Occupancy
Data for Multi-Lane Freeways
Comparison to Traditional Methods
• Roadside Method vs. Carousel Method:
– The Carousel Method yields fewer samples but is perceived to collect more “accurate” data along a high speed roadway
– Moving concurrent with traffic allows for additional time to make an accurate observation
– Stationary observation (Roadside Method) can become less accurate as vehicle speed by at 65+ mph, while windshield glare restricts visibility
7
Using the Carousel Method to Collect Average Vehicle Occupancy
Data for Multi-Lane Freeways
Comparison to Traditional Methods
• Video Recording Method:
– Similar to the Roadside Method, a video camera replaces the presence of an observer in the field
– The video is processed after a given recording schedule
8
Using the Carousel Method to Collect Average Vehicle Occupancy
Data for Multi-Lane Freeways
Comparison to Traditional Methods
• Video Recording Method vs. Carousel Method:
– Video recordings are susceptible to windshield glare, theft, damage from the weather, and the additional time commitment to process the video
9

Using the Carousel Method to Collect Average Vehicle Occupancy
Data for Multi-Lane Freeways
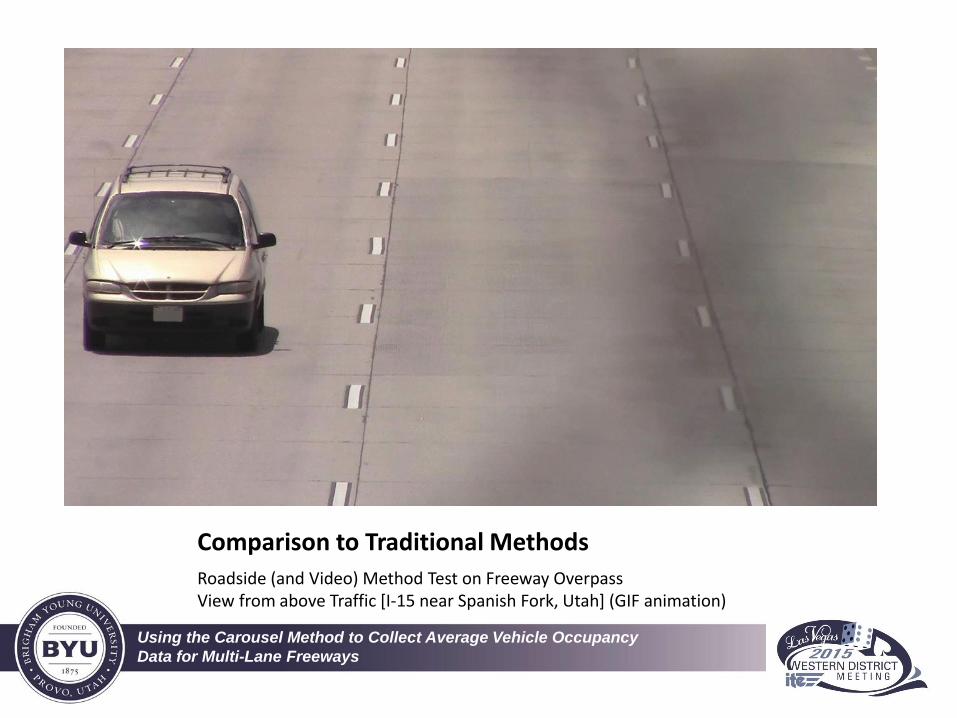
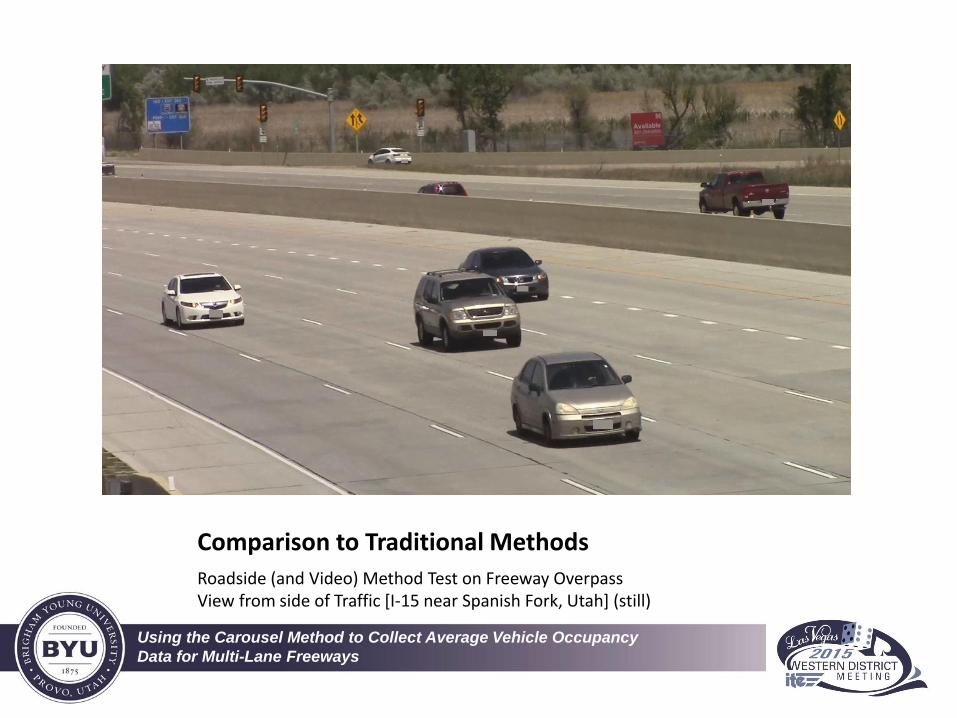
Comparison to Traditional Methods
Roadside (and Video) Method Test on Freeway Overpass View from above Traffic [I-15 near Spanish Fork, Utah] (still)
Using the Carousel Method to Collect Average Vehicle Occupancy
Data for Multi-Lane Freeways
Comparison to Traditional Methods
Roadside (and Video) Method Test on Freeway Overpass View from above Traffic [I-15 near Spanish Fork, Utah] (GIF animation)
Using the Carousel Method to Collect Average Vehicle Occupancy
Data for Multi-Lane Freeways
Comparison to Traditional Methods
Roadside (and Video) Method Test on Freeway Overpass View from side of Traffic [I-15 near Spanish Fork, Utah] (still)

Using the Carousel Method to Collect Average Vehicle Occupancy
Data for Multi-Lane Freeways
Comparison to Traditional Methods
Roadside (and Video) Method Test on Freeway Overpass View from side of Traffic [I-15 near Spanish Fork, Utah] (GIF animation)
Using the Carousel Method to Collect Average Vehicle Occupancy
Data for Multi-Lane Freeways
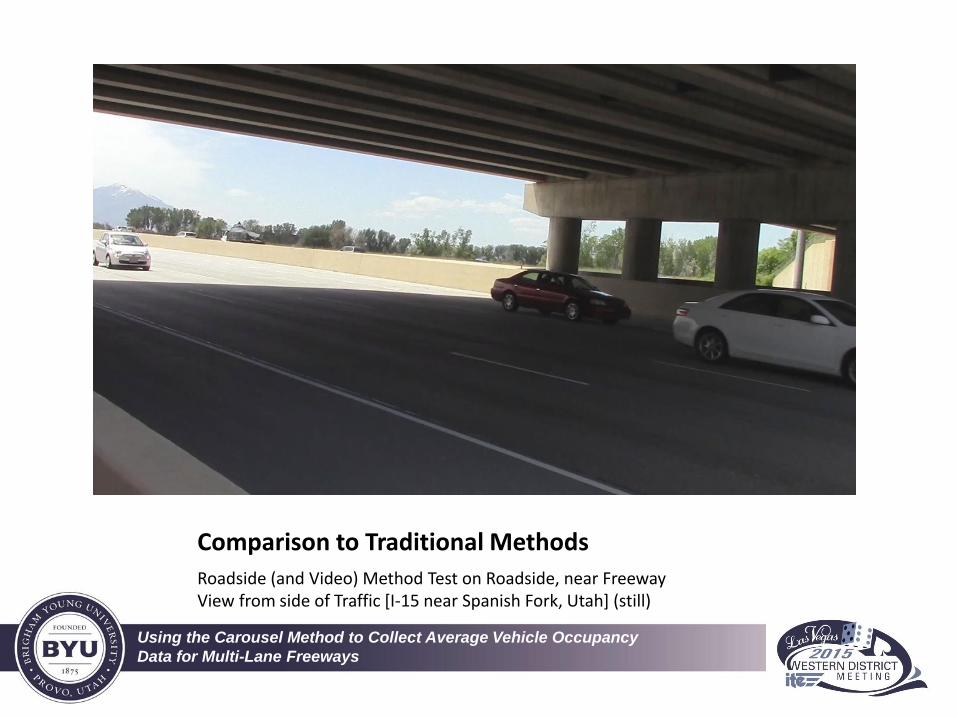
Comparison to Traditional Methods
Roadside (and Video) Method Test on Roadside, near Freeway View from side of Traffic [I-15 near Spanish Fork, Utah] (still)
Using the Carousel Method to Collect Average Vehicle Occupancy
Data for Multi-Lane Freeways
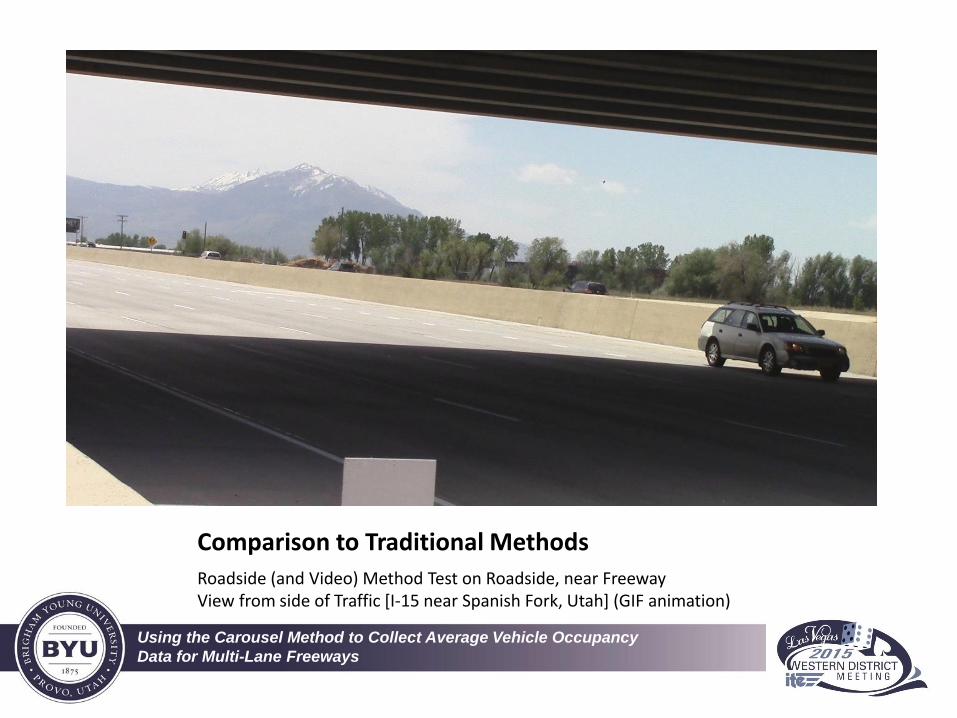
Comparison to Traditional Methods
Roadside (and Video) Method Test on Roadside, near Freeway View from side of Traffic [I-15 near Spanish Fork, Utah] (GIF animation)

Using the Carousel Method to Collect Average Vehicle Occupancy
Data for Multi-Lane Freeways
Comparison to Traditional Methods
• Survey/Accident Database Methods:
– Non-field collection methods
– Surveys can be conducted in a region to collect trip data, including vehicle occupancy data
– Vehicle occupancy data can also be extracted from accident database records
16
Using the Carousel Method to Collect Average Vehicle Occupancy
Data for Multi-Lane Freeways
Comparison to Traditional Methods
• Survey/Accident Database Method vs. Carousel Method:
– These non-field methods can create trends over a period of time but may not be able to extract sufficient data for a specific segment of roadway
– The Carousel Method can collect data in “near real-time,” providing information for specific areas of interest
17
Using the Carousel Method to Collect Average Vehicle Occupancy
Data for Multi-Lane Freeways
Comparison to Traditional Methods
• Infrared Method:
– An infrared system can automate occupancy detection with special camera lenses, infrared emitters, and a detection algorithm
18
Using the Carousel Method to Collect Average Vehicle Occupancy
Data for Multi-Lane Freeways
Comparison to Traditional Methods
• Infrared Method vs. Carousel Method:
– Infrared systems can be expensive to implement
– The algorithms to automate AVO counts are still being developed and refined
– The Carousel Method is ready to use immediately
19
Using the Carousel Method to Collect Average Vehicle Occupancy
Data for Multi-Lane Freeways
Carousel Method Procedures
• Routes: – When implementing the Carousel Method,
observers have the ability to travel the entire length of the area of interest, which allows the method to be tailored to any freeway setup
– The observation team begins at a predetermined point, traveling in one direction – once the extent of the area of interest is reached, the observation team will exit the freeway and re-enter going the opposite direction
20

Using the Carousel Method to Collect Average Vehicle Occupancy
Data for Multi-Lane Freeways
Carousel Method Procedures
Example of Routes used in UDOT Express Lanes Study
21
Study Extents
State Street Exit (Centerville, UT)
U.S. 6 Junction (Spanish Fork, UT)
Route Length
~56 miles
(110 mile loop)
Utah Example
Using the Carousel Method to Collect Average Vehicle Occupancy
Data for Multi-Lane Freeways
Carousel Method Procedures
• Collection periods:
– Data collection can occur during the entirety of a day or for different time periods
– Data collection is recommended to be conducted during non-holiday weekdays
– The recommended days to collect AVO data are on Tuesday, Wednesday, and Thursday
– Can be implemented quickly for short studies or as part of a much longer data collection effort
22
Using the Carousel Method to Collect Average Vehicle Occupancy
Data for Multi-Lane Freeways
Carousel Method Procedures
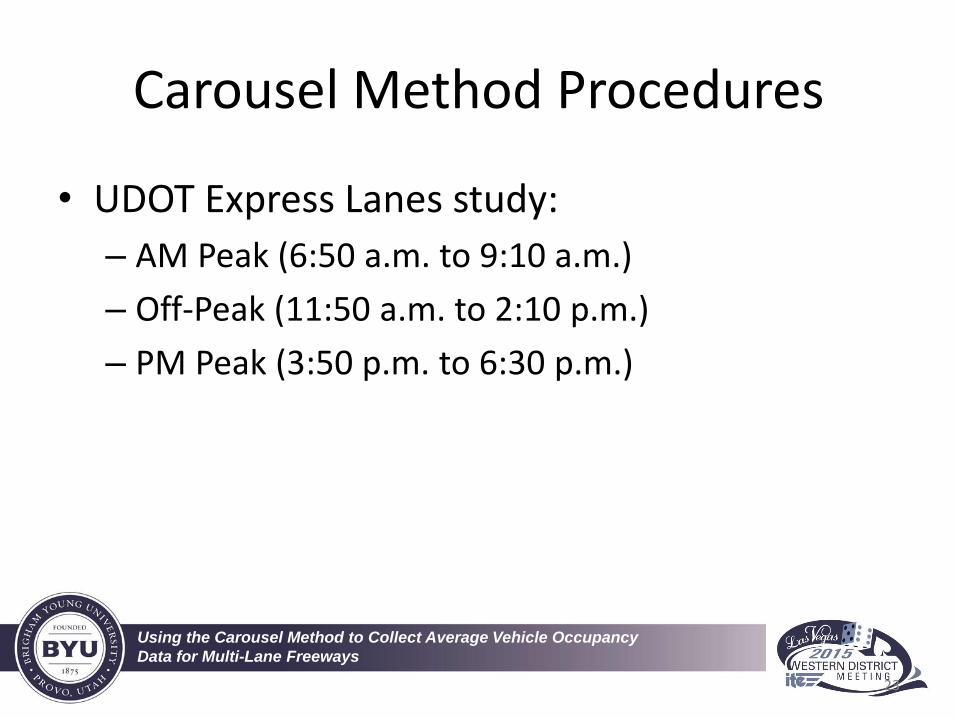
• UDOT Express Lanes study:
– AM Peak (6:50 a.m. to 9:10 a.m.)
– Off-Peak (11:50 a.m. to 2:10 p.m.)
– PM Peak (3:50 p.m. to 6:30 p.m.)
23
Using the Carousel Method to Collect Average Vehicle Occupancy
Data for Multi-Lane Freeways
Carousel Method Procedures
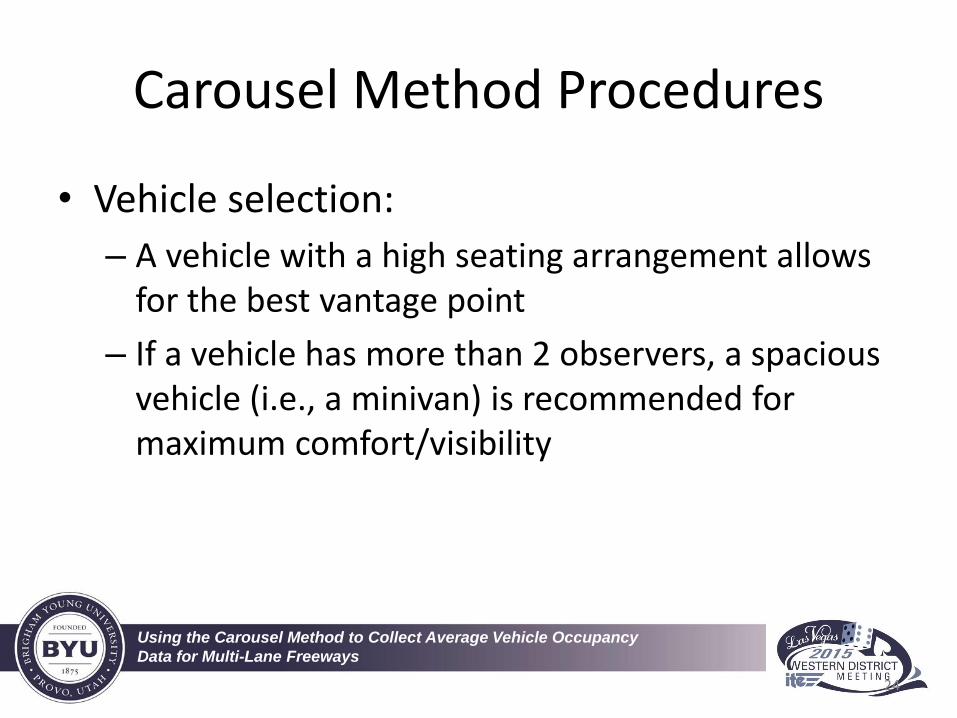
• Vehicle selection:
– A vehicle with a high seating arrangement allows for the best vantage point
– If a vehicle has more than 2 observers, a spacious vehicle (i.e., a minivan) is recommended for maximum comfort/visibility
24
Using the Carousel Method to Collect Average Vehicle Occupancy
Data for Multi-Lane Freeways
Carousel Method Procedures
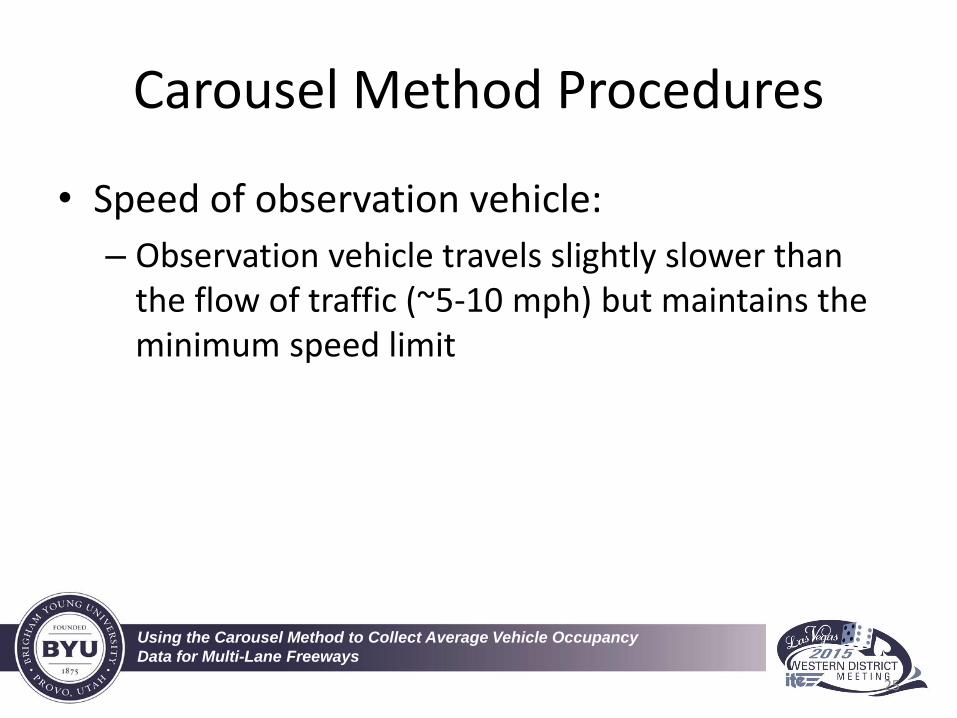
• Speed of observation vehicle:
– Observation vehicle travels slightly slower than the flow of traffic (~5-10 mph) but maintains the minimum speed limit
25
Using the Carousel Method to Collect Average Vehicle Occupancy
Data for Multi-Lane Freeways
Carousel Method Procedures
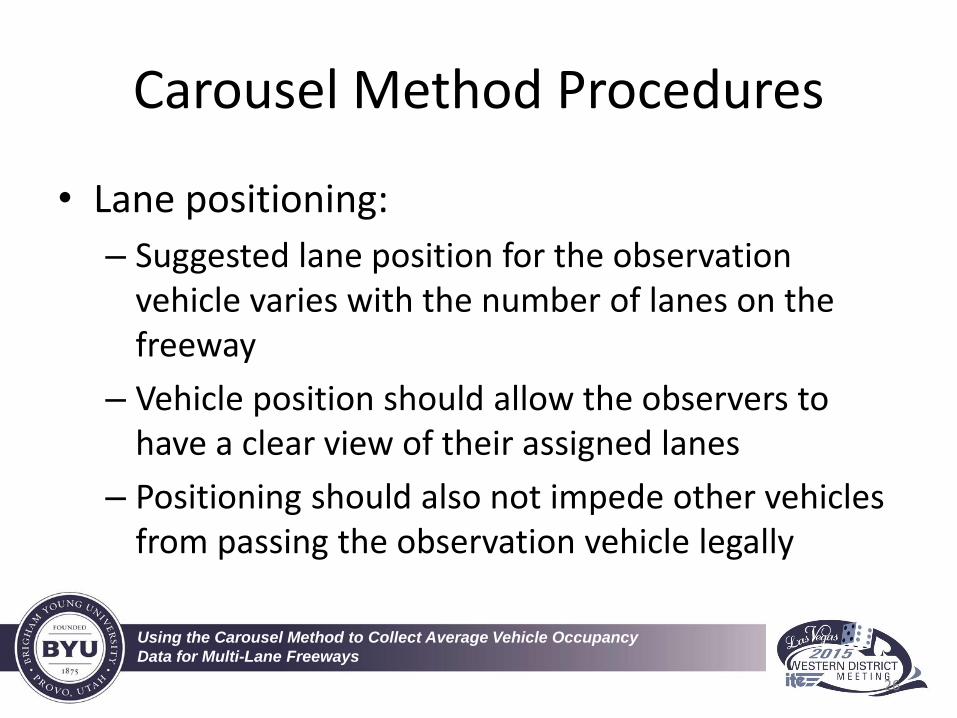
• Lane positioning:
– Suggested lane position for the observation vehicle varies with the number of lanes on the freeway
– Vehicle position should allow the observers to have a clear view of their assigned lanes
– Positioning should also not impede other vehicles from passing the observation vehicle legally
26
Using the Carousel Method to Collect Average Vehicle Occupancy
Data for Multi-Lane Freeways
Carousel Method Procedures
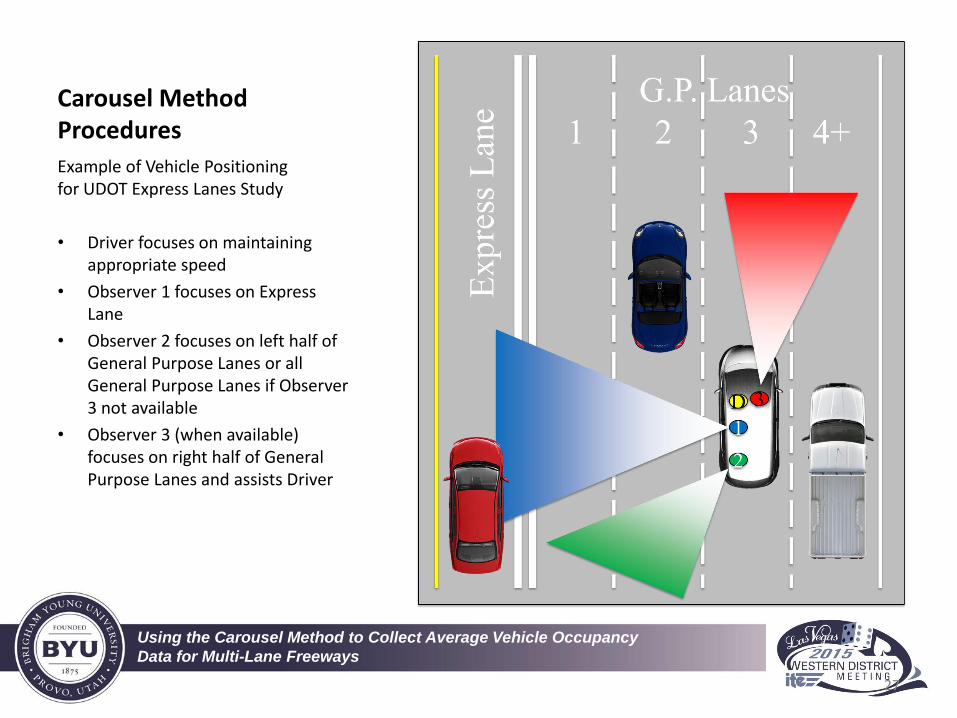
Example of Vehicle Positioning for UDOT Express Lanes Study
• Driver focuses on maintaining appropriate speed
• Observer 1 focuses on Express Lane
• Observer 2 focuses on left half of General Purpose Lanes or all General Purpose Lanes if Observer 3 not available
• Observer 3 (when available) focuses on right half of General Purpose Lanes and assists Driver
27
Using the Carousel Method to Collect Average Vehicle Occupancy
Data for Multi-Lane Freeways
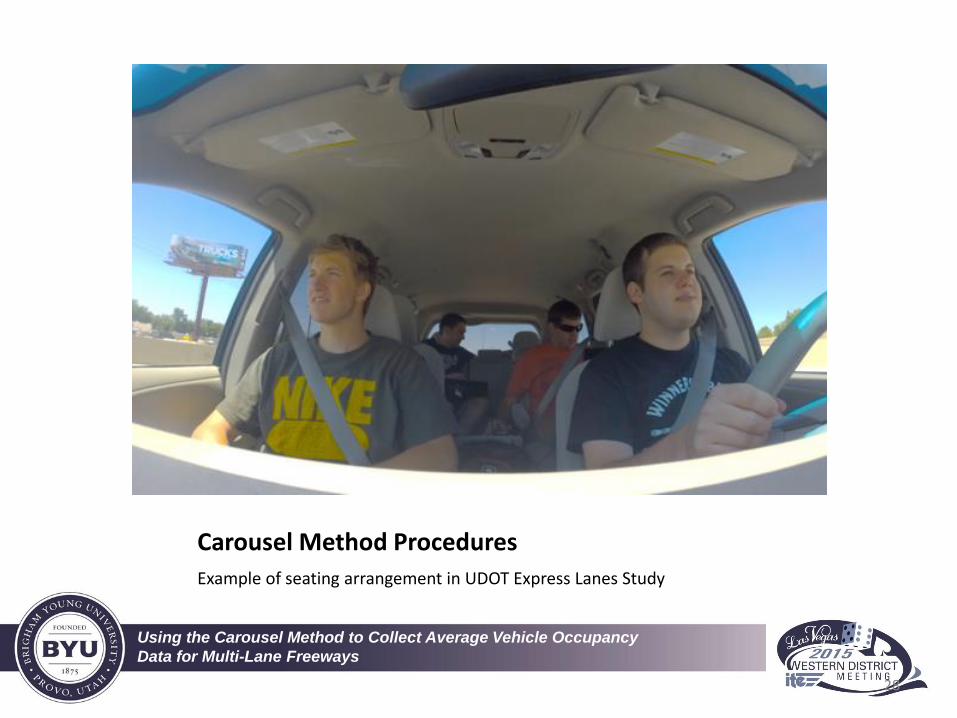
Carousel Method Procedures
Example of seating arrangement in UDOT Express Lanes Study
28
Using the Carousel Method to Collect Average Vehicle Occupancy
Data for Multi-Lane Freeways
Carousel Method Procedures
• Guidelines for accurate observations:
– Only record observations for vehicles within proximity of observation vehicle (observers can assist each other)
– Driver maintains speed to allow for other vehicles to pass and to navigate around obstructions (e.g., semi-trucks, etc.)
29

Using the Carousel Method to Collect Average Vehicle Occupancy
Data for Multi-Lane Freeways
Carousel Method Procedures
• Guidelines for accurate observations (cont.):
– When traffic causes “stop and go” flow, observation team keeps track of the last vehicle observed and assists to produce accurate counts for lanes of interest
– In the case of an incident on the roadway, observation counts cease until observation team is clear of incident site
30
Using the Carousel Method to Collect Average Vehicle Occupancy
Data for Multi-Lane Freeways
Carousel Method Procedures
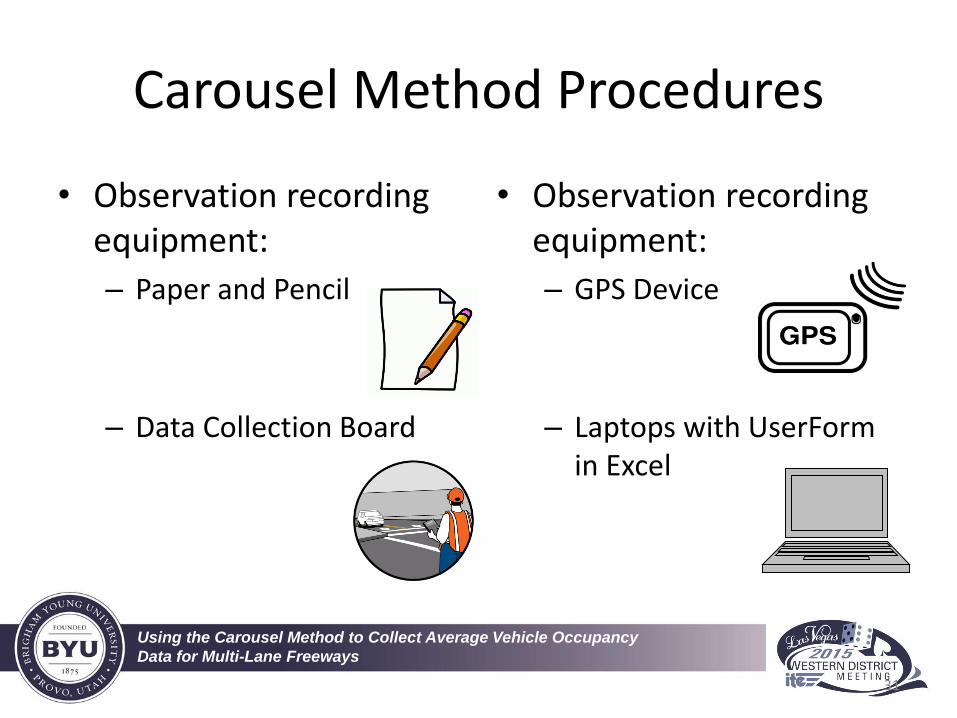
• Observation recording equipment:
– Paper and Pencil
– Data Collection Board
• Observation recording equipment:
– GPS Device
– Laptops with UserForm in Excel
31

Using the Carousel Method to Collect Average Vehicle Occupancy
Data for Multi-Lane Freeways
Carousel Method Procedures
• Observation recording equipment – Laptop with UserForm in Excel:
– A custom UserForm was created to collect data by zone in real time with laptops in the observation vehicle
– A “beep” was used to confirm an observation was recorded
– The data collection system was developed to be operated with either a mouse or keyboard
32

Using the Carousel Method to Collect Average Vehicle Occupancy
Data for Multi-Lane Freeways
Carousel Method Procedures
UserForm used in UDOT Express Lanes Study
33
Using the Carousel Method to Collect Average Vehicle Occupancy
Data for Multi-Lane Freeways
Carousel Method Procedures
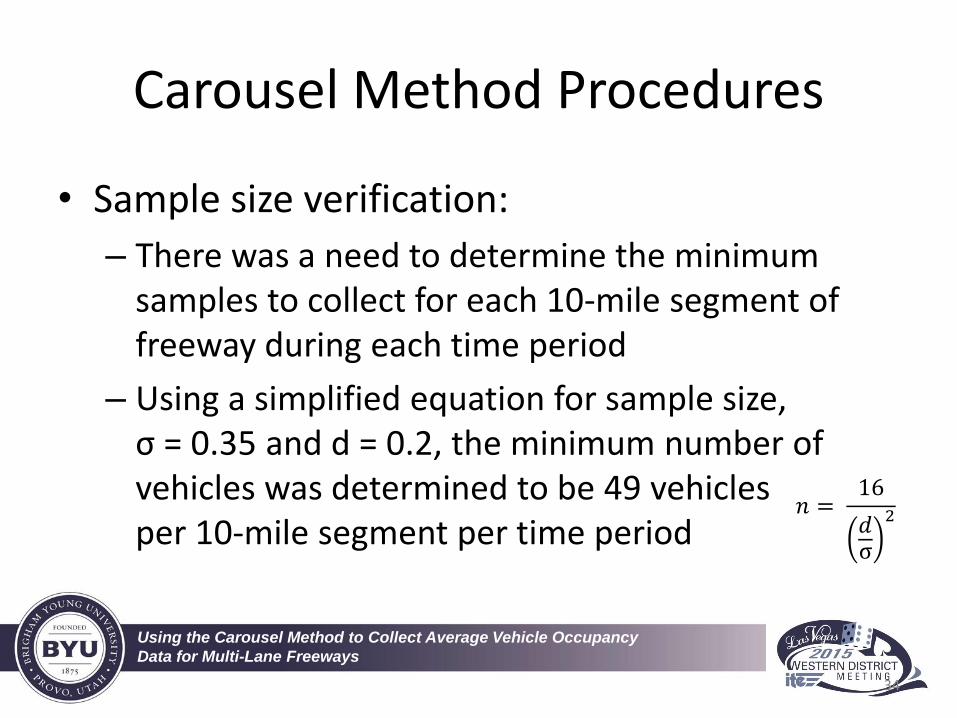
• Sample size verification:
– There was a need to determine the minimum samples to collect for each 10-mile segment of freeway during each time period
– Using a simplified equation for sample size, σ = 0.35 and d = 0.2, the minimum number of vehicles was determined to be 49 vehicles per 10-mile segment per time period
34
𝑛 = 16
𝑑σ
2
Using the Carousel Method to Collect Average Vehicle Occupancy
Data for Multi-Lane Freeways
Data Collection Results
• “Real time” data analysis:
– Observation data were gathered and analyzed through a VBA macro, which allowed for an analysis to be created after each observation period
– Data were analyzed to illustrate the AVO and percentage of vehicle types by lane per zone segment
35
Using the Carousel Method to Collect Average Vehicle Occupancy
Data for Multi-Lane Freeways
Data Collection Results
• UDOT Express Lanes study results:
– Data collected on Tuesdays and Thursday between May 20 and June 10, 2014 (7 separate days)
– Three 2-hour collection periods per day, as schedule permitted
– Overall 3,080 miles driven
– Approximately 15,000 vehicle samples
36
Using the Carousel Method to Collect Average Vehicle Occupancy
Data for Multi-Lane Freeways
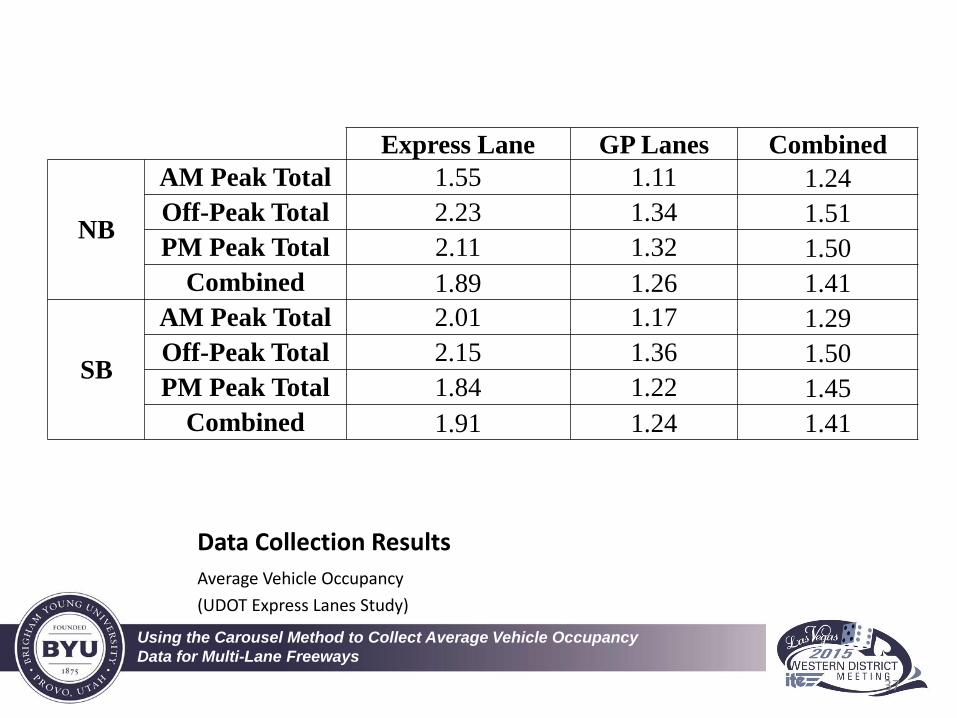
Data Collection Results
Average Vehicle Occupancy
(UDOT Express Lanes Study)
37
Express Lane GP Lanes Combined
NB
AM Peak Total 1.55 1.11 1.24
Off-Peak Total 2.23 1.34 1.51
PM Peak Total 2.11 1.32 1.50
Combined 1.89 1.26 1.41
SB
AM Peak Total 2.01 1.17 1.29
Off-Peak Total 2.15 1.36 1.50
PM Peak Total 1.84 1.22 1.45
Combined 1.91 1.24 1.41
Using the Carousel Method to Collect Average Vehicle Occupancy
Data for Multi-Lane Freeways
Data Collection Results
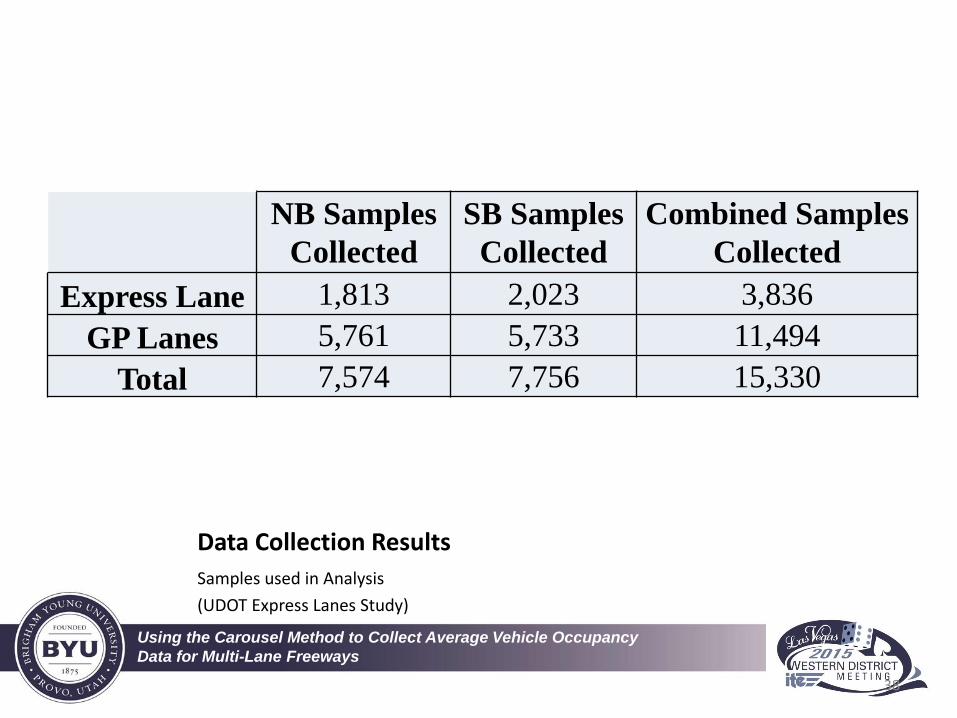
Samples used in Analysis
(UDOT Express Lanes Study)
38
NB Samples
Collected
SB Samples
Collected
Combined Samples
Collected
Express Lane 1,813 2,023 3,836
GP Lanes 5,761 5,733 11,494
Total 7,574 7,756 15,330
Using the Carousel Method to Collect Average Vehicle Occupancy
Data for Multi-Lane Freeways
Data Collection Results
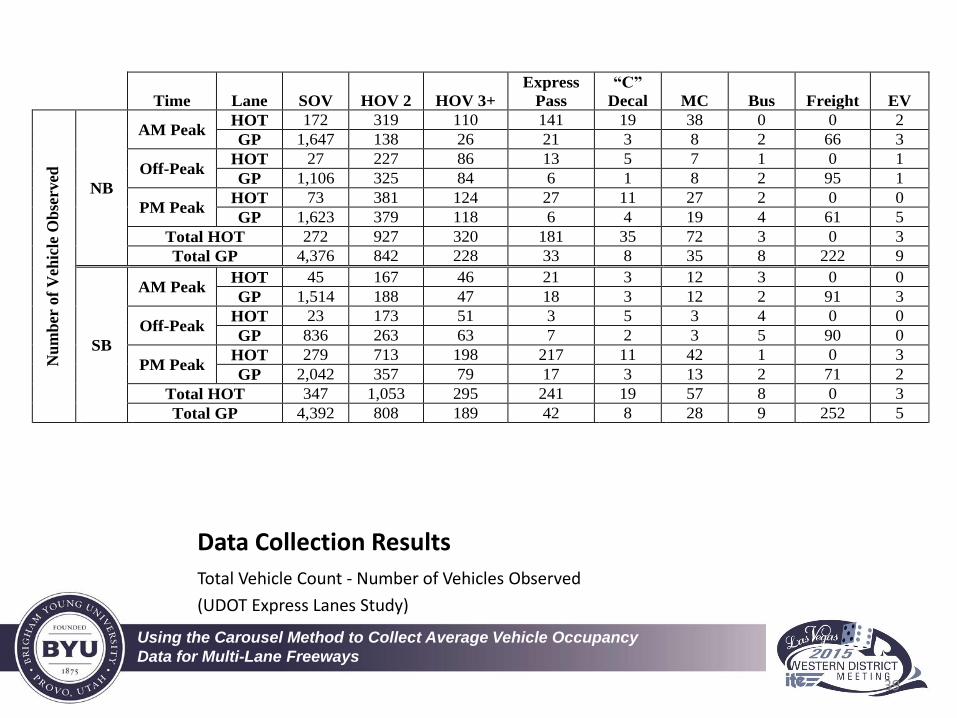
Total Vehicle Count - Number of Vehicles Observed
(UDOT Express Lanes Study)
39
Time Lane SOV HOV 2 HOV 3+
Express
Pass
“C”
Decal MC Bus Freight EV
Nu
mb
er o
f V
ehic
le O
bse
rved
NB
AM Peak HOT 172 319 110 141 19 38 0 0 2
GP 1,647 138 26 21 3 8 2 66 3
Off-Peak HOT 27 227 86 13 5 7 1 0 1
GP 1,106 325 84 6 1 8 2 95 1
PM Peak HOT 73 381 124 27 11 27 2 0 0
GP 1,623 379 118 6 4 19 4 61 5
Total HOT 272 927 320 181 35 72 3 0 3
Total GP 4,376 842 228 33 8 35 8 222 9
SB
AM Peak HOT 45 167 46 21 3 12 3 0 0
GP 1,514 188 47 18 3 12 2 91 3
Off-Peak HOT 23 173 51 3 5 3 4 0 0
GP 836 263 63 7 2 3 5 90 0
PM Peak HOT 279 713 198 217 11 42 1 0 3
GP 2,042 357 79 17 3 13 2 71 2
Total HOT 347 1,053 295 241 19 57 8 0 3
Total GP 4,392 808 189 42 8 28 9 252 5
Per
cen
t of
Veh
icle
Ob
serv
ed
NB
AM Peak HOT 21.5% 39.8% 13.7% 17.6% 2.4% 4.7% 0.0% 0.0% 0.2%
GP 86.1% 7.2% 1.4% 1.1% 0.2% 0.4% 0.1% 3.4% 0.2%
Off-Peak HOT 7.4% 61.9% 23.4% 3.5% 1.4% 1.9% 0.3% 0.0% 0.3%
GP 67.9% 20.0% 5.2% 0.4% 0.1% 0.5% 0.1% 5.8% 0.1%
PM Peak HOT 11.3% 59.1% 19.2% 4.2% 1.7% 4.2% 0.3% 0.0% 0.0%
GP 73.1% 17.1% 5.3% 0.3% 0.2% 0.9% 0.2% 2.7% 0.2%
Total HOT 15.0% 51.1% 17.7% 10.0% 1.9% 4.0% 0.2% 0.0% 0.2%
Total GP 76.0% 14.6% 4.0% 0.6% 0.1% 0.6% 0.1% 3.9% 0.2%
SB
AM Peak HOT 15.2% 56.2% 15.5% 7.1% 1.0% 4.0% 1.0% 0.0% 0.0%
GP 80.6% 10.0% 2.5% 1.0% 0.2% 0.6% 0.1% 4.8% 0.2%
Off-Peak HOT 8.8% 66.0% 19.5% 1.1% 1.9% 1.1% 1.5% 0.0% 0.0%
GP 65.9% 20.7% 5.0% 0.6% 0.2% 0.2% 0.4% 7.1% 0.0%
PM Peak HOT 19.1% 48.7% 13.5% 14.8% 0.8% 2.9% 0.1% 0.0% 0.2%
GP 79.0% 13.8% 3.1% 0.7% 0.1% 0.5% 0.1% 2.7% 0.1%
Total HOT 17.2% 52.1% 14.6% 11.9% 0.9% 2.8% 0.4% 0.0% 0.1%
Total GP 76.6% 14.1% 3.3% 0.7% 0.1% 0.5% 0.2% 4.4% 0.1%
1

Using the Carousel Method to Collect Average Vehicle Occupancy
Data for Multi-Lane Freeways
Data Collection Results
Total Vehicle Percentage – Percent of Vehicle Observed
(UDOT Express Lanes Study)
40
Time Lane SOV HOV 2 HOV 3+
Express
Pass
“C”
Decal MC Bus Freight EV
Nu
mb
er o
f V
ehic
le O
bse
rved
NB
AM Peak HOT 172 319 110 141 19 38 0 0 2
GP 1,647 138 26 21 3 8 2 66 3
Off-Peak HOT 27 227 86 13 5 7 1 0 1
GP 1,106 325 84 6 1 8 2 95 1
PM Peak HOT 73 381 124 27 11 27 2 0 0
GP 1,623 379 118 6 4 19 4 61 5
Total HOT 272 927 320 181 35 72 3 0 3
Total GP 4,376 842 228 33 8 35 8 222 9
SB
AM Peak HOT 45 167 46 21 3 12 3 0 0
GP 1,514 188 47 18 3 12 2 91 3
Off-Peak HOT 23 173 51 3 5 3 4 0 0
GP 836 263 63 7 2 3 5 90 0
PM Peak HOT 279 713 198 217 11 42 1 0 3
GP 2,042 357 79 17 3 13 2 71 2
Total HOT 347 1,053 295 241 19 57 8 0 3
Total GP 4,392 808 189 42 8 28 9 252 5
Per
cen
t of
Veh
icle
Ob
serv
ed
NB
AM Peak HOT 21.5% 39.8% 13.7% 17.6% 2.4% 4.7% 0.0% 0.0% 0.2%
GP 86.1% 7.2% 1.4% 1.1% 0.2% 0.4% 0.1% 3.4% 0.2%
Off-Peak HOT 7.4% 61.9% 23.4% 3.5% 1.4% 1.9% 0.3% 0.0% 0.3%
GP 67.9% 20.0% 5.2% 0.4% 0.1% 0.5% 0.1% 5.8% 0.1%
PM Peak HOT 11.3% 59.1% 19.2% 4.2% 1.7% 4.2% 0.3% 0.0% 0.0%
GP 73.1% 17.1% 5.3% 0.3% 0.2% 0.9% 0.2% 2.7% 0.2%
Total HOT 15.0% 51.1% 17.7% 10.0% 1.9% 4.0% 0.2% 0.0% 0.2%
Total GP 76.0% 14.6% 4.0% 0.6% 0.1% 0.6% 0.1% 3.9% 0.2%
SB
AM Peak HOT 15.2% 56.2% 15.5% 7.1% 1.0% 4.0% 1.0% 0.0% 0.0%
GP 80.6% 10.0% 2.5% 1.0% 0.2% 0.6% 0.1% 4.8% 0.2%
Off-Peak HOT 8.8% 66.0% 19.5% 1.1% 1.9% 1.1% 1.5% 0.0% 0.0%
GP 65.9% 20.7% 5.0% 0.6% 0.2% 0.2% 0.4% 7.1% 0.0%
PM Peak HOT 19.1% 48.7% 13.5% 14.8% 0.8% 2.9% 0.1% 0.0% 0.2%
GP 79.0% 13.8% 3.1% 0.7% 0.1% 0.5% 0.1% 2.7% 0.1%
Total HOT 17.2% 52.1% 14.6% 11.9% 0.9% 2.8% 0.4% 0.0% 0.1%
Total GP 76.6% 14.1% 3.3% 0.7% 0.1% 0.5% 0.2% 4.4% 0.1%
1
Using the Carousel Method to Collect Average Vehicle Occupancy
Data for Multi-Lane Freeways
Conclusions
• The carousel method was demonstrated to be a reliable method for collecting AVO data along multi-lane freeways
• Traveling concurrent with the flow of traffic allows the observers to collect accurate vehicle occupancy data as other vehicles pass the observation vehicle
41

Using the Carousel Method to Collect Average Vehicle Occupancy
Data for Multi-Lane Freeways
Conclusions
• The method also allows for additional information to be gathered, such as vehicle types and violation rates (as a function of vehicle occupancy)
• The simplicity and effectiveness of the carousel method qualifies it to be a highly recommended method for multi-lane freeway studies
42

Using the Carousel Method to Collect Average Vehicle Occupancy
Data for Multi-Lane Freeways
Acknowledgements
• A special thanks to the UDOT Technical Advisory Committee for their feedback and support of implementing the Carousel Method for the Express Lanes Study
• Thanks to BYU students Cody Hamblin, Chris Groberg, and David Halliday for their work to collect the data and improve the Carousel Method
43
Using the Carousel Method to Collect Average Vehicle Occupancy
Data for Multi-Lane Freeways
44
Questions
• For more information, contact: Grant G. Schultz, Ph.D., P.E., PTOE
(801) 422-6332
Full UDOT Report yet to be published on UDOT website under “Published Research Reports”
Complete TRB Paper and Poster on TRB website under “94th Annual Meeting 2015”

Using the Carousel Method to Collect Average Vehicle Occupancy
Data for Multi-Lane Freeways
References
• Heidtman, K., B. Skarpness, and C. Tornow. Improved Vehicle Occupancy Data Collection Methods Federal Highway Administration, Office of Highway Information Management, Washington, D.C., 1997.
• D’Ambrosio, K. T. Methodology for Collecting Vehicle Occupancy Data on Multi-Lane Interstate Highways: A GA-400 Case Study. Master’s Thesis, Georgia Institute of Technology, Atlanta, GA, 2011.
• Hao, X., H. Chen, Y. Yang, C. Yao, H. Yang, and N. Yang. Occupant Detection through Near-Infrared Imaging. Tamkang Journal of Science and Engineering, Vol. 14, No. 3, 2011, pp. 275-283.
• Maricopa Association of Governments (MAG) MAG 2012 Vehicle Occupancy Study: Final Report. Maricopa Association of Governments, 2013.
• Gan, A., R. Jung, K.Y. Liu, X. Li, and D. Sandoval. Vehicle Occupancy Data Collection Methods. Report No. BD-015-9, Lehman Center for Transportation Research, Department of Civil and Environmental Engineering, Florida International University, 2005.
• Gan, A., K.Y. Liu, and R. Jung. Vehicle Occupancy Data Collection Methods (Phase 2). Report No. BD-015-14, Lehman Center for Transportation Research, Department of Civil and Environmental Engineering, Florida International University, 2007.
• Utah Department of Transportation. Express Lanes. www.udot.utah.gov/expresslanes/Faqs. aspx. Accessed July 29, 2014.
• Utah State Code. Title 41, Chapter 6a, Section 702 Left Lane Restrictions – Exceptions – Other Lane Restrictions – Penalties. Utah State Legislature le.utah.gov/~code/TITLE41/htm/ 41_06a070200.htm. Accessed June 14, 2014.
• Van Belle, G., Statistical Rules of Thumb, Second Edition. John Wiley & Sons, Inc., Hoboken, NJ, 2008.
45