Embed Size (px)
DESCRIPTION
whatew , l k , k l l, l , ll
Citation preview

User's Guide
Document Number: 012-14016A

PASCO Capstone User's GuideDocument Number: 012-14016A
Limited WarrantyFor a description of the product warranty, see the PASCO scientific catalog.
CopyrightThis User's Guide is copyrighted with all rights reserved. Permission is granted to non-profit educational institutions for reproduction of any part of this manual, providing thereproductions are used only in their laboratories and classrooms, and are not sold forprofit. Reproduction under any other circumstances, without the written consentof PASCO scientific, is prohibited.
TrademarksPASCO, PASCO scientific, PASCO Capstone, DataStudio, PASPORT, SPARK,SPARK Science Learning System, SPARKlab, SPARKbook, SPARKvue, SPARKvueHD, Xplorer, Xplorer GLX are trademarks or registered trademarks of PASCO scientific,in the United States and/or in other countries. All other brands, products, or servicenames are or may be trademarks or service marks of, and are used to identify productsor services of their respective owners. For more information visit www.pasco.com/legal.
Software LicensesAll required licenses for software components of Capstone can be found on the FlashDrive, CD-ROM, or DVD-ROM included with the product or are included in the softwaredownload. To obtain source code for GPL/LGPL licensed software components,contact PASCO scientific by phone: 1-800-772-8700 (in the U.S), +1 916 786 3800(worldwide), or by email: [email protected]
User's Guide
012-14016A i

Teacher and Technical SupportFor questions about PASCO Capstone and other PASCO scientific products that are notanswered in the Help or User's Guide, you can contact the PASCO Teacher and Tech-nical Support staff by phone, email, or on the Web.
Phone:1-800-772-8700 (in the U.S.)
+1 916 786 3800 (worldwide)Email: [email protected]: www.pasco.com/support/
Tech Notes: www.pasco.com/support/technical-sup-port/technote/
See "Where can I find help documentation and curriculum for PASCO Capstone?":147
User's Guide
012-14016A ii

Contents
PASCO Capstone User's Guide i
Teacher and Technical Support ii
1 Tour the Interface 1
Tour the Menu and Toolbar 2
Tour the Page Tools 5
Tour the Tools Palette 6
Tour the Controls Palette 8
Tour the Displays Palette 10
Tour the Display Area 13
Tour Context Help 14
Tour the Scope 15
2 Getting Started 17
Connecting an interface 17
Connecting an 850 Universal or 750 USB Interface 21
Connecting Bluetooth Interfaces: such as the SPARKlink Air or AirLink2 22
Connecting a 750 SCSI or 500 serial Interface 24
Connecting USB PASPORT Interfaces: such as the SPARK SLS,SPARKlink, or Power Link 25
Connecting an Xplorer GLX or Xplorer 26
Connecting a sensor 27
Connecting a sensor with the 850 Interface 36
Connecting a sensor with the 750 Interface 41
Connecting a sensor with the SPARK SLS, SPARKlink, SPARKlink Air 45
Connecting a sensor with the Xplorer GLX 50
Connecting a sensor with the Digital Adapter or Photogate Port 55
Connecting a sensor with the Analog Adapter 56
User's Guide
012-14016A iii

Connecting a sensor with the AirLink2 56
Adding a display 56
Starting an experiment 60
Downloading Capstone experiments 61
3 How do I... 63
How do I... Installation and Update 66
How do I automate a network installation? 66
How do I force an update to an interface? 66
How do I... Experiment Files 67
How do I download and open PASCO ready-made experiments? 67
How do I save my experiment? 68
How do I export all data? 68
How do I open DataStudio experiments and data? 68
How do I open Xplorer GLX, SPARK SLS, and other non-Capstone exper-iments and data? 69
How do I import data from Microsoft Excel*? 69
How do I export data to Microsoft Excel*? 70
How do I import Xplorer GLX data? 71
How do I... Data and Measurements 73
How do I record data in PASCO Capstone? 73
How do I delete data runs? 79
How do I choose one or more runs to display? 79
How do I identify a measurement when I have multiple of the same type? 80
How do I change the numerical format of data? 81
How do I change the numerical format of statistics? 83
How do I exclude, delete, and restore selected data? 84
How do I edit a measurement? 87
How do I create a pure mathematical function? 87
User's Guide
012-14016A iv

How do I... Workbooks 89
How do I show, hide, and lock the palettes? 89
How do I change what display toolbar buttons are visible? 90
How do I... Sensors 92
How do I zero a measurement? 92
How do I switch the sign on a sensor? 93
How do I calibrate a sensor? 94
How do I calibrate a motion sensor? 95
How do I calibrate a drop counter? 96
How do I calibrate a pH sensor? 97
How do I... Calculations 99
How do I create a calculation? 99
How do I use my calculation? 102
How do I select a measurement in the calculator? 103
How do I see the result of a calculation? 103
How do I reorder calculations? 105
How do I... Plots 106
How do I plot multiple measurements on separate plot areas with shared X-axis? 107
How do I zoom to a selection? 108
How do I pan and scale? 110
How do I select active data? 111
How do I plot multiple measurements on same plot with multiple Y-axes? 113
How do I plot multiple measurements on same plot with same Y-axes? 114
How do I apply a curve fit to a portion of the data? 117
How do I change curve fit parameters? 118
How do I adjust the weights for the weighted linear fit? 119
How do I lock and unlock the axes of a graph? 121
User's Guide
012-14016A v

How do I change layer order of a display? 123
How do I... Tables 124
How do I reorder columns in a table? 124
How do I use a table to build data in Keep Mode? 124
How do I... Text Boxes 127
How do I enter subscripts, superscripts, Greek letters, and symbols? 127
How do I enter an equation into a text display? 127
How do I... Scope 130
How do I compare scope traces from the same sensor when monitoring? 130
How do I select the scope trigger? 131
How do I pre-trigger? 134
How do I freeze and record the scope display? 135
How do I... Video 137
How do I add a video source? 137
How do I analyze a video? 138
How do I manually synchronize video with data? 140
How do I adjust the frame rate of a recorded video? 141
How do I adjust the resolution of a video? 141
How do I make files with videos smaller? 141
How do I troubleshot video problems? 142
4 Frequently Asked Questions (FAQ) 145
FAQ... PASCO Capstone 147
What is PASCO Capstone? 147
Where can I find help documentation and curriculum for PASCO Capstone? 147
What are the new features in the latest PASCO Capstone? 148
Can PASCO Capstone open DataStudio, SPARKlab, and GLX files? 151
Can Capstone files be opened on computers with different operating sys-tems? 151
User's Guide
012-14016A vi

How does Capstone compare to other PASCO applications? 152
FAQ... Installation and Updates 160
What licenses are required? 160
Is an MSI available for PASCO Capstone? 160
Do I need to update the interfaces? 161
Do I need to update the sensor datasheets? 161
FAQ... Setup 162
What do I need to have a complete measurement system? 162
Can sensors sample at different rates? 164
FAQ... Data files 165
Where is my data saved? 165
What is the file export format? 165
What is the format for text import? 166
FAQ... Data and Measurements 167
Which data is recorded? 167
Can sensors sample at different rates? 167
What is Continuous Mode? 168
What is Fast Monitor Mode? 169
Is there a way to delete data points? 170
Which data is active? 172
How are the curve fit and smoothing calculations determined? 172
FAQ... Calculations and Calibration 174
What is the format for calculations? 174
What are the equations for calibration? 174
1 Point Offset 175
1 Point Slope 175
2 Point Linear 175
Can multiple measurements be calibrated simultaneously? 175
User's Guide
012-14016A vii

FAQ... Displays 176
What is panning and scaling? 176
Why are the display toolbars not active? 177
FAQ... Scope 178
What is the scope? 178
What does the Single Shot button do? 178
What is pre-triggering in the scope? 179
FAQ... Video and Text 180
What cameras and video formats are supported? 180
Why does the text color remain black after picking a color? 180
User's Guide
012-14016A viii

1 Tour the Interface
Click to learn more
Menu and Toolbar Controls Palette
Page Tools Displays Palette
Tools Palette Display Area
Context Help
Online Videos
012-14016A 1
1 Tour the Interface
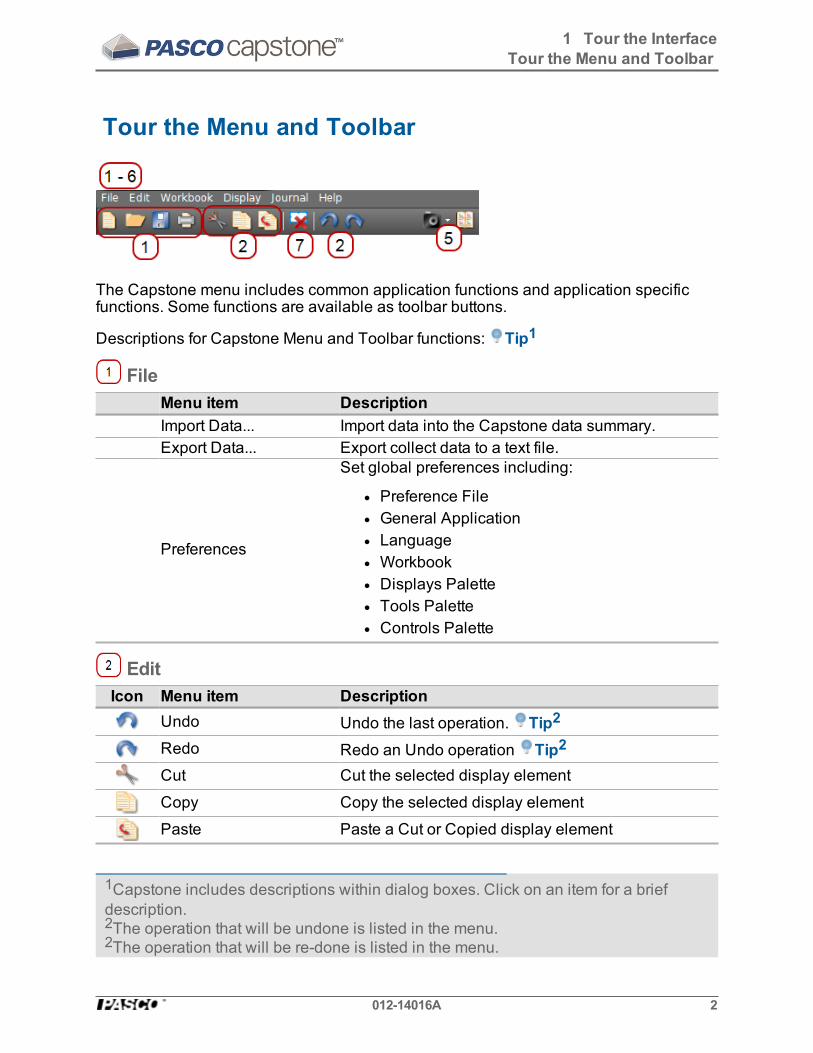
Tour the Menu and Toolbar
The Capstone menu includes common application functions and application specificfunctions. Some functions are available as toolbar buttons.
Descriptions for Capstone Menu and Toolbar functions: Tip1
FileMenu item DescriptionImport Data... Import data into the Capstone data summary.Export Data... Export collect data to a text file.
Preferences
Set global preferences including:
l Preference Filel General Applicationl Languagel Workbookl Displays Palettel Tools Palettel Controls Palette
EditIcon Menu item Description
Undo Undo the last operation. Tip2
Redo Redo an Undo operation Tip2
Cut Cut the selected display element
Copy Copy the selected display element
Paste Paste a Cut or Copied display element
1Capstone includes descriptions within dialog boxes. Click on an item for a briefdescription.2The operation that will be undone is listed in the menu.2The operation that will be re-done is listed in the menu.
012-14016A 2
1 Tour the InterfaceTour the Menu and Toolbar

WorkbookIcon Menu item Description
Add Page Add Page To WorkbookDelete Page Delete this PageRename Page Rename Current Workbook Page
Lock All PagesLock all current pages for editing. Pages can still beadded and will not be locked; to lock added pages,click Lock All Pages.
Unlock All Pages Unlock pages to allow editing.
Edit Master Page Opens the Master Page Add text and graphics toappear in the background of other pages.
Workbook Page Prop-erties
Set workbook preferences, including:
l Page Namel Snap to Gridl Show Tools Palettel Show Displays Palettel Show Controls Palettel Page Shape
DisplayIcon Menu item Description
Display Shows tools that apply to the selected display.
012-14016A 3
1 Tour the InterfaceTour the Menu and Toolbar

JournalIcon Menu item Description
Take Journal snapshot |Select snapshot mode
Takes an image and places it in the journal. Select:
Snapshot Entire Workbook Page
Snapshot Workbook Page Content
Snapshot Workbook Page Display
Show or hide Journal
Lists the journal snapshots and allows:
Show or hide annotations
Print Journal
Export Journal to HTMLView full-size snapshotDelete selected snapshotMove selected snapshot upMove selected snapshot down
HelpIcon Menu item Description
PASCO Capstone Help
Opens the Capstone Help System in a separatebrowser. A PDF version of the User's Guide is alsoavailable from the Help System.
See "Where can I find help documentation and cur-riculum for PASCO Capstone?": 147
About PASCO Capstone Opens a dialog with version information and the abil-ity enter a license key.
Delete DisplayIcon Menu item Description
Delete Selected Display Deletes the active display on the workbook page.Data are not affected.
012-14016A 4
1 Tour the InterfaceTour the Menu and Toolbar

Tour the Page Tools
See "How do I... Workbooks": 89.
Edit Master PageIcon Description
Master Page Add text and graphics to appear in the background of otherpages.
PropertiesIcon Description
Change properties of current page and Tools Palette
Add PageIcon Description
Adds a new page to the workbook
Drag and drop page tabs to rearrange the workbook pages.
See "Adding a display ": 56.
Rename / DeleteIcon Description
Double click to rename the page.
Deletes the current page from the workbook.
012-14016A 5
1 Tour the InterfaceTour the Page Tools

Tour the Tools Palette
Hardware SetupIcon Description
Configure interface and sensor hardware
See "Connecting an interface": 17.
Timer SetupIcon Description
Create timers for photogates and other timing devices
Data SummaryIcon Description
Manage experiment data and data properties
See "How do I... Data and Measurements": 73.
CalibrationIcon Description
Calibrate sensor measurements
See "How do I... Sensors": 92.
CalculatorIcon Description
Define new data sets as functions of measurements and otherdata
See "How do I... Calculations": 99.
Signal GeneratorIcon Description
Control interface Signal Generator output
Digital OutputIcon Description
Specify behavior for expansion port inputs and/or outputs
012-14016A 6
1 Tour the InterfaceTour the Tools Palette

Curve Fit EditorIcon Description
Edit curve fits created in Graph displays
See "How do I change curve fit parameters?": 118.
012-14016A 7
1 Tour the InterfaceTour the Tools Palette

Tour the Controls Palette The Controls Palette is used to start/stop data collection, set the data monitoring mode,set the sampling rate,delete data runs, and define Start/Stop conditions.
Record / Play SelectionIcon Description
Toggle between:Recording Mode Use to switch to recording Controls PalettePlayback Mode Use to switch to playback Controls Palette
Record / MonitorIcon Description
Capstone toggles between:Record Begin recording all measurements from each connected sensor
Monitor Start monitoring measurements from connected sensors
Record Mode SelectionIcon Description
Toggle between:ContinuousMode Set to record data at the current sample rate settings
Keep Mode Set to keep data points when commandedFast MonitorMode
Set to acquire data without recording; required for high speedsampling in Scope and FFT displays
See "How do I record data in PASCO Capstone? ": 73
012-14016A 8
1 Tour the InterfaceTour the Controls Palette

Record TimerDescription
Displays the recording time as reported by the sensors inminutes:seconds format.Displays the recording status: Ready or Recording
Sampling Source and Sample RateDescription
Sampling rate source: single sensor or Common Rate
Note: Common Rate is applied to all sensors. The SampleRate range for Common Rate is intersection of all sensorranges.
Adjust the Sample Rate
Start / Stop ConditionsIcon Description
Set automatic Start/Stop conditions
Delete RunsIcon Description
Delete most recent run
Delete All Runs or a specific run
012-14016A 9
1 Tour the InterfaceTour the Controls Palette

Tour the Displays Palette
Drag to page or double-click to create a display ( See "Adding a display ":56).
GraphIcon Description
Create a line graph to plot captured data or user defined data.Several tools are available for graphs including statistics, curve fit,slope tool, and smoothing.
See "How do I... Plots": 106.
ScopeIcon Description
Create a display that functions as a digital storage oscilloscope,which is useful for viewing measurements that oscillate rapidly intime.
See "Tour the Scope": 15
FFTIcon Description
Create a spectral analysis display, which uses a Fast FourierTransform to measure the relative signal intensity as a function offrequency.
HistogramIcon Description
Create a histogram bar graph. The height of each of the bars isproportional to the number of data that fall within the range of val-ues that the bar represents. Several tools are available for his-tograms including statistics, setting bin sizes, and overlaying.
Digits
012-14016A 10
1 Tour the InterfaceTour the Displays Palette

Icon DescriptionCreate a digits display to show the current data value or a stat-istical value.
MeterIcon Description
Create a meter display to indicate the current data value (or stat-istical value) by the angular displacement of a needle against adial indicator. Several meter styles are available.
TableIcon Description
Create a table to list captured data or user defined data incolumns.
Note: Tables are used to enter user-defined numerical or textdata. Several tools are available for tables including statistics
See "How do I... Tables": 124.
Text BoxIcon Description
Create a text box for explanatory text and images. The text boxcan be locked for editing. Tip1
See "How do I... Text Boxes": 127.
Text Entry BoxIcon Description
Create a text entry box for user input. The input can be linked toother text entry boxes. Tip1
See "How do I... Text Boxes": 127.
ImageIcon Description
Create a box to insert an image from a file. Note: Use the Movieicon to capture an image from an attached USB camera.)
1Use a Text Entry Box for user student input on a locked experiment.1Use the linkage to present a previously entered student response on a subsequentpage of the Workbook. For example, to combine all the answers on a single page.
012-14016A 11
1 Tour the InterfaceTour the Displays Palette

MovieIcon Description
Create a box to insert a movie file, capture an image from a videocamera or microscope connected through a USB port, record astand-alone video using a USB webcam, or use a USB video cam-era as a sensor to record a movie along with other sensor data.
A special video analysis mode accessed from the toolbarprovides tools for analyzing videos and image snapshots.
See "How do I... Video": 137.
PlaceholderIcon Description
Create a spacer for a display to be defined at a later time or createwhite space.
012-14016A 12
1 Tour the InterfaceTour the Displays Palette

Tour the Display AreaThe PASCO Capstone Workbook pages facilitate quick and easy layouts and supporthighly flexible page designs.
Features See Drag and drop targets "Adding a dis-
play ": 56Easy resize and alignment toolsQuickStart templates
QuickStart Templates
"Adding a dis-play ": 56
Easy table creation, including calculated data
"How do I...Tables": 124"How do I... Cal-culations": 99
Text boxes with equations copied from word processor"How do I...Text Boxes":127
012-14016A 13
1 Tour the InterfaceTour the Display Area

Tour Context Help Some items in PASCO Capstone include helpful information at the bottom of dialog win-dows. To see the help: Click on an item for a brief description.
Context Help Example: File Properties dialog
Click on an item for a brief description.
Information displays here.
012-14016A 14
1 Tour the InterfaceTour Context Help

Tour the ScopeOverview
The scope is designed to view high-frequency oscillating data or single high-speedevents that the graph display may not be able to capture.
Maximum Sampling Rate: The maximum supported sampling rate is a function of thecomputer-sensor interface that is connected to the computer (for example: 850 UniversalInterface → 10 MHz, ScienceWorkshop 750 → 250 kHz).
Features See Continuous Mode and Fast MonitorMode
"What is Continuous Mode?": 168"What is Fast Monitor Mode?": 169
Single shot "What does the Single Shot button do?": 178Multiple triggers "How do I select the scope trigger?": 131Pre-trigger "How do I pre-trigger?": 134
Image freeze "How do I freeze and record the scope dis-play?": 135
ToolbarIcon Description
Adjust y-axis scale to fit dataActivate and control scope trigger
Stop collection after one traceAutomatically adjust sample rate based on time-axis scaleActivate to view multiple runs; Select visible run(s)
Increase trace offset
Set trace offset value to zero
Decrease trace offset
Show data coordinates and access Delta Tool
Creates a data set from active traces
Increase number of data points in trace
Decrease number of data points in trace
Add new y-axis to scope display
Remove active element or axis
Allow rearrangement of axesPin toolbar to display
012-14016A 15
1 Tour the InterfaceTour the Scope

Properties
Show or hide tools
See "Adding a display ": 56
012-14016A 16
1 Tour the InterfaceTour the Scope

2 Getting StartedSee the following topics setting up and run a simple experiment:
"Connecting an interface": 17
"Connecting a sensor": 27
"Adding a display ": 56
"Starting an experiment": 60"Downloading Capstone experiments": 61
See "How do I...": 63 for detailed instructions.
Connecting an interfaceCapstone software running on your computer receives data from one or more connectedsensors through one or more interfaces. (At least one interface and sensor is required tocollect data. ( See "What do I need to have a complete measurement system? ": 162)
Capstone is compatible with all PASCO USB interfaces and some non-USB interfacesusing a serial-to-USB convertor. Tip1
Automatically detect an interface
1. Connect one or more PASCO USB interfaces to the computer. Tip2
"Connecting an 850 Universal or 750 USB Interface":21
"Connecting a 750 SCSI or 500 serial Interface": 24
"Connecting Bluetooth Interfaces: such as theSPARKlink Air or AirLink2": 22
"Connecting USB PASPORT Interfaces: such as theSPARK SLS, SPARKlink, or Power Link": 25
"Connecting an Xplorer GLX or Xplorer": 26
2. Add one or sensors. ( See "Connecting a sensor": 27)
1You can add interfaces that are not connected to the computer. This is useful toauthor or prepare experiments in advance.2Interfaces can be connected to your computer with Capstone running. Capstone willautomatically add recognized interfaces such as the 850 Universal Interface.
012-14016A 17
2 Getting StartedConnecting an interface

Manually add an interface
1. Click Hardware Setup in the Tools Palette: .
Hardware Setup button
2. Add the interface if not displayed in the Hardware Setup list. Tip1
3. If the interface is not automatically detected, click the Choose Interface button.4. The Choose Interface dialog opens.
1Some PASCO interfaces, such as the PASCO 850 and SPARK, are automaticallydetected by Capstone when plugged in and turned on.
012-14016A 18
2 Getting StartedConnecting an interface

Choose Interface
Click Manually Choose.
Click the interfaces to add or remove.Optional: change the default of 1 interface to add multiple interfaces ofthe same type.
012-14016A 19
2 Getting StartedConnecting an interface

Active interface indicator
Inactive interface indicator
5. Add one or sensors. ( See "Connecting a sensor": 27)
Connected and added interfaces are displayed in the Hardware Setup dialog.
Note: Interfaces that are connected to the computer, powered on, and recognizedby Capstone display ( ) and interfaces that are not active display ( ).
012-14016A 20
2 Getting StartedConnecting an interface

Active and inactive interfaces and sensors in Hardware Setup
Active interfaceInactive interface (disconnectedor off )Active sensorInactive sensor (disconnected oroff )
Next step: "Connecting a sensor": 27
Connecting an 850 Universal or 750 USB Interface
The PASCO 850 Universal Interface includes four digital inputs, four analog ports,four PASPORT sensor ports, a 15 W function generator, dual high speed function gen-erators.
Procedure1. Use the A-to-mini-B USB cable to connect the smaller USB port of the 850 Inter-
face to a USB port on your computer (or a USB hub connected to the computer).2. Connect the AC adapter to a wall outlet and to the AC adapter port on the rear of
the 850 Universal Interface.
012-14016A 21
2 Getting StartedConnecting an interface

850 Universal Interface: USB and Power
AC adapter port
USB connector
3. Press and hold the power button ( ) until the green lights on the front flash.
850 Universal Interface: On button
4. Configure the interface for Capstone. ( See "Connecting an interface": 17)
5. Add sensors. (See "Connecting a sensor with the 850 Interface": 36)
Next step: "Connecting a sensor": 27
Connecting Bluetooth Interfaces: such as the SPARKlink Air orAirLink2
SPARKlink Air is a sensor interface with two ports to accept PASPORT sensors andports for the included Voltage Probe and Temperature Probe.
The SPARKlink Air interface connects to a computer or tablet device wirelessly viaBluetooth (radio), or can also connect to a computer’s USB port with the included USBcable. The SPARKlink Air operates on battery power or can be connected to theincluded AC adapter. The SPARKlink Air battery can also be recharged using the USBcable connected to a USB port.
Procedure1. Optional: Connect the AC adapter (included with the SPARKlink Air) to a wall out-
let and to the AC adapter port on the bottom of the device.
012-14016A 22
2 Getting StartedConnecting an interface

The Battery Status LED may blink red to indicate that the battery is chargingthrough the power cable.
SPARKlink USB and power
AC adapter port
Power button
USB port
2. Connect the SPARKlink Air to the computer via bluetooth or USB.Pairing bluetooth
i. Press and hold the ON/OFF button on the SPARKlink Air.ii. After the status LEDs blink in sequence, release the ON/OFF button.
The Bluetooth status LED will blink blue.iii. Enable the Windows or Macintosh computer for Bluetooth communication.
USB connectioni. Use an A-to-mini-B USB cable (such as PASCO part PS-2528) to connectthe smaller USB port of the SPARK to a USB port on your computer (or aUSB hub connected to the computer).
ii. Press and hold the ON/OFF button on the SPARKlink Air.iii. After the status LEDs blink in sequence, release the ON/OFF button.
The USB Status LED will shine green. The Battery Status LED may blinkred to indicate that the battery is charging through the USB.
012-14016A 23
2 Getting StartedConnecting an interface

LED status definitions
Bluetoothstatus
Slow Blinking –Not connectedSolid – Con-nectedFast Blinking –Sampling data
USBStatus
Off – Not con-nectedOn– Connected
Batterystatus
Solid red– LowbatteryBlinking red–ChargingSolid green–Fully charged
3. Plug in PASPORT sensors, temperature probe, or voltage leads.
SPARKlink ports
PASPORT ports
Voltage port
Temperature port
4. Configure the interface for Capstone. ( See "Connecting an interface": 17)
Next step: "Connecting a sensor": 27
Connecting a 750 SCSI or 500 serial Interface
1. Use the A-to-mini-B USB cable (included with the 750 Interface) to connect theUSB port of the 750 Interface to a USB port on your computer (or a USB hub con-nected to the computer).
012-14016A 24
2 Getting StartedConnecting an interface

2. Connect the AC adapter to a wall outlet and to the AC adapter port on the rear ofthe 750 Interface.
3. Turn on the interface and hold the power button.
4. Configure the interface for Capstone. ( See "Connecting an interface": 17)
5. Add sensors. ( See "Connecting a sensor with the 750 Interface": 41)
Next step: "Connecting a sensor": 27
Connecting USB PASPORT Interfaces: such as the SPARK SLS,SPARKlink, or Power Link
1. Use an A-to-mini-B USB cable (such as PASCO part PS-2528) to connect thesmaller USB port of the SPARK SLS or SPARKlink to a USB port on your com-puter (or a USB hub connected to the computer).
2. Optionally connect the AC adapter (included with the SPARK SLSand SPARKlink) to a wall outlet and to the AC adapter port on the bottom of thedevice.
SPARK SLS power
AC adapter port
Power button
3. Plug in PASPORT sensors, temperature probe, or voltage leads.
012-14016A 25
2 Getting StartedConnecting an interface

SPARK SLS / SPARKlink ports
PASPORT sensors
Temperature Sensor Port
Voltage port
4. SPARK SLS: Press and hold the power button until the SPARK SLS screen turnson.
5. Configure the interface for Capstone. ( See "Connecting an interface": 17)
6. SPARK SLS: The SPARK SLS states it is connected to a computer. Disconnectthe SPARK SLS from the computer to use it in standalone mode.
Next step: "Connecting a sensor": 27
Connecting an Xplorer GLX or Xplorer
1. Use an A-to-mini B USB cable (included) to connect the smaller USB port ofthe Xplorer GLX to a USB port on your computer (or a USB hub connected to thecomputer).
2. Optionally, connect the included AC adapter to a wall outlet and to the AC adapterport on the right side of the Xplorer GLX.
3. If the Xplorer GLX is not on, press and hold the power button until the green LED
012-14016A 26
2 Getting StartedConnecting an interface

on the front flashes.
4. Configure the interface for Capstone. ( See "Connecting an interface": 17)
Next step: "Connecting a sensor": 27
Connecting a sensorCapstone software running on your computer receives data from one or more connectedsensors through one or more interfaces. (At least one interface and sensor is required tocollect data. ( See "What do I need to have a complete measurement system? ": 162)
Follow these steps to connect a sensor to your computer.
1. If not already, connect or add an interface to your computer. ( See "Connectingan interface": 17)
Note: Capstone requires an interface to communicate with the sensor.
2. Plug in one or more sensors into the interface.
Click for instructions on select interfaces
"Connecting a sensor with the 850 Interface": 36
"Connecting a sensor with the 750 Interface": 41
"Connecting a sensor with the SPARK SLS, SPARKlink, SPARKlinkAir": 45
"Connecting a sensor with the Xplorer GLX": 50
"Connecting a sensor with the Digital Adapter or Photogate Port": 55
"Connecting a sensor with the Analog Adapter": 56
"Connecting a sensor with the AirLink2": 56
3. Add the sensor in Capstone Tip1
PASPORT sensor
1You can add sensors that are not connected to the interface. This is useful to authoror prepare experiments in advance.
012-14016A 27
2 Getting StartedConnecting a sensor

Note: Capstone automatically detects properly connected PASPORT sensors.
Automatically detected PASPORT sensors
To manually add a PASPORT sensor:
012-14016A 28
2 Getting StartedConnecting a sensor

a. Click within the yellow circle of the port to add a sensor.
Interface: PASPORTport indicators
b. Select the sensor to add from the drop down list.
The sensor icon appears for the port.
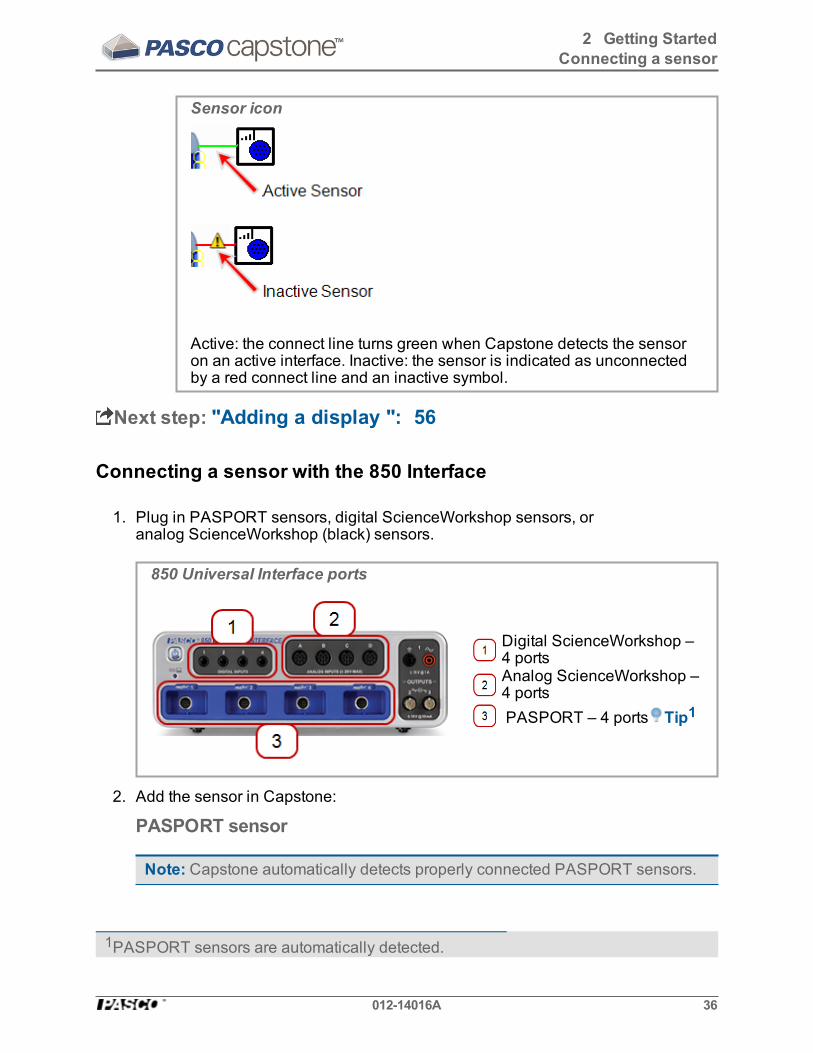
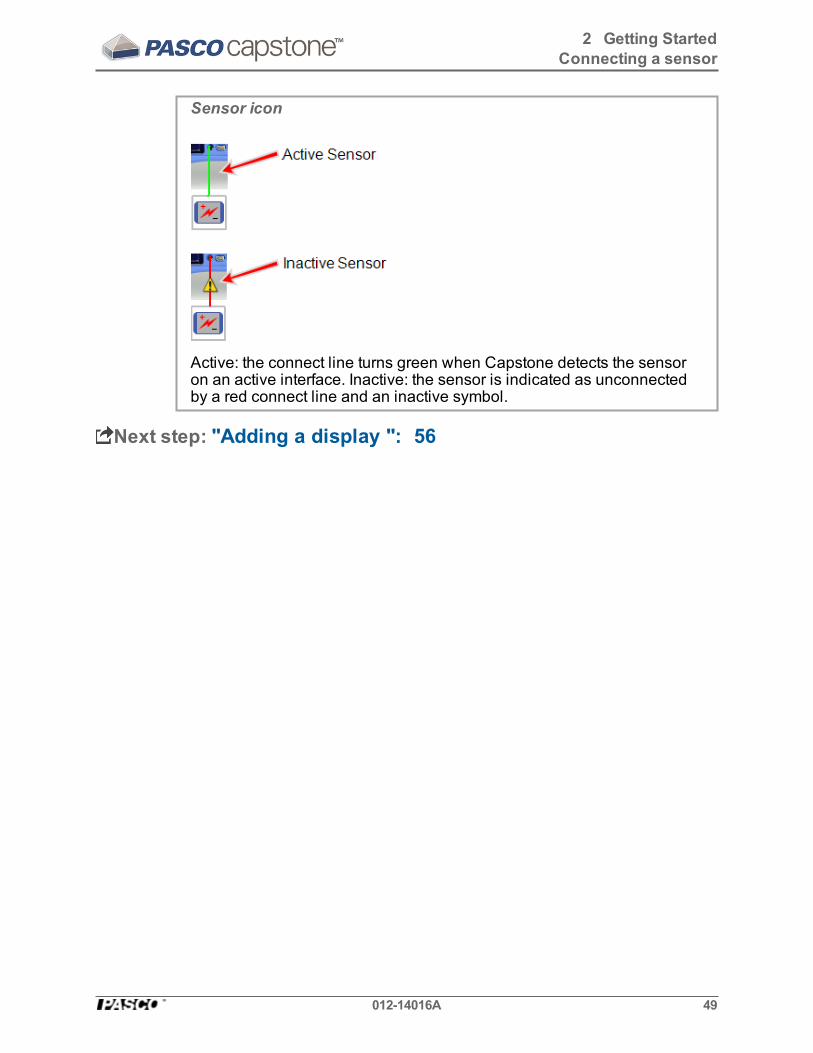
Sensor icon
Active: the connect line turns green when Capstone detects the sensoron an active interface. Inactive: the sensor is indicated as unconnectedby a red connect line and an inactive symbol.
Analog ScienceWorkshop sensor (Universal Interface)
012-14016A 29
2 Getting StartedConnecting a sensor

Note: Capstone automatically detects Universal Interface (UI) sensors.
To add a non-connected sensor to Capstone:
a. Click within the yellow circle of the port to add a sensor.
Interface: Analog Port Indicators
b. Select the sensor to add from the drop down list.
The sensor icon appears for the port.
Sensor icon
Active: the connect line turns green when Capstone detects the sensoron an active interface. Inactive: the sensor is indicated as unconnectedby a red connect line and an inactive symbol.
Digital sensor (ScienceWorkshop)
012-14016A 30
2 Getting StartedConnecting a sensor

Note: Capstone does not automatically detect most digital sensors.
a. Click within the yellow circle of the port to add a sensor.
Interface: Digital Port Indicators
b. Select the sensor to add from the drop down list.
The sensor icon appears for the port.
Sensor icon
Active: the connect line turns green when Capstone detects the sensoron an active interface. Inactive: the sensor is indicated as unconnectedby a red connect line and an inactive symbol.
c. Optional: to use the sensor as a timer, click Timer Setup in the ToolsPalette.
012-14016A 31
2 Getting StartedConnecting a sensor

Timer Setup button
Analog sensor (ScienceWorkshop)
Note: Capstone does not automatically detect most analog ScienceWorkshopsensors.
a. Click within the yellow circle of the port to add a sensor.
Interface: Analog Port Indicators
b. Select the sensor to add from the drop down list.
The sensor icon appears for the port.
012-14016A 32
2 Getting StartedConnecting a sensor

Sensor icon
Analog sensors do not toggle between inactive and active and displayas active (green line) even when disconnected.
Temperature sensor (SPARK SLS, SPARKlink, SPARKlink Air,and Xplorer GLX)
Note: Capstone automatically detects temperature sensors connected to theinternal temperature sensor port.
To manually add a temperature sensor:
a. Click within the yellow circle of the temperature port to add a temperaturesensor .
Interface: Temperature port indicators
two bottom circles
The sensor icon appears for the port.
012-14016A 33
2 Getting StartedConnecting a sensor

Sensor icon
Active: the connect line turns green when Capstone detects the sensoron an active interface. Inactive: the sensor is indicated as unconnectedby a red connect line and an inactive symbol.
Voltage sensor (SPARK SLS, SPARKlink, SPARKlink Air,and Xplorer GLX)
Note: Capstone automatically detects sound sensors connected to the internalsound sensor port.
To manually add a voltage sensor:
a. Click within the yellow circle of the port to add a voltage sensor.
Interface: Voltage port indicators
second circle from top
The sensor icon appears for the port.
012-14016A 34
2 Getting StartedConnecting a sensor

Sensor icon
Active: the connect line turns green when Capstone detects the sensoron an active interface. Inactive: the sensor is indicated as unconnectedby a red connect line and an inactive symbol.
Sound sensor (Xplorer GLX)
Note: Capstone automatically detects voltage sensors connected to the internalvoltage sensor port.
To manually add a sound sensor:
a. Click within the yellow circle of the port to add a sound sensor .
Interface: Sound port indicators
top circle
b. Select the GLX Sound Level Sensor or the GLX Sound Sensor.
The sensor icon appears for the port.
012-14016A 35
2 Getting StartedConnecting a sensor
Sensor icon
Active: the connect line turns green when Capstone detects the sensoron an active interface. Inactive: the sensor is indicated as unconnectedby a red connect line and an inactive symbol.
Next step: "Adding a display ": 56
Connecting a sensor with the 850 Interface
1. Plug in PASPORT sensors, digital ScienceWorkshop sensors, oranalog ScienceWorkshop (black) sensors.
850 Universal Interface ports
Digital ScienceWorkshop –4 portsAnalog ScienceWorkshop –4 ports PASPORT – 4 ports Tip1
2. Add the sensor in Capstone:
PASPORT sensor
Note: Capstone automatically detects properly connected PASPORT sensors.
1PASPORT sensors are automatically detected.
012-14016A 36
2 Getting StartedConnecting a sensor

Automatically detected PASPORT sensors
To manually add a PASPORT sensor:
012-14016A 37
2 Getting StartedConnecting a sensor

a. Click within the yellow circle of the port to add a sensor.
Interface: PASPORTport indicators
b. Select the sensor to add from the drop down list.
The sensor icon appears for the port.
Sensor icon
Active: the connect line turns green when Capstone detects the sensoron an active interface. Inactive: the sensor is indicated as unconnectedby a red connect line and an inactive symbol.
Digital sensor (ScienceWorkshop)
Note: Capstone does not automatically detect most digital sensors.
012-14016A 38
2 Getting StartedConnecting a sensor

a. Click within the yellow circle of the port to add a sensor.
Interface: Digital Port Indicators
b. Select the sensor to add from the drop down list.
The sensor icon appears for the port.
Sensor icon
Active: the connect line turns green when Capstone detects the sensoron an active interface. Inactive: the sensor is indicated as unconnectedby a red connect line and an inactive symbol.
c. Optional: to use the sensor as a timer, click Timer Setup in the ToolsPalette.
Timer Setup button
012-14016A 39
2 Getting StartedConnecting a sensor

Analog sensor (ScienceWorkshop)
Note: Capstone does not automatically detect most analog ScienceWorkshopsensors.
a. Click within the yellow circle of the port to add a sensor.
Interface: Analog Port Indicators
b. Select the sensor to add from the drop down list.
The sensor icon appears for the port.
Sensor icon
Analog sensors do not toggle between inactive and active and displayas active (green line) even when disconnected.
Analog ScienceWorkshop sensor (Universal Interface)
Note: Capstone automatically detects Universal Interface (UI) sensors.
To add a non-connected sensor to Capstone:
012-14016A 40
2 Getting StartedConnecting a sensor

a. Click within the yellow circle of the port to add a sensor.
Interface: Analog Port Indicators
b. Select the sensor to add from the drop down list.
The sensor icon appears for the port.
Sensor icon
Active: the connect line turns green when Capstone detects the sensoron an active interface. Inactive: the sensor is indicated as unconnectedby a red connect line and an inactive symbol.
Next step: "Adding a display ": 56
Connecting a sensor with the 750 Interface
1. Plug digital ScienceWorkshop sensors or analog ScienceWorkshop (black)sensors.
012-14016A 41
2 Getting StartedConnecting a sensor

750 Interface ports
Digital – 4 ports
Analog – 4 ports
2. Add the sensor in Capstone:
Digital sensor (ScienceWorkshop)
Note: Capstone does not automatically detect most digital sensors.
a. Click within the yellow circle of the port to add a sensor.
Interface: Digital Port Indicators
b. Select the sensor to add from the drop down list.
The sensor icon appears for the port.
Sensor icon
Active: the connect line turns green when Capstone detects the sensoron an active interface. Inactive: the sensor is indicated as unconnectedby a red connect line and an inactive symbol.
012-14016A 42
2 Getting StartedConnecting a sensor

c. Optional: to use the sensor as a timer, click Timer Setup in the ToolsPalette.
Timer Setup button
Analog sensor (ScienceWorkshop)
Note: Capstone does not automatically detect most analog ScienceWorkshopsensors.
a. Click within the yellow circle of the port to add a sensor.
Interface: Analog Port Indicators
b. Select the sensor to add from the drop down list.
The sensor icon appears for the port.
Sensor icon
Analog sensors do not toggle between inactive and active and displayas active (green line) even when disconnected.
Analog ScienceWorkshop sensor (Universal Interface)
012-14016A 43
2 Getting StartedConnecting a sensor

Note: Capstone automatically detects Universal Interface (UI) sensors.
To add a non-connected sensor to Capstone:
a. Click within the yellow circle of the port to add a sensor.
Interface: Analog Port Indicators
b. Select the sensor to add from the drop down list.
The sensor icon appears for the port.
Sensor icon
Active: the connect line turns green when Capstone detects the sensoron an active interface. Inactive: the sensor is indicated as unconnectedby a red connect line and an inactive symbol.
Next step: "Adding a display ": 56
012-14016A 44
2 Getting StartedConnecting a sensor

Connecting a sensor with the SPARK SLS, SPARKlink, SPARKlinkAir
1. Plug in PASPORT sensors, temperature probe, and/or voltage leads.
SPARK ports
PASPORT – 2 ports
Temperature – 1 port
Voltage – 1 port
2. Press and hold the power button.
3. Configure the interface for Capstone. ( See "Connecting an interface": 17)
4. Add the sensor in Capstone:
PASPORT sensor
Note: Capstone automatically detects properly connected PASPORT sensors.
012-14016A 45
2 Getting StartedConnecting a sensor

Automatically detected PASPORT sensors
To manually add a PASPORT sensor:
012-14016A 46
2 Getting StartedConnecting a sensor

a. Click within the yellow circle of the port to add a sensor.
Interface: PASPORTport indicators
b. Select the sensor to add from the drop down list.
The sensor icon appears for the port.
Sensor icon
Active: the connect line turns green when Capstone detects the sensoron an active interface. Inactive: the sensor is indicated as unconnectedby a red connect line and an inactive symbol.
Temperature sensor
Note: Capstone automatically detects temperature sensors connected to theinternal temperature sensor port.
To manually add a temperature sensor:
a. Click within the yellow circle of the temperature port to add a temperaturesensor .
Interface: Temperature port indicators
012-14016A 47
2 Getting StartedConnecting a sensor

The sensor icon appears for the port.
Sensor icon
Active: the connect line turns green when Capstone detects the sensoron an active interface. Inactive: the sensor is indicated as unconnectedby a red connect line and an inactive symbol.
Voltage sensor
Note: Capstone automatically detects sound sensors connected to the internalsound sensor port.
To manually add a voltage sensor:
a. Click within the yellow circle of the port to add a voltage sensor.
Interface: Voltage port indicators
The sensor icon appears for the port.
012-14016A 48
2 Getting StartedConnecting a sensor
Sensor icon
Active: the connect line turns green when Capstone detects the sensoron an active interface. Inactive: the sensor is indicated as unconnectedby a red connect line and an inactive symbol.
Next step: "Adding a display ": 56
012-14016A 49
2 Getting StartedConnecting a sensor

Connecting a sensor with the Xplorer GLX
1. Plug in PASPORT sensors, temperature probe, or voltage leads.
2.
Xplorer GLX ports
PASPORT – 4 ports
Temperature – 2 ports
Voltage – 1 port
3. Press and hold the power button.
4. Configure the interface for Capstone. ( See "Connecting an interface": 17)
5. Add the sensor in Capstone:
PASPORT sensor
Note: Capstone automatically detects properly connected PASPORT sensors.
012-14016A 50
2 Getting StartedConnecting a sensor

Automatically detected PASPORT sensors
To manually add a PASPORT sensor:
012-14016A 51
2 Getting StartedConnecting a sensor

a. Click within the yellow circle of the port to add a sensor.
Interface: PASPORTport indicators
b. Select the sensor to add from the drop down list.
The sensor icon appears for the port.
Sensor icon
Active: the connect line turns green when Capstone detects the sensoron an active interface. Inactive: the sensor is indicated as unconnectedby a red connect line and an inactive symbol.
Temperature sensor
Note: Capstone automatically detects temperature sensors connected to theinternal temperature sensor port.
To manually add a temperature sensor:
a. Click within the yellow circle of the temperature port to add a temperaturesensor .
Interface: Temperature port indicators
two bottom circles
012-14016A 52
2 Getting StartedConnecting a sensor

The sensor icon appears for the port.
Sensor icon
Active: the connect line turns green when Capstone detects the sensoron an active interface. Inactive: the sensor is indicated as unconnectedby a red connect line and an inactive symbol.
Voltage sensor
Note: Capstone automatically detects sound sensors connected to the internalsound sensor port.
To manually add a voltage sensor:
a. Click within the yellow circle of the port to add a voltage sensor.
Interface: Voltage port indicators
second circle from top
The sensor icon appears for the port.
012-14016A 53
2 Getting StartedConnecting a sensor

Sensor icon
Active: the connect line turns green when Capstone detects the sensoron an active interface. Inactive: the sensor is indicated as unconnectedby a red connect line and an inactive symbol.
Sound sensor
Note: Capstone automatically detects voltage sensors connected to the internalvoltage sensor port.
To manually add a sound sensor:
a. Click within the yellow circle of the port to add a sound sensor .
Interface: Sound port indicators
top circle
b. Select the GLX Sound Level Sensor or the GLX Sound Sensor.
The sensor icon appears for the port.
012-14016A 54
2 Getting StartedConnecting a sensor
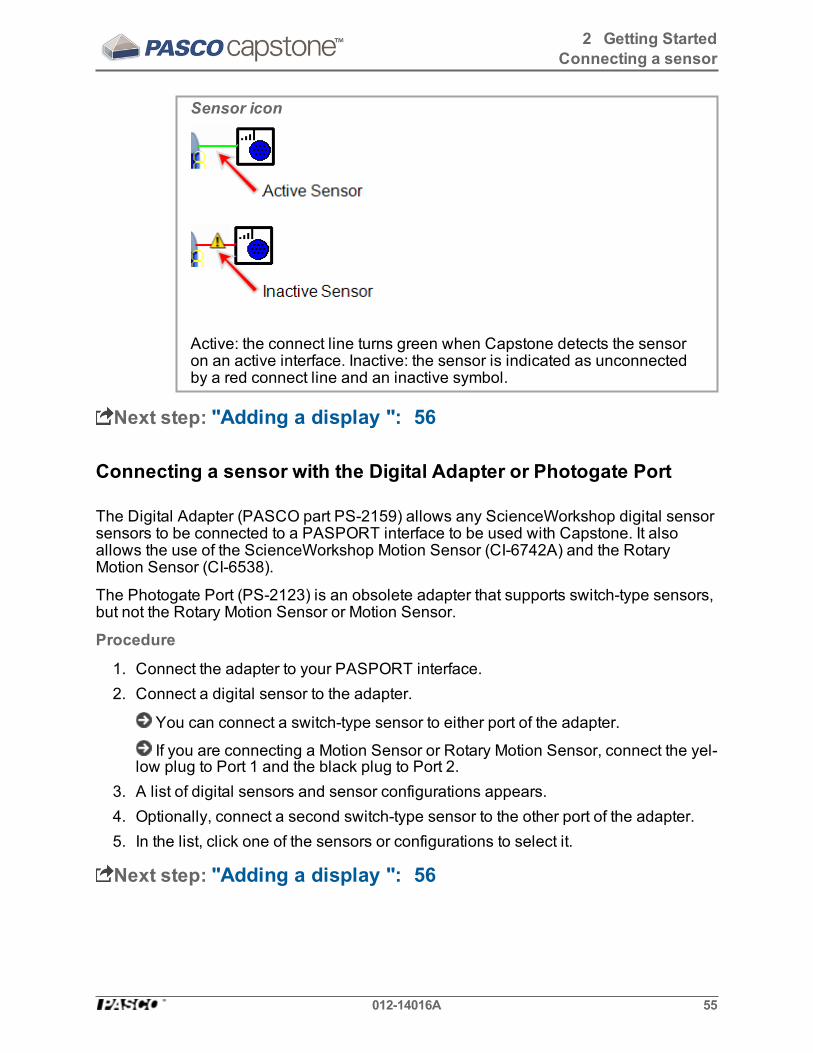
Sensor icon
Active: the connect line turns green when Capstone detects the sensoron an active interface. Inactive: the sensor is indicated as unconnectedby a red connect line and an inactive symbol.
Next step: "Adding a display ": 56
Connecting a sensor with the Digital Adapter or Photogate Port
The Digital Adapter (PASCO part PS-2159) allows any ScienceWorkshop digital sensorsensors to be connected to a PASPORT interface to be used with Capstone. It alsoallows the use of the ScienceWorkshop Motion Sensor (CI-6742A) and the RotaryMotion Sensor (CI-6538).
The Photogate Port (PS-2123) is an obsolete adapter that supports switch-type sensors,but not the Rotary Motion Sensor or Motion Sensor.
Procedure
1. Connect the adapter to your PASPORT interface.2. Connect a digital sensor to the adapter.
You can connect a switch-type sensor to either port of the adapter.
If you are connecting a Motion Sensor or Rotary Motion Sensor, connect the yel-low plug to Port 1 and the black plug to Port 2.
3. A list of digital sensors and sensor configurations appears.4. Optionally, connect a second switch-type sensor to the other port of the adapter.5. In the list, click one of the sensors or configurations to select it.
Next step: "Adding a display ": 56
012-14016A 55
2 Getting StartedConnecting a sensor

Connecting a sensor with the Analog Adapter
The Analog Adapter (PASCO part PS-2158) allows analog ScienceWorkshop sensorsto be connected to a PASPORT interface to be used with Capstone.
Procedure
1. Connect the Analog Adapter to your PASPORT interface.2. Connect an analog sensor to the adapter.
A list of sensors appears.3. Click one of the sensors to select it.4. Optionally, click the Gain: box and click a gain setting.5. Click OK.
Next step: "Adding a display ": 56
Connecting a sensor with the AirLink2
The AirLink2 sensor interface can communicate with computers using the USB con-nection or the via the bluetooth interface.
Next step: "Adding a display ": 56
Adding a displayCapstone provides a highly flexible environment for workbook page layout.
Pages can be created using any combination of templates, drag and drop to targets, andmoving and resizing display elements.
Use a QuickStart template
1. Click one of the provided templates. Tip1
1You can add or remove display elements after you select a template.
012-14016A 56
2 Getting StartedAdding a display

Page layout templates
2. The selected layout appears in the Display Area
3. Click <Select Measurement> for each display.
4. Select the measurement in the drop-down list.
Note: Sensors that are inactive (not ready to collect data) appear with .( See"Connecting an interface": 17 and "Connecting a sensor": 27)
Use drag & drop and targets
1. Click one of the display icons in the Displays Palette.
See "Tour the Displays Palette ": 10 for a description of the available displaytypes.
2. Drag the icon to the Display Area.3. Use the Page layout targets to quickly format the page.
Using Page layout targets
1. Drag a display icon to one of the five targets.2. Move the cursor around open area of the page.3. The target turns darker as you approach it and is selected when the border
on the target appears.4. Drop the icon on a selected target.
Page targets divide the available area into the following five sections: Tip1
Note: Page targets divide either an open area or an existing display.
1Use targets to quickly divide an existing display into two displays.
012-14016A 57
2 Getting StartedAdding a display

Page layout targets
entire available area (not used for splitting an existing dis-play)
left half (divided vertically–left half shows darker than right)
right half (divided vertically–right half shows darker than left)
top half (divided horizontally–top half shows darker than bot-tom)
bottom half (divided horizontally–bottom half shows darkerthan top)
4. The selected layout appears in the Display Area Tip1
5. Add more displays noting the Page layout targets.6. Click the <Select Measurement> button for each display.7. Select the measurement in the drop-down list.
Note: Sensors that are inactive (not ready to collect data) appear with .( See"Connecting an interface": 17 and "Connecting a sensor": 27)
Moving and resizing
Capstone uses handles to move and resize individual displays on a page. Capstoneincludes vertical and horizontal alignment borders for easy display alignment.
Moving a display
1. Click on the display you wish to move to make it active.
1You can add or remove display elements after you select a template.
012-14016A 58
2 Getting StartedAdding a display

2. Move the cursor until the border darkens and the move (hand) symbol appears.
Page layout move handle
3. Click and drag the display to new location.
Note: The alignment guides appear (dotted lines) when the display borderaligns with adjacent displays.
Resizing a display
1. Click on the display to move to make it active.
2. Move the cursor to one of the eight resize handles (circle ).
Page layout resize handle
3. Click and drag the border to new position.
Note: The alignment guides appear (dotted lines) when the display borderaligns with adjacent displays.
Realigning displays
1. Move the cursor between displays until the desired move border symbol appears.
012-14016A 59
2 Getting StartedAdding a display

Page layout realign handles
2. Click and drag the border to new position.This action might affect multiple displays.
It might be necessary to move displays to align to a common alignment border. (See "Moving a display": 58)
Next step: "Starting an experiment": 60
Starting an experimentCapstone provides several controls in the Controls Palette for collecting data.
Pre-work
1. Connect one or more interfaces. ( See "Connecting an interface": 17)
2. Connect one or more sensors. ( See "Connecting a sensor": 27)
3. Add one or displays. ( See "Adding a display ": 56)
Note: Sensors that are inactive (not ready to collect data) appear with .( See"Connecting an interface": 17 and "Connecting a sensor": 27)
Start data collection with default settings
Note: Measurements in displays that are inactive (not ready to collect data) appearwith . Additionally, the data record button turns gray if there is not at least one act-ive interface and sensor.( See"Connecting an interface": 17 and "Connecting a sensor": 27)
012-14016A 60
2 Getting StartedStarting an experiment

1. Click Record in the Controls Palette.
Record button
Capstone begins recording all available data.
Record toggles to Stop .
2. Click Stop in the Controls Palette to stop data collection.
Collected data appear in all displays of the current page.
The data run is listed in the legend for each display.
Recorded data appear on the Sensor Data Summary tab ( ) in Data Sum-mary, and is selectable from any data display with a default name Run #%1,where%1 is an automatically generated run number.
See "How do I record data in PASCO Capstone? ": 73 for details.
Removing data runs
n Delete Last Run: click Delete Last Run in the Controls Palette .n Delete Selected Runs: click the down arrow next to Delete Last Run
and select a specific run.
n Delete All Runs: click the down arrow next to Delete Last Runand select Delete All Runs. Tip1
Note: The run data is removed from all displays, legends, and the data summary.Click the Undo button at the top to recover the data.
Next step (optional): "Downloading Capstone experiments": 61
Downloading Capstone experimentsPASCO provides several ready-made experiments for Capstone. Tip2
1You can delete all data for the run and repeat data collection.2The lab might contain multiple pages including:◇ introduction◇ theory◇setup &procedures◇analysis◇conclusions
012-14016A 61
2 Getting StartedDownloading Capstone experiments

1. Go to the Capstone experiments web page: http://www.-pasco.com/family/capstone-experiments/index.cfm
2. Select a subject area, for example Thermodynamics.3. Select the Free Experiments Files tab.4. Scroll through the list of ready-made experiments and click to download the exper-
iment files.5. Copy the files from your download folder to your Capstone experiments folder.
The download might contain the following:l Capstone application files; these have a ".cap" file extension
l Editable lab guides
l Images
6. Open the *.cap file from Capstone.a. Click File > Open Experiment....b. Navigate to the experiment file.c. Click Open.
012-14016A 62
2 Getting StartedDownloading Capstone experiments

3 How do I...Installation and Update
"How do I automate a network installation?": 66
"How do I force an update to an interface?": 66
Experiment Files
"How do I download and open PASCO ready-made experiments?": 67
"How do I save my experiment?": 68
"How do I export all data?": 68
"How do I open DataStudio experiments and data?": 68
"How do I open Xplorer GLX, SPARK SLS, and other non-Capstone experiments anddata?": 69
"How do I import data from Microsoft Excel*? ": 69
"How do I export data to Microsoft Excel*?": 70
"How do I import Xplorer GLX data?": 71
Data and Measurements
"How do I record data in PASCO Capstone? ": 73
"How do I delete data runs?": 79
"How do I choose one or more runs to display?": 79
"How do I identify a measurement when I have multiple of the same type?": 80
"How do I change the numerical format of data?": 81
"How do I change the numerical format of statistics?": 83
"How do I exclude, delete, and restore selected data?": 84
"How do I edit a measurement?": 87
"How do I create a pure mathematical function?": 87
Workbooks
"How do I show, hide, and lock the palettes?": 89
"How do I change what display toolbar buttons are visible?": 90
Sensors
"How do I zero a measurement?": 92
012-14016A 63
3 How do I...

"How do I switch the sign on a sensor?": 93
"How do I calibrate a sensor?": 94
"How do I calibrate a motion sensor?": 95
"How do I calibrate a drop counter?": 96
"How do I calibrate a pH sensor?": 97
Calculations
"How do I create a calculation? ": 99
"How do I use my calculation?": 102
"How do I select a measurement in the calculator?": 103
"How do I see the result of a calculation?": 103
"How do I reorder calculations?": 105
Plots
"How do I plot multiple measurements on separate plot areas with shared X-axis?": 107
"How do I zoom to a selection?": 108
"How do I pan and scale?": 110
"How do I select active data?": 111
"How do I plot multiple measurements on same plot with multiple Y-axes?": 113
"How do I plot multiple measurements on same plot with same Y-axes?": 114
"How do I apply a curve fit to a portion of the data?": 117
"How do I change curve fit parameters?": 118
"How do I adjust the weights for the weighted linear fit?": 119
"How do I lock and unlock the axes of a graph?": 121
"How do I change layer order of a display?": 123
Tables
"How do I reorder columns in a table?": 124
"How do I use a table to build data in Keep Mode?": 124
Text Boxes
"How do I enter subscripts, superscripts, Greek letters, and symbols?": 127
"How do I enter an equation into a text display?": 127
012-14016A 64
3 How do I...
Scope
"How do I compare scope traces from the same sensor when monitoring?": 130
"How do I select the scope trigger?": 131
"How do I pre-trigger?": 134
"How do I freeze and record the scope display?": 135
Video
" How do I add a video source?": 137
"How do I analyze a video?": 138
"How do I manually synchronize video with data?": 140
"How do I adjust the frame rate of a recorded video?": 141
"How do I adjust the resolution of a video?": 141
"How do I make files with videos smaller?": 141
"How do I troubleshot video problems?": 142
012-14016A 65
3 How do I...
How do I... Installation and Update"How do I automate a network installation?": 66
"How do I force an update to an interface?": 66
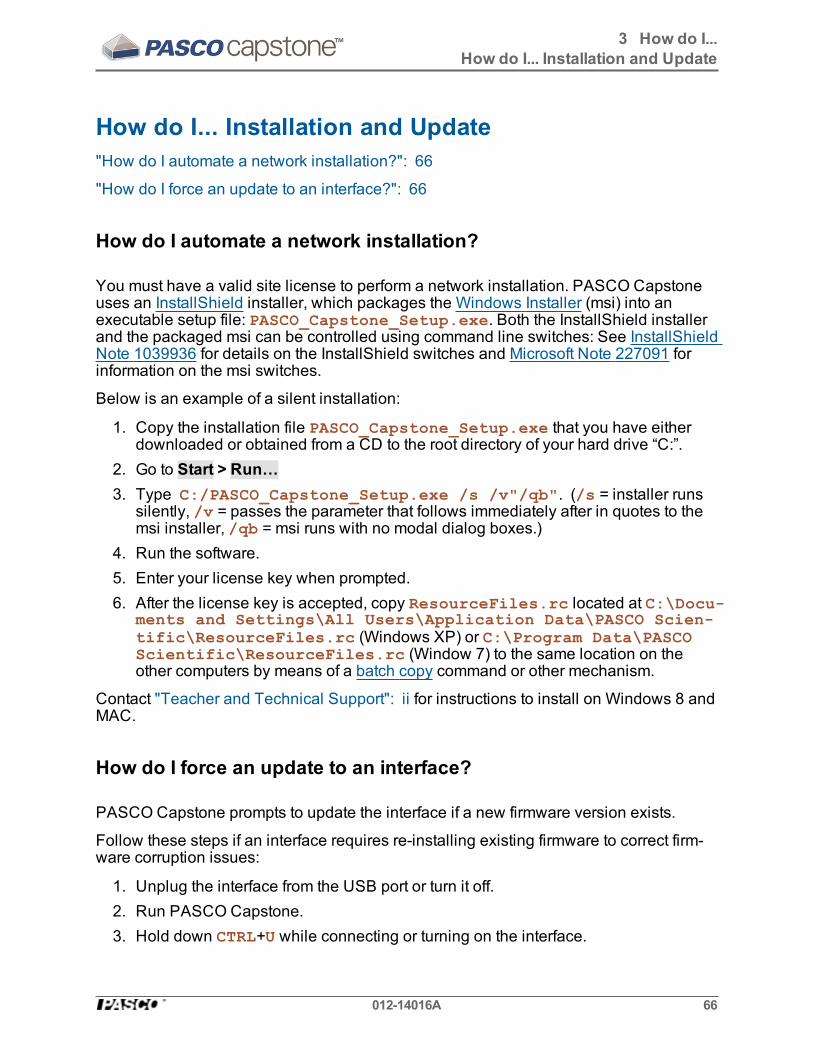
How do I automate a network installation?
You must have a valid site license to perform a network installation. PASCO Capstoneuses an InstallShield installer, which packages the Windows Installer (msi) into anexecutable setup file: PASCO_Capstone_Setup.exe. Both the InstallShield installerand the packaged msi can be controlled using command line switches: See InstallShieldNote 1039936 for details on the InstallShield switches and Microsoft Note 227091 forinformation on the msi switches.
Below is an example of a silent installation:
1. Copy the installation file PASCO_Capstone_Setup.exe that you have eitherdownloaded or obtained from a CD to the root directory of your hard drive “C:”.
2. Go to Start > Run…3. Type C:/PASCO_Capstone_Setup.exe /s /v"/qb". (/s = installer runs
silently, /v = passes the parameter that follows immediately after in quotes to themsi installer, /qb = msi runs with no modal dialog boxes.)
4. Run the software.5. Enter your license key when prompted.6. After the license key is accepted, copy ResourceFiles.rc located at C:\Docu-
ments and Settings\All Users\Application Data\PASCO Scien-tific\ResourceFiles.rc (Windows XP) or C:\Program Data\PASCOScientific\ResourceFiles.rc (Window 7) to the same location on theother computers by means of a batch copy command or other mechanism.
Contact "Teacher and Technical Support": ii for instructions to install on Windows 8 andMAC.
How do I force an update to an interface?
PASCO Capstone prompts to update the interface if a new firmware version exists.
Follow these steps if an interface requires re-installing existing firmware to correct firm-ware corruption issues:
1. Unplug the interface from the USB port or turn it off.2. Run PASCO Capstone.3. Hold down CTRL+U while connecting or turning on the interface.
012-14016A 66
3 How do I...How do I... Installation and Update

How do I... Experiment Files"How do I download and open PASCO ready-made experiments?": 67
"How do I save my experiment?": 68
"How do I export all data?": 68
"How do I open DataStudio experiments and data?": 68
"How do I open Xplorer GLX, SPARK SLS, and other non-Capstone experiments anddata?": 69
"How do I import data from Microsoft Excel*? ": 69
"How do I export data to Microsoft Excel*?": 70
"How do I import Xplorer GLX data?": 71
How do I download and open PASCO ready-made experiments?
PASCO provides several ready-made experiments for Capstone. Tip1
1. Go to the Capstone experiments web page: http://www.-pasco.com/family/capstone-experiments/index.cfm
2. Select a subject area, for example Thermodynamics.3. Select the Free Experiments Files tab.4. Scroll through the list of ready-made experiments and click to download the exper-
iment files.5. Copy the files from your download folder to your Capstone experiments folder.
The download might contain the following:l Capstone application files; these have a ".cap" file extension
l Editable lab guides
l Images
6. Open the *.cap file from Capstone.a. Click File > Open Experiment....b. Navigate to the experiment file.c. Click Open.
1The lab might contain multiple pages including:◇ introduction◇ theory◇setup &procedures◇analysis◇conclusions
012-14016A 67
3 How do I...How do I... Experiment Files

How do I save my experiment?
Click File > Save Experiment.
All of the data, displays, toolbar states and formatting are saved.
Note: Deleted data and undo history are not saved.
How do I export all data?
1. Click File > Export Data...2. Select a file type: Text (Tab delimited) (*.txt);CSV (Comma delimited) (*.csv).3. Navigate to the location to save the file.4. Click Save.
How do I open DataStudio experiments and data?
PASCO Capstone can open and convert most DataStudio 1.9 files to Capstone format.
1. Click File > Open Experiment...2. Click on the file type pull-down menu, and select: DataStudio 1.9 files (*.ds)3. Click Open.
Capstone places each display from the DataStudio on separate Capstone work-book pages.
Each display is sized to the full page.
Each page (tab) is named with the display name.
4. Recommended: save the experiment as a Capstone file. ( See "How do I savemy experiment?": 68)
5. Re-layout the Capstone pages as desired.To combine multiple displays on a single page:a. Resize and move the display that will contain multiple displays to create a
space for additional display(s). ( See "Moving and resizing": 58)b. Click on page tab containing display to move.c. Resize the display smaller than full page.d. Select the display border, right click and select Cut.
012-14016A 68
3 How do I...How do I... Experiment Files

e. Click on the page, right-click and select Paste.f. Resize and move as desired.
How do I open Xplorer GLX, SPARK SLS, and other non-Capstoneexperiments and data?
Xplorer GLX
PASCO Capstone can open and convert most DataStudio 1.9 and Xplorer GLX filesto Capstone format.
(For files resident on the Xplorer GLX: see "How do I import Xplorer GLX data?": 71)
1. Click File > Open Experiment...2. Click on the file type pull-down menu, and select:GLX Files (*.glx)3. Click Open.
4. Recommended: save the experiment as a Capstone file. ( See "How do I savemy experiment?": 68)
Xplorer and 500 Dataloggers
TBD
SPARK SLS Experiments
TBD
How do I import data from Microsoft Excel*?
Tip1
1. Open Microsoft Excel with the file containing your data.2. Highlight the data within one column.3. Press CTRL+C to copy the data.4. Open PASCO Capstone.
5. Create a Table. ( See "Adding a display ": 56)6. Click on <Select Measurement> in a column.
1Capstone supports export as tab-delimited text, which can be imported into almostany spreadsheet or data analysis program. Note that Capstone is a complete data col-lection, visualization, and analysis tool; therefore, it is generally easier to analyze thedata in Capstone than to export to another software program for analysis.
012-14016A 69
3 How do I...How do I... Experiment Files

7. Select Create New > User-Entered Data.8. Optional: Rename the measurement and give it appropriate units.9. Click in the cell of the User-Entered Data column where you would like to have
the data pasted.10. Press CTRL+V to paste.11. Repeat for additional columns of data.
Each column of data is a separate data set.
Imported data are listed in the User-Entered Data Summary tab ( ) of DataSummary.
How do I export data to Microsoft Excel*?
Tip1
Export All Data
1. Select File > Export Data...2. Select CSV (comma delimited) as the file type.3. Click Save.
Export Selected Data
1. Create a Table. ( See "Adding a display ": 56)2. Select the data that you would like to copy:
n All data: click anywhere in the table and press CTRL+A.
n All of the data in a column: click anywhere on the heading of the columnwhere there is no text.
n Visible part of a table: click and drag to select data.
3. Press CTRL+C to copy data to clipboard.4. Open Microsoft Excel*.5. Click in a cell where you would like the data to appear.6. Press CTRL+V to paste data.
1Capstone supports export as tab-delimited text, which can be imported into almostany spreadsheet or data analysis program. Note that Capstone is a complete data col-lection, visualization, and analysis tool; therefore, it is generally easier to analyze thedata in Capstone than to export to another software program for analysis.
012-14016A 70
3 How do I...How do I... Experiment Files

Note: You can define the format in Excel to include significant digits. (Format as Num-ber with a defined number of decimal places.)
How do I import Xplorer GLX data?
Note: For Xplorer GLX files on the host computer: see "How do I open DataStudio exper-iments and data?": 68
To transfer experiments (including data files) from the Xplorer GLX to Capstone:
1. Connect the Xplorer GLX to Capstone.
2. Click Hardware Setup in the Tools Palette: .
Hardware Setup button
3. Click the yellow file folder icon next to the Xplorer GLX: .
GLX folder icon
012-14016A 71
3 How do I...How do I... Experiment Files

4. Click Download All.5. Navigate a folder and click Select Folder.6. Click File > Open Experiment....7. Select GLX Files (*.glx) from the file type drop down.8. Navigate to the saved file .9. Click Open.
Capstone opens the experiment and data for analysis and further data acquisition.
012-14016A 72
3 How do I...How do I... Experiment Files

How do I... Data and Measurements"How do I record data in PASCO Capstone? ": 73
"How do I delete data runs?": 79
"How do I choose one or more runs to display?": 79
"How do I identify a measurement when I have multiple of the same type?": 80
"How do I change the numerical format of data?": 81
"How do I change the numerical format of statistics?": 83
"How do I exclude, delete, and restore selected data?": 84
"How do I edit a measurement?": 87
"How do I create a pure mathematical function?": 87
How do I record data in PASCO Capstone?
There are three data recording modes in PASCO Capstone. Data recording is controlledby the settings on the record tab of the Controls Palette.
Record modes
ContinuousMode Set to record data at the current sample rate settings
Keep Mode Set to keep data points when commandedFast Mon-itor Mode
Set to acquire data without recording; required for high speedsampling in Scope and FFT displays
Detailed Explanations
012-14016A 73
3 How do I...How do I... Data and Measurements

Continuous Mode Set to record data at the current sample rate set-tings
Behavior
l All measurement Data1 continuously records as soon as Record is clicked inthe Controls Palette until the Stop is clicked (or the hardware is no longer ableto process the data–at which time data collection will stop with an error message).
l Data records at the specified sample rate(s).
See "What is Continuous Mode?": 168
Procedure
1. Select Continuous Mode in the Controls Palette.2. Adjust the sample rates of each of the measurements:
Ensure sensors are sufficiently responsive for desired data while low enough sothat the computer system can keep up with data sampling and does not generateexcessive file sizes.
3.
Sample Rate
4. Click Record in the Controls Palette.
Record button
Capstone begins recording all available data.
Record toggles to Stop .
5. Click Stop in the Controls Palette to stop data collection.
Collected data appear in all displays of the current page.
1A data set including measurement and user-defined data from sensors and timedata.
012-14016A 74
3 How do I...How do I... Data and Measurements

The data run is listed in the legend for each display.
Recorded data appear on the Sensor Data Summary tab ( ) in Data Sum-mary, and is selectable from any data display with a default name Run #%1,where%1 is an automatically generated run number.
Keep Mode Set to keep data points when commanded
Behavior
l Manual recording mode.
l The measurement sample rate(s) determine the rate at which data samples arepreviewed (not recorded).
l Data1 records when and only when Keep Sample is clicked in the ControlsPalette while monitoring data.
l One instance of all data is recorded each time Keep Sample is clicked.
Procedure
Tip: You can use a table with Keep Mode to build data for specific points. (See "How do I use a table to build data in Keep Mode?": 124)_
1. Select Keep Mode in the Controls Palette.2. Adjust the sample rates of each of the measurements so that the sensors are suf-
ficiently responsive for desired data.
Sample Rate
3. Click Preview in the Controls Palette.
Preview button
1A data set including measurement and user-defined data from sensors and timedata.
012-14016A 75
3 How do I...How do I... Data and Measurements

Capstone begins monitoring data and displays previews.
Preview toggles to Stop .
Keep Sample button is active.
4. Click Keep Sample to record the data currently monitored.
One instance of all data is recorded.
Keep Sample button
5. Repeatedly click Keep Sample to record data.
One instance of all data is recorded each time Keep Sample is clicked.
6. Optional: Replace values in a table. ( See "Replacing a current value in a table":125.)
Note: You can replace data in tables while in preview mode for the run (beforeclicking Stop ).See "How do I edit a measurement?": 87 to edit data after you click Stop .
7. Click Stop in the Controls Palette to stop observing the data.
Collected data appear in all displays of the current page.
The data run is listed in the legend for each display.
Recorded data appear on the Sensor Data Summary tab ( ) in Data Sum-mary, and is selectable from any data display with a default name Run #%1,where%1 is an automatically generated run number.
012-14016A 76
3 How do I...How do I... Data and Measurements

Fast Monitor Mode Set to acquire data without recording; required forhigh speed sampling in Scope and FFT displays
Behavior
l Intended for use with workbooks pages containing the FFT or Scope displays.
l Designed for viewing periodic data or triggered transient events.
l Monitor displays data without recording.
l Snapshot records the monitored data.l Only Data1 that is currently visible in the display is recorded each timeSnapshot is clicked.
l Unsaved buffer data is also recorded when closing Capstone.
l Can repeatedly monitor and record data points.
See "What is Fast Monitor Mode?": 169
Procedure
1. Select Fast Monitor Mode in the Controls Palette.2. Adjust the sample rates of each of the measurements so that the sensors are suf-
ficiently responsive for desired data.
Sample Rate
3. Select one or more scope or FFT displays. ( See "Adding a display ": 56)
Note: To record a single event, use the scope display and click the single-shotbutton . ( See "What does the Single Shot button do?": 178)
4. Click Monitor in the Controls Palette.
1A data set including measurement and user-defined data from sensors and timedata.
012-14016A 77
3 How do I...How do I... Data and Measurements

Monitor button
5. Click Stop in the Controls Palette to stop observing the data.
Monitor stop button
Capstone freezes the display.
6. Scale the data to fit the data to record within the displays. ( See "How do I panand scale?": 110)
7. Click Snapshot in the scope toolbar.
Scope Toolbar: Snapshot
Capstone records the data.
Notes:Only the data that is visible in the plot area is recorded as a run when Snapshot
is clicked.Recorded data appear on the sensor tab in the Data Summary tab ( ), and isselectable from any data display with a default name Monitor Run--ScopeSnapshot%1 where%1 is an automatically generated run number.
012-14016A 78
3 How do I...How do I... Data and Measurements

How do I delete data runs?
n Delete Last Run: click Delete Last Run in the Controls Palette .n Delete Selected Runs: click the down arrow next to Delete Last Run
and select a specific run.
n Delete All Runs: click the down arrow next to Delete Last Runand select Delete All Runs. Tip1
Note: The run data is removed from all displays, legends, and the data summary.Click the Undo button at the top to recover the data.
How do I choose one or more runs to display?
By default, PASCO Capstone displays the last run recorded or the currently selectedmeasurement in Replay mode.
To select a different run to display:
1. Click the pull-down arrow ( ) next to Run Selection in the toolbar.
Toolbar: Run Selection button
2. Select the run to display.
To display multiple runs:
1You can delete all data for the run and repeat data collection.
012-14016A 79
3 How do I...How do I... Data and Measurements

1. Click to depress Run Selection in the toolbar.
Toolbar: Run Selection button
Selected runs display simultaneous with the button is depressed.
2. Click the pull-down arrow ( ) next to Run Selection in the toolbar.3. Select the one or more runs to display.
How do I identify a measurement when I have multiple of the sametype?
One instance of a measurement
Format for a single instance of a specific measurement:
Measurement Type (units)
Example: Force (N)
Multiple instances of measurement–one interface connected
Format for multiple instances of a specific measure with one interface connected:
Measurement Type, Port (units)
Example: Force, Ch P1 (N)
Where:Measurement Type = ForcePort on interface = P1 (Port identifier on the interface "P1" → PASPORT sensornumber 1)
Multiple instances of measurement–multiple interfaces connected
Format for multiple instances of a specific measure with multiple interfaces connected:
Measurement Type, Channel:Port (units)
Example: Force, Ch A:P1 (N)
Where:Measurement Type = Force
012-14016A 80
3 How do I...How do I... Data and Measurements

Channel = A (Interface identifier "A")Port = P1 (Port identifier on the interface "P1" → PASPORT sensor number 1)
Setup with multiple interfaces
Data Summary Force, Ch A:P1 (N)
Force, Ch A:P2 (N)
Force, Ch B:1 (N)
How do I change the numerical format of data?
Note: Changing data precision correspondingly changes the precision of statisticsthat use the data.
012-14016A 81
3 How do I...How do I... Data and Measurements

1. Click Data Summary in the Tools Palette.
Data Summary button
2. Click the Sensor Data tab .3. Click the measurement to change.
4. Click Properties that appears to the right of the measurement.The Properties window opens.
5. Click Numerical Format.6. Set the desired numerical format:
Numerical Format Description
Number of Decimal Places Set the number of digits that will appear tothe right of the decimal.
Apply Scientific NotationThresholds
Select to enable Scientific NotationThresholds
Scientific Notation Thresholds Determines when the unit range transitionsinto scientific notation.
Lower ExponentThreshold ≤Upper ExponentThreshold ≥
Apply limits for which the unit range trans-itions into scientific notation.
Apply Zero Level Thresholds Select to enable Apply Zero LevelThresholds
Apply Zero Level Thresholds Apply the limit under which the number isconsidered to be zero.
7. Click OK.
012-14016A 82
3 How do I...How do I... Data and Measurements

How do I change the numerical format of statistics?
Note: Changing data statistics precision correspondingly changes the precision ofdata.
To change the numerical format of the statistics, change the numerical format of the dataon which the statistics are based.
1. Click Data Summary in the Tools Palette.
Data Summary button
2. Click the Sensor Data tab .3. Click the measurement to change.
4. Click Properties that appears to the right of the measurement.The Properties window opens.
5. Click Numerical Format.
012-14016A 83
3 How do I...How do I... Data and Measurements

6. Set the desired numerical format:
Numerical Format Description
Number of Decimal Places Set the number of digits that will appear tothe right of the decimal.
Apply Scientific NotationThresholds
Select to enable Scientific NotationThresholds
Scientific Notation Thresholds Determines when the unit range transitionsinto scientific notation.
Lower ExponentThreshold ≤Upper ExponentThreshold ≥
Apply limits for which the unit range trans-itions into scientific notation.
Apply Zero Level Thresholds Select to enable Apply Zero LevelThresholds
Apply Zero Level Thresholds Apply the limit under which the number isconsidered to be zero.
7. Click OK.
How do I exclude, delete, and restore selected data?
Note: You can create User-Entered Data to copy and edit/delete data in the list. (See "How do I edit a measurement?": 87)
Table
1. Highlight cells (click one cell or click and drag across multiple cells Tip1).2. Exclude Selected Data: Right-click and select Exclude Data.3. Delete Selected Data: Right-click and select Delete Cell Data.
Note: Excluded data are masked in the data set and are not used by Capstonefor data operations including display and calculations. Excluded data can berestored at any time.
Note: Deleted data are removed from the data set and the data cannot berestored at a later time. You can immediately undo a delete action byclicking Undo .
1Click the table heading to highlight all data in the table column.
012-14016A 84
3 How do I...How do I... Data and Measurements

Deleted and Excluded Data in a Table
Deleted data areremoved. Note the gap intime data.
Excluded data displaywith strikethrough.
Graph
1. Click Highlight range of points in active data in the toolbar.
Toolbar: Highlight Data button
2. Move and resize the selection rectangle as needed.3. Exclude Selected Data: Right-click and select Exclusions > Exclude High-
lighted Data Points.4. Delete Selected Data: Right-click and select Deletions > Delete Highlighted
Data Points.5. Delete Excluded Data: Right-click and select Deletions > Delete ALL Excluded
Data Points.
Note: Excluded data are masked in the data set and are not used by Capstonefor data operations including display and calculations. Excluded data can berestored at any time.
Note: Deleted data are removed from the data set and the data cannot be
012-14016A 85
3 How do I...How do I... Data and Measurements

restored at a later time. You can immediately undo a delete action byclicking Undo .
Deleted and Excluded Data in a Plot
Deleted data areremoved.
Excluded datadisplay with "X"marks.
To restore excluded data
Table
1. Highlight excluded cells. Tip1
2. Right-click and select Restored Excluded Data
Graph
1. Click Highlight range of points in active data in the toolbar.
Toolbar: Highlight Data button
2. Move and resize the selection rectangle as needed to highlight excluded datapoints.
3. Restore Selected Data: Right-click and select Exclusions > Restore ExcludedData Points Within Highlighter's Bounds.
4. Restore All Data: Right-click and select Exclusions > Restore ALL ExcludedData Points.
1Click the table heading to highlight all data in the table column.
012-14016A 86
3 How do I...How do I... Data and Measurements

How do I edit a measurement?
Measurements cannot be edited directly in PASCO Capstone. You can create User-Entered Data to copy and edit/delete data in the list.
Note: You can use Exclude Data to exclude selected data from analysisand Displays. ( See "How do I exclude, delete, and restore selected data?": 84)
1. Create a Table. ( See "Adding a display ": 56)2. Click <Select Measurement> in the first column.3. Select the measurement you would like edit.4. Click <Select Measurement> in the second column.5. Select Create New > User-Entered Data.6. Click on the top of the first column.7. Right click and select Copy Values (or use CTRL+C).8. Click in the first cell of the User Data %1 (where%1 is serial number) column.9. Right-click and select Paste Values (or use CTRL+V).10. Edit data in cells:
a. Change values in cells as needed.b. Highlight cells and right-click to select: Clear Values, Insert Cells, Delete
Cell Data, or Exclude Data as needed.11. Click on User Data %1 in the column heading, select rename, and enter a mean-
ingful name and units.
Imported data are listed in the User-Entered Data Summary tab ( ) of DataSummary.
How do I create a pure mathematical function?
Graph a purely mathematical function by defining amodel1 and then creating a cal-culation on the model within the calculator.
Procedure
1. Create a model in the calculator.
a. Open the Calculator. ( See "How do I create a calculation? ": 99)b. Right click on a new calculation line and select Insert Model Range.
1A sequence of values within a range and a defined number of steps or step size.
012-14016A 87
3 How do I...How do I... Data and Measurements
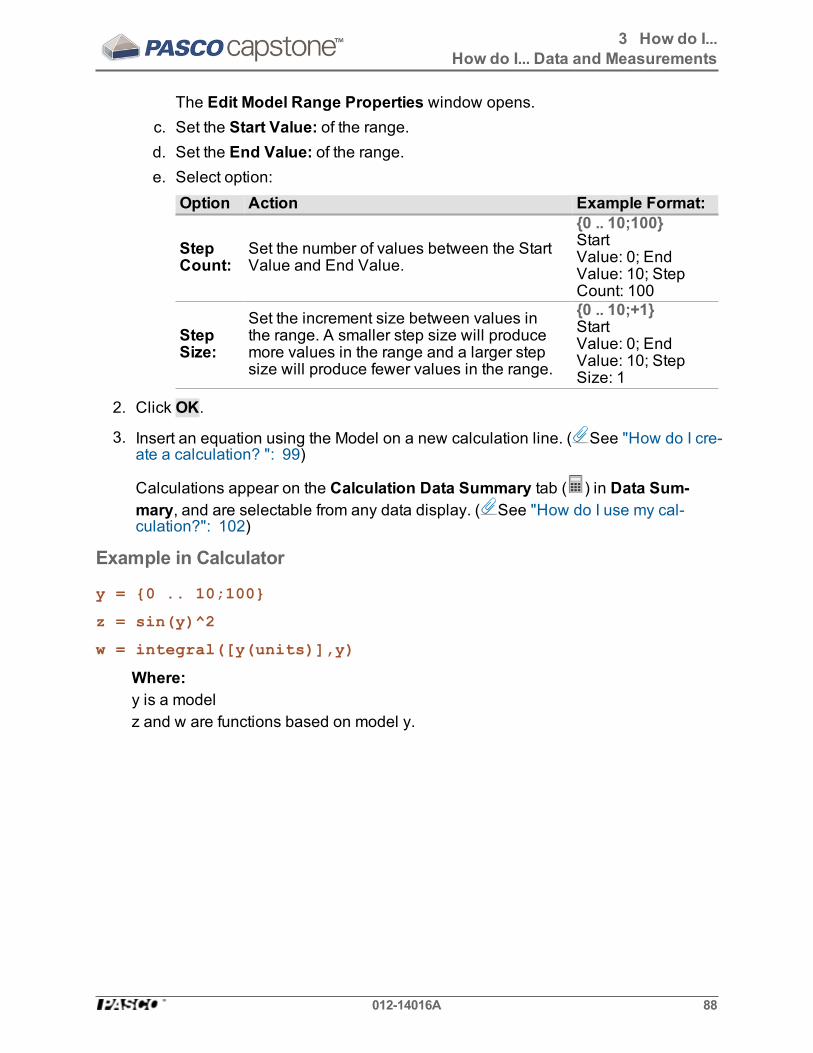
The Edit Model Range Properties window opens.c. Set the Start Value: of the range.d. Set the End Value: of the range.e. Select option:
Option Action Example Format:
StepCount:
Set the number of values between the StartValue and End Value.
{0 .. 10;100}StartValue: 0; EndValue: 10; StepCount: 100
StepSize:
Set the increment size between values inthe range. A smaller step size will producemore values in the range and a larger stepsize will produce fewer values in the range.
{0 .. 10;+1}StartValue: 0; EndValue: 10; StepSize: 1
2. Click OK.
3. Insert an equation using the Model on a new calculation line. ( See "How do I cre-ate a calculation? ": 99)
Calculations appear on the Calculation Data Summary tab ( ) in Data Sum-mary, and are selectable from any data display. ( See "How do I use my cal-culation?": 102)
Example in Calculator
y = {0 .. 10;100}
z = sin(y)^2
w = integral([y(units)],y)
Where:y is a modelz and w are functions based on model y.
012-14016A 88
3 How do I...How do I... Data and Measurements

How do I... Workbooks"How do I show, hide, and lock the palettes?": 89
"How do I change what display toolbar buttons are visible?": 90
How do I show, hide, and lock the palettes?
1. Right-click anywhere in the gray area surrounding a workbook page.
Right-click in area surrounding display
2. Show/hide: click the palette that you would like to show ( ) or hide ( ).
012-14016A 89
3 How do I...How do I... Workbooks

3. Lock/unlock: click Lock Page to lock ( ) or unlock page ( ).
Locked pages:n Displays cannot be added or removed.
n Text Entry Box elements are active and accept user entries.
n Displays can be scaled and panned.
How do I change what display toolbar buttons are visible?
1. Click on Visibility Menu in the display Toolbar.
Toolbar: Visibility Menu button
If the Visibility Menu button is not available: right-click anywhere in the gray
012-14016A 90
3 How do I...How do I... Workbooks

area surrounding a workbook page and deselect Lock Page.
Right-click in area surrounding display
2. Click the buttons that you would like to show ( ) or hide ( ) on the toolbar.
012-14016A 91
3 How do I...How do I... Workbooks

How do I... Sensors"How do I zero a measurement?": 92
"How do I switch the sign on a sensor?": 93
"How do I calibrate a sensor?": 94
"How do I calibrate a motion sensor?": 95
"How do I calibrate a drop counter?": 96
"How do I calibrate a pH sensor?": 97
How do I zero a measurement?
Note: If a sensor is selected in the Controls Palette that supports zeroing, the ControlsPalette includes a Zero Sensor Now button .
Procedure
1. Connect the sensor to PASCO Capstone. ( See "Connecting a sensor": 27)
2. Click Hardware Setup in the Tools Palette: .
Hardware Setup button
3. Click on the sensor to zero.
4. Click Properties in the lower right corner of the Hardware Setup window.
The Properties window opens.5. Select option:
012-14016A 92
3 How do I...How do I... Sensors

These options will not appear for sensors that do not have these capabilities.Option DescriptionZero Sensor Meas-urements at Start
Zero this sensor's measurements each time anew run is recorded.
Zero Sensor Now Zero this sensor's measurements when the buttonis clicked.
6. Click OK.
How do I switch the sign on a sensor?
Method 1: configuring sensor (that supports sign change)
1. Click Hardware Setup in the Tools Palette: .
Hardware Setup button
2. Click on the sensor to Change Sign.
3. Click Properties in the lower right corner of the Hardware Setup window.4. The Properties window opens.5. Click Change Sign .
This option will not appear for sensors that do not have this capability.6. Click OK.
The sensor automatically switches the sign when recording data.
Method 2: using QuickCalc (any sensor)
1. Create a Table. ( See "Adding a display ": 56)2. Click <Select Measurement> and select the measurement to change sign.
012-14016A 93
3 How do I...How do I... Sensors

3. Click QuickCalc in the toolbar.
Toolbar: QuickCalc button
A new table column is added with a default calculation that includes the selec-ted measurement.
4. Rename the calculation to something meaningful.5. Add a negative sign in the calculation before the measurement.
Example: ForceA=-[Force(N)]6. Press Enter.
The new column is the opposite sign of the original measurement data.7. Click on the units in the new column and change to something meaningful.
Calculations appear on the Calculation Data Summary tab ( ) in Data Sum-mary, and are selectable from any data display. ( See "How do I use my cal-culation?": 102)
Method 3: using Calculator (any sensor)
Use the Calculator to create a calculation that changes the sign. ( See "How do I cre-ate a calculation? ": 99)
Example: ForceA=-[Force(N)]
Calculations appear on the Calculation Data Summary tab ( ) in Data Summary,and are selectable from any data display. ( See "How do I use my calculation?": 102)
How do I calibrate a sensor?
PASCO Capstone includes calibration wizards for many sensors.
Procedure
1. Connect the sensor to PASCO Capstone. ( See "Connecting a sensor": 27)
2. Click Calibration in the Tools Palette.
012-14016A 94
3 How do I...How do I... Sensors

Calibration button
3. Follow the instructions within Capstone.
Sensors that do not have a wizard in Capstone will not be listed.
For detailed procedures, see:
"How do I calibrate a motion sensor?": 95
"How do I calibrate a pH sensor?": 97
"How do I calibrate a drop counter?": 96
"Can multiple measurements be calibrated simultaneously?": 175
How do I calibrate a motion sensor?
1. Connect the Motion Sensor to PASCO Capstone. See "Connecting a sensor":27.
2. Place a marker at one meter from the face of the motion sensor.3. Record the distance to the marker reported by the motion sensor.
4. Click Data Summary in the Tools Palette.
012-14016A 95
3 How do I...How do I... Sensors

Data Summary button
5. Click the Sensor Data Summary tab .
6. Click on the Motion Sensor properties icon .7. Divide the value in the Speed of Sound (m/s) field by the recorded distance in
meters (from step 3).8. Enter the calculated value (from step 7) in the Speed of Sound (m/s) field.9. Click OK.
How do I calibrate a drop counter?
1. Connect the Drop Counter to PASCO Capstone. ( See "Connecting a sensor":27)
2. Measure the volume from the Drop Counter for 10 drops.3. Calculate the volume per drop (divide volume from step 2 by 10).
4. Click Data Summary in the Tools Palette.
012-14016A 96
3 How do I...How do I... Sensors

Data Summary button
5. Click the Sensor Data Summary tab .
6. Click on the Drop Counter properties icon .7. Enter the calculated value (from step 3) in the Drop Volume (mL) field.8. Click OK.
How do I calibrate a pH sensor?
Note: Simultaneous calibration is not recommended for pH, ISE, ORP, Conductivity,stainless-steel temperature sensors without insulating sleeves, or Disolved Oxygensensors because these sensors will not read correctly if the probes are placed in thesame solution simultaneously.
Equipment Required
Two aqueous pH buffer standards that bracket the pH values of interest.
Procedure
1. Connect the pH Sensor to PASCO Capstone. ( See "Connecting a sensor": 27)
2. Click Calibration in the Tools Palette.
012-14016A 97
3 How do I...How do I... Sensors

Calibration button
3. Choose the probes you would like to calibrate now: pHMeasurement4. Click Next.5. Choose the type of calibration you would like to perform: Two Standards (2
point).6. Click Next.7. Enter the first known pH buffer value in the Standard Value text box.8. Rinse and dry the pH Sensor probe.9. Place the probe in the corresponding buffer solution.10. Stir the probe until the Current Value stabilizes.11. Click the Set Current Value to Standard Value button.12. Click Next.13. Enter the second known pH buffer value in the Standard Value text box.14. Rinse and dry off the probe.15. Place the probe in the second buffer solution.16. Stir the probe until the value Current Value stabilizes.17. Click the Set Current Value to Standard Value button.18. Click Next.19. Click Finish.
Repeat the calibration procedure for other pH sensors using different probes.
012-14016A 98
3 How do I...How do I... Sensors

How do I... Calculations"How do I create a calculation? ": 99
"How do I use my calculation?": 102
"How do I select a measurement in the calculator?": 103
"How do I see the result of a calculation?": 103
"How do I reorder calculations?": 105
How do I create a calculation?
Note: Calculations appear on the Calculation Data Summary tab ( ) in Data Sum-mary, and are selectable from any data display. ( See "How do I use my cal-culation?": 102)
Tips
l Capstone supports simple to highly-complex calculations using a combination ofmath functions, measurements, user-defined data, constants, and text labels includ-ing symbols.
l Use either the keyboard or the Calculator keypad for numbers and simple oper-ators.
l Add parenthesis to explicitly define order of operation.
l Multiplication is implied with adjacent arguments. Insert the * symbol to explicitlydenote multiplication.
l Type: [ to quickly insert measurements (or click Insert Data ).
Procedure
1. Click Calculator in the Tools Palette.
012-14016A 99
3 How do I...How do I... Calculations

Calculator button
The Calculator dialog opens.2. Use a combination of measurements, text, calculator functions, and numerals to
create a calculation.
The calculation is displayed Calculations list.
Invalid or incomplete calculations are indicated with red font.
See "How do I select a measurement in the calculator?": 103
See "How do I see the result of a calculation?": 103
See "How do I reorder calculations?": 105
See "How do I use my calculation?": 102
Example Procedure: x at vt x= + +1
2
2
0
Define the following equation:
x at vt x= + + 1
2
20
Where:x = Position (calculated)a = Acceleration (measured)
012-14016A 100
3 How do I...How do I... Calculations

v = Velocity (measured)t = Time (measured)x0 = initial position (user-created constant)
1. Click Calculator in the Tools Palette.
Calculator button
The Calculator dialog opens.2. Click in a new line of Calculations.3. Create the constant x0.:
a. Type: xb. Click xₒ, select 0c. Type: =d. Type: 0
4. Click in a new line of Calculations5. Type: x=1/2(
6. Type:[ (or click Insert Data ).
A pop-up list opens.7. Select the appropriate Acceleration measurement from the drop down list.
8. Type: [ (or click Insert Data ).
012-14016A 101
3 How do I...How do I... Calculations

9. Select the Time measurement from the drop down list.10. Click x².11. Type: + (or click + )
12. Type: [ (or click Insert Data ).13. Select the appropriate Velocity measurement from the drop down list.
14. Type[ (or click Insert Data ).15. Select the Time measurement from the drop down list.16. Type: + (or click + )
17. Type: [ (or click Insert Data ).18. Select the Constants (under Equations/Constants) measurement from the drop
down list.19. Select x0.20. Click in the Units field.21. Type: m and select m/s² from the list.
22. Press Enter or Accept .
Example Calculations
Constant1=2*3
Calc1=[Acceleration(m/s²)]^2
Γ^2=sin([Angle(rad)])
Φ=integral([Force(N)],[Time(s)])
Resultant Acceleration=sqrt(([Acceleration- x(m/s²)]^2+[Accel-eration- y(m/s²)]^2+[Acceleration- z(m/s²)]^2))
How do I use my calculation?
Note: Calculations appear on the Calculation Data Summary tab ( ) in Data Sum-mary, and are selectable from any data display. ( See "How do I use my cal-culation?": 102)
1. Create a calculation. ( See "How do I create a calculation? ": 99)2. Click <Select Measurement> in any display.
012-14016A 102
3 How do I...How do I... Calculations

3. Select the calculation or constant to use under Equations/Constants.
4. Select the run to display. ( See "How do I choose one or more runs to display?":79)
How do I select a measurement in the calculator?
Method 11. Position cursor for placement of measurement.
2. Click Insert Data .
A pop-up list opens.3. Select the measurement from the list.
Method 21. Right-click anywhere within the calculation to place the measurement.
A pop-up menu opens.2. Select Insert Data from the menu.3. Select the measurement from the list.
Method 31. Position cursor for placement of measurement.2. Enter a left-bracket “[ “.
A pop-up list opens.3. Select from the measurement from the list.
How do I see the result of a calculation?
Note: Calculations appear on the Calculation Data Summary tab ( ) in Data Sum-mary, and are selectable from any data display. ( See "How do I use my cal-culation?": 102)
Constants Only
If the calculation uses constants (no measurements) such that the calculation evaluatesto a single number, then the result of the calculation is displayed in the result status line.
012-14016A 103
3 How do I...How do I... Calculations

Result status line
Constants can also be viewed in a table or other display, see below.
Includes Variables (measurements)
The results are calculated using MathML and are associated with data runs. Calculateddata can be viewed in a table or other display.
1. Create a calculation. ( See "How do I create a calculation? ": 99)2. Click <Select Measurement> in any display.3. Select the calculation or constant to use under Equations/Constants.
4. Select the run to display. ( See "How do I choose one or more runs to display?":79)
Example Calculations
Constant1=2*3
Calc1=[Acceleration(m/s²)]^2
Γ^2=sin([Angle(rad)])
Φ=integral([Force(N)],[Time(s)])
012-14016A 104
3 How do I...How do I... Calculations

Resultant Acceleration=sqrt(([Acceleration- x(m/s²)]^2+[Accel-eration- y(m/s²)]^2+[Acceleration- z(m/s²)]^2))
How do I reorder calculations?
Method 11. Click and drag the calculation that you would like to move.2. When the colored insert line is at the desired insertion point, release the mouse but-
ton.
Method 21. Click the calculation that you would like to move to select it.
2. Use the arrow keys in the Calculator window.
012-14016A 105
3 How do I...How do I... Calculations

How do I... Plots"How do I plot multiple measurements on separate plot areas with shared X-axis?": 107
"How do I zoom to a selection?": 108
"How do I pan and scale?": 110
"How do I select active data?": 111
"How do I plot multiple measurements on same plot with multiple Y-axes?": 113
"How do I plot multiple measurements on same plot with same Y-axes?": 114
"How do I apply a curve fit to a portion of the data?": 117
"How do I change curve fit parameters?": 118
"How do I adjust the weights for the weighted linear fit?": 119
"How do I lock and unlock the axes of a graph?": 121
"How do I change layer order of a display?": 123
012-14016A 106
3 How do I...How do I... Plots

How do I plot multiple measurements on separate plot areas withshared X-axis?
Attributes of multiple plot areas
The plots share the same x-axis measurement.The y-axes are independent.The plots from the different measurements do not overlap.
See "How do I plot multiple measurements on same plot with multiple Y-axes?":113
See "How do I plot multiple measurements on same plot with same Y-axes?":114
Procedure
1. Click Add new plot area to the Graph display in the toolbar.
Toolbar: Add New Plot button
2. Click <Select Measurement> on the plot and choose the measurement for the ver-tical axis.
012-14016A 107
3 How do I...How do I... Plots

3. To delete a plot area and its corresponding plots, click on the plot area andclick Remove active element, axis, or plot area .
Note: You will not be allowed to have fewer than one plot area. Use DeleteSelected Display in main toolbar to remove the display. (Scope display doesnot allow multiple plots.)
How do I zoom to a selection?
Zoom in
1. If multiple runs are visible, click on the symbol corresponding to the plot to zoom inthe legend.
Legend: selecting the active plotSymbol and color in legend matches plot symbol and color. Click legendto make active. (The active plot is shaded in legend and darkest in dis-play.)Click in the upper left corner of the legend to clear all active runs.
2. Click Data Highlighter in the toolbar.
Toolbar: Highlight Data button
A rectangle appears on the graph that is the same color as the target plot.
012-14016A 108
3 How do I...How do I... Plots

3. Click and drag anywhere within the highlighter to move it.4. Click and drag the handles to resize the highlighter rectangle to the area to zoom.
Selected data is highlighted in yellow.5. Click Scale to Fit in the toolbar.
Toolbar: Scale-to-fit button
The plot zooms to the selected section.6. Optional: Remove the highlight rectangle:
a. Click the highlight rectangleb. Press Delete to remove the rectangle
Zoom out
1. Remove the highlight rectangle:a. Click the highlight rectangleb. Press Delete to remove the rectangle
2. Click Scale to Fit in the toolbar.
Toolbar: Scale-to-fit button
The plot zooms out to include all data.
012-14016A 109
3 How do I...How do I... Plots

How do I pan and scale?
Panning and Scaling
Note: If the plot does not pan or scale: see "How do I lock and unlock the axes of agraph?": 121.
Panning Moving the origin within the display. Scale does not change.
1. Click within the plot area (except for the legend) and drag the plot in any direction.2. Release the mouse button when the origin is in the desired location.
Scaling Changing the axis scale (value between tick marks) to zoom-inor zoom-out. Origin does not change.
Click and Drag Method
1. Click on an axis to scale.2. Drag away from origin to decrease scale (zoom-in).
3. Drag toward the origin to increase scale (zoom-out).
Scroll Wheel Method
1. Move the cursor to a location on an axis to scale.2. Scroll back to decrease scale (zoom-in).3. Scroll forward to increase scale (zoom-out).
012-14016A 110
3 How do I...How do I... Plots
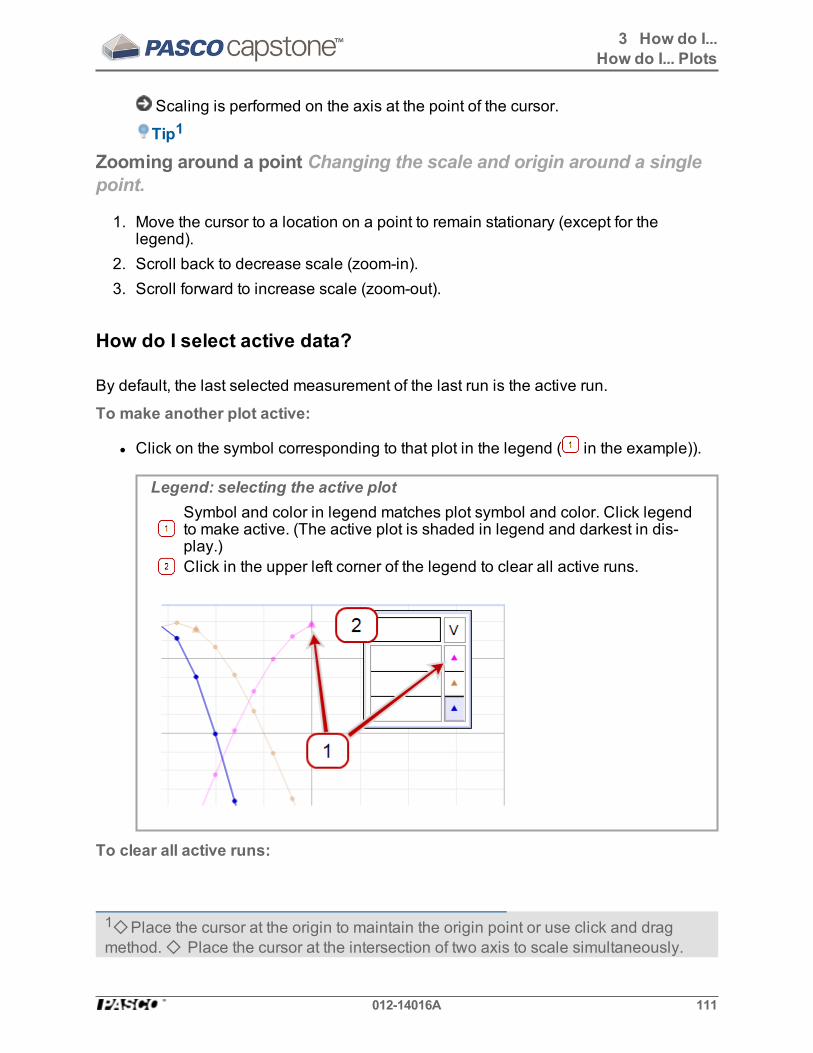
Scaling is performed on the axis at the point of the cursor.
Tip1
Zooming around a point Changing the scale and origin around a singlepoint.
1. Move the cursor to a location on a point to remain stationary (except for thelegend).
2. Scroll back to decrease scale (zoom-in).3. Scroll forward to increase scale (zoom-out).
How do I select active data?
By default, the last selected measurement of the last run is the active run.
To make another plot active:
l Click on the symbol corresponding to that plot in the legend ( in the example)).
Legend: selecting the active plotSymbol and color in legend matches plot symbol and color. Click legendto make active. (The active plot is shaded in legend and darkest in dis-play.)Click in the upper left corner of the legend to clear all active runs.
To clear all active runs:
1◇Place the cursor at the origin to maintain the origin point or use click and dragmethod.◇ Place the cursor at the intersection of two axis to scale simultaneously.
012-14016A 111
3 How do I...How do I... Plots

l Click in the upper left corner of the legend ( in the example).
Legend: selecting the active plotSymbol and color in legend matches plot symbol and color. Click legendto make active. (The active plot is shaded in legend and darkest in dis-play.)Click in the upper left corner of the legend to clear all active runs.
Toolbars (including data functions):
Toolbars are active when a single display is active, and will only apply to the act-ive display.
For displays with multiple plots, the toolbar actions apply to the active plot withinthe display.
012-14016A 112
3 How do I...How do I... Plots

How do I plot multiple measurements on same plot with multiple Y-axes?
Attributes of multiple Y-axesMeasurements scale independently( except for the rescaling required to makethe alignment of the tick mark values on each side of the graph match up).The order of the axes may be changed once multiple axes are created.Plots from different measurements use the same plot area and may overlap.
See "How do I plot multiple measurements on separate plot areas with shared X-axis?": 107
See "How do I plot multiple measurements on same plot with same Y-axes?":114
Procedure
1. Create a graph display. ( See "Adding a display ": 56)
2. Click Add new y-axis to active plot area . (Click multiple times to add multipleaxes.)
Toolbar: Add Y-axis button
3. Click <Select Measurement> and choose the measurements for each verticalaxis.
4. Optional: reorder axes:
012-14016A 113
3 How do I...How do I... Plots

a. Click Allow rearrangement of axes and plot areas in the toolbar.
Toolbar: Rearrange Y-axes and plots button
b. Drag and drop axes one at a time.
Axes can reside on the left, right, or a combination of both sides of the dis-play.
c. Click Allow rearrangement of axes and plot areas .
Exits re-arrangement mode.
Remove an axisClick on axis to remove. (Must not be in re-arrangement mode.)
Click Remove active element, axis, or plot area .
Toolbar: Remove button
Note: You will not be allowed to have fewer than one plot area. Use Delete SelectedDisplay in main toolbar to remove the display. (Scope display does not allow mul-tiple plots.)
How do I plot multiple measurements on same plot with same Y-axes?
PASCO Capstone allows one measurement on the x (independent variable) axis andmultiple measurements on the y (independent variable) axis. Y-axis labels can beplaced on either side. If the measurements share the same measurement type, then themeasurements can be plotted with a shared Y-axis.
012-14016A 114
3 How do I...How do I... Plots

Attributes of multiple measurements with a shared Y-axisMeasurements must share the same measurement type. The sharedgeneric Measurement Type name is displayed on the Y-axis.Measurements scale together.Plots from different measurements use the same plot area and may overlap.
See "How do I plot multiple measurements on separate plot areas with shared X-axis?": 107
See "How do I plot multiple measurements on same plot with multiple Y-axes?":113
Procedure
1. Create a graph display. ( See "Adding a display ": 56)2. Click <Select Measurement> and select one of the measurements to display on
the vertical Y-axis.
3. Click Data Summary in the Tools Palette.
012-14016A 115
3 How do I...How do I... Plots

Data Summary button
4. Click the Sensor Data tab .5. Click and drag another measurement of the same measurement type to the graph
display. 6. Repeat for additional sensors of same type.
The shared generic Measurement Type name is displayed on the Y-axis.
Multiple-Y-axes
012-14016A 116
3 How do I...How do I... Plots

How do I apply a curve fit to a portion of the data?
1. Select the plot to fit by clicking on its corresponding symbol in the legend.
Legend: selecting the active plotSymbol and color in legend matches plot symbol and color. Click legendto make active. (The active plot is shaded in legend and darkest in dis-play.)Click in the upper left corner of the legend to clear all active runs.
2. Click Data Highlighter in the toolbar.
Toolbar: Highlight Data button
A rectangle appears on the graph that is the same color as the target plot.3. Click and drag anywhere within the highlighter to move it.4. Click and drag the handles to resize the highlighter rectangle.
Selected data is highlighted in yellow.
5. Click the down arrow ( ) on Curve Fit .6. Select the curve fit that you wish to apply to the selected data from the pull-down
menu.
012-14016A 117
3 How do I...How do I... Plots

Note: Move the highlighter rectangle to see fits for different regions. (Capstone willnot simultaneously perform curve fits on two or more different regions of the same dataset.)
How do I change curve fit parameters?
PASCO Capstone supports modifying curve fit parameters for high-precession fits. (Ini-tial curve fits are usually automatic and accurate.)
Procedure
1. If not visible, show the Curve Fit Editor in the Toolbar. ( See "How do I show,hide, and lock the palettes?": 89)
Curve Fit Editor button
2. Select the plot to fit by clicking on its corresponding symbol in the legend.
012-14016A 118
3 How do I...How do I... Plots

Legend: selecting the active plotSymbol and color in legend matches plot symbol and color. Click legendto make active. (The active plot is shaded in legend and darkest in dis-play.)Click in the upper left corner of the legend to clear all active runs.
3. Click Curve Fit Editor in the Toolbar.4. Enter the value to modify in the Initial Guess box of the corresponding parameter.5. Click the Lock check box ( ) next to parameter.
Locks the manual entry. Capstone will not overwrite.6. Repeat for each parameter to modify.7. Click the Update Fit button.
The curve fit in the graph uses the manually entered values.
Repeat steps to iteratively improve the curve fit.
To reset to default settings and unlock parameter values, click Reset.
8. Click Curve Fit Editor in the Toolbar to close the editor.
How do I adjust the weights for the weighted linear fit?
The weights for the weighted linear fit come from the errors in the data set. To define theerror associated with each data value:
012-14016A 119
3 How do I...How do I... Plots
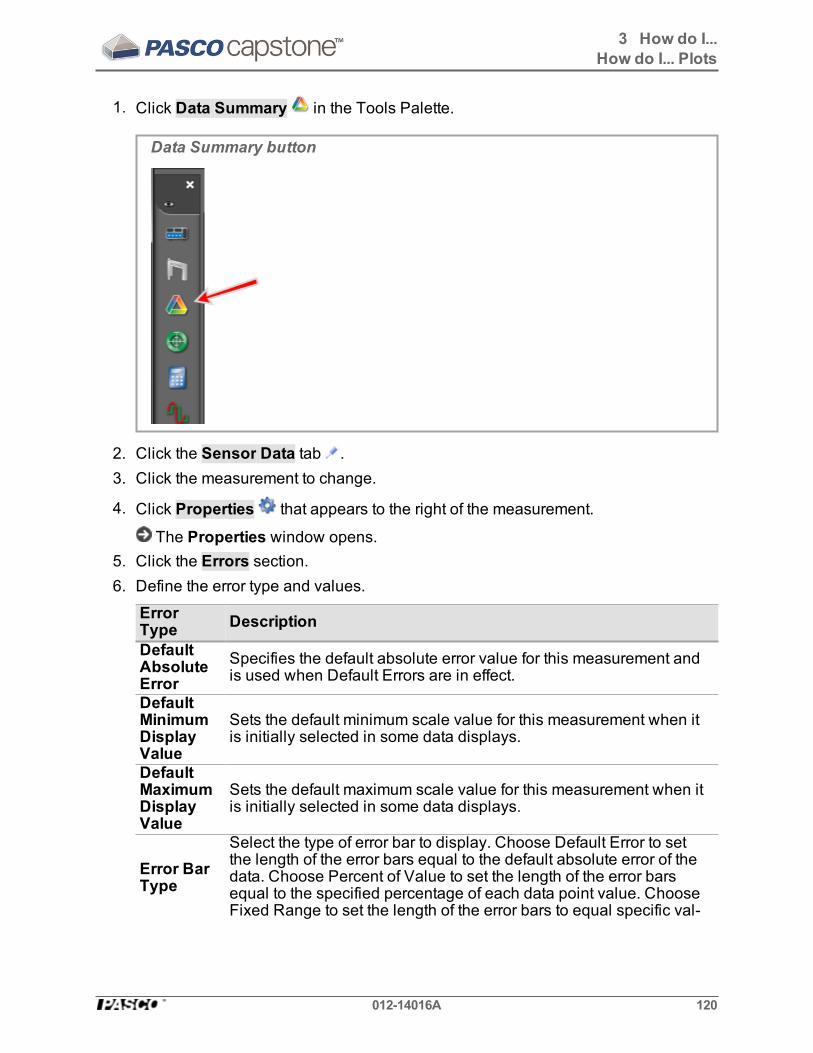
1. Click Data Summary in the Tools Palette.
Data Summary button
2. Click the Sensor Data tab .3. Click the measurement to change.
4. Click Properties that appears to the right of the measurement.
The Properties window opens.5. Click the Errors section.6. Define the error type and values.
ErrorType Description
DefaultAbsoluteError
Specifies the default absolute error value for this measurement andis used when Default Errors are in effect.
DefaultMinimumDisplayValue
Sets the default minimum scale value for this measurement when itis initially selected in some data displays.
DefaultMaximumDisplayValue
Sets the default maximum scale value for this measurement when itis initially selected in some data displays.
Error BarType
Select the type of error bar to display. Choose Default Error to setthe length of the error bars equal to the default absolute error of thedata. Choose Percent of Value to set the length of the error barsequal to the specified percentage of each data point value. ChooseFixed Range to set the length of the error bars to equal specific val-
012-14016A 120
3 How do I...How do I... Plots

ErrorType Description
ues. Choose Measurement to use a User Entered Data Set or otherMeasurement to define error values for individual data points.
Reset Resets the error settings for this measurement to defaults.
How do I lock and unlock the axes of a graph?
PASCO Capstone has several options for locking the axes of a graph from Panningand Scaling.
Panning and Scaling
Lock panning or scaling from both user and data changes
1. Deselect Scaling Method . in the Display Toolbar.
Toolbar: Scaling Method button
Capstone will not scale to the data.2. Right click on an axis and select one or both:
l Lock Axis Panningl Lock Axis Scale
012-14016A 121
3 How do I...How do I... Plots

Users cannot manually pan or scale.3. Optional: repeat for additional axes.
4. Click Show or hide tools in the Display Toolbar.
Toolbar: Visibility Menu button
5. Deselect Scale to Fit in the list.
Users cannot scale to fit.6. Click anywhere in Capstone to close Show or hide tools.
Lock scaling from data changes only
Deselect Scaling Method . in the Display Toolbar.
Toolbar: Scaling Method button
Capstone will not scale to the data.
Lock panning or scaling from user changes only
1. Right click on an axis and select one or both:l Lock Axis Panningl Lock Axis Scale
Users cannot manually pan or scale.2. Optional: repeat for additional axes.
3. Click Show or hide tools in the Display Toolbar.
Toolbar: Visibility Menu button
012-14016A 122
3 How do I...How do I... Plots

4. Deselect Scale to Fit in the list.
Users cannot scale to fit.5. Click anywhere in Capstone to close Show or hide tools.
How do I change layer order of a display?
1. Click on the display to make it active. ( See "How do I select active data?": 111)2. Right-click on the border of the display.3. Select: Send To Back or Bring To Front.
Send To Back = places display at the bottom of the stack.
Bring To Front = places display at the top of the stack.
012-14016A 123
3 How do I...How do I... Plots

How do I... Tables"How do I reorder columns in a table?": 124
"How do I use a table to build data in Keep Mode?": 124
How do I reorder columns in a table?
1. Click on an empty part of the column header.2. Drag until the blue column marker indicates the desired location for the column.3. Release the mouse button.
How do I use a table to build data in Keep Mode?
Procedure
1. Create a table for the measurement to capture. ( See "Adding a display ": 56)2. Optional: Create User-Entered Data into one column of the table.3. Click in the first cell to record data.
4. Select Keep Mode in the Controls Palette.5. Adjust the sample rates of each of the measurements so that the sensors are suf-
ficiently responsive for desired data.
Sample Rate
6. Click Preview in the Controls Palette.
Preview button
012-14016A 124
3 How do I...How do I... Tables

Capstone begins monitoring data and displays previews.
Preview toggles to Stop .
Keep Sample button is active.
7. Click Keep Sample to record the data currently monitored.
One instance of all data is recorded.
The cursor advances to the next table cell.
Keep Sample button
8. Repeatedly click Keep Sample to record data.
One instance of all data is recorded each time Keep Sample is clicked.
The cursor advances to the next table cell on each Keep Sample.
9. Optional: Replace values in a table. ( See "Replacing a current value in a table":125.)
Note: You can replace data in tables while in preview mode for the run (beforeclicking Stop ).See "How do I edit a measurement?": 87 to edit data after you click Stop .
10. Click Stop in the Controls Palette to stop observing the data.
Collected data appear in all displays of the current page.
The data run is listed in the legend for each display.
Recorded data appear on the Sensor Data Summary tab ( ) in Data Sum-mary, and is selectable from any data display with a default name Run #%1,where%1 is an automatically generated run number.
Replacing a current value in a table
1. While previewing data, click in the cell to change.
The current monitored value is displayed with the existing value.
012-14016A 125
3 How do I...How do I... Tables

Replace data in table cell
Existing value
New value
Click Keep Sample toreplace the existing valuewith the new value.
2. Click Keep Sample to replace the existing value with the new value.
The cursor advances to the next table cell.3. Perform one of the following options:
n Continue to replace values.
n Click in empty cell to record additional data.
n Click Stop in the Controls Palette to stop observing the data.
Note: You can replace data in tables while in preview mode for the run(before clicking Stop ).See "How do I edit a measurement?": 87 to edit data after you click
Stop .
012-14016A 126
3 How do I...How do I... Tables

How do I... Text Boxes"How do I enter subscripts, superscripts, Greek letters, and symbols?": 127
"How do I enter an equation into a text display?": 127
How do I enter subscripts, superscripts, Greek letters, and sym-bols?
New: enter subscripts, superscripts or symbols
1. Right-click in any area that accepts text such as: text box, text entry, name, or cal-culator fields.
2. Select one of the following:l Insert Superscriptl Insert Subscriptl Insert Upper Case Greek Letterl Insert Lower Case Greek Letterl Insert Special Character
3. Select the character to insert from the drop-down list.
Existing: subscript or superscript selected text (text and text entryboxes only)
1. Highlight existing text.2. Right-click and select one of the following:
l Superscript Selected Textl Subscript Selected Text
How do I enter an equation into a text display?
1. Create the equation using an application capable of exporting MathML as plaintext.
2. Paste into a Text Box or Text Entry Box in PASCO Capstone. ( See "Adding adisplay ": 56)
012-14016A 127
3 How do I...How do I... Text Boxes

Using Microsoft Word* (2007/2010)
1. Switch to MathML mode (if needed):a. Click Insert > Equation > Insert new equation.b. Select the arrow at the lower right of the tools part of the ribbon.
Equation options button
012-14016A 128
3 How do I...How do I... Text Boxes

c. Select Copy MathML to the clipboard as plain text
MathML to clipboard selection
d. Click OK.2. Type the equation in the programs equation editor.3. Highlight the equation.4. Press CTRL+C to copy.5. Switch to a Text Box or Text Entry Box in PASCO Capstone.6. Place the cursor and press CTRL+V to paste.
012-14016A 129
3 How do I...How do I... Text Boxes

How do I... Scope"How do I compare scope traces from the same sensor when monitoring?": 130
"How do I select the scope trigger?": 131
"How do I pre-trigger?": 134
"How do I freeze and record the scope display?": 135
How do I compare scope traces from the same sensor when mon-itoring?
1. Select one of the traces that you would like to compare with later traces by clickingon the symbol corresponding to that plot in the legend.
Legend: selecting the active plotSymbol and color in legend matches plot symbol and color. Click legendto make active. (The active plot is shaded in legend and darkest in dis-play.)Click in the upper left corner of the legend to clear all active runs.
2. Click Snapshot in the toolbar to capture the visible trace.
012-14016A 130
3 How do I...How do I... Scope

Scope Toolbar: Snapshot
3. Click Run Selection .
Multiple runs can display simultaneous when the button is depressed.
4. Click the pull-down arrow ( ) next to Run Selection in the toolbar.
Scope Toolbar: Run Selection button
5. Select the measurement trace snapshots that you would like to display.
See "How do I record data in PASCO Capstone? ": 73
How do I select the scope trigger?
Note: If the trigger button in the scope toolbar is depressed, the display of datastarts when the trigger condition is satisfied. If the trigger button is not depressed, thedisplay of data starts immediately.
The trigger in the scope applies to the rightmost measurement on the left of the scopeplot area.
I. Select Measurement for Trigger:
012-14016A 131
3 How do I...How do I... Scope
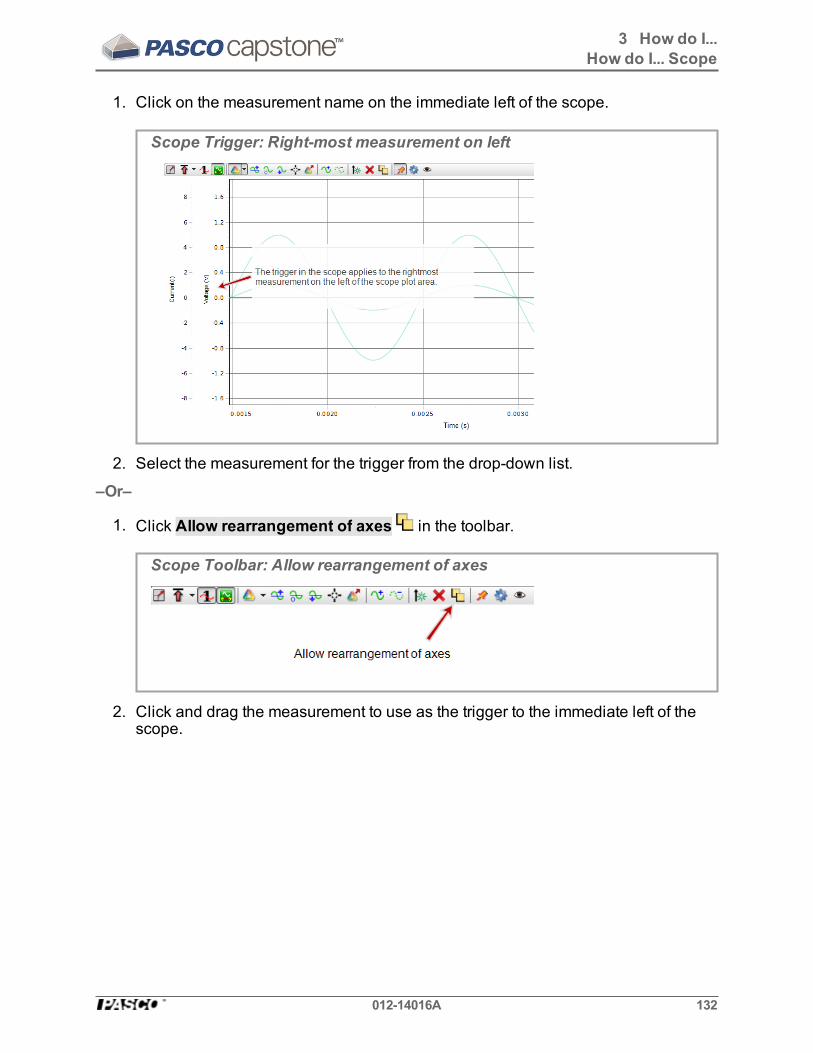
1. Click on the measurement name on the immediate left of the scope.
Scope Trigger: Right-most measurement on left
2. Select the measurement for the trigger from the drop-down list.
–Or–
1. Click Allow rearrangement of axes in the toolbar.
Scope Toolbar: Allow rearrangement of axes
2. Click and drag the measurement to use as the trigger to the immediate left of thescope.
012-14016A 132
3 How do I...How do I... Scope

Scope Trigger: Right-most measurement on left
II. Turn on Trigger:
1. Click Trigger in the toolbar.
Scope toolbar: Trigger button
2. Click the pull down menu of the trigger .3. Select:
l Positive Edgel Negative Edge
A trigger indicator is displayed on the plot.
012-14016A 133
3 How do I...How do I... Scope

Trigger Indicatorn Indicators point up for Positive Edge and down for Negative Edge trig-gers.
n Trigger indicator color matches run color.
How do I pre-trigger?
Note: An 850 Universal Interface is required to use the pre-trigger functionality.
1. Click Trigger in the toolbar.
Scope toolbar: Trigger button
2. Click the pull down menu of the trigger .3. Select:
l Positive Edgel Negative Edge
A trigger indicator is displayed on the plot.
012-14016A 134
3 How do I...How do I... Scope

Trigger Indicatorn Indicators point up for Positive Edge and down for Negative Edge trig-gers.
n Trigger indicator color matches run color.
4. Pan the scope display to the right, so that the left edge of the viewing area is at thetime before the trigger. ( See "How do I pan and scale?": 110)
How do I freeze and record the scope display?
( See "How do I record data in PASCO Capstone? ": 73 for information on Fast Mon-itor Mode.)
1. Select Fast Monitor Mode in the Controls Palette.2. Adjust the sample rates of each of the measurements so that the sensors are suf-
ficiently responsive for desired data.
Sample Rate
3. Select one or more scope or FFT displays. ( See "Adding a display ": 56)
Note: To record a single event, use the scope display and click the single-shotbutton . ( See "What does the Single Shot button do?": 178)
4. Click Monitor in the Controls Palette.
012-14016A 135
3 How do I...How do I... Scope

Monitor button
5. Click Stop in the Controls Palette to stop observing the data.
Monitor stop button
Capstone freezes the display.
6. Scale the data to fit the data to record within the displays. ( See "How do I panand scale?": 110)
7. Click Snapshot in the scope toolbar.
Scope Toolbar: Snapshot
Capstone records the data.
Notes:Only the data that is visible in the plot area is recorded as a run when Snapshot
is clicked.Recorded data appear on the sensor tab in the Data Summary tab ( ), and isselectable from any data display with a default name Monitor Run--ScopeSnapshot%1 where%1 is an automatically generated run number.
012-14016A 136
3 How do I...How do I... Scope

How do I... Video" How do I add a video source?": 137
"How do I analyze a video?": 138
"How do I manually synchronize video with data?": 140
"How do I adjust the frame rate of a recorded video?": 141
"How do I adjust the resolution of a video?": 141
"How do I make files with videos smaller?": 141
"How do I troubleshot video problems?": 142
How do I add a video source?
PASCO Capstone supports most driverless (UVC 1.1) USB video sources, whichincludes almost all newer web cameras, USB microscopes, and telescopes, and manyolder USB video sources that require drivers.
Procedure
1. Connect a driverless (UVC 1.1) USB video source, such as a web camera, micro-scope, or telescope.
2. Drag and drop a Movie Display from the Displays Palette to a workbook page.( See "Adding a display ": 56)
3. Select one of the four choices presented in the display:
Option DefinitionOpen MovieFile Use for Prerecorded QuickTime compatible videos.
CaptureImage* Use to capture a still image. (Do not use for video analysis.)
RecordExplanatoryMovie*
Use for videos that will not be synchronized to data. (The videorecords without data recording.)
RecordMovie withSyncedData*
Use for a movie that you wish to keep synchronized to sensordata that will be recorded simultaneously. (The video recordswith data recording.)
*A live video is displayed in Movie Display.
Note: While recording, sound output from the camera is muted by default in order toprevent feedback loops between the microphone and computer speakers. You may
012-14016A 137
3 How do I...How do I... Video

unmute the recorder in the Movie Display properties. There are separate volume/mut-ing controls available for playback and recording.
How do I analyze a video?
You can manually track the path of objects in any recorded or compatible pre-recordedmovie.
Tips for good results
l PASCO Capstone analyzes in two dimensions. Position the camera plane parallelto the plane of motion. (That is, point the camera perpendicular to the plane ofmotion.)
l Place the camera approximately at the center of the path of the object of interest.
l Use intense lighting (such as sunlight) to avoid motion blurring that might obscurethe image.
Procedure
1. Add a camera. ( See " How do I add a video source?": 137)
2. Add a Movie Display ( See "Adding a display ": 56)3. Select a type of Movie Display:
Option DefinitionOpen MovieFile Use for Prerecorded QuickTime compatible videos.
CaptureImage* Use to capture a still image. (Do not use for video analysis.)
RecordExplanatoryMovie*
Use for videos that will not be synchronized to data. (The videorecords without data recording.)
RecordMovie withSyncedData*
Use for a movie that you wish to keep synchronized to sensordata that will be recorded simultaneously. (The video recordswith data recording.)
*A live video is displayed in Movie Display.
If using Open Movie File, skip to step 5.4. Prepare recording.
a. Place a physical ruler (or object of known length) in the movie scene todetermine scale.
b. Ensure the plane of action is parallel to the plane of the lens of the camera.
012-14016A 138
3 How do I...How do I... Video

5. Record movie.Using Record Explanatory Movie:
a. Start Recoding: click Record in the Display toolbar.
The video records without data recording.
Toolbar: Video Record button
b. Stop Recoding: click Record in the Display toolbar.Using Record Movie with Synced Data:
a. Start Recording: click Record in the Controls Palette.
The video records with data recording.
Record button
b. Stop Recording: click Stop in the Controls Palette.
6. Click Enter video analysis mode in the Display toolbar.
Toolbar: Video Analysis button
7. Select the data run to use.8. Optional: Change the units or length of the scale.
a. While in Video Analysis mode, click toolbar properties .b. Click Enter video analysis mode.
012-14016A 139
3 How do I...How do I... Video

c. Modify as needed: Real World Length (Sets Real World Length In SpecifiedUnits).
d. Modify as needed: Data Units (Sets Length Units).9. Adjust the scale tool to match the scale of the ruler (or object of known length) in
the scene.10. Click on the object that you would like to track.
Capstone places a + at the point of click and the video will advance to the nextframe.
11. Repeat until the object has been completely tracked.
The video analysis data appear on the Video Data Summary tab ( ) inthe Data Summary, and are selectable from any data display.
12. Open a Display (such as a Table, Graph, or Histogram). ( See "Adding a display": 56)
13. Click <Select Measurement> in the display and select a video analysis meas-urement:
l x-Position
l y-Position
l x-Velocity
l y-Velocity
l x-Acceleration
l y-Acceleration
How do I manually synchronize video with data?
1. Add a Video Display. ( See " How do I add a video source?": 137)2. Open and existing video recording or record new video.
3. Add a table or graphic display with the data to use. ( See "Adding a display ":56)
The page contains two displays: video of experiment and numerical data.4. Click Playback Mode in the Controls Palette.
5. Click the Play in the Controls Palette.6. Playback the recorded data until an identifiable event occurs. (For example, the
point of collision.)
7. Click Manually synchronize movie with data in the Video toolbar.
012-14016A 140
3 How do I...How do I... Video

8. Click View/adjust current movie playback position in the Video toolbar.
A slider appears under .9. Adjust the video slider until the video frame corresponds to the time of the iden-
tifiable event from step 6.
10. Click Manually synchronize movie with data in the Video toolbar.
How do I adjust the frame rate of a recorded video?
Frequently high-speed or low-speed video files contain false frame rate metadata. Cam-era manufactures deliberately do this so that the video plays back at a easily-viewableframe rate. For PASCO Capstone to synchronize the video correctly, the video rate in thefile must be accurate.
Procedure
Change frame rate metadata of the video file, using a free video editor:
1. Download and install Avidemux.2. Right click on your video file and select Open with... .3. Select Avidemux.4. In Avidemux, select Video.5. Select Frame Rate.6. Check Use Custom Frame Rate and set the desired frame rate.7. Save the file.8. For adjusting the phase between the video and the data, see Tech Note #493.
How do I adjust the resolution of a video?
The settings for all movies are 320×240×30 fps in order to keep file sizes low. A USB 2.0camera is unlikely to drop frames at this rate. Higher resolutions or frame rates increasesthe probability of dropped frames.
If the camera supports higher resolutions, you may increase the resolution. ( See "Howdo I adjust the frame rate of a recorded video?": 141)
How do I make files with videos smaller?
PASCO Capstone saves files as uncompressed. Select a compression codec to reducethe file size of recorded videos. The available codecs vary by computer, and somecodecs may result in a movie that is not playable within PASCO Capstone.
012-14016A 141
3 How do I...How do I... Video

Procedure
1. Add a movie to the workbook. ( See " How do I add a video source?": 137)
2. Click on properties in the video toolbar.3. Click Movie Recording.4. Click the Video Compression drop-down.5. Select a video compression algorithm.
Note: The compression algorithms available depend on the operating systemand the software installed by the video camera. Different compressionalgorithms affect different properties of the video file including frame rate andframe size.
6. Click OK.7. Test: play the video in Capstone.
If the video no longer plays in Capstone, repeat steps and select a differentalgorithm.
How do I troubleshot video problems?
Dropped Frames and Automatic Synchronization
The video sensor attempts to synchronize the movie with the data. This might not work iftoo many operating system processes are running simultaneously. (Windows and MACare not a real time operating systems, and modern installations might have up to hun-dreds of processes running. The operating system can decide to let other process tohave priority, resulting in dropped frames or synchronization issues.)
To improve performance of the auto-synchronization algorithm:
l Increase the sensor sample rate within Capstone
l Terminate unused processes in the operating system
l Temporarily disable virus scanners in operating system
l Turn off the internet connection in operating system
Capture Sound Issues
Some cameras are not automatically able to assign a matching microphone. If you aremissing sound:
1. Click on properties in the video toolbar.2. Click the View/adjust current movie playback position drop-down.
012-14016A 142
3 How do I...How do I... Video

Choose a microphone. Some computers may not automatically choose the correctmicrophone. In these cases, you may select a camera and a microphone, and thenchoose "Save Defaults" to associate the camera and microphone.Click OK.
3. Test video recording and playback.If no audio, repeat steps to select a different Microphone source.
Windows Drivers
Open Device Manager:My Computer > Properties > Manage > Device Manager> Imaging Devices
If the camera does not appear in the Device Manager, try another USB port or dis-connecting and reconnecting the camera to the same USB port.
If the camera appears in the Device Manager, click on it and press the delete button,unplug and replug the device into the USB port. Install the latest device driver providedby the manufacturer if requested.
l Devices that support the UVC (USB Video Class 1.1) standard do not need tohave any special drivers installed to function in XP-SP3 or Windows Vista/7/8.Such devices appear automatically in Device Manager shortly after being con-nected.
l Older devices will need a driver installed.
l Older 16 Bit Devices (VFW devices) are not plug and play, and will appear to stillexist after they have been physically disconnected. To uninstall such devices,right click on the device in Device Manager and select “uninstall driver”
Testing in Windows
Windows Vista/Windows 7 Testing
Windows Vista/7 does not include a built-in video viewer. A simple utility that allows youto test a webcam in Windows Vista/7 can be found here:
http://www.bustatech.com/webcamviewer-a-simple-viewer-for-webcam/.
You can also use “Skype” or any other video-chat capable program to test a webcam.
Windows XP Testing
Note: SP3 (Service Pack 3) is required.
1. Close PASCO Capstone2. Open Windows Explorer.3. Look under Scanners and Cameras. 4. Click on the camera in use.
012-14016A 143
3 How do I...How do I... Video

A window opens displaying the camera output.5. Take a snapshot to test the camera.
012-14016A 144
3 How do I...How do I... Video

4 Frequently Asked Questions (FAQ) PASCO Capstone
"What is PASCO Capstone?": 147
"Where can I find help documentation and curriculum for PASCO Capstone?": 147
"What are the new features in the latest PASCO Capstone?": 148
"Can PASCO Capstone open DataStudio, SPARKlab, and GLX files?": 151
"Can Capstone files be opened on computers with different operating systems?": 151
"How does Capstone compare to other PASCO applications? ": 152
Installation and Updates
"What licenses are required?": 160
"Is an MSI available for PASCO Capstone?": 160
"Do I need to update the interfaces?": 161
"Do I need to update the sensor datasheets?": 161
Setup
"What do I need to have a complete measurement system? ": 162
"Can sensors sample at different rates?": 167
Data files
"Where is my data saved?": 165
"What is the file export format?": 165
"What is the format for text import?": 166
Data and Measurements
"Which data is recorded?": 167
"Can sensors sample at different rates?": 167
"What is Continuous Mode?": 168
"What is Fast Monitor Mode?": 169
"Is there a way to delete data points?": 170
"Which data is active?": 172
"How are the curve fit and smoothing calculations determined?": 172
012-14016A 145
4 Frequently Asked Questions (FAQ)

Calculations and Calibration
"What is the format for calculations?": 174
"What are the equations for calibration?": 174
"Can multiple measurements be calibrated simultaneously?": 175
Displays
"What is panning and scaling?": 176
"Why are the display toolbars not active?": 177
Scope
"What is the scope?": 178
"What does the Single Shot button do?": 178
"What is pre-triggering in the scope?": 179
Video and Text
"What cameras and video formats are supported?": 180
"Why does the text color remain black after picking a color?": 180
012-14016A 146
4 Frequently Asked Questions (FAQ)

FAQ... PASCO Capstone"What is PASCO Capstone?": 147
"Where can I find help documentation and curriculum for PASCO Capstone?": 147
"What are the new features in the latest PASCO Capstone?": 148
"Can PASCO Capstone open DataStudio, SPARKlab, and GLX files?": 151
"Can Capstone files be opened on computers with different operating systems?": 151
"How does Capstone compare to other PASCO applications? ": 152
What is PASCO Capstone?
PASCO Capstone is a feature-rich data acquisition, visualization, and analysis programdesigned by PASCO scientific for advanced science education. In addition, Capstonecontains the tools needed for the creation and execution of structured scientific inquiries,by allowing simple drag-and-drop integration of rich text, graphics, video, and data dis-plays on multiple page displays called workbooks.
Capstone is completely compatible with all PASCO USB Interfaces, including the 850Universal Interface, Xplorer GLX, SPARKlink, SPARKlink Air, SPARK SLS, USB Linkand older interfaces such as the ScienceWorkshop 750 or 500.
See "Tour the Interface": 1
Where can I find help documentation and curriculum for PASCOCapstone?
Where can I find Capstone documentation?
PASCO Capstone is designed to be as intuitive as possible. In addition the followingHelp is available:
012-14016A 147
4 Frequently Asked Questions (FAQ)FAQ... PASCO Capstone

l Tool Tips: hover over a button to view the associated tool tip.
Tool tips: hover over button...
l Context Help: helpful information at the bottom of dialog windows. ( See"Tour Context Help ": 14)
l Online Help: searchable instructions on working with PASCO Capstone, fre-quently asked questions, and links to instructional videos.Click Help > PASCO Capstone Help (or F1)
l Teacher Support: for specific questions that are not answered by theseresources. ( See "Teacher and Technical Support": ii)
What curriculum is available for Capstone?
A number of Capstone experiments designed for the 850 Universal Interface can bedownloaded. ( See "Downloading Capstone experiments": 61)
In addition, PASCO Capstone can open and convert many DataStudio 1.9.x and GLXfiles. ( See "How do I open DataStudio experiments and data?": 68)
What videos are available for Capstone?
A number of Capstone experiments are on the PASCO channel. ( Seehttp://www.youtube.com/user/pascoscientific)
What are the new features in the latest PASCO Capstone?
The following features are new to version 1.1:
n Localization (Input Method Editor support)
n Support for MacOS 10.6 +
n Histogram Display
012-14016A 148
4 Frequently Asked Questions (FAQ)FAQ... PASCO Capstone

o Different modes: side-by-side, overlay, stackedo Statisticso Coordinates tool
n Video Analysis
o Manual tracking of objectso Video analysis can be done on a movie recorded as “sensor” data or an openedmovie file. Can make measurements on a “Captured” image.
n Expansion Port Support
o Control the visibility of the UI 850 expansion port by clicking on the icon in upperright of Hardware Setup.
o Click on an analog port and turn it into a Voltage or Peak Amplitude input. These‘measurements’ will show up in the Data Summary under 850 Expansion Port. Forthe digital ports, the user can configure either an input or an output.
o An input produces a State measurement and can also be used as an input for aCustom Timer. An output can be manipulated using a new Digital Output tool thatappears.
n Journal
o Two new buttons on main toolbar: one to take the Snapshot and the other toshow/hide the journal.
o Snapshot options include taking a snap of entire page with palettes, the white con-tent area, or the currently selected display.
o Within the journal, one can edit the title or annotation, rearrange snapshots, viewfull-screen, export to HTML, print, delete, etc.
o The journal can also be re-sized or floated.
n Exclusions/Deletions
o Can be done either in the Table or Graph.o Exclusions remove data from statistics, curve fits, and auto-scaling behavior but arestill visible as and X on a graph or as stricken-through numbers in the Tabledisplay.
o Deleting data eliminates the data visually and removes it from any analysis.o Excluded or deleted data may be recovered at any time before the Capstone work-book is closed.
n GLX File Import
o One can either use File Open, or the GLX File Management dialog you get whenyou click the folder icon next to a picture of the Xplorer GLX in the Hardware Setupwindow to import data from the Xplorer GLX into Capstone.
012-14016A 149
4 Frequently Asked Questions (FAQ)FAQ... PASCO Capstone

n Import/Export Data
o An Import data… and Export data…options appear in the File menu, allowing theimport and export of tab-delimited text. Successfully imported text will appear in theuser-entered data tab of the Data Summary window.
n User-defined error bars
o One can now set error values for individual data points. o One can set different positive and negative error values by specifying differentmeasurements for positive and negative (defaults to assuming you want the samefor both).
o One could even use a calculation on a measurement to specify error values.
n Customization options
o Workbook page shape options, including new default best fit.o Can set default font size for workbook displays.o Application preferences, including putting your preferences in an external, sharedfile.
n Improved Print quality
n Linear fits weighted based on error bar values.
n Moving digital probes and analog sensors (via Hardware Setup)
n New Add Similar Measurement menu on graph measurement picker. The ability toadd multiple measurements to the same axis has been available for drag/drop but thiswas not very visible to the user. This new menu item makes that more visible. Forexample, add eight Force measurements to the same axis. Conserves space andassures that all measurements get scaled with the same axis. The legend becomesthe means for identifying what is what. Tries to match the generic measurement typeand unit of measurements.
n Graph smoothing slider now has a pop-up with on/off option.
n Graph Curve Fit button has on/off.
n Improved and additional formatting options for the graph coordinates tool.
n Added Peak Amplitude Sensor and Frequency Sensor to the 850 Signal Generatoroutputs. This feature is useful for LRC sweep of Peak Amplitude versus Frequency.
n Added a Peak Amplitude Sensor to analog inputs for 850, which can be used sim-ultaneously with a Voltage sensor on the same channel.
n Added a new “special” calculation, diff, which, for a single measurement, returns a setof the current value – nth previous value.
n Added support for the AirLink2 and SPARKLink Air.
012-14016A 150
4 Frequently Asked Questions (FAQ)FAQ... PASCO Capstone

n Displays can 'preview' data in when you have Start condition and Keep sampling.
n Help (English only, initially oriented toward Tasks and Goals)
Can PASCO Capstone open DataStudio, SPARKlab, and GLX files?
Can PASCO Capstone open DataStudio files?
Yes.
PASCO Capstone can open and convert most DataStudio 1.9 files to Capstone format.
See "How do I open DataStudio experiments and data?": 68
Can PASCO Capstone open SPARKlabs?
No.
PASCO Capstone cannot open SPARKlabs.
Can PASCO Capstone open saved GLX files?
Yes.
PASCO Capstone can open and convert most Xplorer GLX files to PASCO Capstoneformat.
See "How do I open DataStudio experiments and data?": 68
Can PASCO Capstone transfer files from the Xplorer GLX?
Yes.
PASCO Capstone can transfer most Xplorer GLX files for use in Capstone.
See "How do I import Xplorer GLX data?": 71
Can Capstone files be opened on computers with different oper-ating systems?
Yes.
PASCO Capstone files (.cap) that are created on either a Mac or PC can be opened onanother computer running another Capstone-compatible operating system (Mac OS, Win-dows) with the same version or later of Capstone.
012-14016A 151
4 Frequently Asked Questions (FAQ)FAQ... PASCO Capstone

How does Capstone compare to other PASCO applications?
Specification PASCO Cap-stone
DataStudio1.8.9r10 SPARKvue 2.0
Availability www.pasco.com www.pasco.com
Computer version:www.pasco.com
Pad version:Apple App Store /Google Play Store
PASCO Part NumbersUI-5400
UI-5401
CI-6870
CI-6859C
CI-6871
Computer version:PS-2400PS-2401
Pad version: N/ADevelopment Status Active Inactive Active
Supported Languages
English
español deAmérica latina(Latin American
Spanish)
简体字 (Sim-plified Chinese)
le français(French)
العربية (Arabic)
العربية (Arabic)
簡體字 (Tra-ditional Chinese)
简体字 (Sim-plified Chinese)
Dansk (Danish)
English
Suomi (Finnish)
le français(French)
Deutsch (Ger-man)
italiano (Italian)
J日本語 (Japan-ese)
Norsk (Nor-wegian)
portuguêsbrasileiro
(Brazilian Por-tugese)
Русский (Rus-sian)
español cas-
English
Dansk (Danish)
Deutsch (German)
español deAmérica latina(Latin American
Spanish)
español deMéxico (Mexican
Spanish)
español cas-tellano (Spanish)
français canadien(CanadianFrench)
le français(French)
italiano (Italian)
Nederlands(Dutch)
Norsk (Nor-wegian)
portuguêsbrasileiro
(Brazilian Por-
012-14016A 152
4 Frequently Asked Questions (FAQ)FAQ... PASCO Capstone

Specification PASCO Cap-stone
DataStudio1.8.9r10 SPARKvue 2.0
tellano (Spanish)
Svenska(Swedish)
Türk (Turkish)
tugese)
português de Por-tugal (Portugese)
Suomi (Finnish)
Svenska(Swedish)
Türk (Turkish)
Český (Czech)
Русский (Rus-sian)
Казак (Kazakh)
العربية (Arabic)
簡體字 (Tra-ditional Chinese)
简体字 (Sim-plified Chinese)
J日本語 (Japan-ese)
한국의 (Korean)
ไ ท ย (Thai)
SUPPORTED OPERATINGSYSTEMS
Windows XP 32-bit
Windows 7 32/64-bit
Windows 8 32/64-bit
MacOS 10.6-10.8
Windows XP 32-bit
Windows 7 32/64-bit (requires spe-cial installation)
MacOS 9.x, 10.7
Windows XP 32-bit
Windows 7 32/64-bit
Windows 8 32/64-bit
MacOS 10.5-10.8
Apple iOS 5.1Apple iOS 6.0
Android
INTENDED AUDIENCEPost-secondary /Advanced High-School Science
Educators
Post-secondary /Advanced High-School Science
Educators
Ele-mentary/MiddleSchool/ Intro-ductory Sec-
ondary Science
012-14016A 153
4 Frequently Asked Questions (FAQ)FAQ... PASCO Capstone

Specification PASCO Cap-stone
DataStudio1.8.9r10 SPARKvue 2.0
EducatorsSupported Hardware PASPORTPS-2100(A) USB Link YES YES YESPS-2001 PowerLink YES YES YESPS-2009 SPARKlink YES YES YESPS-2000 Xplorer ACQUIRE ONLY YES YESPS-2002 Xplorer GLX ExternalSensors YES YES ACQUIRE ONLY
PS-2002 Xplorer GLX Sound/Sound Level YES YES NO
PS-2008(A) SPARK SLS ACQUIRE ONLY YES ACQUIRE ONLYWIRELESSPS-2005 AirLink SI NO YES NOPS-2010 AirLink2 YES YES NOPS-2011 SPARKLink Air YES NO NOUniversal (PASPORT/S-cienceWorkshop)UI-5000 850 interface YES NO NOScienceWorkshopScienceWorkshop 300 NO YES NOCI-6760 ScienceWorkshop500 via CI-6759A only Serial / CI-6759A NO
CI-6560 ScienceWorkshop700 NO YES NO
CI-7500 ScienceWorkshop750 –SCSI via CI-6759A only
SCSI / Serial /
CI-6759ANO
CI-7599 ScienceWorkshop750 – USB YES YES NO
GENERIC DEVICESUSB video cameras YES NO YES
Microphones 850 or SW750+ sound sensor
Waveport + Built-in Microphone /ScienceWork-
shop 750 + soundsensor
Computer version:YES
Pad version:As part of videosensor only
THIRD-PARTY HARDWARE
Ocean Optics RedTide/Amadeus/ USB 2000 or4000 spectrometers
NO NO
Computer version:YES
Pad version:NO
012-14016A 154
4 Frequently Asked Questions (FAQ)FAQ... PASCO Capstone
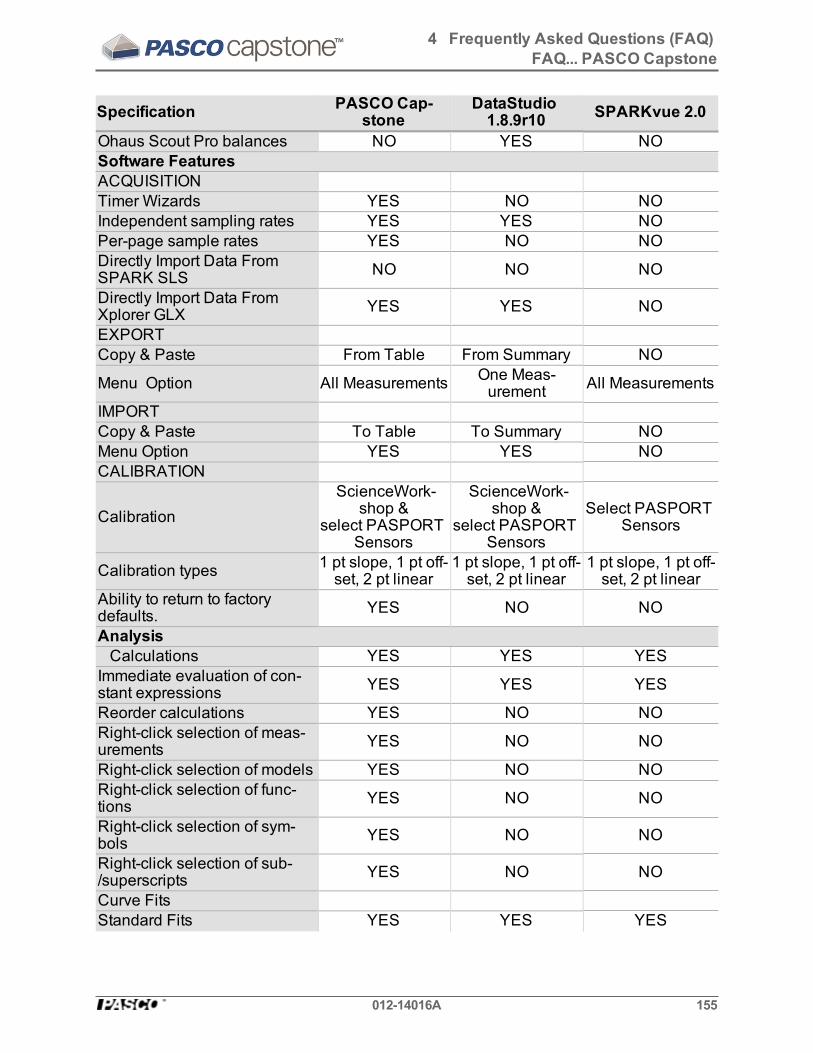
Specification PASCO Cap-stone
DataStudio1.8.9r10 SPARKvue 2.0
Ohaus Scout Pro balances NO YES NOSoftware FeaturesACQUISITIONTimer Wizards YES NO NOIndependent sampling rates YES YES NOPer-page sample rates YES NO NODirectly Import Data FromSPARK SLS NO NO NO
Directly Import Data FromXplorer GLX YES YES NO
EXPORTCopy & Paste From Table From Summary NO
Menu Option All Measurements One Meas-urement All Measurements
IMPORTCopy & Paste To Table To Summary NOMenu Option YES YES NOCALIBRATION
CalibrationScienceWork-
shop &select PASPORT
Sensors
ScienceWork-shop &
select PASPORTSensors
Select PASPORTSensors
Calibration types 1 pt slope, 1 pt off-set, 2 pt linear
1 pt slope, 1 pt off-set, 2 pt linear
1 pt slope, 1 pt off-set, 2 pt linear
Ability to return to factorydefaults. YES NO NO
AnalysisCalculations YES YES YES
Immediate evaluation of con-stant expressions YES YES YES
Reorder calculations YES NO NORight-click selection of meas-urements YES NO NO
Right-click selection of models YES NO NORight-click selection of func-tions YES NO NO
Right-click selection of sym-bols YES NO NO
Right-click selection of sub-/superscripts YES NO NO
Curve FitsStandard Fits YES YES YES
012-14016A 155
4 Frequently Asked Questions (FAQ)FAQ... PASCO Capstone

Specification PASCO Cap-stone
DataStudio1.8.9r10 SPARKvue 2.0
Error-weighted Linear Fit YES NO NOEditable Initial Guesses YES YES NOLockable Parameters YES NO NOUser-Defined Functions YES YES NOData ManipulationDelete Data YES YES NOExclude Data YES NO NODISPLAYSVirtual Oscilloscope Display YES YES NOFast Fourier Transform YES YES NOAutomatic video synching YES NO NORe-title displays. YES YES NOX-Y GRAPHQuickCalc YES NO NOSmooth in place YES NO NOZooming with the scroll wheel YES NO NOSnap to origin when panning. YES YES NOClick/Touch & drag panning YES NO YESSelect measurements fromgraph labels YES YES NO
Multiple y-axis measurements YES YES YESManage y axes YES NO NOPrediction Tool NO YES YESCopy a portion of a plot. NO YES NO
Scrolling chart option YES YES(UNSMOOTH) NO
Delete selected data points. YES YES NOExclude selected data points. YES NO NOChange unit directly in the dis-play YES NO NO
Delta ToolYES
(Coordinate ToolOption)
YES YES
Translucent data values YES NO NOPreview Data in Keep Mode YES YES YESTABLEIndex column YES NO YESSupport for Text Entry YES NO YESOut-of-order data entry YES NO YESNon-numeric data entry YES NO YESAutomatic data type switching YES NO NO
012-14016A 156
4 Frequently Asked Questions (FAQ)FAQ... PASCO Capstone

Specification PASCO Cap-stone
DataStudio1.8.9r10 SPARKvue 2.0
Cell insertion/deletion YES NO NORow insertion/deletion NO YES NODrag and Drop to ColumnReordering YES NO NO
Cut/Copy/Paste Values YES NO NORename measurement directly YES NO NO
Change unit directly YES NO (MULTIPLESTEPS)
Out-of-order Sampling YES NO NOSelection Synchronized withother Displays YES YES NO
Insert/delete columns YES NO (MULTIPLESTEPS)
Row Banding NO NO YESSCOPEUn-triggered Sampling YES YES NOTrigger YES YES NOPre-trigger 850 only NO NOContinuous Sampling YES NO NOSample Rate Control YES NO NOExport Trace YES YES NOSmart Cursor YES YES NOMultiple Measurements YES YES NOMultiple Axes YES NO NOTrace Offset Controls YES YES NOCompare Traces from thesame sensor YES NO
(Requires graph.) NO
HistogramCount & bin measurement val-ues YES YES NO
Side-by-Side Runs/Sets YES YES NOOverlay Runs/Sets YES YES NOStack Runs/Sets YES YES NOAutoscaling YES YES NO
Smart Cursor YESNO
(Does not snap tovalue.)
NO
Statistics YES NO NOBar GraphDisplay Values NO NO YESAcquire Values Automatically NO NO YES
012-14016A 157
4 Frequently Asked Questions (FAQ)FAQ... PASCO Capstone

Specification PASCO Cap-stone
DataStudio1.8.9r10 SPARKvue 2.0
Rename Bins NO NO YESFFTAutomatic resolution adjust-ment YES NO NO
WORKBOOKUniversal Undo YES NO NOData Replay YES (Movie Only) NOAutomatic hiding of tool barsoption YES NO NO
Automatic rescaling of work-book YES NO NO
Reordering workbook pages YES NO NOLive microscope/camera sup-port YES NO YES
Automatic display fitting YES NO YESRe-sizable displays YES YES NOAuto-scaling Workbooks YES NO NOSensor-Independent Meas-urement ID NO NO YES
Drag and Drop Image Files YES YES NOTEXTRich Text Tools YES NO NOSubscript/Superscript Tools YES NO YES
Symbol insertion YES NO
Computer version:NO
Pad version:YES
Copy and paste rendered cal-culations from Microsoft Word. YES NO NO
Drag and drop rendered cal-culations from calculator YES NO NO
Bulleted list support YES NO NOVideoPlay pre-recorded video YES YES NOCapture still images YES NO YESAcquire and automatically-sync YES NO NO
Automatic playback option YES NO NOManually track objects YES NO NOAutomatically generate pos-ition, velocity and accelerationdata from calibrated track
YES NO NO
012-14016A 158
4 Frequently Asked Questions (FAQ)FAQ... PASCO Capstone
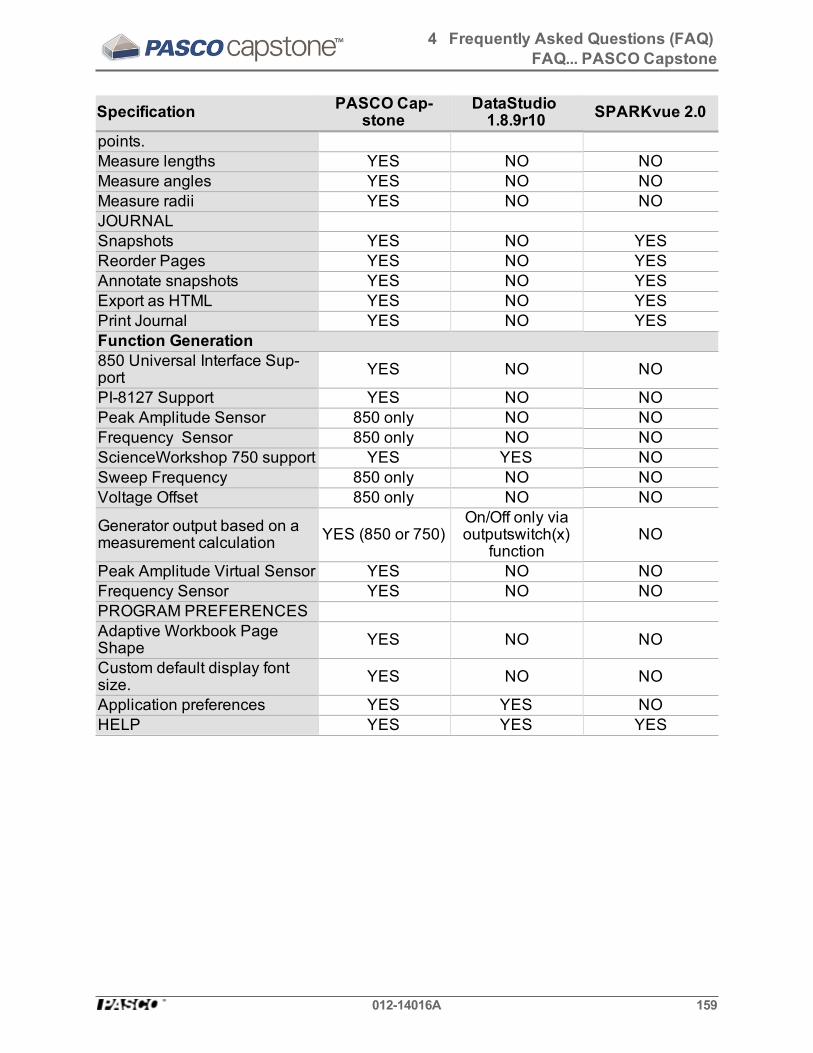
Specification PASCO Cap-stone
DataStudio1.8.9r10 SPARKvue 2.0
points.Measure lengths YES NO NOMeasure angles YES NO NOMeasure radii YES NO NOJOURNALSnapshots YES NO YESReorder Pages YES NO YESAnnotate snapshots YES NO YESExport as HTML YES NO YESPrint Journal YES NO YESFunction Generation850 Universal Interface Sup-port YES NO NO
PI-8127 Support YES NO NOPeak Amplitude Sensor 850 only NO NOFrequency Sensor 850 only NO NOScienceWorkshop 750 support YES YES NOSweep Frequency 850 only NO NOVoltage Offset 850 only NO NO
Generator output based on ameasurement calculation YES (850 or 750)
On/Off only viaoutputswitch(x)
functionNO
Peak Amplitude Virtual Sensor YES NO NOFrequency Sensor YES NO NOPROGRAM PREFERENCESAdaptive Workbook PageShape YES NO NO
Custom default display fontsize. YES NO NO
Application preferences YES YES NOHELP YES YES YES
012-14016A 159
4 Frequently Asked Questions (FAQ)FAQ... PASCO Capstone

FAQ... Installation and Updates"What licenses are required?": 160
"Is an MSI available for PASCO Capstone?": 160
"Do I need to update the interfaces?": 161
"Do I need to update the sensor datasheets?": 161
What licenses are required?
What licenses are available for PASCO Capstone?
l Capstone Single User License (UI-5401)
l Capstone Site License (UI-5400)
Does the license expire?
No.
The license does not expire and entitles you to minor updates, such as the update fromversion 1.0 to 1.1.
Are upgrades free?
Yes, minor upgrades are free.
Minor upgrades and bug fixes for the licensed version of PASCO Capstone do notrequire additional purchase. They may be obtained by downloading the latest trial ver-sion from the PASCO scientific website. If the previous version of PASCO Capstone waslicensed, the minor upgrade will accept the license key stored in your computer.
If you do not have a valid license key, the trial will expire in 60 days. A new license keymay be purchased and entered from the About PASCO Capstone menu:
1. Click Help > About PASCO Capstone2. Click Buy Key or Enter Key
Is an MSI available for PASCO Capstone?
An independent msi is not available for PASCO Capstone. The Capstone msi iswrapped by InstallShield*; parameters may be passed to the msi with command lineswitches. ( See "How do I automate a network installation?": 66) for information onpassing parameters to the msi.
012-14016A 160
4 Frequently Asked Questions (FAQ)FAQ... Installation and Updates

Do I need to update the interfaces?
PASCO Capstone will prompt to update the firmware if a new version exists. Follow theon-screen instructions.
However, you may encounter a problem with the interface requiring a manual firmwarere-installation. ( See "How do I force an update to an interface?": 66)
Do I need to update the sensor datasheets?
No.
PASCO Capstone obtains default sensor information from a file that is installed andupdated with Capstone.
(DataStudio and SPARKvue do obtain information from the sensors; however, PASCOCapstone ignores any information from the sensor other than the ID.)
012-14016A 161
4 Frequently Asked Questions (FAQ)FAQ... Installation and Updates
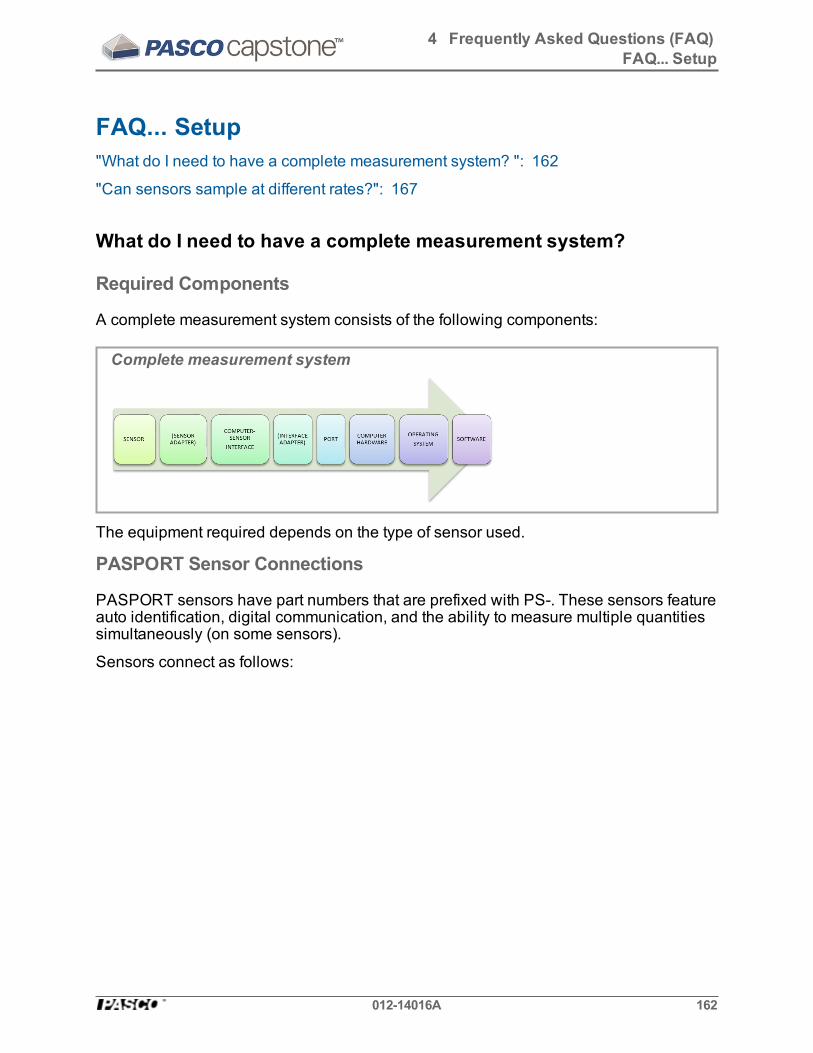
FAQ... Setup"What do I need to have a complete measurement system? ": 162
"Can sensors sample at different rates?": 167
What do I need to have a complete measurement system?
Required Components
A complete measurement system consists of the following components:
Complete measurement system
The equipment required depends on the type of sensor used.
PASPORT Sensor Connections
PASPORT sensors have part numbers that are prefixed with PS-. These sensors featureauto identification, digital communication, and the ability to measure multiple quantitiessimultaneously (on some sensors).
Sensors connect as follows:
012-14016A 162
4 Frequently Asked Questions (FAQ)FAQ... Setup

Sensor connections
ScienceWorkshop Sensor Connections
ScienceWorkshop sensors have part numbers that are prefixed with CI-.There are twoclasses of ScienceWorkshop sensors: analog and digital. The analog sensors may beidentified by their round 8-pin DIN connectors. The digital sensors are identified by their3.5 mm Tip-Ring-Sleeve (headphone) connectors.
These sensors connect as follows:
Analog sensor connections
012-14016A 163
4 Frequently Asked Questions (FAQ)FAQ... Setup

Digital sensor connections
Can sensors sample at different rates?
Yes.
PASPORT sensors may have sampling rates different from the sampling rates ofother PASPORT or ScienceWorkshop sensors.
Note: All ScienceWorkshop sensors sample at the same rate. PASPORT sensorscan sample at different rates.
012-14016A 164
4 Frequently Asked Questions (FAQ)FAQ... Setup
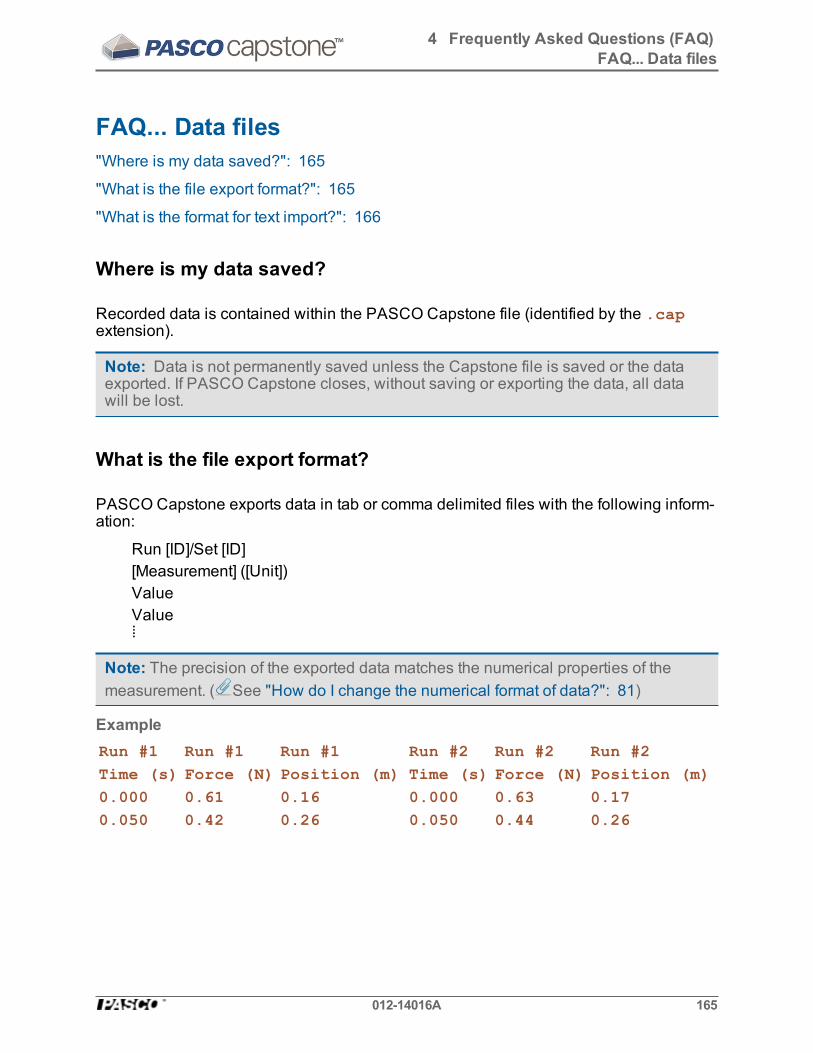
FAQ... Data files"Where is my data saved?": 165
"What is the file export format?": 165
"What is the format for text import?": 166
Where is my data saved?
Recorded data is contained within the PASCO Capstone file (identified by the .capextension).
Note: Data is not permanently saved unless the Capstone file is saved or the data exported. If PASCO Capstone closes, without saving or exporting the data, all datawill be lost.
What is the file export format?
PASCO Capstone exports data in tab or comma delimited files with the following inform-ation:
Run [ID]/Set [ID][Measurement] ([Unit])ValueValue⁞
Note: The precision of the exported data matches the numerical properties of themeasurement. ( See "How do I change the numerical format of data?": 81)
ExampleRun #1 Run #1 Run #1 Run #2 Run #2 Run #2Time (s) Force (N) Position (m) Time (s) Force (N) Position (m)0.000 0.61 0.16 0.000 0.63 0.170.050 0.42 0.26 0.050 0.44 0.26
012-14016A 165
4 Frequently Asked Questions (FAQ)FAQ... Data files

What is the format for text import?
Imported data are listed in the User-Entered Data Summary tab ( ) of DataSummary.
The recommended format for file import is tab-delimited text with the measurementnames and units on the first line:
MN1 (u1) → MN2 (u2) … → MN (un) [CR]M1V1→M2V1→…MnV1 [CR]M1V2→M2V2→…MnV2 [CR]⁞M1Vm→M2Vm→…MnVm [CR]
Where:
MNn ≡ measurement name of the nthmeasurement(un) ≡ unit of measure of the nth measurement–leave off if no unitsMnVm ≡ mth value of the nthmeasurement→ ≡ tab[CR] ≡ carriage return
Note: PASCO Capstone may not recognize data that does not exactly fit the recom-mended file import format.
Example text file:animal family speed (km/h)Peregrine Falcon Falco peregrines 389Golden Eagle Aquila chrysaetos 320Gryfalcon Falco rusicolus 208
See "How do I import data from Microsoft Excel*? ": 69
012-14016A 166
4 Frequently Asked Questions (FAQ)FAQ... Data files

FAQ... Data and Measurements"Which data is recorded?": 167
"Can sensors sample at different rates?": 167
"What is Continuous Mode?": 168
"What is Fast Monitor Mode?": 169
"Is there a way to delete data points?": 170
"Which data is active?": 172
"How are the curve fit and smoothing calculations determined?": 172
Which data is recorded?
PASCO Capstone records data for each available measurement (All data is recodedfor immediate or future use in displays, calculations, and analysis.) and associatedtime data at the defined sample rate(s).
Sample Rate
Data appear on the sensor tab in the Data Summary tab ( ), and is selectable from anydata display with a default name Run #%1, where %1 is an automatically generated runnumber.
See "How do I record data in PASCO Capstone? ": 73
Can sensors sample at different rates?
Yes.
PASPORT sensors may have sampling rates different from the sampling rates ofother PASPORT or ScienceWorkshop sensors.
Note: All ScienceWorkshop sensors sample at the same rate. PASPORT sensorscan sample at different rates.
012-14016A 167
FAQ... Data and Measurements

What is Continuous Mode?
In this mode ( See "How do I record data in PASCO Capstone? ": 73):
l Data continuously records as soon as Record is pressed in the ControlsPalette.
Record button
l Data displays at the specified sampling rate(s) either until the hardware is nolonger able to process the data (at which time data collection will stop with an errormessage) or until the Stop is pressed.
Maximum Frame Rate
The maximum frame rate1 is directly related to the processing speed of the host andinversely related to the number of samples per frame: SF.
Where:SF = Rs × TSF ≡ Samples per frameRs ≡ Sampling rate (displayed in the Controls Palette)T = time specified on the right of the plot area window
Automatic Sample Rate (Rs)
Select the auto-sample-rate-adjustment button to enable automatic sampling rate:
l The sampling rate will increase when zooming into the time axis or when increas-ing the number of samples per frame by using the increase-samples-per-trace but-ton .
l The sampling rate will decrease when zooming out of the time axis or whendecreasing the number of samples per frame by clicking the decrease-samples-per-trace button .
Manual Sample Rate (Rs)
Deselect the auto-sample-rate-adjustment button to disable automatic sampling rate:
1The rate at which these frames of data are displayed.
012-14016A 168
FAQ... Data and Measurements

l The sampling rate is set in the Controls Palette.
Sample Rate
What is Fast Monitor Mode?
In this mode ( See "How do I record data in PASCO Capstone? ": 73):
l The scope display behaves like a digital storage oscilloscope.
l Data is manually recorded using Snapshot . ( See "How do I record datain PASCO Capstone? ": 73)
Notes:Only the data that is visible in the plot area is recorded as a run when Snapshot
is clicked.Recorded data appear on the sensor tab in the Data Summary tab ( ), and isselectable from any data display with a default name Monitor Run--ScopeSnapshot%1 where%1 is an automatically generated run number.
l The scope will not drop samples within a frame due to an excessive sample rate.
l The trigger, by definition, occurs at a scope time of 0.00.
l The scope displays complete frames of data. (The maximum frame rate1, dependson the processing speed of the host computer.)
Maximum Frame Rate
The maximum frame rate2 is directly related to the processing speed of the host andinversely related to the number of samples per frame: SF.
Where:SF = Rs × TSF ≡ Samples per frameRs ≡ Sampling rate (displayed in the Controls Palette)T = time specified on the right of the plot area window
Automatic Sample Rate (Rs)
1The rate at which these frames of data are displayed.2The rate at which these frames of data are displayed.
012-14016A 169
FAQ... Data and Measurements

Select the auto-sample-rate-adjustment button to enable automatic sampling rate:
l The sampling rate will increase when zooming into the time axis or when increas-ing the number of samples per frame by using the increase-samples-per-trace but-ton .
l The sampling rate will decrease when zooming out of the time axis or whendecreasing the number of samples per frame by clicking the decrease-samples-per-trace button .
Manual Sample Rate (Rs)
Deselect the auto-sample-rate-adjustment button to disable automatic sampling rate:
l The sampling rate is set in the Controls Palette.
Sample Rate
Is there a way to delete data points?
Yes.
In PASCO Capstone version 1.1 or later, data points can be deleted or excluded.
l Neither excluded nor deleted points are included in curve fits or statistical cal-culations.
l If data points are excluded, they remain in the displays and are marked:
012-14016A 170
FAQ... Data and Measurements

l with an X in the plot
Deleted and Excluded Data in a Plot
Deleteddata areremoved.
Excludeddata displaywith "X" marks.
l with a strike-through in the table
Deleted and Excluded Data in a Table
Deleted data areremoved. Note thegap in time data.
Excluded data dis-play withstrikethrough.
l If data points are deleted, they disappear from all of the displays. Either of thesefunctions may be reversed with the undo button.
See "How do I exclude, delete, and restore selected data?": 84
012-14016A 171
FAQ... Data and Measurements

Note: Deleted data are removed from the data set and the data cannot be restored ata later time. You can immediately undo a delete action by clicking Undo .
Note: Excluded data are masked in the data set and are not used by Capstone fordata operations including display and calculations. Excluded data can be restored atany time.
Which data is active?
By default, the last selected measurement of the last data run is the active data for stat-istics and other actions.
See "How do I select active data?": 111
How are the curve fit and smoothing calculations determined?
How are the errors in the parameters of the linear curve fits calculated?
The linear model error estimations were derived assuming that there is no error in thereported measurements and tends to underestimate the actual error in the parameters.The errors are calculated as follows:
m σ∆ =N
∆
b σ∆ = Σ
x
∆
i2
Where:m ≡ slopeb ≡ interceptN ≡ number of values (xi, yi)...and...
( )σ ≡
y b mx
N
Σ − −
− 2
i i2
( )∆ N x x≡ × Σ −Σ( )i i2 2
What is the algorithm used by the graph smoothing tool?
The graph smoothing tool uses a center-weighted Savitzky–Golay smoothing algorithmof degree 4. The the value displayed in the Data Smoothing Slider n is an odd value
012-14016A 172
FAQ... Data and Measurements

representing the total number of values in the original data set that are used in determ-ining each smoothed value.
Data Smoothing Slider
Slider
n (used in the Savitzky–Golay smoothing algorithm)
Coefficient weights are used, such that the values closest to the value being smoothedusually have a greater weight, and thus a greater influence on the determining the res-ulting smoothed value. These coefficients are symmetric unless there are fewer thann − 1
2unsmoothed values to both sides of the smoothed value.
012-14016A 173
FAQ... Data and Measurements

FAQ... Calculations and Calibration"What is the format for calculations?": 174
"What are the equations for calibration?": 174
"Can multiple measurements be calibrated simultaneously?": 175
What is the format for calculations?
Calculations have the format:
(variable name) = (valid functional expression)
The variable name may contain symbols, common subscripts and superscripts, andspaces.
If you enter a functional expression without (variable name) = , Capstone adds ageneric name and "=". For example: Calc1= for variables and Constant1= for con-stants.
Calculations that involve only constants are immediately evaluated in the user-entryarea. Calculations involving measurements are rendered in MathML. ( See "How do Isee the result of a calculation?": 103)
ExamplesConstant1=2*3
Calc1=[Acceleration(m/s²)]^2
Γ^2=sin([Angle(rad)])
Φ=integral([Force(N)],[Time(s)])
Resultant Acceleration=sqrt(([Acceleration- x(m/s²)]^2+[Accel-eration- y(m/s²)]^2+[Acceleration- z(m/s²)]^2))
What are the equations for calibration?
The actual value, y(x) is calculated using measured value x and the calibration points(xi,yi), where xi is the i
thmeasured value and yi is the corresponding actual (standard)value:
012-14016A 174
FAQ... Calculations and Calibration

1 Point Offset
y x y x x( ) = ( − )1 1
Examples: used internally by the force sensors, accelerometers
1 Point Slope
y x x( ) = y
x
1
1
Examples: dissolved oxygen, type-K temperature, conductivity, drop counter
2 Point Linear
y x x( ) = +y y
x x
x y y x
x x
−
−
−
−
2 1
2 1
2 1 2 1
2 1
Examples: pH and other ion selective electrodes
Can multiple measurements be calibrated simultaneously?
Yes.
You may calibrate multiple measurements simultaneously if they are of the same typeand exposed simultaneously to the same standards when performing the calibration.
Note: Simultaneous calibration is not recommended for pH, ISE, ORP, Conductivity,stainless-steel temperature sensors without insulating sleeves, or Disolved Oxygensensors because these sensors will not read correctly if the probes are placed in thesame solution simultaneously.
See "How do I calibrate a sensor?": 94
012-14016A 175
FAQ... Calculations and Calibration

FAQ... Displays"What is panning and scaling?": 176
"Why are the display toolbars not active?": 177
What is panning and scaling?
Panning and Scaling
PASCO Capstone supports several panning and scaling methods:
l user (manual) Scaling1 and Panning2
l scaling based on maintaining the visibility or new data
l scaling and panning the data to maximize the visibility of existing data
See "How do I pan and scale?": 110.
What is Panning Moving the origin within the display. Scale does notchange.
Panning is the process of changing the value of the constant P in the Scaling and Pan-ning Equation.
1Changing the axis scale (value between tick marks) to zoom-in or zoom-out. Origindoes not change.2Moving the origin within the display. Scale does not change.
012-14016A 176
FAQ... Displays

What is Scaling Changing the axis scale (value between tick marks) tozoom-in or zoom-out. Origin does not change.
Scaling is the process of changing the value of S in the Scaling and Panning Equation. The process of increasing the value of the scaling factor S, is said to be zooming in anddecreasing the value of the scaling factor is said to be zooming out.
What is Zooming-in/out around a point Changing the scale and originaround a single point.
You can simultaneously scale and pan such that a point other that the origin (forexample: (m10, m2) remains stationary in the plot area when scaling. This process is theequivalent of scaling by S and panning by mi0× S for each coordinate.
Scaling and Panning Equation
x m m S P= ( − ) × +i i i 0
Where:xi ≡ virtual value of the i
th coordinate within the plot areami ≡ the i
thmeasurement valuemi0≡ the coordinate value of the scaling stationary pointS ≡ scaling factorP ≡ panning factor
Why are the display toolbars not active?
Toolbars are only active when a single display is active, and will only apply to the activedisplay.
For displays with multiple plots such as for Graph or FFT displays, the toolbar actionsapply to the active plot within the display.
See "How do I select active data?": 111
012-14016A 177
FAQ... Displays

FAQ... Scope"What is the scope?": 178
"What does the Single Shot button do?": 178
"What is pre-triggering in the scope?": 179
What is the scope?
The scope is designed to view high-frequency oscillating data or single high-speedevents that the graph display may not be able to capture.
Maximum Sampling Rate: The maximum supported sampling rate is a function of thecomputer-sensor interface that is connected to the computer (for example: 850 UniversalInterface → 10 MHz, ScienceWorkshop 750 → 250 kHz).
Features See Continuous Mode and Fast MonitorMode
"What is Continuous Mode?": 168"What is Fast Monitor Mode?": 169
Single shot "What does the Single Shot button do?": 178Multiple triggers "How do I select the scope trigger?": 131Pre-trigger "How do I pre-trigger?": 134
Image freeze "How do I freeze and record the scope dis-play?": 135
What does the Single Shot button do?
The Single Shot button is useful for fast, non-repetitive events, such as measuring thetime between an impulsive sound and its echo to determine the speed of sound.
When the Single Shot button is depressed on the scope toolbar and Monitor ispressed on the Controls Palette, the scope displays one frame of scope data and thenstops monitoring.
Scope toolbar: Single Shot button
012-14016A 178
FAQ... Scope

Monitor button
Note: If the trigger button in the scope toolbar is depressed, the display of datastarts when the trigger condition is satisfied. If the trigger button is not depressed, thedisplay of data starts immediately.
Note: Fast Monitor Mode is required for the Single Shot function.
Note: Single Shot is limited by the hardware buffer size of the interface (~ 2000samples for the 750 interface and ~ 16000 sample for the 850 interface).
What is pre-triggering in the scope?
The 0.00 second measurement on the scope is referenced to the time of the scope trig-gering event. Recording and displaying data that happened before a triggering event iscalled pre-triggering.
Note: An 850 Universal Interface is required to use the pre-trigger functionality.
See "How do I pre-trigger?": 134
012-14016A 179
FAQ... Scope

FAQ... Video and Text"What cameras and video formats are supported?": 180
"Why does the text color remain black after picking a color?": 180
What cameras and video formats are supported?
Supported cameras
l PASCO Capstone supports the UVC (USB Video Class 1.1) standard. Camerasthat support UVC do not require additional drivers.
l UVC 1.1 cameras are recommended; however, some older cameras may workwith Capstone with the drivers developed by the manufacturer.
See "How do I troubleshot video problems?": 142
Supported video formats
l PASCO Capstone will record and playback video recorded in Capstone withoutany supporting software.
l Capstone requires the latest version of the Apple QuickTime* player to playbackmovies that were not recorded in Capstone. Once QuickTime isinstalled, Capstone can playback all movies with the mov file extensions and mostmovies with the mp4 or avi extensions.
Why does the text color remain black after picking a color?
PASCO Capstone uses the Hue-Saturation-Value (HSV) model to determine the color. The default value of the color value (brightness) defaults to 0 and the color displaysblack.
To display the selected color: move the brightness slider for the desired brightness.
012-14016A 180
FAQ... Video and Text