Embed Size (px)
Citation preview
Capital Market Story
November 2013
Cleaner & better energy
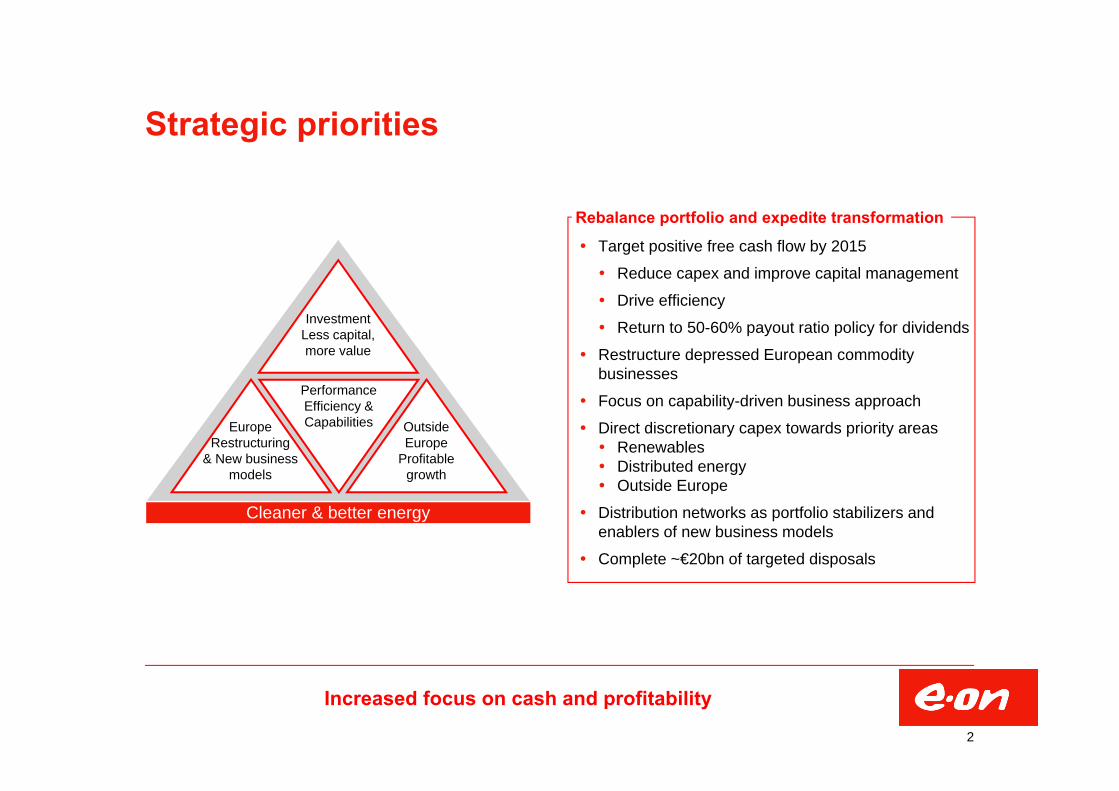
Strategic priorities
Target positive free cash flow by 2015
Reduce capex and improve capital management
Drive efficiency
Return to 50-60% payout ratio policy for dividends
Restructure depressed European commodity businesses
Focus on capability-driven business approach
Direct discretionary capex towards priority areas Renewables Distributed energy Outside Europe
Distribution networks as portfolio stabilizers and enablers of new business models
Complete ~€20bn of targeted disposals
Rebalance portfolio and expedite transformation
Increased focus on cash and profitability
2
EuropeRestructuring
& New business models
OutsideEurope
Profitable growth
PerformanceEfficiency & Capabilities
Cleaner & better energy
InvestmentLess capital, more value
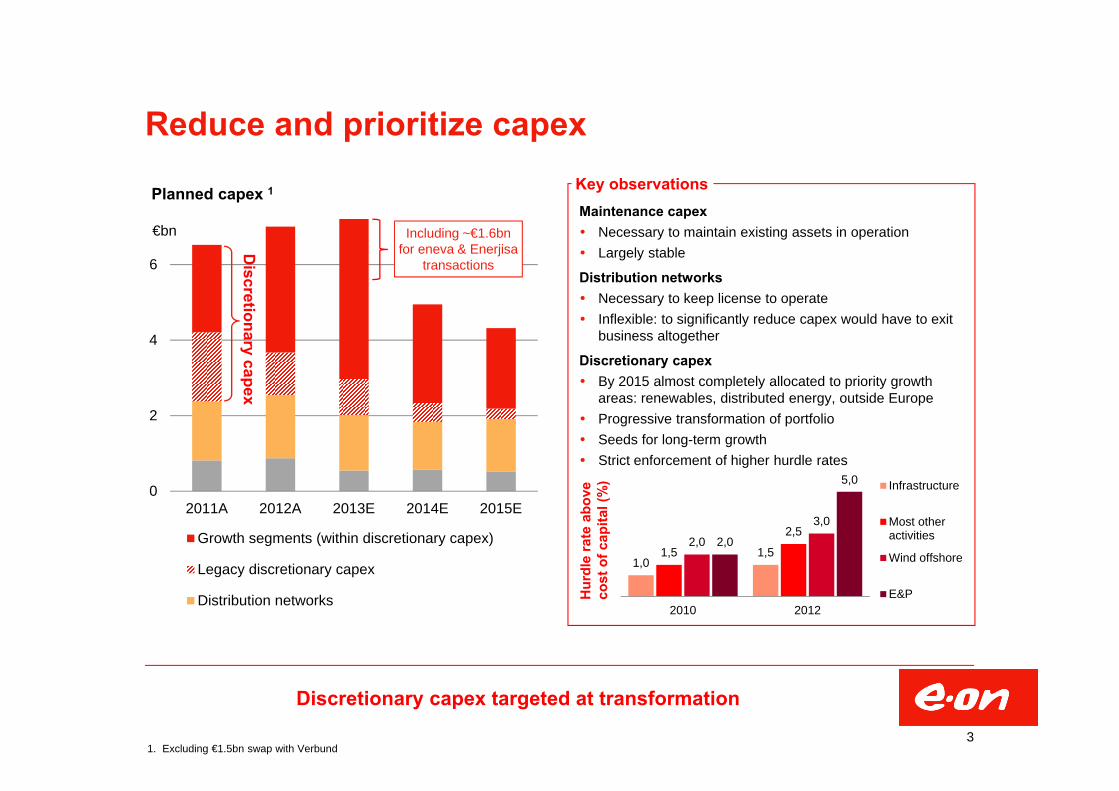
Reduce and prioritize capex
Discretionary capex targeted at transformation
3
Maintenance capex Necessary to maintain existing assets in operation Largely stable
Distribution networks Necessary to keep license to operate Inflexible: to significantly reduce capex would have to exit
business altogether
Discretionary capex By 2015 almost completely allocated to priority growth
areas: renewables, distributed energy, outside Europe Progressive transformation of portfolio Seeds for long-term growth Strict enforcement of higher hurdle rates
Key observations
0
2
4
6
2011A 2012A 2013E 2014E 2015E
€bn
Growth segments (within discretionary capex)
Legacy discretionary capex
Distribution networks
Discretionary capex
Planned capex 1
1,01,51,5
2,52,0
3,0
2,0
5,0
2010 2012
Infrastructure
Most otheractivities
Wind offshore
E&PHur
dle
rate
abo
ve
cost
of c
apita
l (%
)
Including ~€1.6bnfor eneva & Enerjisa
transactions
1. Excluding €1.5bn swap with Verbund
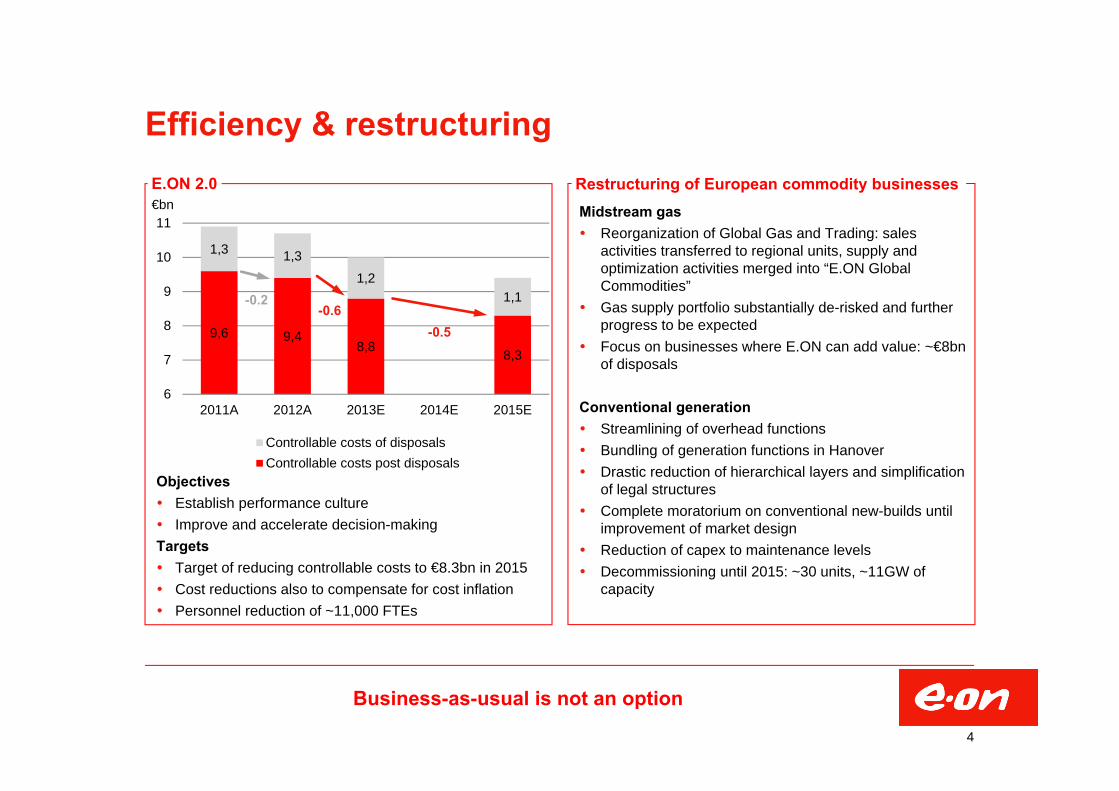
Objectives Establish performance culture Improve and accelerate decision-makingTargets Target of reducing controllable costs to €8.3bn in 2015 Cost reductions also to compensate for cost inflation Personnel reduction of ~11,000 FTEs
9,6 9,48,8 8,3
1,3 1,3
1,21,1
6
7
8
9
10
11
2011A 2012A 2013E 2014E 2015E
€bn
Controllable costs of disposalsControllable costs post disposals
Efficiency & restructuring
Midstream gas Reorganization of Global Gas and Trading: sales
activities transferred to regional units, supply and optimization activities merged into “E.ON Global Commodities”
Gas supply portfolio substantially de-risked and further progress to be expected
Focus on businesses where E.ON can add value: ~€8bn of disposals
Conventional generation Streamlining of overhead functions Bundling of generation functions in Hanover Drastic reduction of hierarchical layers and simplification
of legal structures Complete moratorium on conventional new-builds until
improvement of market design Reduction of capex to maintenance levels Decommissioning until 2015: ~30 units, ~11GW of
capacity
Business-as-usual is not an option
-0.2-0.6
-0.5
4
Restructuring of European commodity businessesE.ON 2.0

Monetize important pipeline and unique skills
Renewables Project pipeline (GW)*
3.6
50%
8.7
85%Construction
2.3
Total
21.5
Europe63%
NorthAmerica37%
Origination
6.6
25%
0.3
Speed up capital rotation Free up capital to further develop pipeline
Sell stakes of selected assets post commissioning
Offer continued, world-class O&M services
Aim to recycle at least €300m p.a.
Important unique selling points Expertise in development and construction
Wind fleet approach and O&M strategy
Unique offshore experience with pioneering advantage
Further opportunities in E.ON group context Biomass conversion
Leverage know how for outside Europe markets
Leverage pipeline and competencies
5
Development
* Project pipeline in GW as of 30th September 2012
Total attributable capacity by technology (GW)

Distributed energy
Well-established track record in distributed energy
6
0,4 0,4 0,4
0,2 0,2 0,2
0,0
0,1
0,2
0,3
0,4
2010 2011 2012
EBITDA
EBIT
Focus of activities on district heating and industrial CHP Most important regions Sweden, Germany, UK, and NL Sweden: 2nd biggest market player in integrated heat
business (13% market share) with ~50 district heating networks
Germany: ~4,000 distributed energy assets with installed capacity of 5,100MW heat and 1,200MW power
Sizeable mainly long-term contracted business Trustful relationships with numerous European
municipalities
0,3 0,3
0,45 0,45 0,45
0,0
0,1
0,2
0,3
0,4
0,5
2011 2012 2013 2014 2015
Higher capex level from 2013 onwards
Strong investment focus on Germany to seize opportunities from the energy system transformation Special emphasis on mini-midi CHP (10kW – 10MW)
and contracting business with industrial CHP (>10MW)
Additional priority area: Sweden Development opportunity in attractive Stockholm area
with growing heat demand
UK: growth in low carbon heat networks for municipalities Develop project pipeline of up to 20 projects
E.ON Connecting Energies: partnership with Metro
Distributed energy EBIT(DA) 2010-2012 (€bn) Distributed energy capex plan (€bn)
Step-up of ~50%
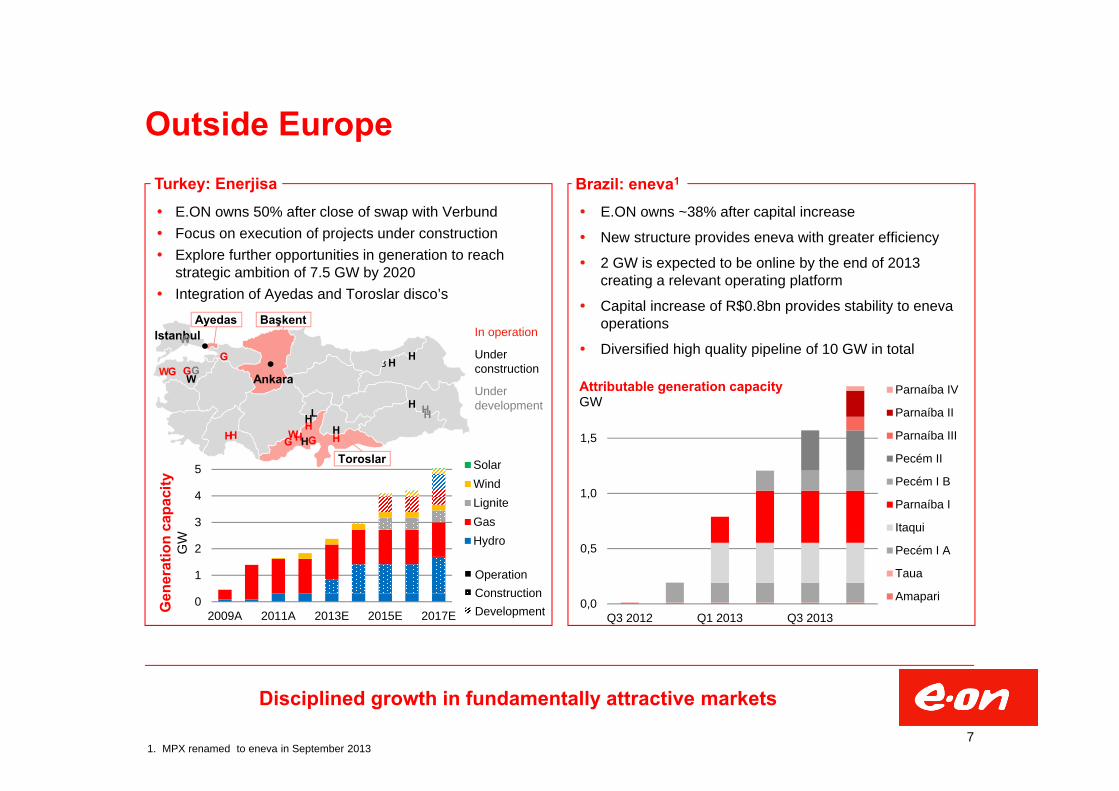
E.ON owns 50% after close of swap with Verbund Focus on execution of projects under construction Explore further opportunities in generation to reach
strategic ambition of 7.5 GW by 2020 Integration of Ayedas and Toroslar disco’s
E.ON owns ~38% after capital increase
New structure provides eneva with greater efficiency
2 GW is expected to be online by the end of 2013 creating a relevant operating platform
Capital increase of R$0.8bn provides stability to enevaoperations
Diversified high quality pipeline of 10 GW in total
Outside EuropeTurkey: Enerjisa Brazil: eneva1
Disciplined growth in fundamentally attractive markets
2.3Ankara
IstanbulH
HHHH
H
H
HH
H H
H
H
GG
GGG
G
W
W
W
W
L
7
In operation
Under construction
Underdevelopment
Gen
erat
ion
capa
city
GW
BaşkentAyedas
Toroslar
0
1
2
3
4
5
2009A 2011A 2013E 2015E 2017E
SolarWindLigniteGasHydro
OperationConstructionDevelopment 0,0
0,5
1,0
1,5
Q3 2012 Q1 2013 Q3 2013
Attributable generation capacityGW
Parnaíba IV
Parnaíba II
Parnaíba III
Pecém II
Pecém I B
Parnaíba I
Itaqui
Pecém I A
Taua
Amapari
1. MPX renamed to eneva in September 2013

2.9 2.8 3.0
0
1
2
3
2010 2011 2012
Distribution contributes roughly 30% of E.ON‘s total group EBITDA
Adjusted for disposals, the EBITDA contribution of the segment has been very robust amid turbulent times
Due to its regulated nature, distribution is only temporarily exposed to volume risks resulting from the weak general economy
No commodity price exposure
Exposed to regulatory risk (notably Hungary and Spain), but broad geographical footprint (7 countries with different regulatory regimes) provides certain hedge for regulatory reviews next regulatory milestone: German power distribution in 2014
Additional distribution activities in Turkey via Enerjisa
E.ON‘s business backbone
Robust earnings base and potential enabler for new business models
8
Excluding contribution of Central Networks, E.ON Rete (both sold in 2011), and E.ON Bulgaria (sold in 2012)
In general, RABs between different regulatory regimes are not directly comparable due to significant methodical differences
In Sweden for example, RAB is based on replacement value of all physically existing assets irrespective of the actual age of the assets
2011/2012 Regulated asset base1 (€bn)
Distribution networks €b
nPro forma EBITDA
Germany ~13Sweden ~8.8Spain N.A.2
Hungary ~1.5Czech Republic ~1.3
Romania ~0.7Slovakia ~0.63
1. 2012 for Sweden and Slovakia. Exchange rates as of 25 Jan 20132. System based on indexed regulatory revenue allowance.3. RAB for 100% of ZSE (E.ON-share 49%)
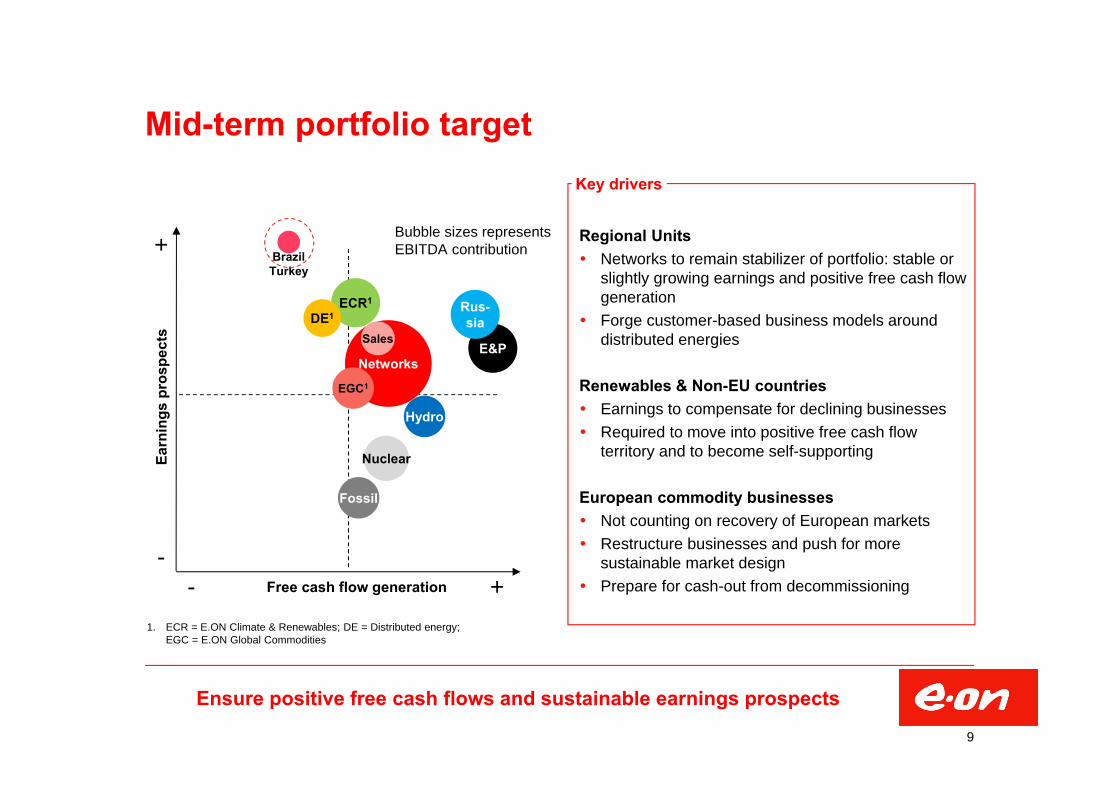
Mid-term portfolio target
Regional Units Networks to remain stabilizer of portfolio: stable or
slightly growing earnings and positive free cash flow generation
Forge customer-based business models around distributed energies
Renewables & Non-EU countries Earnings to compensate for declining businesses Required to move into positive free cash flow
territory and to become self-supporting
European commodity businesses Not counting on recovery of European markets Restructure businesses and push for more
sustainable market design Prepare for cash-out from decommissioning
Key drivers
Ensure positive free cash flows and sustainable earnings prospects
9
Free cash flow generation
Earn
ings
pro
spec
ts
+--
+
NetworksE&P
Fossil
Rus-sia
ECR1
Sales
Hydro
Nuclear
EGC1
DE1
BrazilTurkey
Bubble sizes representsEBITDA contribution
1. ECR = E.ON Climate & Renewables; DE = Distributed energy;EGC = E.ON Global Commodities
0
1
2
3
4
2010 2011 2012 … Target
Debt factor
Financial policy
Sustainable remuneration for shareholders, gradual deleveraging
10
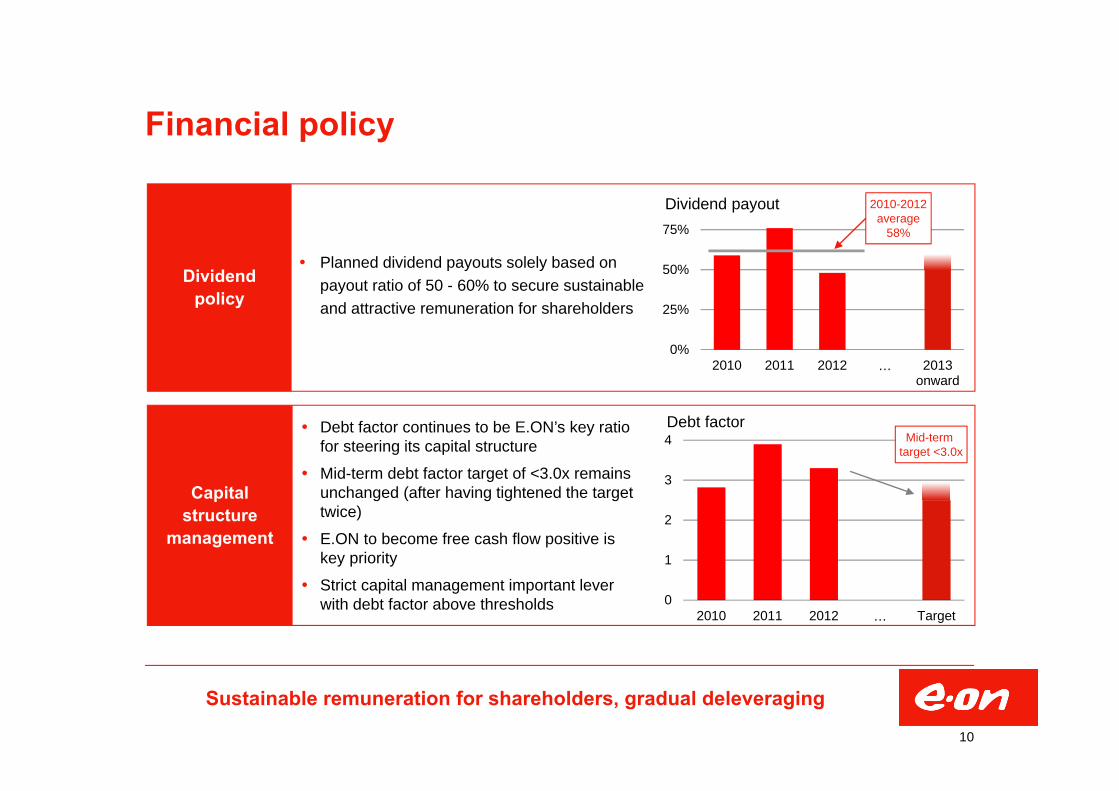
Debt factor continues to be E.ON’s key ratio for steering its capital structure
Mid-term debt factor target of <3.0x remains unchanged (after having tightened the target twice)
E.ON to become free cash flow positive is key priority
Strict capital management important lever with debt factor above thresholds
Capital structure
management
Mid-term target <3.0x
Dividend policy
Planned dividend payouts solely based on payout ratio of 50 - 60% to secure sustainable and attractive remuneration for shareholders
0%
25%
50%
75%
2010 2011 2012 … 2013onward
Dividend payout 2010-2012average
58%

Conclusion
Continuing E.ON’s transformation to face the industry’s game changers
11
Business profile
Financialprofile
E.ON has continuously delivered on its strategy via A highly successful portfolio streamlining
Substantially improving efficiency
Successful expansion in profitable growth areas
Using less capital and creating more value
E.ON will continue its transformation by Restructuring its businesses in depressed European markets
Pursuing selected growth in renewables, distributed energy and outside Europe
Benefiting from networks as a key stabilizer
Investor interest remains a key part of E.ON’s financial policy given Portfolio optimization and debt reduction (well advanced)
Strict capex discipline
Target to become free cashflow positive by 2015 at latest
12
Backup Financials Outlook FY 2012 and H1 2013 financials
Overall trends Key segment topics Generation Renewables Exploration & Production Global Commodities Germany Other EU Countries Non-EU Countries
IR team and calendar
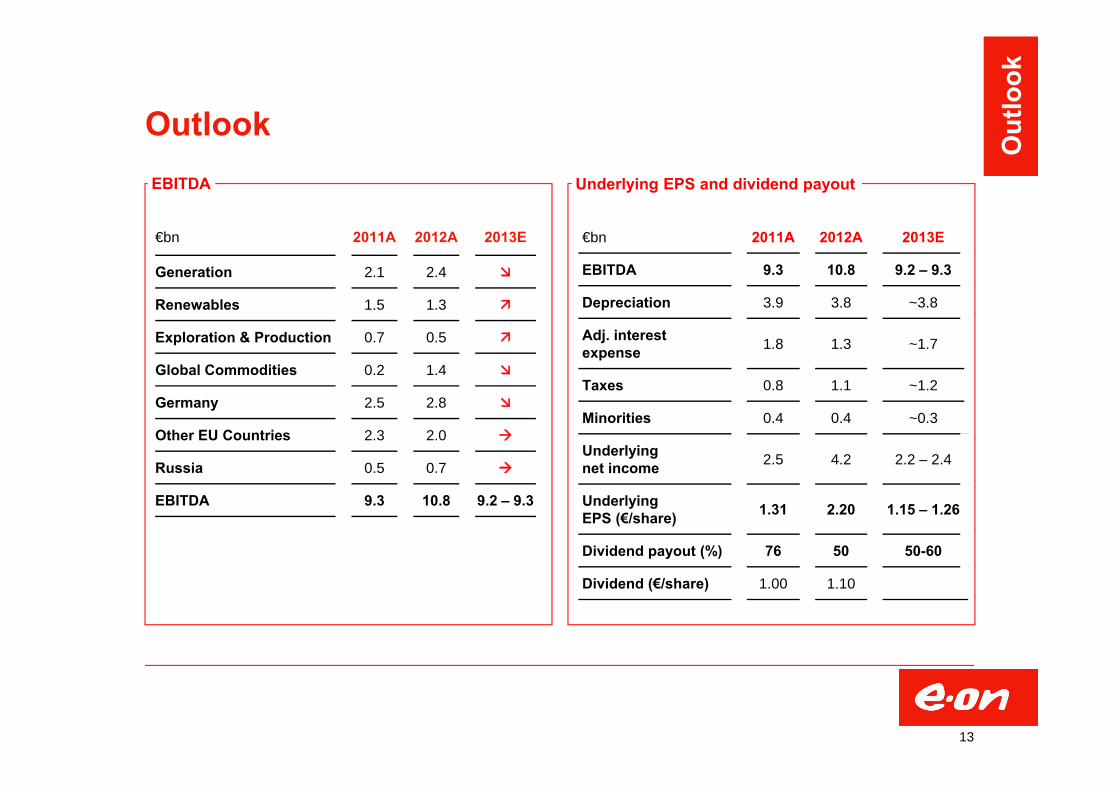
Outlook EBITDA Underlying EPS and dividend payout
13
€bn 2011A 2012A 2013E
Generation 2.1 2.4
Renewables 1.5 1.3
Exploration & Production 0.7 0.5
Global Commodities 0.2 1.4
Germany 2.5 2.8
Other EU Countries 2.3 2.0
Russia 0.5 0.7
EBITDA 9.3 10.8 9.2 – 9.3
€bn 2011A 2012A 2013E
EBITDA 9.3 10.8 9.2 – 9.3
Depreciation 3.9 3.8 ~3.8
Adj. interest expense 1.8 1.3 ~1.7
Taxes 0.8 1.1 ~1.2
Minorities 0.4 0.4 ~0.3
Underlyingnet income 2.5 4.2 2.2 – 2.4
UnderlyingEPS (€/share) 1.31 2.20 1.15 – 1.26
Dividend payout (%) 76 50 50-60
Dividend (€/share) 1.00 1.10
Out
look
26%
3%5%
30%
26%
10% GenerationRenewablesGlobal CommoditiesGermanyOther EU countriesOther
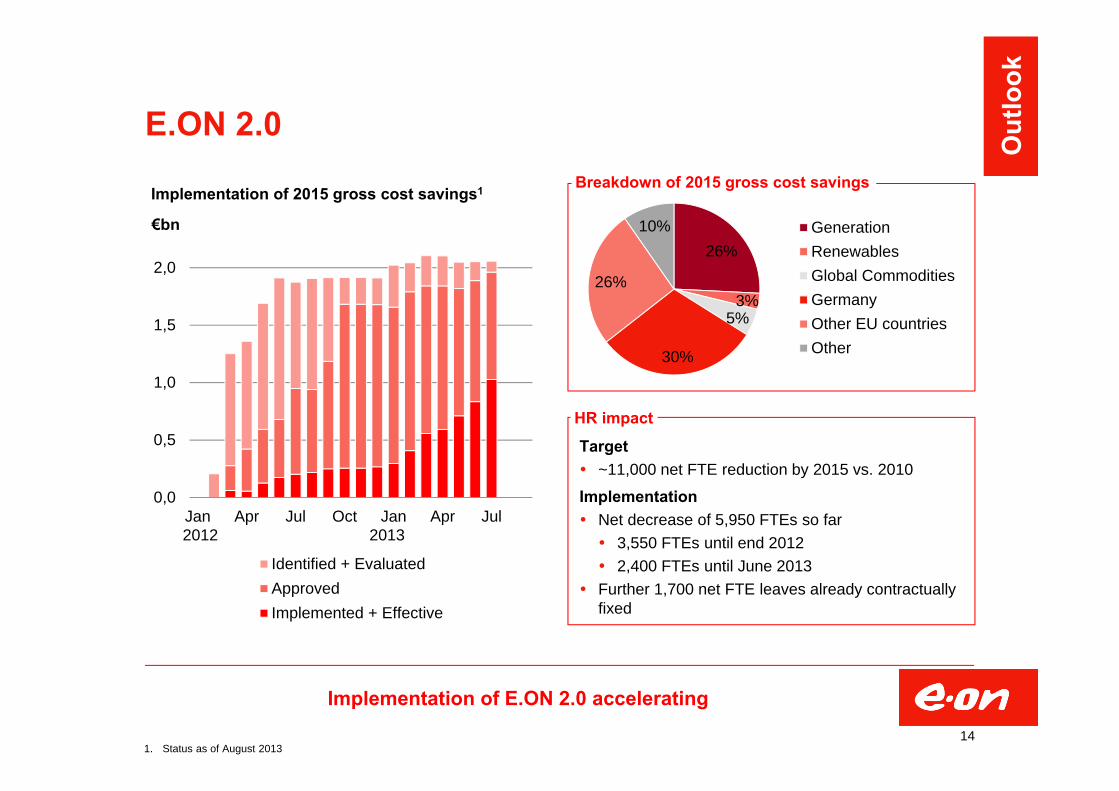
E.ON 2.0
Target ~11,000 net FTE reduction by 2015 vs. 2010
Implementation Net decrease of 5,950 FTEs so far 3,550 FTEs until end 2012 2,400 FTEs until June 2013
Further 1,700 net FTE leaves already contractually fixed
Implementation of 2015 gross cost savings1
HR impact
Breakdown of 2015 gross cost savings
Implementation of E.ON 2.0 accelerating
0,0
0,5
1,0
1,5
2,0
Jan Apr Jul Oct Jan Apr Jul
€bn
Identified + EvaluatedApprovedImplemented + Effective
2012 2013
14
Out
look
1. Status as of August 2013
0,0
0,3
0,6
0,9
1,2
Deals closed + signedin 2012
Deals closed in 9M2013
Deals planned to closein Q4 2013 or 2014
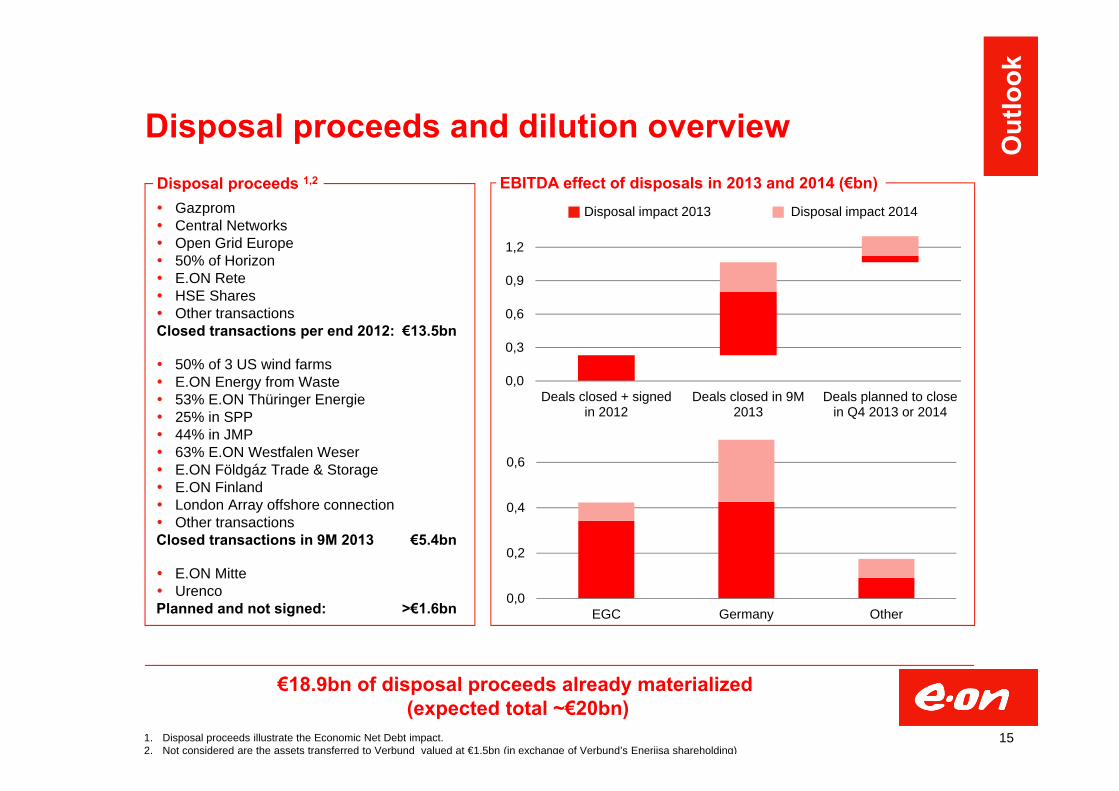
Disposal proceeds and dilution overview
Gazprom Central Networks Open Grid Europe 50% of Horizon E.ON Rete HSE Shares Other transactionsClosed transactions per end 2012: €13.5bn
50% of 3 US wind farms E.ON Energy from Waste 53% E.ON Thüringer Energie 25% in SPP 44% in JMP 63% E.ON Westfalen Weser E.ON Földgáz Trade & Storage E.ON Finland London Array offshore connection Other transactionsClosed transactions in 9M 2013 €5.4bn
E.ON Mitte UrencoPlanned and not signed: >€1.6bn
€18.9bn of disposal proceeds already materialized (expected total ~€20bn)
Disposal proceeds 1,2 EBITDA effect of disposals in 2013 and 2014 (€bn)
1. Disposal proceeds illustrate the Economic Net Debt impact.2. Not considered are the assets transferred to Verbund valued at €1.5bn (in exchange of Verbund’s Enerjisa shareholding)
15
0,0
0,2
0,4
0,6
EGC Germany Other
Disposal impact 2013 Disposal impact 2014
Out
look

Structural impacts on segmental EBITDA
Disposals of three regional utility companies and E.ON Energy from Waste major driver
Absence of positive one-off effects in 2012 Significant impact from regulatory review in German
power distribution expected
Larger effect from absence of significant positive one-offs in year 2012
Disposals also with substantial negative impact Value of flexibility under increasing pressure
Region Germany – Main EBITDA drivers (€bn) Global Commodities – Main EBITDA drivers (€bn)
Main drivers indicate substantial post disposal EBITDA reduction for segments Germany and Global Commodities
2012
one
-offs
Dis
posa
ls
2.7
-0.4
-0.7
-0.2
Rev
alua
tions
Gaz
prom
Dis
posa
ls
FY 2
012
1.4
-0.2
-0.4
-0.7
Reg
ulat
atio
nG
erm
any
FY 2
012
adju
sted
1
1. Adjusted for transfer of RMD hydro assets to Renewables (Hydro)16
Out
look
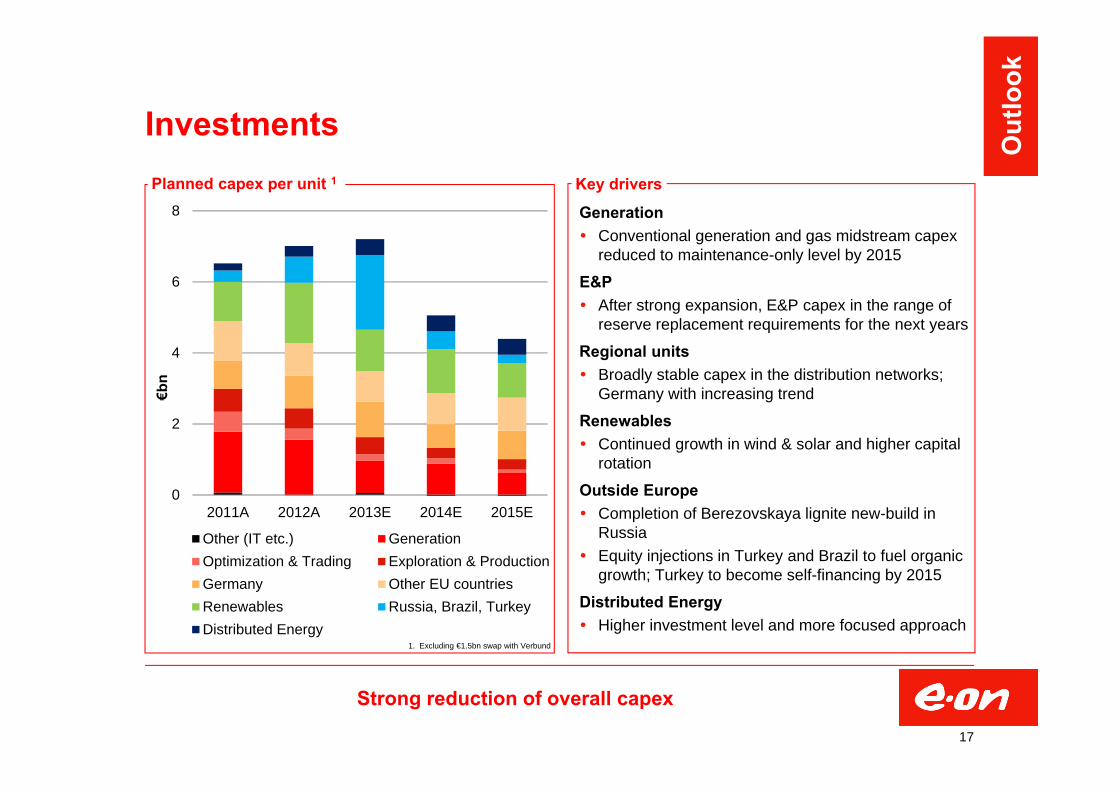
Investments
Strong reduction of overall capex
17
Generation Conventional generation and gas midstream capex
reduced to maintenance-only level by 2015
E&P After strong expansion, E&P capex in the range of
reserve replacement requirements for the next years
Regional units Broadly stable capex in the distribution networks;
Germany with increasing trend
Renewables Continued growth in wind & solar and higher capital
rotation
Outside Europe Completion of Berezovskaya lignite new-build in
Russia Equity injections in Turkey and Brazil to fuel organic
growth; Turkey to become self-financing by 2015
Distributed Energy Higher investment level and more focused approach
0
2
4
6
8
2011A 2012A 2013E 2014E 2015E
€bn
Other (IT etc.) GenerationOptimization & Trading Exploration & ProductionGermany Other EU countriesRenewables Russia, Brazil, TurkeyDistributed Energy
Planned capex per unit 1 Key drivers
Out
look
1. Excluding €1.5bn swap with Verbund
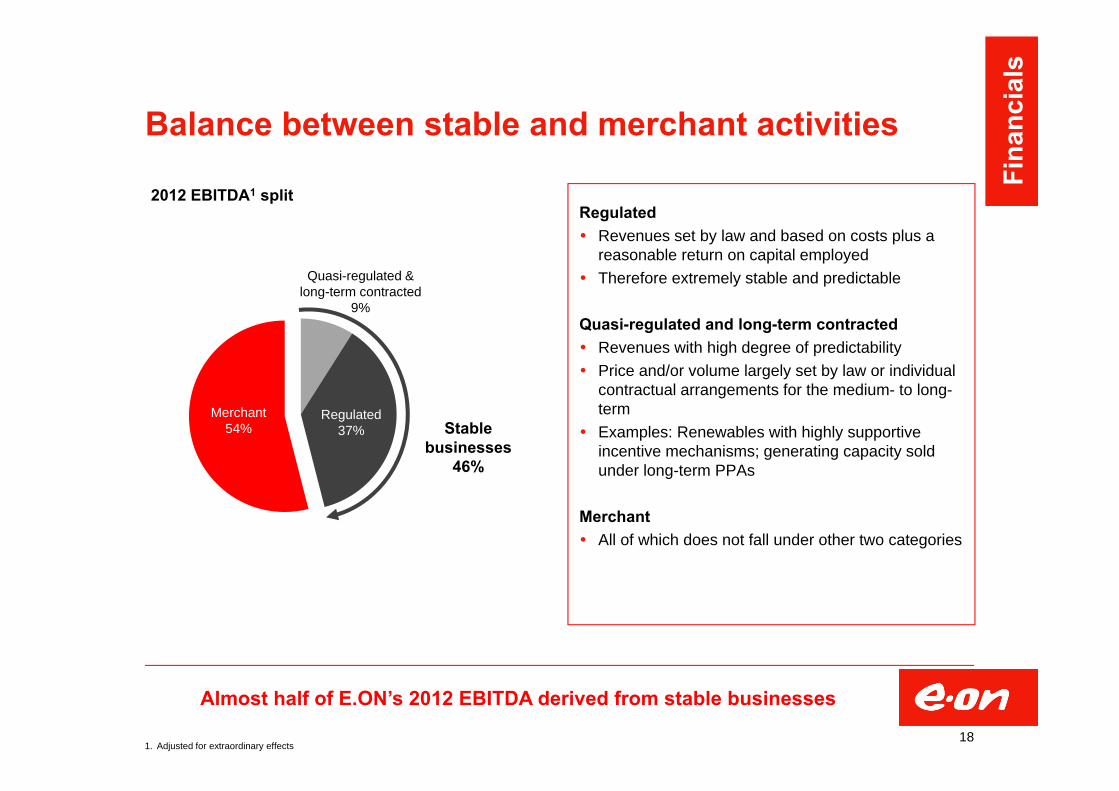
Balance between stable and merchant activities
Regulated Revenues set by law and based on costs plus a
reasonable return on capital employed Therefore extremely stable and predictable
Quasi-regulated and long-term contracted Revenues with high degree of predictability Price and/or volume largely set by law or individual
contractual arrangements for the medium- to long-term
Examples: Renewables with highly supportive incentive mechanisms; generating capacity sold under long-term PPAs
Merchant All of which does not fall under other two categories
Almost half of E.ON’s 2012 EBITDA derived from stable businesses
18
Merchant54%
Regulated37%
Quasi-regulated & long-term contracted
9%
Stable businesses
46%
Fina
ncia
ls
2012 EBITDA1 split
1. Adjusted for extraordinary effects
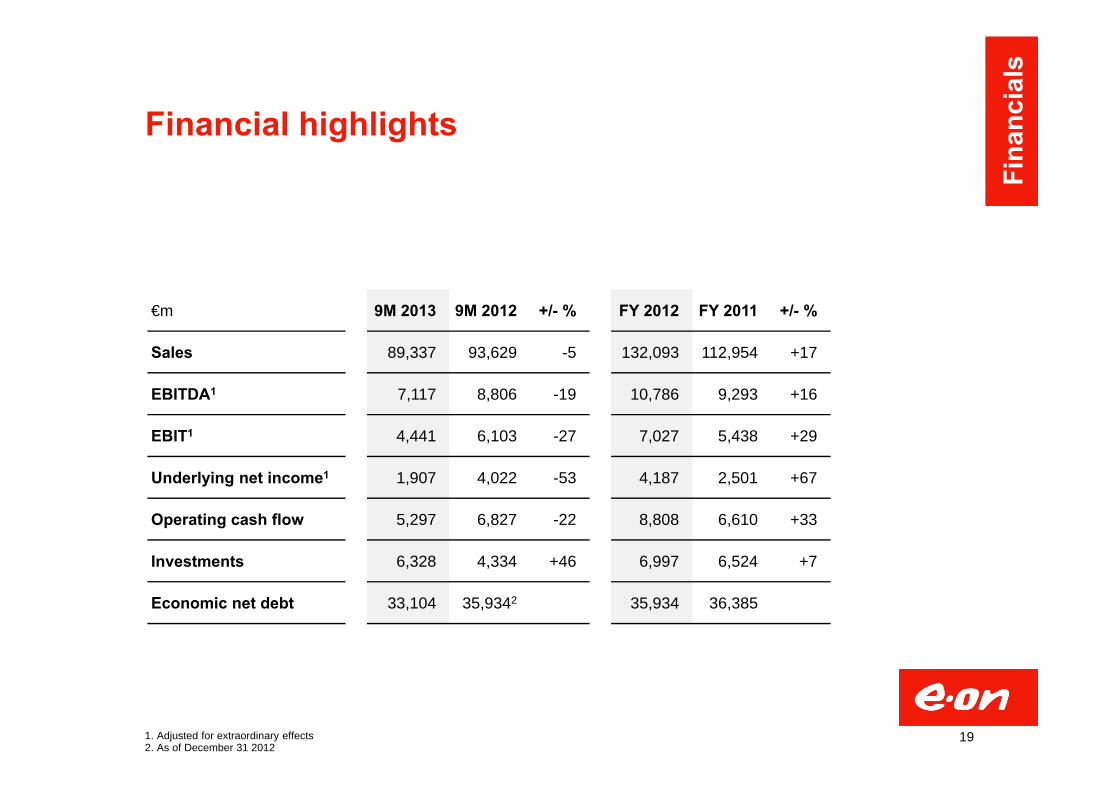
Financial highlights
19
€m 9M 2013 9M 2012 +/- % FY 2012 FY 2011 +/- %
Sales 89,337 93,629 -5 132,093 112,954 +17
EBITDA1 7,117 8,806 -19 10,786 9,293 +16
EBIT1 4,441 6,103 -27 7,027 5,438 +29
Underlying net income1 1,907 4,022 -53 4,187 2,501 +67
Operating cash flow 5,297 6,827 -22 8,808 6,610 +33
Investments 6,328 4,334 +46 6,997 6,524 +7
Economic net debt 33,104 35,9342 35,934 36,385
Fina
ncia
ls
1. Adjusted for extraordinary effects2. As of December 31 2012
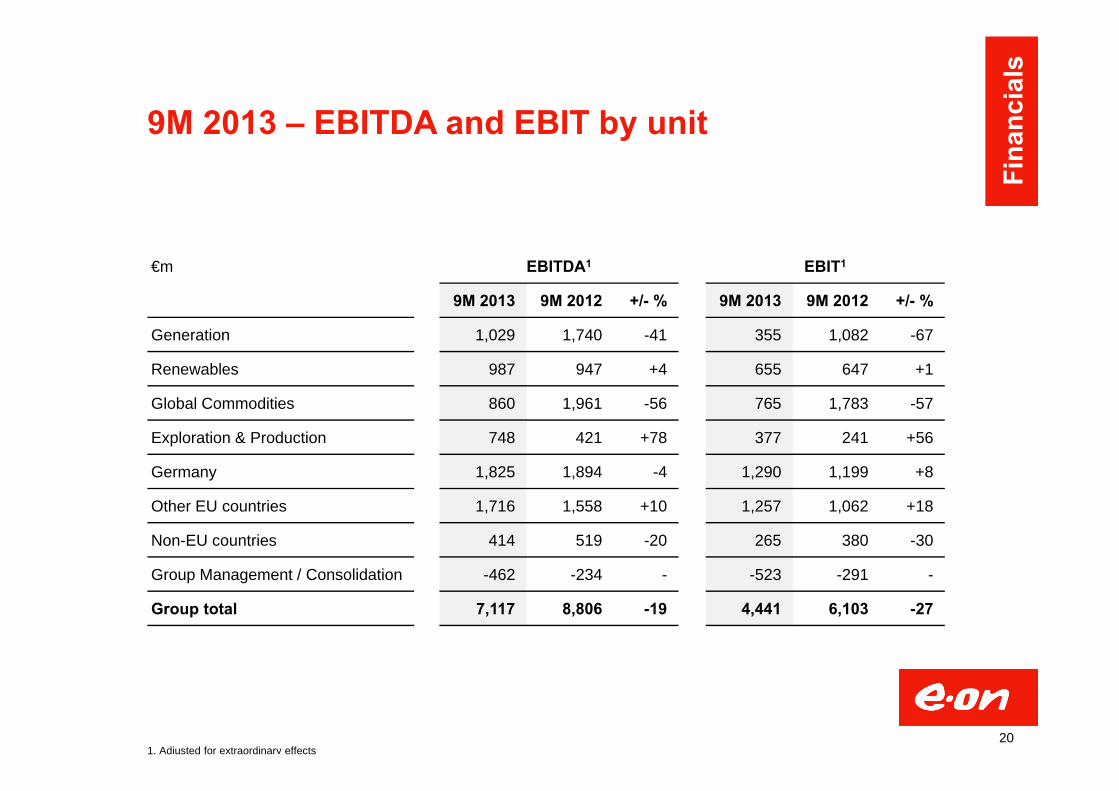
€m EBITDA1 EBIT1
9M 2013 9M 2012 +/- % 9M 2013 9M 2012 +/- %
Generation 1,029 1,740 -41 355 1,082 -67
Renewables 987 947 +4 655 647 +1
Global Commodities 860 1,961 -56 765 1,783 -57
Exploration & Production 748 421 +78 377 241 +56
Germany 1,825 1,894 -4 1,290 1,199 +8
Other EU countries 1,716 1,558 +10 1,257 1,062 +18
Non-EU countries 414 519 -20 265 380 -30
Group Management / Consolidation -462 -234 - -523 -291 -
Group total 7,117 8,806 -19 4,441 6,103 -27
9M 2013 – EBITDA and EBIT by unit
1. Adjusted for extraordinary effects20
Fina
ncia
ls
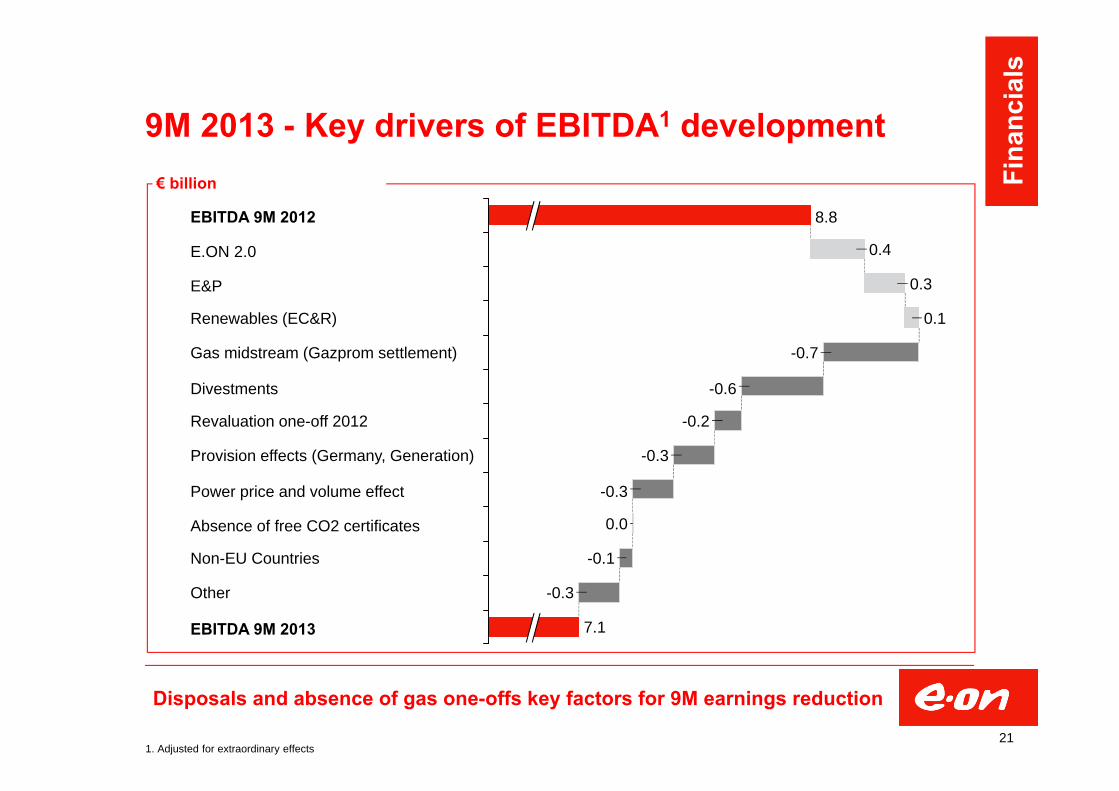
9M 2013 - Key drivers of EBITDA1 development
Disposals and absence of gas one-offs key factors for 9M earnings reduction
1. Adjusted for extraordinary effects
E&P 0.3
E.ON 2.0
EBITDA 9M 2012 8.8
EBITDA 9M 2013
Other
-0.7
-0.3
Non-EU Countries
Revaluation one-off 2012
0.4
-0.1
Renewables (EC&R)
Absence of free CO2 certificates
-0.3
0.0
7.1
0.1
-0.3
Provision effects (Germany, Generation)
-0.2
Divestments -0.6
Gas midstream (Gazprom settlement)
Power price and volume effect
€ billion
21
Fina
ncia
ls

FY 2012 – EBITDA and EBIT by unit
22
€m EBITDA1 EBIT1
FY 2012 FY 2011 +/- % FY 2012 FY 2011 +/- %
Generation 2,403 2,114 +14 1,442 1,128 +28
Renewables 1,271 1,459 -13 877 1,088 -19
Optimization & Trading 1,421 160 - 1,163 -134 -
Exploration & Production 523 727 -28 293 481 -39
Germany 2,819 2,457 +15 1,851 1,499 +23
Other EU countries 2,032 2,259 -10 1,345 1,491 -10
Russia 729 553 +32 546 398 +37
Group Management / Consolidation -412 -436 - -490 -513 -
Group total 10,786 9,293 +16 7,027 5,438 +29
Fina
ncia
ls
1. Adjusted for extraordinary effects
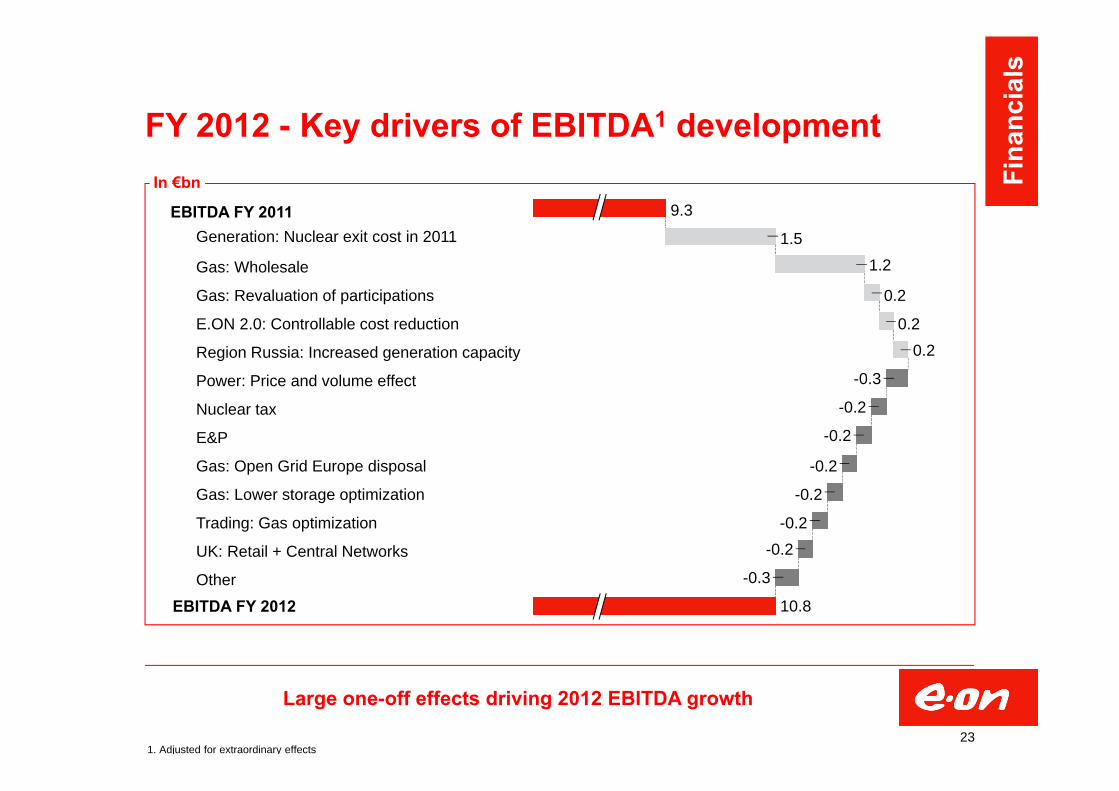
FY 2012 - Key drivers of EBITDA1 developmentIn €bn
Large one-off effects driving 2012 EBITDA growth
EBITDA FY 2011
EBITDA FY 2012
-0.2
E&P -0.2Nuclear tax -0.2Power: Price and volume effect -0.3Region Russia: Increased generation capacity 0.2
10.8
-0.3UK: Retail + Central Networks -0.2Trading: Gas optimization -0.2
Other
Gas: Lower storage optimization -0.2
Gas: Open Grid Europe disposal
E.ON 2.0: Controllable cost reduction 0.2
Gas: Revaluation of participations 0.2
Gas: Wholesale 1.2
Generation: Nuclear exit cost in 2011 1.5
9.3
231. Adjusted for extraordinary effects
Fina
ncia
ls

Economic net debt
24
€m 30 Sep 2013 31 Dec 2012
Liquid funds 7,183 6,546
Non-current securities 4,482 4,746
Total liquid funds and non-current securities 11,665 11,292
Financial liabilities to banks and third parties -22,540 -25,014
Financial liabilities resulting from interests inassociated companies and other shareholdings -991 -930
Total financial liabilities -23,531 -25,944
Net financial position -11,886 -14,652
Fair value of currency derivatives used for financing transactions1 -125 145
Provisions for pensions -4,388 -4,945
Asset retirement obligations -18,558 -18,225
Less prepayments to Swedish nuclear fund 1,833 1,743
Economic net debt -33,104 -35,934
1. Net figure; does not include transactions relating to our operating business or asset management
Fina
ncia
ls
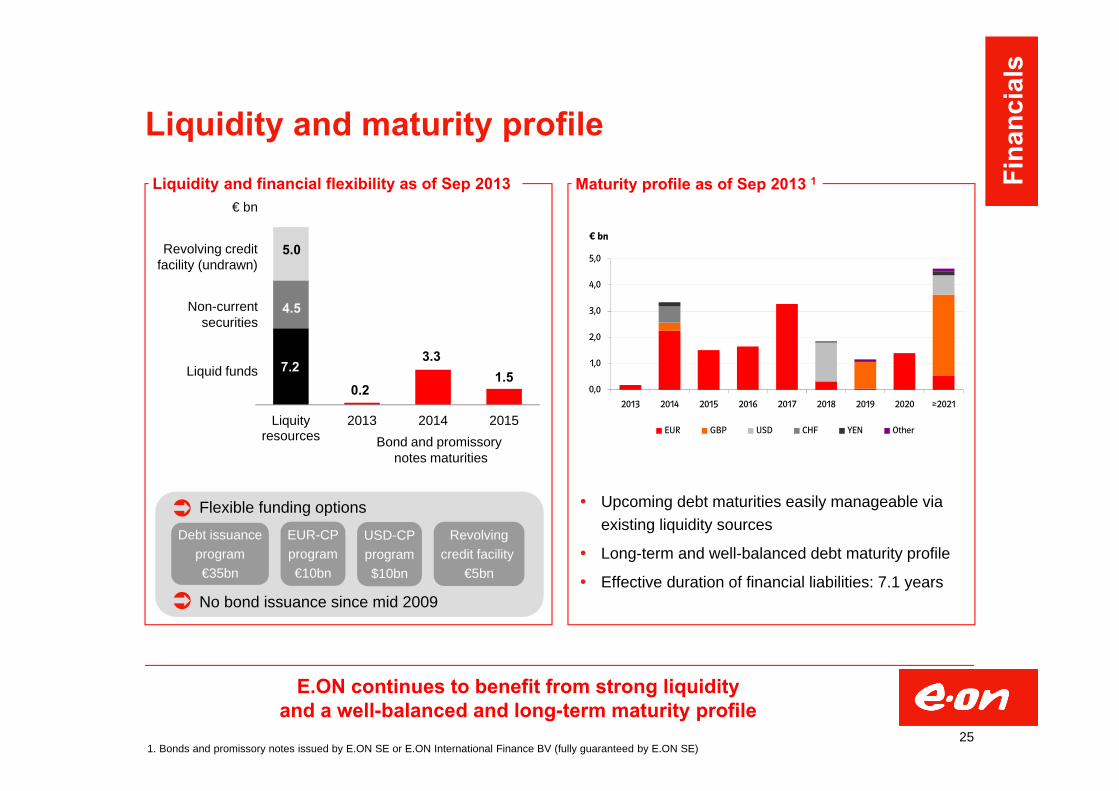
Upcoming debt maturities easily manageable via existing liquidity sources
Long-term and well-balanced debt maturity profile
Effective duration of financial liabilities: 7.1 years
Liquityresources
2013 2014 2015
Liquidity and maturity profileLiquidity and financial flexibility as of Sep 2013 Maturity profile as of Sep 2013 1
E.ON continues to benefit from strong liquidityand a well-balanced and long-term maturity profile
251. Bonds and promissory notes issued by E.ON SE or E.ON International Finance BV (fully guaranteed by E.ON SE)
Flexible funding optionsDebt issuance
program€35bn
EUR-CPprogram€10bn
USD-CPprogram$10bn
Revolvingcredit facility
€5bn
No bond issuance since mid 2009
Revolving creditfacility (undrawn)
Bond and promissorynotes maturities
0.2
3.31.5
5.0
4.5
7.2
€ bn
Liquid funds
Non-currentsecurities
Fina
ncia
ls
0,0
1,0
2,0
3,0
4,0
5,0
2013 2014 2015 2016 2017 2018 2019 2020 ≥2021
EUR GBP USD CHF YEN Other
4500
5000
5500
6000
2000 2005 2010
TWh
2500
2750
3000
3250
2000 2005 2010
TWh
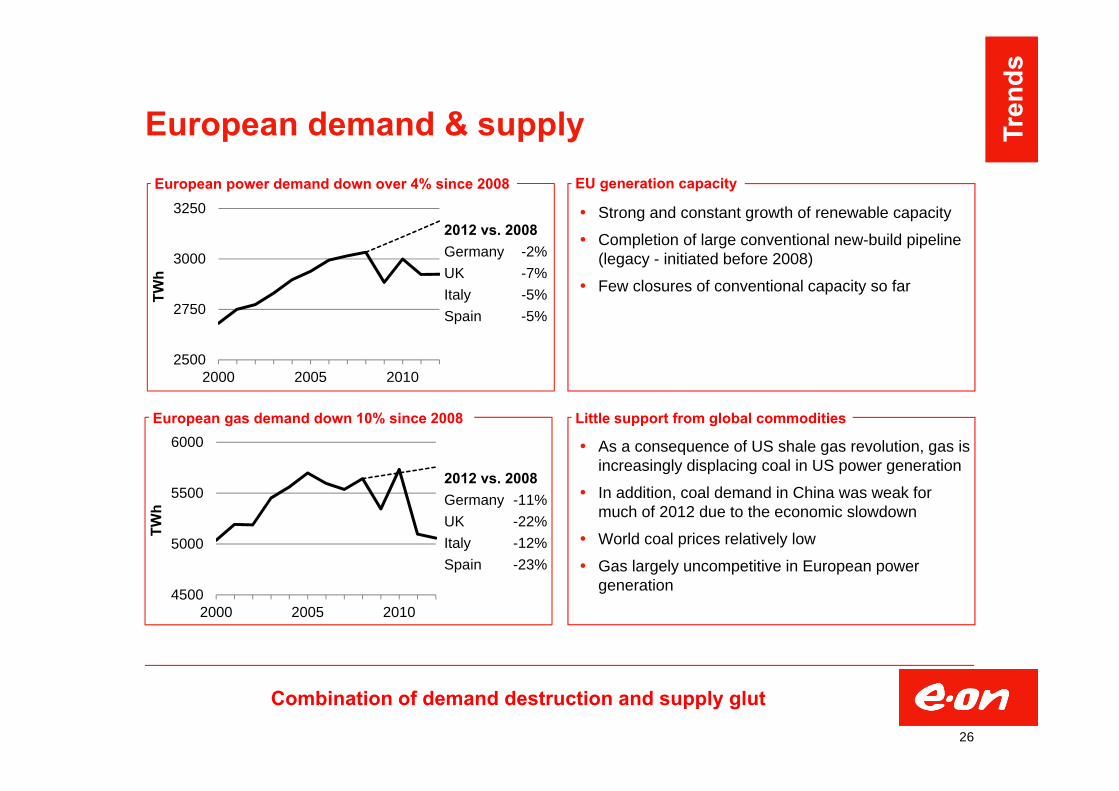
European demand & supply
Strong and constant growth of renewable capacity
Completion of large conventional new-build pipeline (legacy - initiated before 2008)
Few closures of conventional capacity so far
As a consequence of US shale gas revolution, gas is increasingly displacing coal in US power generation
In addition, coal demand in China was weak for much of 2012 due to the economic slowdown
World coal prices relatively low
Gas largely uncompetitive in European power generation
Combination of demand destruction and supply glut
26
2012 vs. 2008Germany -2%UK -7%Italy -5%Spain -5%
2012 vs. 2008Germany -11%UK -22%Italy -12%Spain -23%
European power demand down over 4% since 2008
European gas demand down 10% since 2008 Little support from global commodities
EU generation capacity
Tren
ds

Inefficient carbon policies
-10
0
10
20
30
40
-250
0
250
500
750
1.000
2005 2008 2011 2014 2017 2020
€/t CO2mt CO2 2005-20072008-20122013-2020CO2price
0
5
10
15
20
25
1998 2001 2004 2007 2010 2013
€cts/kWh RES support
Other charges
VAT
Transport & Sales
Generation
Generation,Transport & Sales
Steep increase in consumer prices
Main incentive scheme bust
Massive collateral damage
27
Expected carbon surplus/deficit of EU ETS
Electricity price for German residential customers
30
35
40
45
50
55
00:00 04:00 08:00 12:00 16:00 20:00
GWJuly2010
July2012
July2016
Market value of flexible energy eroded
Hourly load factor of peak capacity
0
100
200
300
400
2000 2002 2004 2006 2008 2010 2012
TWh
Solar
WindOffshore
WindOnshore
OtherRenewables
Strong renewables growth in Europe
Tren
ds

Generation – Business snapshot
3,8
2,12,4
2,8
1,11,5
0,00,51,01,52,02,53,03,54,0
2010 2011 2012EBITDA EBIT
2013:(+) E.ON 2.0(-) Absence of free allocation of CO2 allowances(-) Lower transfer prices & spreads(-) Political interventions
Post 2013:(+) Additional E.ON 2.0 impact(+) First time consolidation Maasvlakte(-) Lower prices & spreads
0,7 0,7 0,5 0,5 0,4
1,0 0,8
0,4 0,30,2
0,00,20,40,60,81,01,21,41,61,8
2011 2012 2013 2014 2015Non-maintenance Maintenance
Segment capex plan (€bn)
Key earnings drivers – 2013 and beyond
Further downward pressure from outright prices and spreads
28
(+) Absence of prior yearnuclear one-off
(-) Price/volume effect
(-) Higher nuclear tax payments
Maasvlakte III Planned COD: 2014 Total capex: €1.7bn
Maintenance at minimum by 2015
Moratorium on new build projects
Streamline power plant portfolio to adapt to market conditions
Improve profitability of power plant assets by extensive costs reduction program
Very selective development activities to be prepared for potential opportunities driven by new market designs
Strategic priorities
EBIT(DA) – Main drivers 2012 vs. 2011 (€bn) Gen
erat
ion
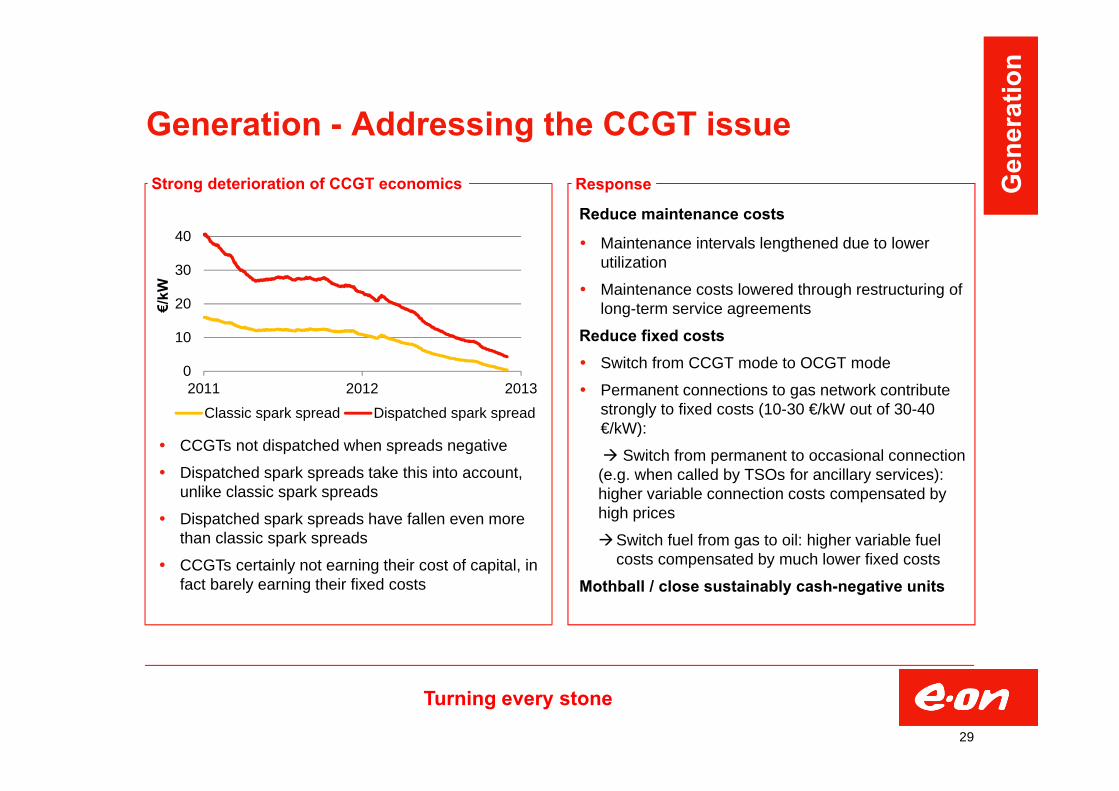
Generation - Addressing the CCGT issue
Reduce maintenance costs
Maintenance intervals lengthened due to lower utilization
Maintenance costs lowered through restructuring of long-term service agreements
Reduce fixed costs Switch from CCGT mode to OCGT mode
Permanent connections to gas network contribute strongly to fixed costs (10-30 €/kW out of 30-40 €/kW):
Switch from permanent to occasional connection (e.g. when called by TSOs for ancillary services): higher variable connection costs compensated by high prices
Switch fuel from gas to oil: higher variable fuel costs compensated by much lower fixed costs
Mothball / close sustainably cash-negative units
Response
Turning every stone
29
0
10
20
30
40
2011 2012 2013
€/kW
Classic spark spread Dispatched spark spread
CCGTs not dispatched when spreads negative
Dispatched spark spreads take this into account, unlike classic spark spreads
Dispatched spark spreads have fallen even more than classic spark spreads
CCGTs certainly not earning their cost of capital, in fact barely earning their fixed costs
Strong deterioration of CCGT economics Gen
erat
ion
0
2
4
6
Q4 2012 Q2 2013 Q4 2013
GW
Malzenice
Tavazzano 8
Staudinger 1
Shamrock 1-4
Provence 4
Hornaing 3
Kingsnorth
Fiume Santo 5-6
Escucha
Ostiglia 4
Veltheim 2 & 4
Staudinger 3
Ironbridge 1-2
Grain 1 & 4
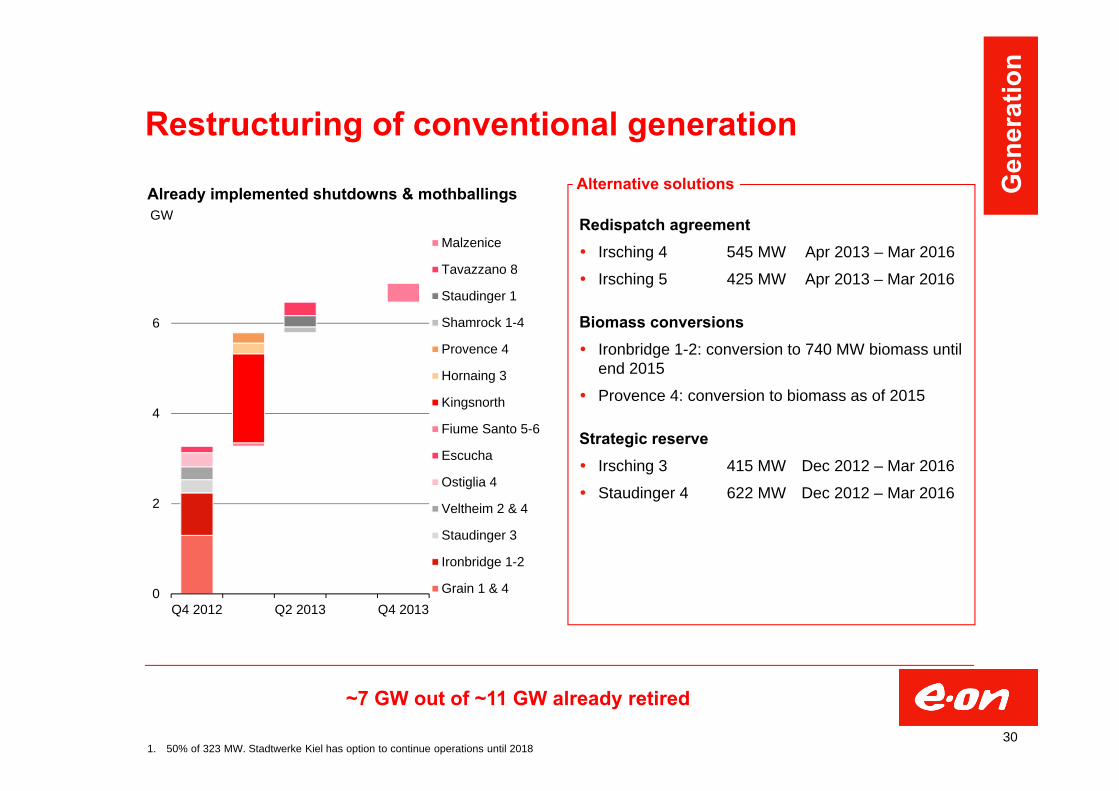
Restructuring of conventional generation
Redispatch agreement Irsching 4 545 MW Apr 2013 – Mar 2016
Irsching 5 425 MW Apr 2013 – Mar 2016
Biomass conversions Ironbridge 1-2: conversion to 740 MW biomass until
end 2015
Provence 4: conversion to biomass as of 2015
Strategic reserve Irsching 3 415 MW Dec 2012 – Mar 2016
Staudinger 4 622 MW Dec 2012 – Mar 2016
Already implemented shutdowns & mothballings Alternative solutions
~7 GW out of ~11 GW already retired
301. 50% of 323 MW. Stadtwerke Kiel has option to continue operations until 2018
Gen
erat
ion
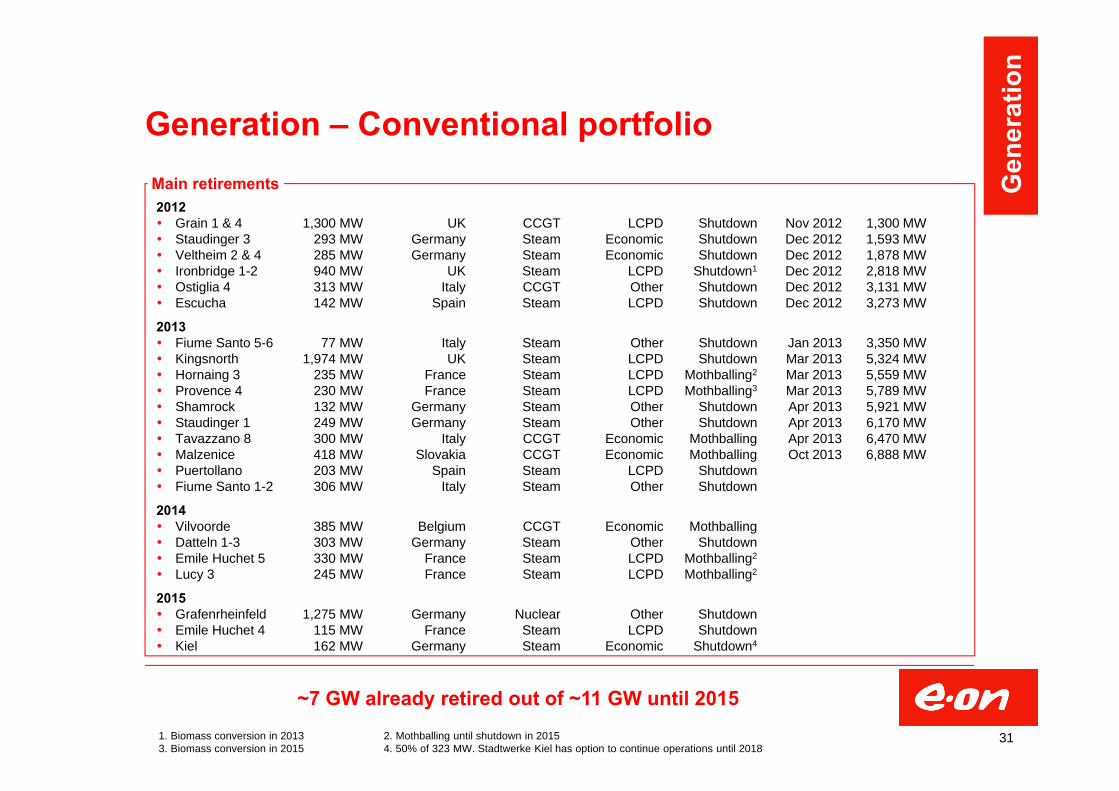
2012 Grain 1 & 4 1,300 MW UK CCGT LCPD Shutdown Nov 2012 1,300 MW Staudinger 3 293 MW Germany Steam Economic Shutdown Dec 2012 1,593 MW Veltheim 2 & 4 285 MW Germany Steam Economic Shutdown Dec 2012 1,878 MW Ironbridge 1-2 940 MW UK Steam LCPD Shutdown1 Dec 2012 2,818 MW Ostiglia 4 313 MW Italy CCGT Other Shutdown Dec 2012 3,131 MW Escucha 142 MW Spain Steam LCPD Shutdown Dec 2012 3,273 MW
2013 Fiume Santo 5-6 77 MW Italy Steam Other Shutdown Jan 2013 3,350 MW Kingsnorth 1,974 MW UK Steam LCPD Shutdown Mar 2013 5,324 MW Hornaing 3 235 MW France Steam LCPD Mothballing2 Mar 2013 5,559 MW Provence 4 230 MW France Steam LCPD Mothballing3 Mar 2013 5,789 MW Shamrock 132 MW Germany Steam Other Shutdown Apr 2013 5,921 MW Staudinger 1 249 MW Germany Steam Other Shutdown Apr 2013 6,170 MW Tavazzano 8 300 MW Italy CCGT Economic Mothballing Apr 2013 6,470 MW Malzenice 418 MW Slovakia CCGT Economic Mothballing Oct 2013 6,888 MW Puertollano 203 MW Spain Steam LCPD Shutdown Fiume Santo 1-2 306 MW Italy Steam Other Shutdown
2014 Vilvoorde 385 MW Belgium CCGT Economic Mothballing Datteln 1-3 303 MW Germany Steam Other Shutdown Emile Huchet 5 330 MW France Steam LCPD Mothballing2
Lucy 3 245 MW France Steam LCPD Mothballing2
2015 Grafenrheinfeld 1,275 MW Germany Nuclear Other Shutdown Emile Huchet 4 115 MW France Steam LCPD Shutdown Kiel 162 MW Germany Steam Economic Shutdown4
Generation – Conventional portfolioMain retirements
~7 GW already retired out of ~11 GW until 20151. Biomass conversion in 2013 2. Mothballing until shutdown in 20153. Biomass conversion in 2015 4. 50% of 323 MW. Stadtwerke Kiel has option to continue operations until 2018
31
Gen
erat
ion
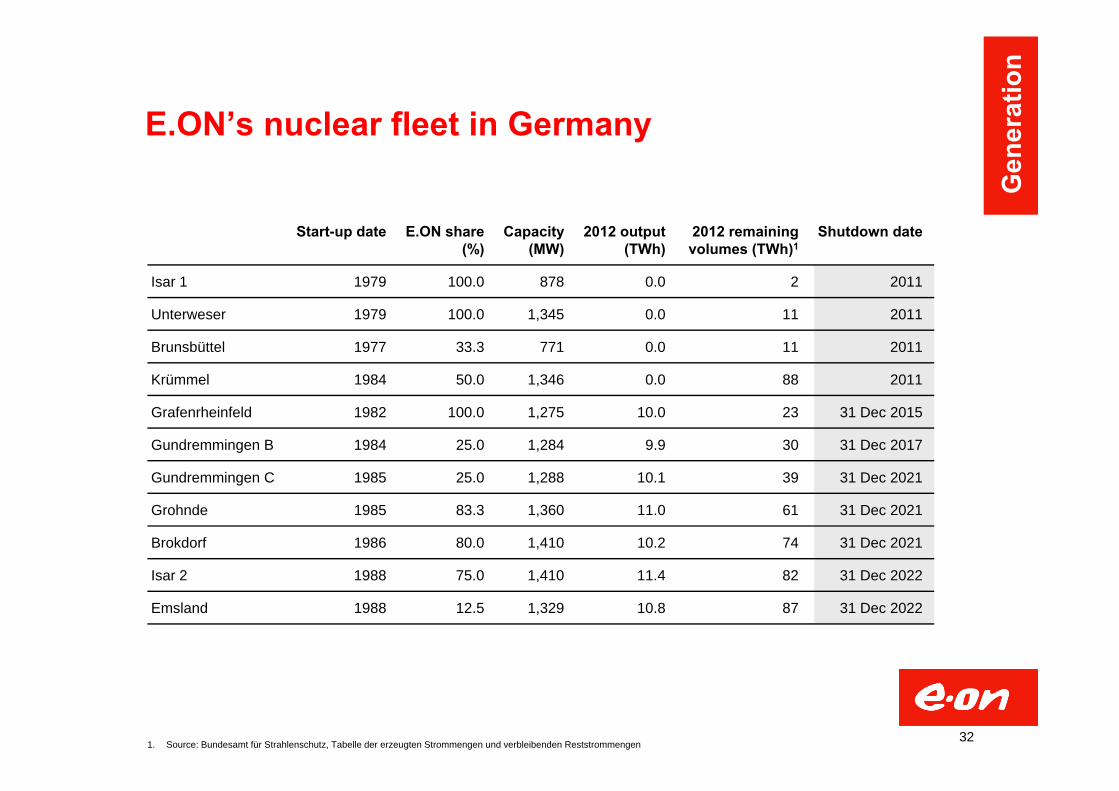
E.ON’s nuclear fleet in Germany
32
Start-up date E.ON share(%)
Capacity(MW)
2012 output(TWh)
2012 remainingvolumes (TWh)1
Shutdown date
Isar 1 1979 100.0 878 0.0 2 2011
Unterweser 1979 100.0 1,345 0.0 11 2011
Brunsbüttel 1977 33.3 771 0.0 11 2011
Krümmel 1984 50.0 1,346 0.0 88 2011
Grafenrheinfeld 1982 100.0 1,275 10.0 23 31 Dec 2015
Gundremmingen B 1984 25.0 1,284 9.9 30 31 Dec 2017
Gundremmingen C 1985 25.0 1,288 10.1 39 31 Dec 2021
Grohnde 1985 83.3 1,360 11.0 61 31 Dec 2021
Brokdorf 1986 80.0 1,410 10.2 74 31 Dec 2021
Isar 2 1988 75.0 1,410 11.4 82 31 Dec 2022
Emsland 1988 12.5 1,329 10.8 87 31 Dec 2022
1. Source: Bundesamt für Strahlenschutz, Tabelle der erzeugten Strommengen und verbleibenden Reststrommengen
Gen
erat
ion
1,2
1,51,3
0,91,1
0,9
0,00,20,40,60,81,01,21,41,6
2010 2011 2012EBITDA EBIT
0,2 0,3 0,3 0,20,70,3
0,60,1
0,2
0,3
0,10,1
0,4
0,6
0,8 1,0 0,3
0,00,20,40,60,81,01,21,41,61,82,0
2011 2012 2013 2014 2015Offshore EU Onshore EUOnshore US Other/unallocated
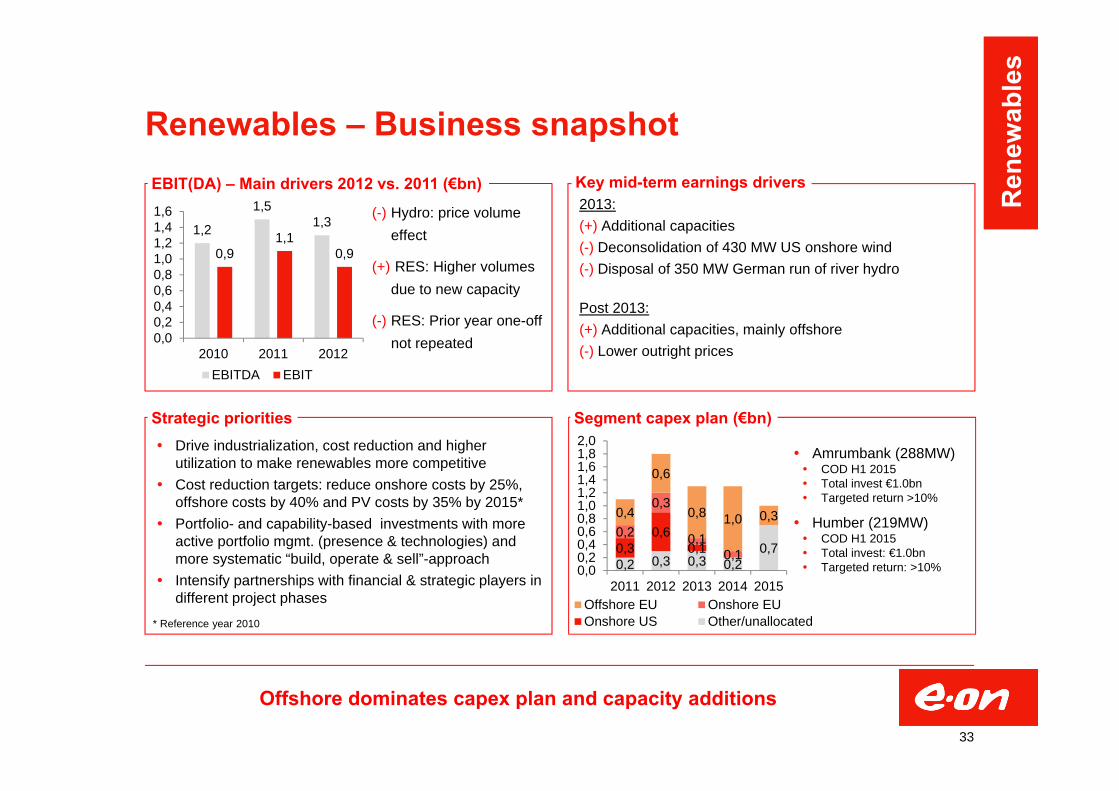
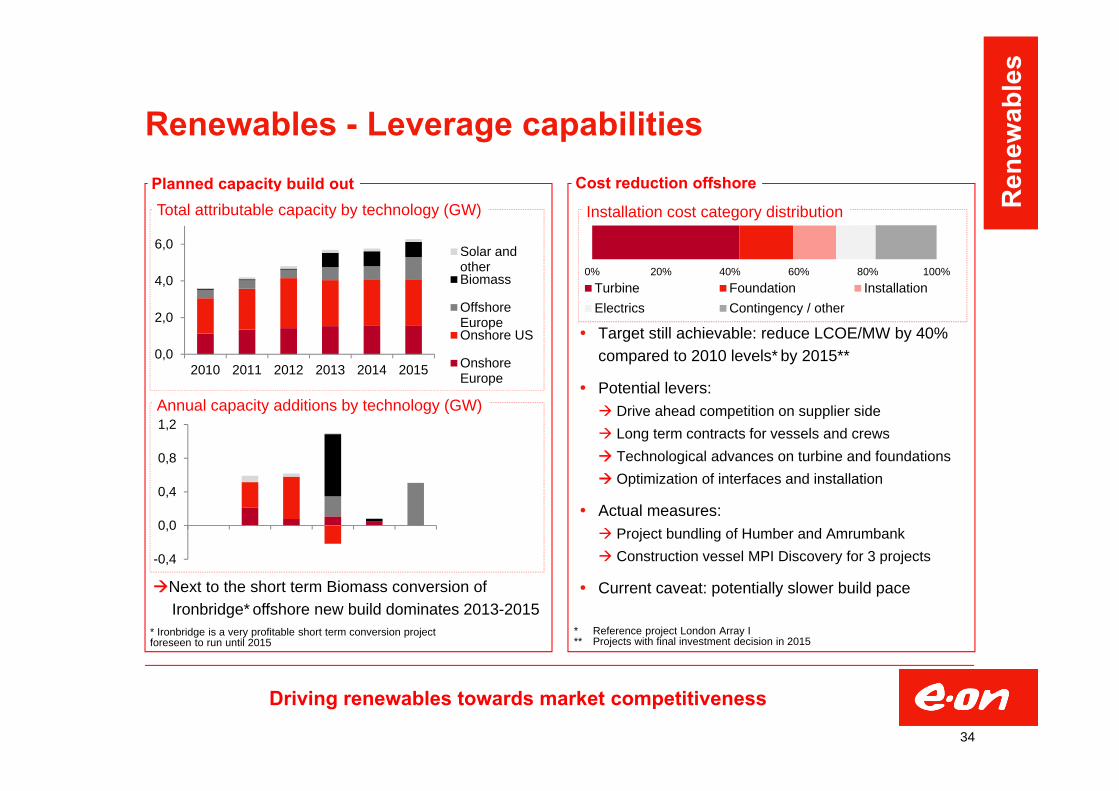
Renewables – Business snapshot
Offshore dominates capex plan and capacity additions
33
(-) Hydro: price volume effect
(+) RES: Higher volumes due to new capacity
(-) RES: Prior year one-off not repeated
Amrumbank (288MW) COD H1 2015 Total invest €1.0bn Targeted return >10%
Humber (219MW) COD H1 2015 Total invest: €1.0bn Targeted return: >10%
Segment capex plan (€bn)
2013:(+) Additional capacities(-) Deconsolidation of 430 MW US onshore wind(-) Disposal of 350 MW German run of river hydro
Post 2013:(+) Additional capacities, mainly offshore(-) Lower outright prices
Drive industrialization, cost reduction and higher utilization to make renewables more competitive
Cost reduction targets: reduce onshore costs by 25%, offshore costs by 40% and PV costs by 35% by 2015*
Portfolio- and capability-based investments with more active portfolio mgmt. (presence & technologies) and more systematic “build, operate & sell”-approach
Intensify partnerships with financial & strategic players in different project phases
Strategic priorities
EBIT(DA) – Main drivers 2012 vs. 2011 (€bn) Key mid-term earnings drivers
* Reference year 2010
Ren
ewab
les
0% 20% 40% 60% 80% 100%Turbine Foundation InstallationElectrics Contingency / other
0,0
2,0
4,0
6,0
2010 2011 2012 2013 2014 2015
Solar andotherBiomass
OffshoreEuropeOnshore US
OnshoreEurope
-0,4
0,0
0,4
0,8
1,2
Target still achievable: reduce LCOE/MW by 40% compared to 2010 levels* by 2015**
Potential levers: Drive ahead competition on supplier side Long term contracts for vessels and crews Technological advances on turbine and foundations Optimization of interfaces and installation
Actual measures: Project bundling of Humber and Amrumbank Construction vessel MPI Discovery for 3 projects
Current caveat: potentially slower build pace
Renewables - Leverage capabilities Planned capacity build out Cost reduction offshore
Driving renewables towards market competitiveness
34
Installation cost category distribution
Next to the short term Biomass conversion of Ironbridge* offshore new build dominates 2013-2015
Annual capacity additions by technology (GW)
* Ironbridge is a very profitable short term conversion project foreseen to run until 2015
* Reference project London Array I** Projects with final investment decision in 2015
Total attributable capacity by technology (GW) Ren
ewab
les
0,1 0,1
0,30,2
0,1 0,1 0,1
0,2
0,00,10,20,30,40,50,60,7
2011 2012 2013 2014 2015Other Gas Storage
2,5
0,2
1,4
2,2
-0,2
1,2
-0,50,00,51,01,52,02,53,0
2010 2011 2012
EBITDA EBIT
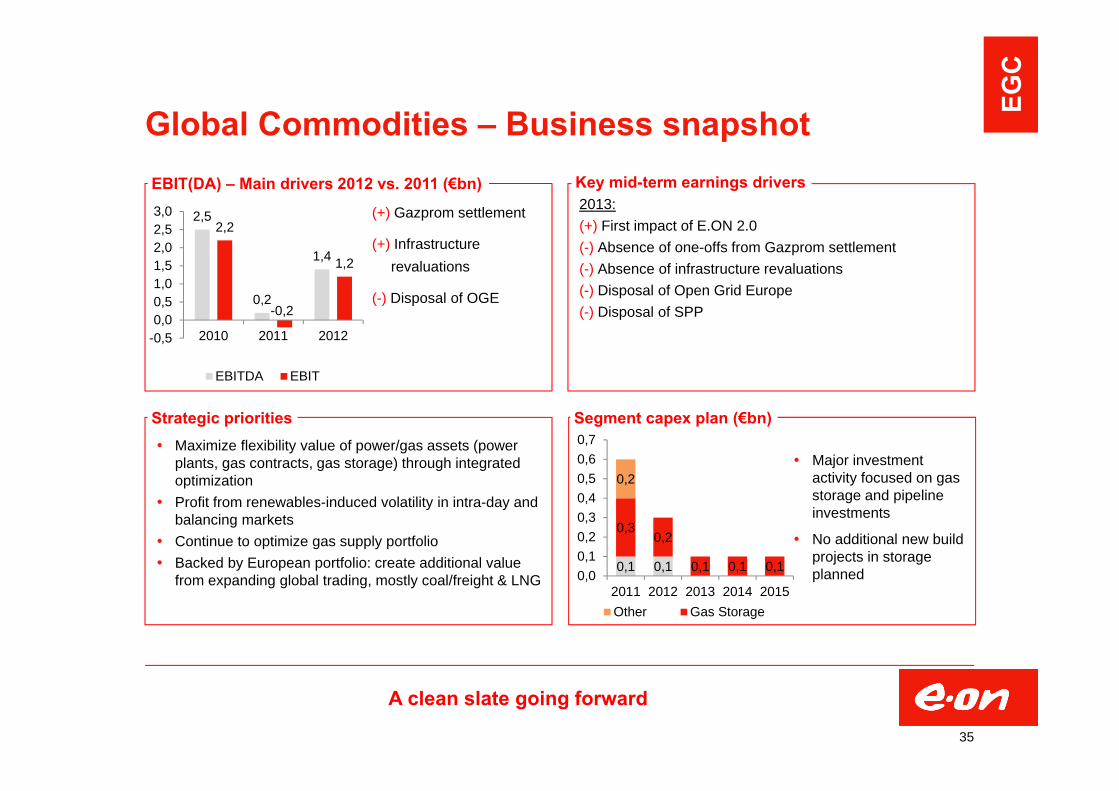
Global Commodities – Business snapshotEBIT(DA) – Main drivers 2012 vs. 2011 (€bn)
A clean slate going forward
35
(+) Gazprom settlement
(+) Infrastructure revaluations
(-) Disposal of OGE
Major investment activity focused on gas storage and pipeline investments
No additional new build projects in storage planned
Segment capex plan (€bn)
2013:(+) First impact of E.ON 2.0 (-) Absence of one-offs from Gazprom settlement(-) Absence of infrastructure revaluations(-) Disposal of Open Grid Europe(-) Disposal of SPP
Key mid-term earnings drivers
Maximize flexibility value of power/gas assets (power plants, gas contracts, gas storage) through integrated optimization
Profit from renewables-induced volatility in intra-day and balancing markets
Continue to optimize gas supply portfolio Backed by European portfolio: create additional value
from expanding global trading, mostly coal/freight & LNG
Strategic priorities
EGC
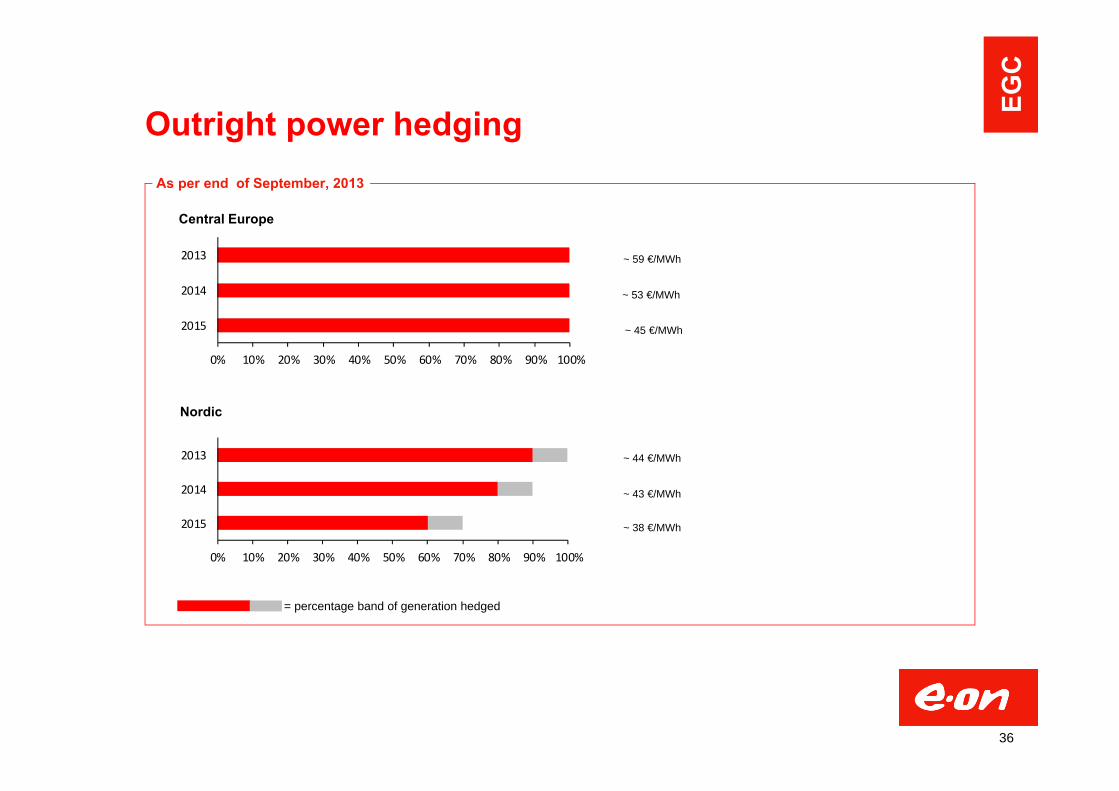
Outright power hedgingAs per end of September, 2013
~ 59 €/MWh
~ 53 €/MWh
~ 44 €/MWh
~ 43 €/MWh
Nordic
0% 10% 20% 30% 40% 50% 60% 70% 80% 90% 100%
2015
2014
2013
0% 10% 20% 30% 40% 50% 60% 70% 80% 90% 100%
2015
2014
2013
= percentage band of generation hedged
Central Europe
~ 45 €/MWh
~ 38 €/MWh
36
EGC

0
2
4
6
2010 2011 2012 2013
€/MWh
2013/142014/15
0%
20%
40%
60%
2010 2011 2012 2013
Market environment EGC gas storage business
Germany/Austria: ~ 95 TWh working gas volume United Kingdom: ~ 2 TWh working gas volume Hungary: E.ON Földgas divested
E.ON gas storage portfolio1
TTF volatility2
TTF summer/winter forward spreads
Decreasing spreads and volatility lower profitability of storage portfolio
1. 1 bcm = 11,2 TWh 2. Standard deviation of day-ahead/weekend prices over last 252 days37
EGC
0.1 0.1 0.1
0,5 0,5 0,2 0,1 0,1
0,1 0,1
0,2
0,1 0,1
0,0
0,2
0,4
0,6
0,8
2011 2012 2013 2014 2015UK Norway Other
0,7 0,7
0,50,4
0,5
0,3
0,00,10,20,30,40,50,60,70,8
2010 2011 2012EBITDA EBIT
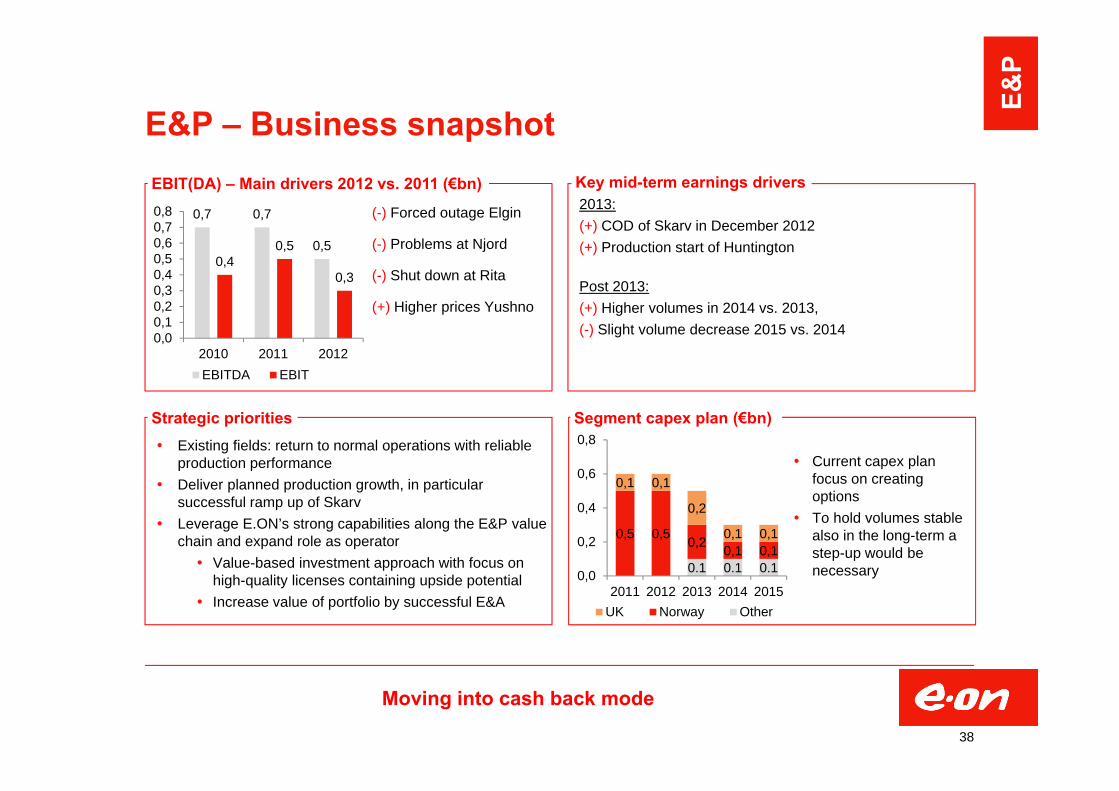
E&P – Business snapshot
Moving into cash back mode
38
(-) Forced outage Elgin
(-) Problems at Njord
(-) Shut down at Rita
(+) Higher prices Yushno
Current capex plan focus on creating options
To hold volumes stable also in the long-term a step-up would be necessary
Segment capex plan (€bn)
2013:(+) COD of Skarv in December 2012(+) Production start of Huntington
Post 2013:(+) Higher volumes in 2014 vs. 2013, (-) Slight volume decrease 2015 vs. 2014
Existing fields: return to normal operations with reliable production performance
Deliver planned production growth, in particular successful ramp up of Skarv
Leverage E.ON’s strong capabilities along the E&P value chain and expand role as operator Value-based investment approach with focus on
high-quality licenses containing upside potential Increase value of portfolio by successful E&A
Strategic priorities
EBIT(DA) – Main drivers 2012 vs. 2011 (€bn) Key mid-term earnings drivers
E&P
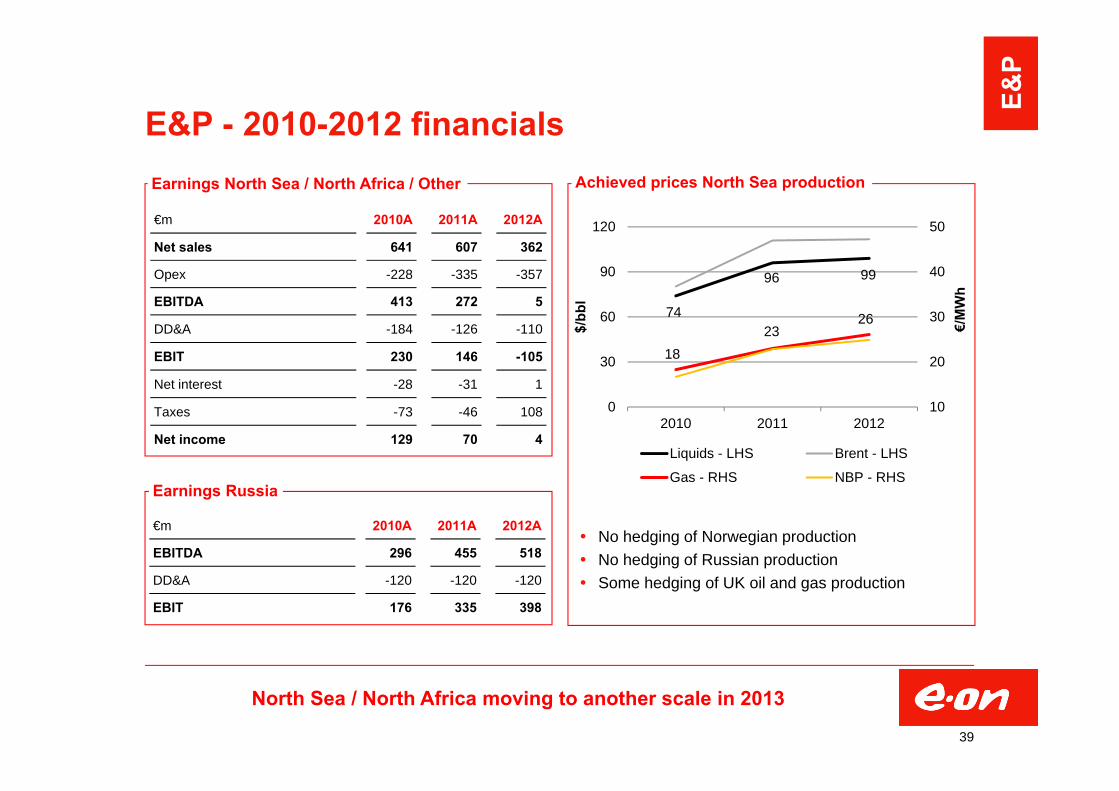
No hedging of Norwegian production No hedging of Russian production Some hedging of UK oil and gas production
74
96 99
1823
26
10
20
30
40
50
0
30
60
90
120
2010 2011 2012
€/M
Wh
$/bb
l
Liquids - LHS Brent - LHS
Gas - RHS NBP - RHS
E&P - 2010-2012 financialsEarnings North Sea / North Africa / Other
Earnings Russia
North Sea / North Africa moving to another scale in 2013
39
€m 2010A 2011A 2012A
Net sales 641 607 362
Opex -228 -335 -357
EBITDA 413 272 5
DD&A -184 -126 -110
EBIT 230 146 -105
Net interest -28 -31 1
Taxes -73 -46 108
Net income 129 70 4
€m 2010A 2011A 2012A
EBITDA 296 455 518
DD&A -120 -120 -120
EBIT 176 335 398
Achieved prices North Sea production
E&P
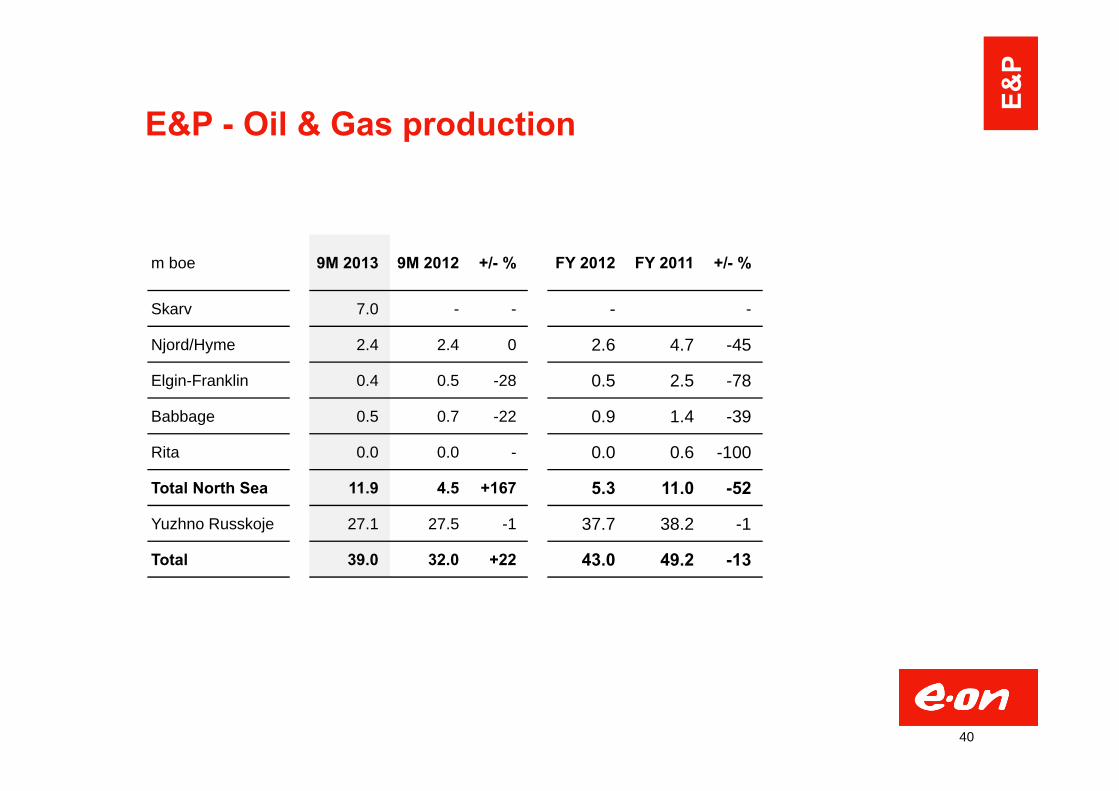
E&P - Oil & Gas production
40
m boe 9M 2013 9M 2012 +/- % FY 2012 FY 2011 +/- %
Skarv 7.0 - - - -
Njord/Hyme 2.4 2.4 0 2.6 4.7 -45
Elgin-Franklin 0.4 0.5 -28 0.5 2.5 -78
Babbage 0.5 0.7 -22 0.9 1.4 -39
Rita 0.0 0.0 - 0.0 0.6 -100
Total North Sea 11.9 4.5 +167 5.3 11.0 -52
Yuzhno Russkoje 27.1 27.5 -1 37.7 38.2 -1
Total 39.0 32.0 +22 43.0 49.2 -13
E&P
2,5 2,42,8
1,5 1,51,9
0,00,51,01,52,02,53,0
2010 2011 2012EBITDA EBIT
0,81,0
0,80,6 0,7
0,1
0,20,2
0,10,1
0,00,20,40,60,81,01,21,4
2011 2012 2013 2014 2015Other Distribution
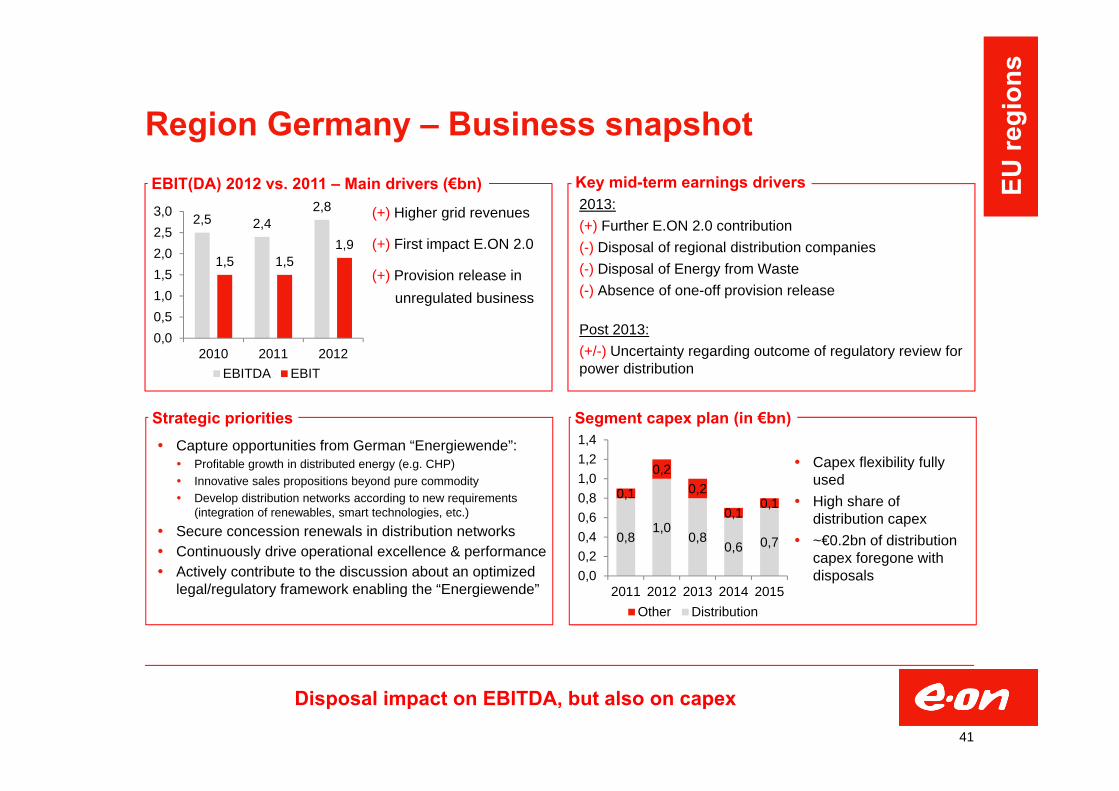
Region Germany – Business snapshot EBIT(DA) 2012 vs. 2011 – Main drivers (€bn)
Disposal impact on EBITDA, but also on capex
41
(+) Higher grid revenues
(+) First impact E.ON 2.0
(+) Provision release inunregulated business
Capex flexibility fully used
High share of distribution capex
~€0.2bn of distribution capex foregone with disposals
Segment capex plan (in €bn)
2013:(+) Further E.ON 2.0 contribution(-) Disposal of regional distribution companies(-) Disposal of Energy from Waste(-) Absence of one-off provision release
Post 2013:(+/-) Uncertainty regarding outcome of regulatory review for power distribution
Key mid-term earnings drivers
Capture opportunities from German “Energiewende”: Profitable growth in distributed energy (e.g. CHP) Innovative sales propositions beyond pure commodity Develop distribution networks according to new requirements
(integration of renewables, smart technologies, etc.) Secure concession renewals in distribution networks Continuously drive operational excellence & performance Actively contribute to the discussion about an optimized
legal/regulatory framework enabling the “Energiewende”
Strategic priorities
EU re
gion
s
0,8 0,7 0,7 0,7 0,7
0,40,4 0,4 0,4 0,4
0,00,20,40,60,81,01,21,4
2011 2012 2013 2014 2015Other Distribution
2,62,3
2,01,7 1,5 1,3
0,00,51,01,52,02,53,0
2010 2011 2012EBITDA EBIT
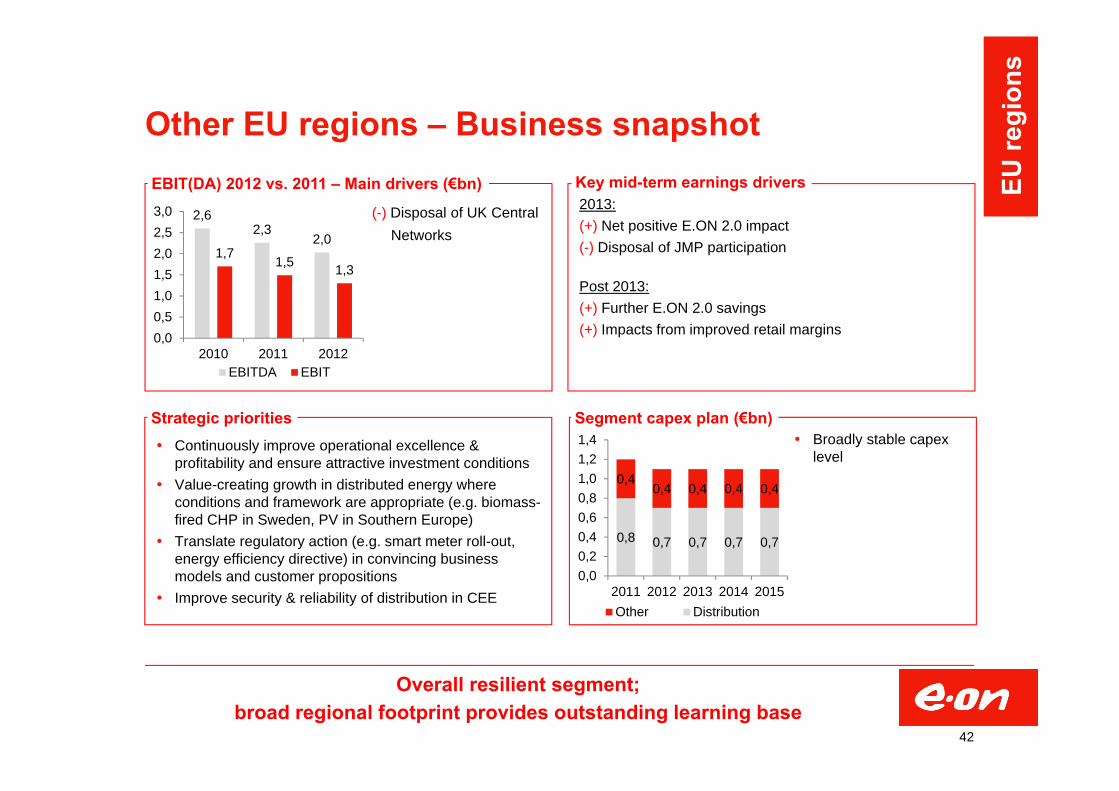
Other EU regions – Business snapshot
Overall resilient segment;broad regional footprint provides outstanding learning base
42
(-) Disposal of UK Central Networks
Broadly stable capex level
Segment capex plan (€bn)
2013:(+) Net positive E.ON 2.0 impact(-) Disposal of JMP participation
Post 2013:(+) Further E.ON 2.0 savings(+) Impacts from improved retail margins
Key mid-term earnings driversEBIT(DA) 2012 vs. 2011 – Main drivers (€bn)
Continuously improve operational excellence & profitability and ensure attractive investment conditions
Value-creating growth in distributed energy where conditions and framework are appropriate (e.g. biomass-fired CHP in Sweden, PV in Southern Europe)
Translate regulatory action (e.g. smart meter roll-out, energy efficiency directive) in convincing business models and customer propositions
Improve security & reliability of distribution in CEE
Strategic priorities
EU re
gion
s
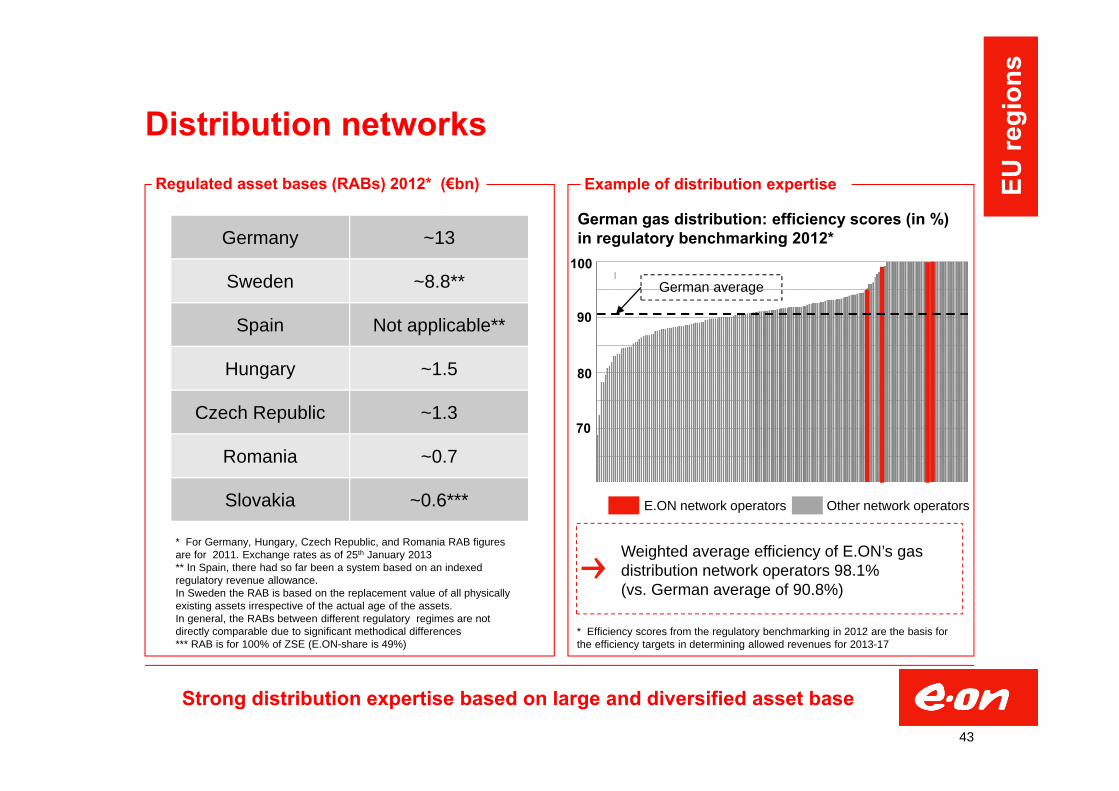
Strong distribution expertise based on large and diversified asset base
Regulated asset bases (RABs) 2012* (€bn)
* For Germany, Hungary, Czech Republic, and Romania RAB figures are for 2011. Exchange rates as of 25th January 2013** In Spain, there had so far been a system based on an indexed regulatory revenue allowance.In Sweden the RAB is based on the replacement value of all physically existing assets irrespective of the actual age of the assets.In general, the RABs between different regulatory regimes are not directly comparable due to significant methodical differences*** RAB is for 100% of ZSE (E.ON-share is 49%)
Germany ~13
Sweden ~8.8**
Spain Not applicable**
Hungary ~1.5
Czech Republic ~1.3
Romania ~0.7
Slovakia ~0.6***
Example of distribution expertise
Distribution networks
German gas distribution: efficiency scores (in %) in regulatory benchmarking 2012*
E.ON network operators Other network operators
Weighted average efficiency of E.ON’s gas distribution network operators 98.1%(vs. German average of 90.8%)
* Efficiency scores from the regulatory benchmarking in 2012 are the basis for the efficiency targets in determining allowed revenues for 2013-17
100
80
90
70
German average
EU re
gion
s
43
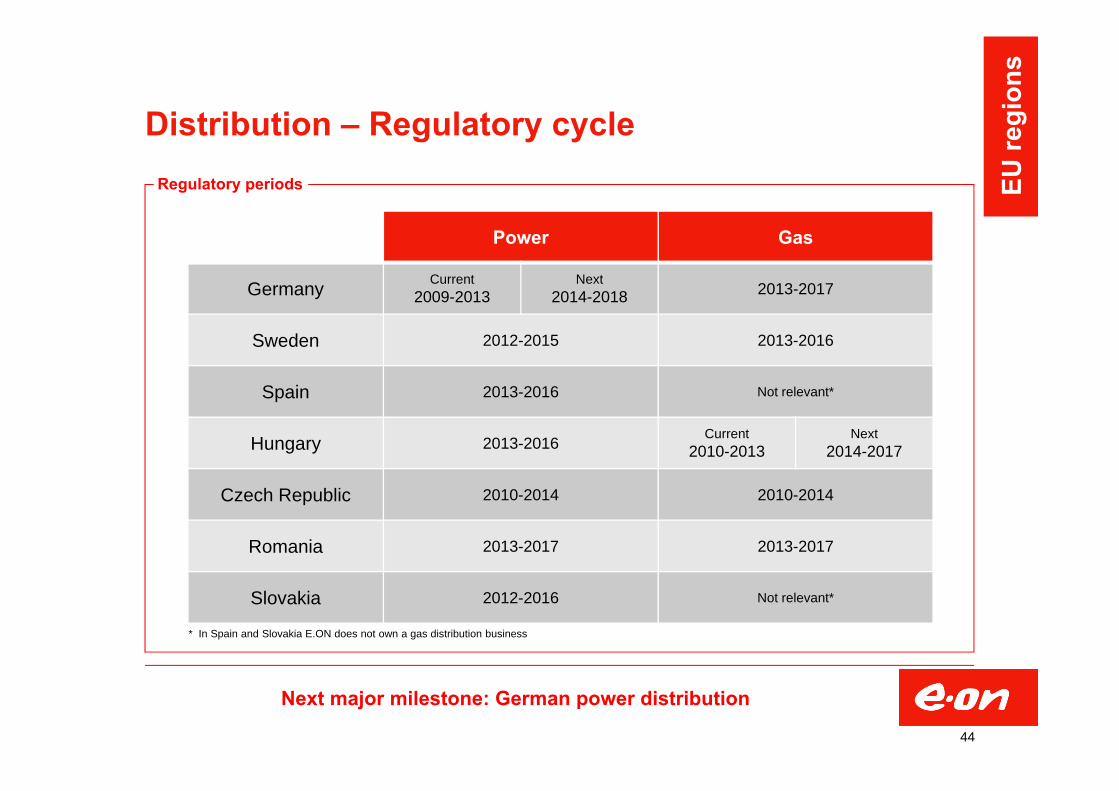
Distribution – Regulatory cycle
Power Gas
Germany Current2009-2013
Next2014-2018 2013-2017
Sweden 2012-2015 2013-2016
Spain 2013-2016 Not relevant*
Hungary 2013-2016 Current2010-2013
Next2014-2017
Czech Republic 2010-2014 2010-2014
Romania 2013-2017 2013-2017
Slovakia 2012-2016 Not relevant*
44
Regulatory periods
* In Spain and Slovakia E.ON does not own a gas distribution business
Next major milestone: German power distribution
EU re
gion
s
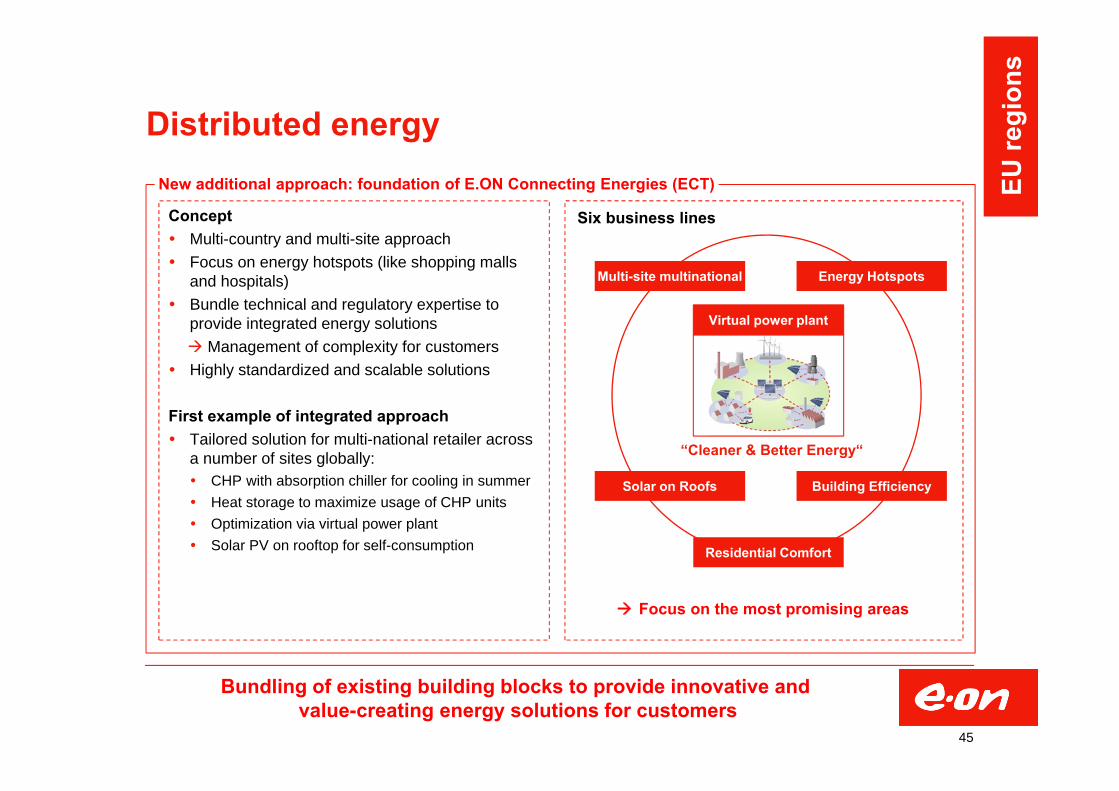
Distributed energy
45
New additional approach: foundation of E.ON Connecting Energies (ECT)
Bundling of existing building blocks to provide innovative and value-creating energy solutions for customers
Concept Multi-country and multi-site approach Focus on energy hotspots (like shopping malls
and hospitals) Bundle technical and regulatory expertise to
provide integrated energy solutions Management of complexity for customers
Highly standardized and scalable solutions
First example of integrated approach Tailored solution for multi-national retailer across
a number of sites globally: CHP with absorption chiller for cooling in summer Heat storage to maximize usage of CHP units Optimization via virtual power plant Solar PV on rooftop for self-consumption
Six business lines
“Cleaner & Better Energy“
Virtual power plant
Residential Comfort
Energy HotspotsMulti-site multinational
Building EfficiencySolar on Roofs
Focus on the most promising areas
EU re
gion
s
0,1 0,1 0,1 0,1 0,1
0,30,2
0,40,3
0,1
0,0
0,1
0,2
0,3
0,4
0,5
0,6
2011 2012 2013 2014 2015Non-maintenance Maintenance
0,4
0,6
0,7
0,3
0,40,5
0,0
0,2
0,4
0,6
0,8
2010 2011 2012EBITDA EBIT
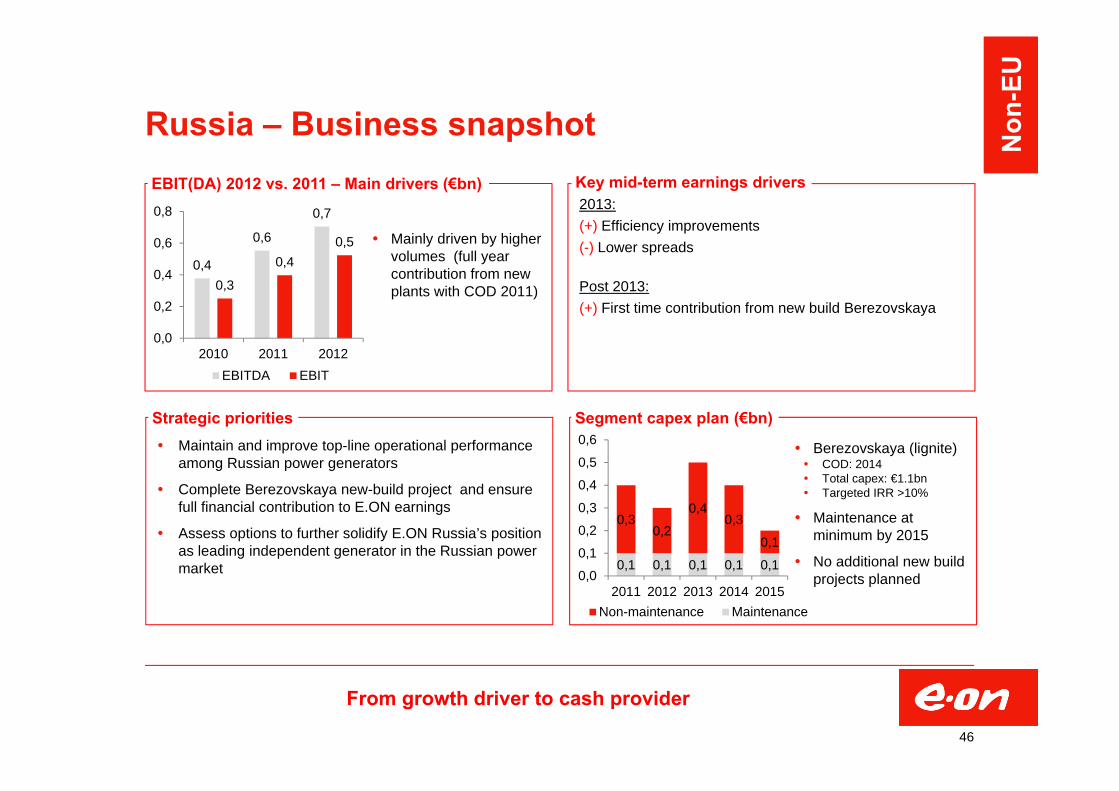
Russia – Business snapshot
From growth driver to cash provider
46
Mainly driven by higher volumes (full year contribution from new plants with COD 2011)
Berezovskaya (lignite) COD: 2014 Total capex: €1.1bn Targeted IRR >10%
Maintenance at minimum by 2015
No additional new build projects planned
Segment capex plan (€bn)
2013:(+) Efficiency improvements(-) Lower spreads
Post 2013:(+) First time contribution from new build Berezovskaya
Key mid-term earnings driversEBIT(DA) 2012 vs. 2011 – Main drivers (€bn)
Maintain and improve top-line operational performance among Russian power generators
Complete Berezovskaya new-build project and ensure full financial contribution to E.ON earnings
Assess options to further solidify E.ON Russia’s position as leading independent generator in the Russian power market
Strategic priorities
Non
-EU
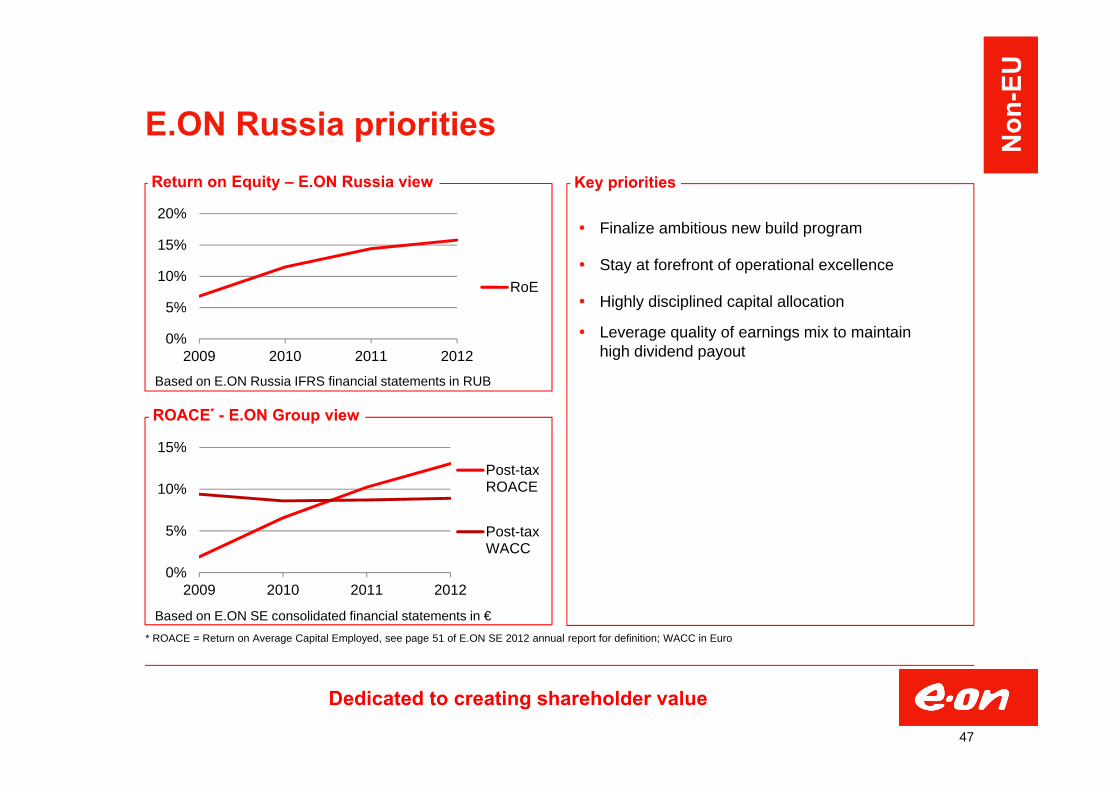
E.ON Russia prioritiesKey priorities
Dedicated to creating shareholder value
47
Finalize ambitious new build program
Stay at forefront of operational excellence
Highly disciplined capital allocation
Leverage quality of earnings mix to maintain high dividend payout
0%
5%
10%
15%
20%
2009 2010 2011 2012
RoE
Return on Equity – E.ON Russia view
Based on E.ON Russia IFRS financial statements in RUB
Based on E.ON SE consolidated financial statements in €* ROACE = Return on Average Capital Employed, see page 51 of E.ON SE 2012 annual report for definition; WACC in Euro
0%
5%
10%
15%
2009 2010 2011 2012
Post-taxROACE
Post-taxWACC
ROACE* - E.ON Group view
Non
-EU
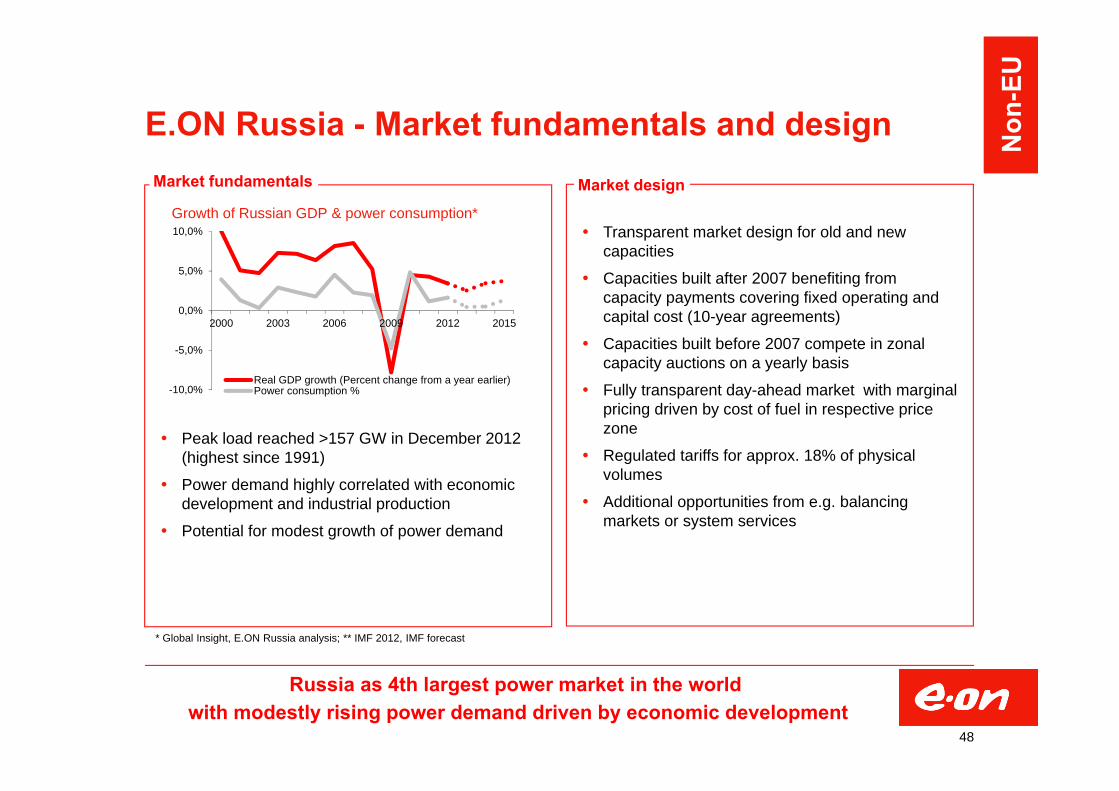
E.ON Russia - Market fundamentals and design
Russia as 4th largest power market in the world with modestly rising power demand driven by economic development
48
Peak load reached >157 GW in December 2012 (highest since 1991)
Power demand highly correlated with economic development and industrial production
Potential for modest growth of power demand
-10,0%
-5,0%
0,0%
5,0%
10,0%
2000 2003 2006 2009 2012 2015
Real GDP growth (Percent change from a year earlier)Power consumption %
Growth of Russian GDP & power consumption*
* Global Insight, E.ON Russia analysis; ** IMF 2012, IMF forecast
Market fundamentals Market design
Transparent market design for old and new capacities
Capacities built after 2007 benefiting from capacity payments covering fixed operating and capital cost (10-year agreements)
Capacities built before 2007 compete in zonal capacity auctions on a yearly basis
Fully transparent day-ahead market with marginal pricing driven by cost of fuel in respective price zone
Regulated tariffs for approx. 18% of physical volumes
Additional opportunities from e.g. balancing markets or system services
Non
-EU
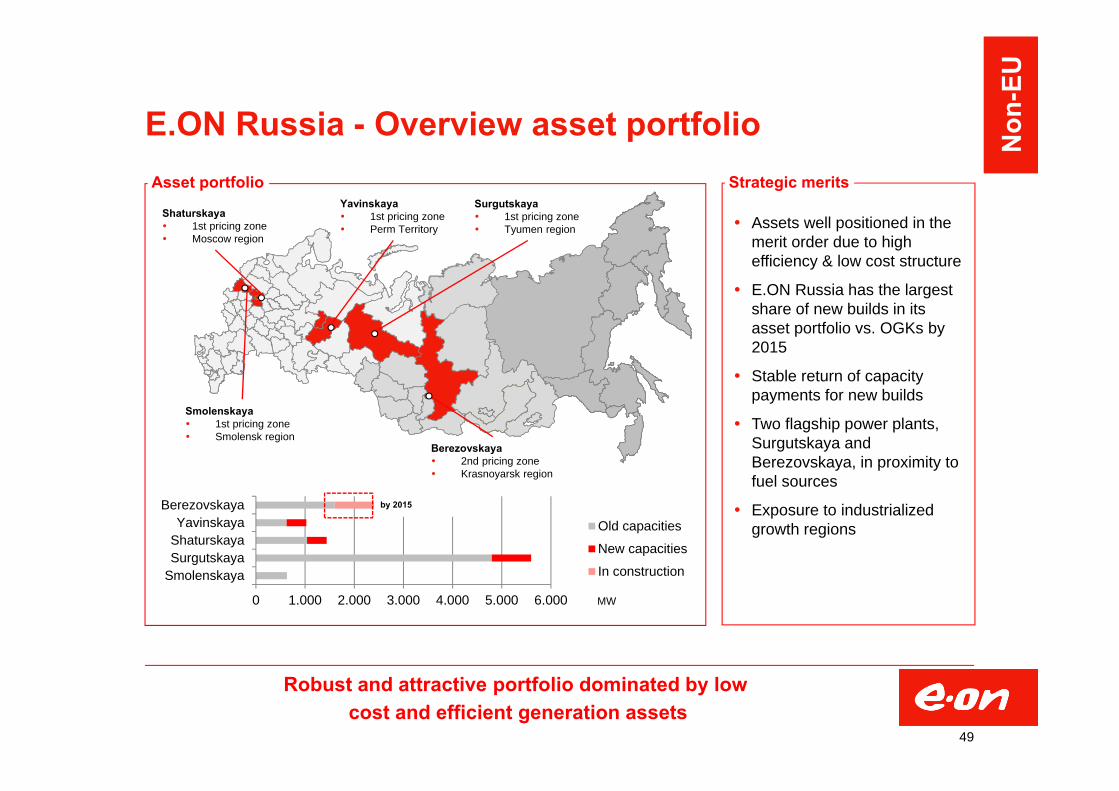
E.ON Russia - Overview asset portfolioAsset portfolio
Robust and attractive portfolio dominated by low cost and efficient generation assets
49
Strategic merits
Assets well positioned in themerit order due to high efficiency & low cost structure
E.ON Russia has the largestshare of new builds in itsasset portfolio vs. OGKs by2015
Stable return of capacitypayments for new builds
Two flagship power plants, Surgutskaya andBerezovskaya, in proximity tofuel sources
Exposure to industrializedgrowth regions
0 1.000 2.000 3.000 4.000 5.000 6.000
SmolenskayaSurgutskayaShaturskayaYavinskaya
BerezovskayaOld capacities
New capacities
In construction
by 2015
MW
Shaturskaya 1st pricing zone Moscow region
Yavinskaya 1st pricing zone Perm Territory
Surgutskaya 1st pricing zone Tyumen region
Berezovskaya 2nd pricing zone Krasnoyarsk region
Smolenskaya 1st pricing zone Smolensk region
Non
-EU
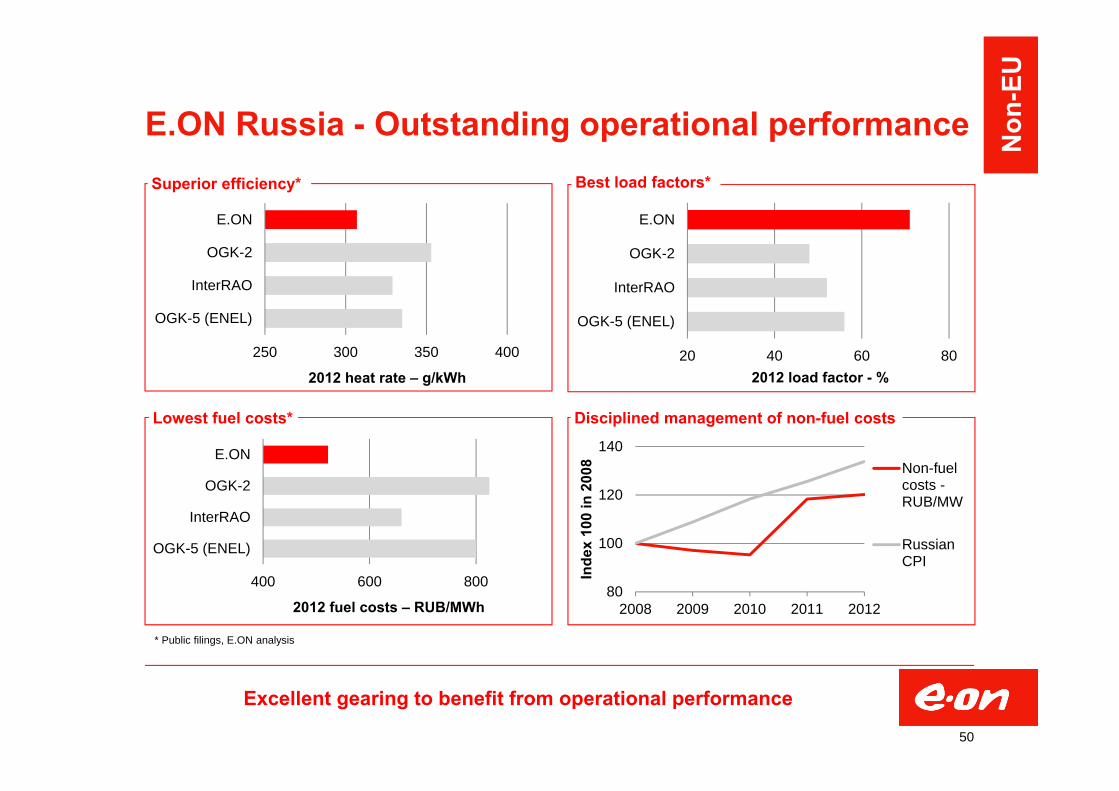
E.ON Russia - Outstanding operational performance
Excellent gearing to benefit from operational performance
50
* Public filings, E.ON analysis
400 600 800
OGK-5 (ENEL)
InterRAO
OGK-2
E.ON
2012 fuel costs – RUB/MWh
Superior efficiency* Best load factors*
Lowest fuel costs* Disciplined management of non-fuel costs
250 300 350 400
OGK-5 (ENEL)
InterRAO
OGK-2
E.ON
2012 heat rate – g/kWh20 40 60 80
OGK-5 (ENEL)
InterRAO
OGK-2
E.ON
2012 load factor - %
80
100
120
140
2008 2009 2010 2011 2012In
dex
100
in 2
008 Non-fuel
costs -RUB/MW
RussianCPI
Non
-EU
2008 2009 2010 2011 2012 2013 2014 2015
E.ON Russia - Financial outlook
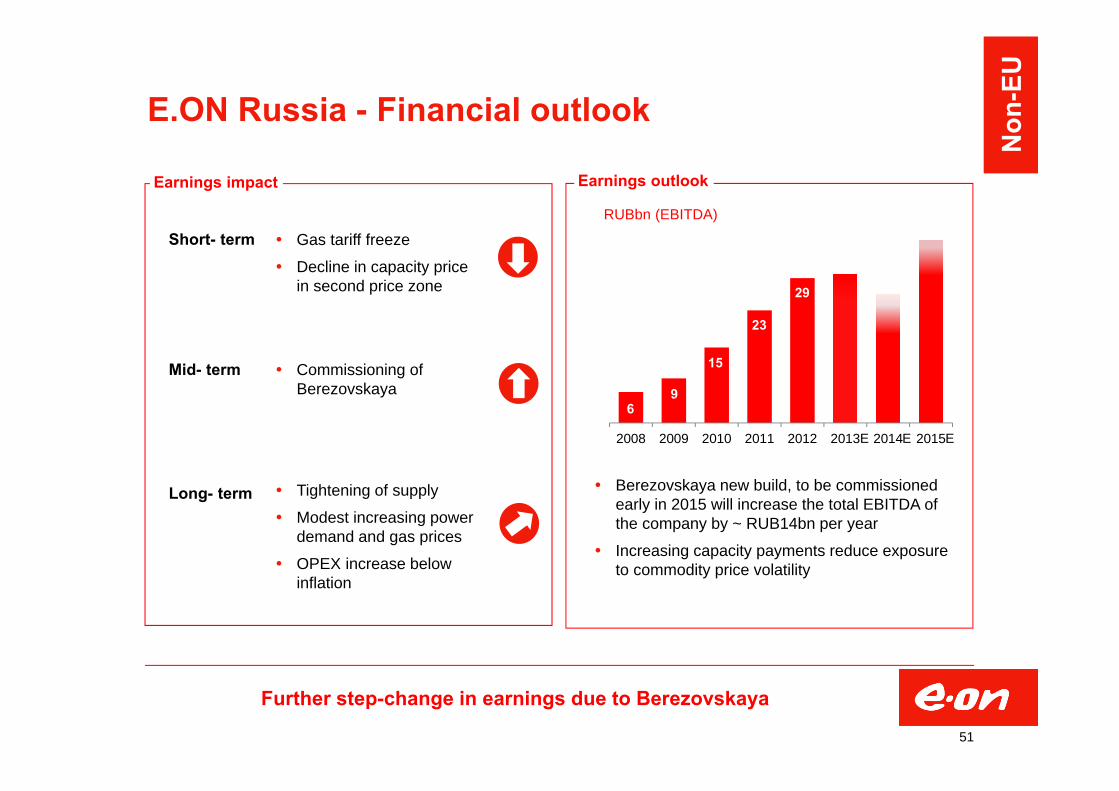
Further step-change in earnings due to Berezovskaya
51
Berezovskaya new build, to be commissioned early in 2015 will increase the total EBITDA of the company by ~ RUB14bn per year
Increasing capacity payments reduce exposure to commodity price volatility
Earnings impact Earnings outlook
RUBbn (EBITDA)
Short- term
Mid- term
Long- term
E E E
Gas tariff freeze
Decline in capacity pricein second price zone
Commissioning ofBerezovskaya
Tightening of supply
Modest increasing power demand and gas prices
OPEX increase belowinflation
29
23
15
96
Non
-EU
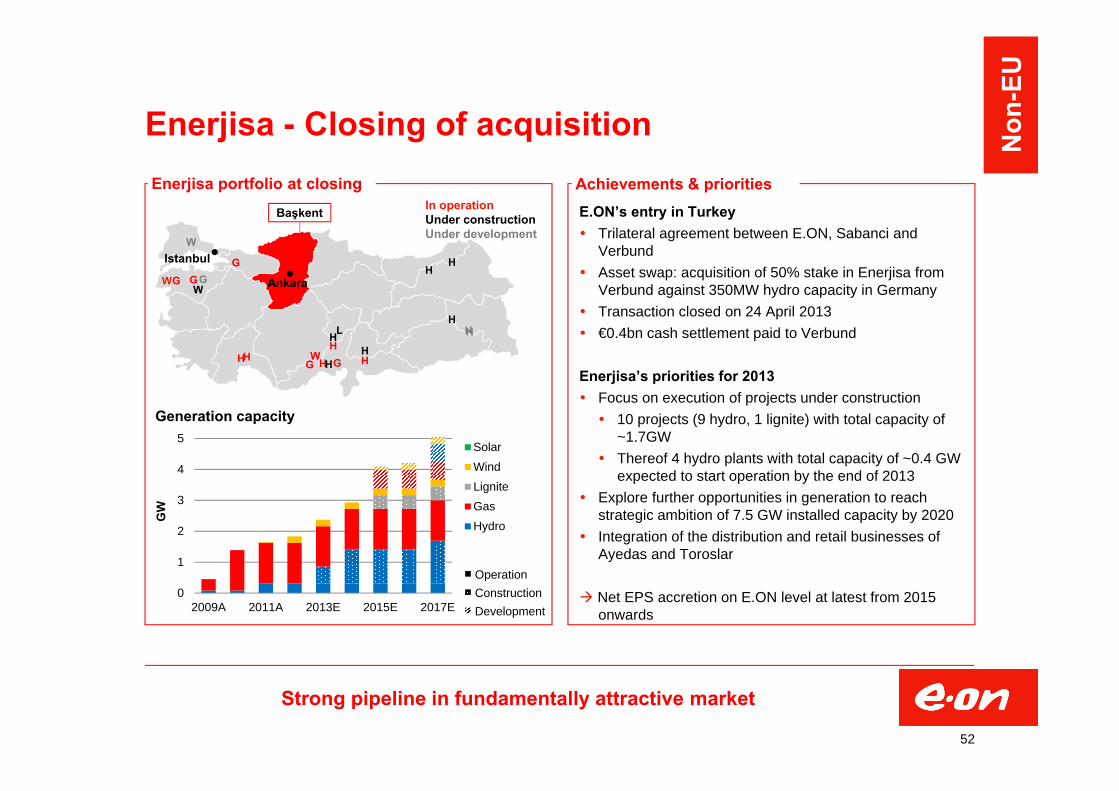
Enerjisa - Closing of acquisition
E.ON’s entry in Turkey Trilateral agreement between E.ON, Sabanci and
Verbund Asset swap: acquisition of 50% stake in Enerjisa from
Verbund against 350MW hydro capacity in Germany Transaction closed on 24 April 2013 €0.4bn cash settlement paid to Verbund
Enerjisa’s priorities for 2013 Focus on execution of projects under construction 10 projects (9 hydro, 1 lignite) with total capacity of
~1.7GW Thereof 4 hydro plants with total capacity of ~0.4 GW
expected to start operation by the end of 2013 Explore further opportunities in generation to reach
strategic ambition of 7.5 GW installed capacity by 2020 Integration of the distribution and retail businesses of
Ayedas and Toroslar
Net EPS accretion on E.ON level at latest from 2015 onwards
Enerjisa portfolio at closing Achievements & priorities
Strong pipeline in fundamentally attractive market
0
1
2
3
4
5
2009A 2011A 2013E 2015E 2017E
GW
SolarWindLigniteGasHydro
2.3Ankara
Istanbul
H HHHH
H
H
HH
HH
H
H
GG
GGG
G
W
W
W
W
L
In operationUnder constructionUnder development
Başkent
Generation capacity
OperationConstructionDevelopment
52
Non
-EU
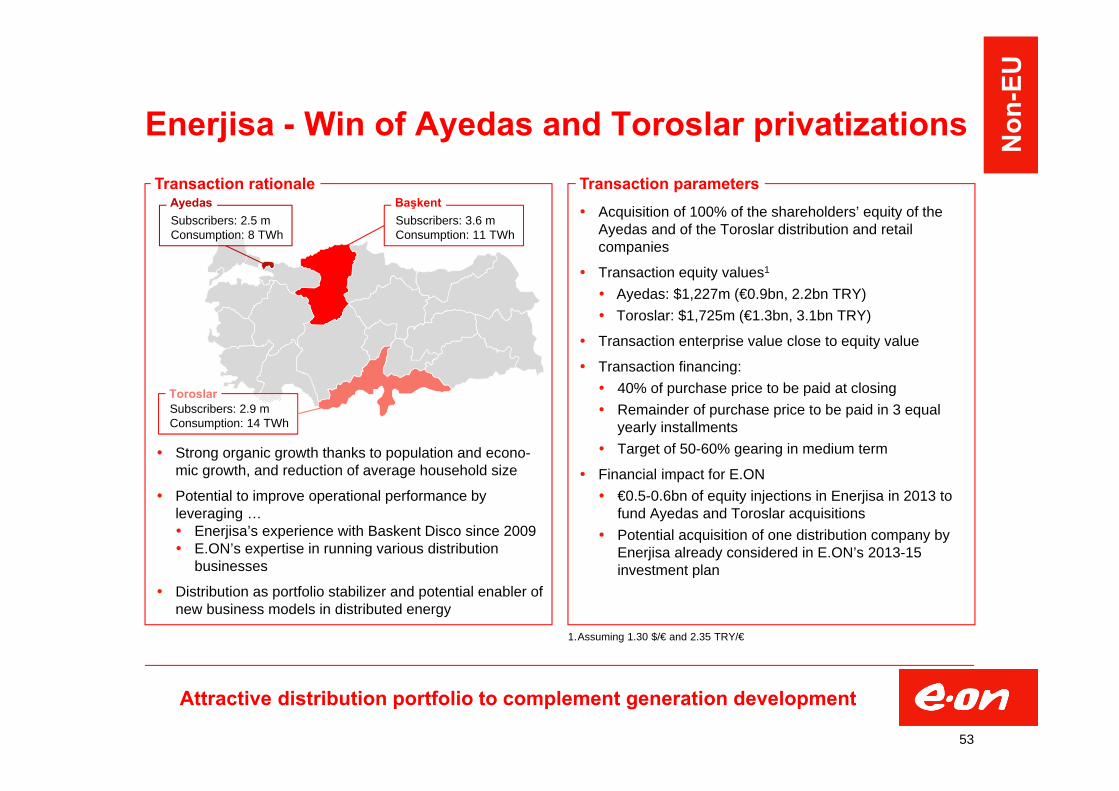
Enerjisa - Win of Ayedas and Toroslar privatizations
Strong organic growth thanks to population and econo-mic growth, and reduction of average household size
Potential to improve operational performance by leveraging … Enerjisa’s experience with Baskent Disco since 2009 E.ON’s expertise in running various distribution
businesses
Distribution as portfolio stabilizer and potential enabler of new business models in distributed energy
Acquisition of 100% of the shareholders’ equity of the Ayedas and of the Toroslar distribution and retail companies
Transaction equity values1
Ayedas: $1,227m (€0.9bn, 2.2bn TRY) Toroslar: $1,725m (€1.3bn, 3.1bn TRY)
Transaction enterprise value close to equity value
Transaction financing: 40% of purchase price to be paid at closing Remainder of purchase price to be paid in 3 equal
yearly installments Target of 50-60% gearing in medium term
Financial impact for E.ON €0.5-0.6bn of equity injections in Enerjisa in 2013 to
fund Ayedas and Toroslar acquisitions Potential acquisition of one distribution company by
Enerjisa already considered in E.ON’s 2013-15 investment plan
Transaction rationale Transaction parameters
Attractive distribution portfolio to complement generation development
1.Assuming 1.30 $/€ and 2.35 TRY/€
Subscribers: 3.6 mConsumption: 11 TWh
Subscribers: 2.9 m Consumption: 14 TWh
Başkent
Toroslar
Subscribers: 2.5 mConsumption: 8 TWh
Ayedas
53
Non
-EU

Enerjisa - Ayedas and Toroslar disco’s
Residents: 4.8m Subscribers: 2.5m Consumption: 8 TWh Area: 1.869 km2 Network length: 19.000 km
Concentrated urban network on Asian side of Istanbul Strong commercial and residential demand for power Population expected to develop from 4.8m in 2012 to ~8m in
~2040 through natural growth and substantial inward migration
High-quality urban network on Asian side of Istanbul
Residents: 7.6m Subscribers: 2.9m Consumption: 14 TWh Area: 46.598 km2 Network length: 78.000 km
Mixed urban-rural area with several sizeable cities Strong industrial demand for power Customer numbers driven by population growth and reduction
in household size (from 3.4 to 2.5 people/household) Potential for improvement of operational performance
Attractive urban-rural region with strong industry demand
Ayedas distribution company 1
Customer base broadened to almost 9m subscribers
0,0
0,4
2,1
0,0
1,3
1,7
3,9
0,8
Industrial
Commercial
Residential
Public & Other
Subscribers: 2.5m Consumption: 7.8 TWh 2
1. 2012 figures unless otherwise stated2. 2011 figures
Toroslar distribution company 1
0,0
0,4
2,3
0,1
6,5
1,2
4,2
2,2
Industrial
Commercial
Residential
Public & Other
Subscribers: 2.9m Consumption: 14 .0TWh 2
54
Non
-EU
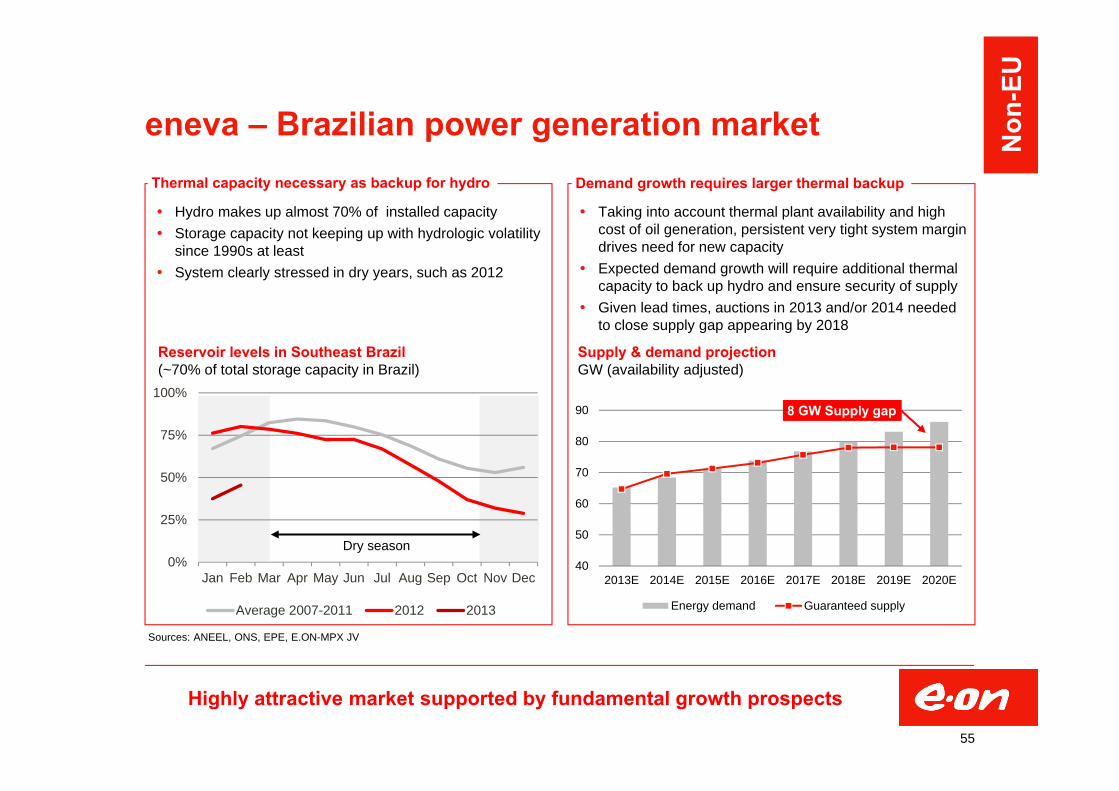
eneva – Brazilian power generation market
Hydro makes up almost 70% of installed capacity Storage capacity not keeping up with hydrologic volatility
since 1990s at least System clearly stressed in dry years, such as 2012
Taking into account thermal plant availability and high cost of oil generation, persistent very tight system margindrives need for new capacity
Expected demand growth will require additional thermal capacity to back up hydro and ensure security of supply
Given lead times, auctions in 2013 and/or 2014 needed to close supply gap appearing by 2018
Thermal capacity necessary as backup for hydro Demand growth requires larger thermal backup
Highly attractive market supported by fundamental growth prospects
40
50
60
70
80
90
2013E 2014E 2015E 2016E 2017E 2018E 2019E 2020E
Energy demand Guaranteed supply
Reservoir levels in Southeast Brazil(~70% of total storage capacity in Brazil)
0%
25%
50%
75%
100%
Jan Feb Mar Apr May Jun Jul Aug Sep Oct Nov Dec
Average 2007-2011 2012 2013
Dry season
Supply & demand projectionGW (availability adjusted)
Sources: ANEEL, ONS, EPE, E.ON-MPX JV
8 GW Supply gap
55
Non
-EU

0,0
0,5
1,0
1,5
Q3 2012 Q1 2013 Q3 2013
Parnaíba IV
Parnaíba IIopen cycleParnaíba IIINova VeneciaPecém II
Pecém I B
Parnaíba I
Itaqui
Pecém I A
Taua
Amapari
~2.0 GW expected to be in operation by end 2013 1.1 GW coal: Pecém I & II, and Itaqui 0.9 GW gas: Parnaíba I, II & III and IV
Strong and valuable support by E.ON already materialized in construction and commissioning of plants
eneva portfolio
~10 GW development pipeline: Gas: Parnaíba extensions 2.2 GW, Açu 3.3 GW Coal: Sul & Seival 1.3 GW, Açu 2.1 GW Wind: Ventos / further greenfield 1.2 GW
Superior access to fuel fostering competitiveness Participation in Parnaiba gas field basin Access to Seival coal mine
Capacity in operation and under construction Capacity under development
eneva well positioned for future growth
eneva attributable capacityGW
56
Non
-EU
Gas
Import coal
Domestic coal
Renewables
5.5GW
2.1GW
1.3GW
1.2GW
57
Dr. Marc SpiekerHead of IR T+49 2 11-45 79-3 45
[email protected] BlankenhornRegions/Sales, SRI, Retail, T +49 2 11-45 79-4 81Facts & Figures [email protected]
François PoulletGeneration, Gas T +49 2 11-45 79-3 32
Marc KoebernickRenewables, Trading T +49 2 11-45 79-2 39
Dr. Stephan SchönefußPolitics & Regulation, Regions/Distribution T +49 2 11-45 79-48 08
Carmen SchneiderTechnology & Innovation, Roadshow planning & management, T +49 2 11-45 79-3 45Shareholder ID & Targeting [email protected]
E.ON Investor Relations Contact
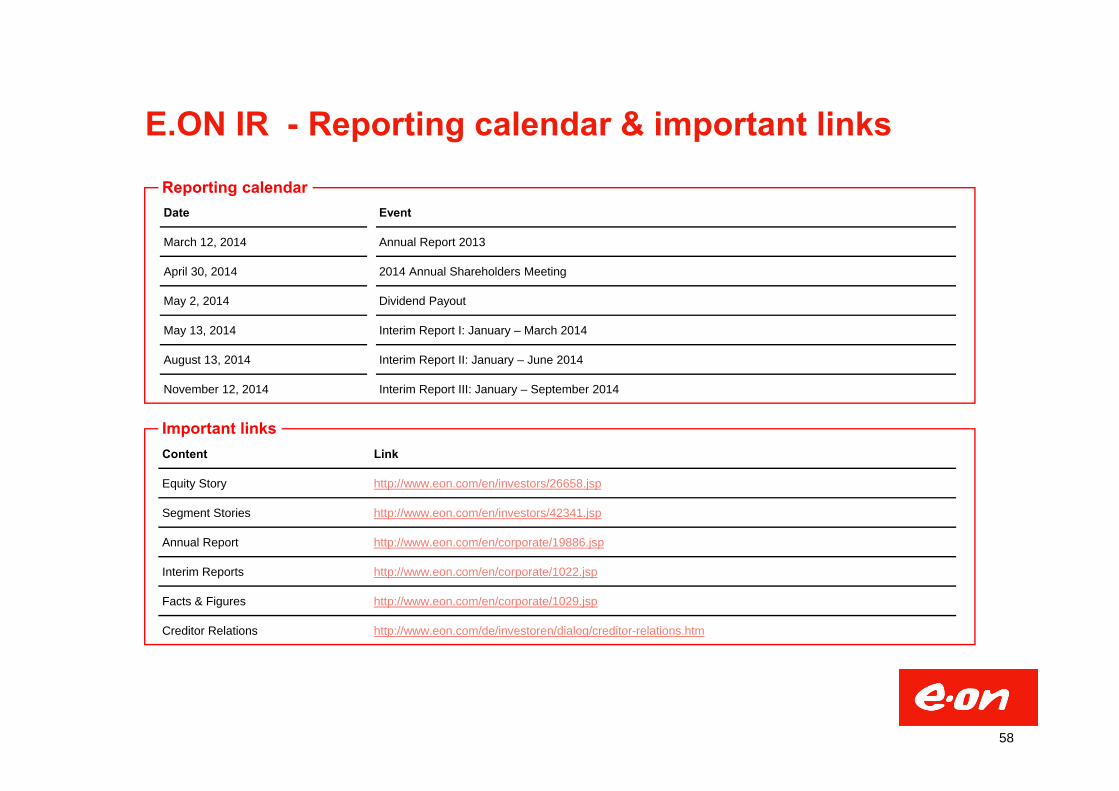
E.ON IR - Reporting calendar & important links
Date Event
March 12, 2014 Annual Report 2013
April 30, 2014 2014 Annual Shareholders Meeting
May 2, 2014 Dividend Payout
May 13, 2014 Interim Report I: January – March 2014
August 13, 2014 Interim Report II: January – June 2014
November 12, 2014 Interim Report III: January – September 2014
Content Link
Equity Story http://www.eon.com/en/investors/26658.jsp
Segment Stories http://www.eon.com/en/investors/42341.jsp
Annual Report http://www.eon.com/en/corporate/19886.jsp
Interim Reports http://www.eon.com/en/corporate/1022.jsp
Facts & Figures http://www.eon.com/en/corporate/1029.jsp
Creditor Relations http://www.eon.com/de/investoren/dialog/creditor-relations.htm
Important links
Reporting calendar
58
This presentation may contain forward-looking statements based on current assumptions and forecasts madeby E.ON Group management and other information currently available to E.ON. Various known and unknownrisks, uncertainties and other factors could lead to material differences between the actual future results,financial situation, development or performance of the company and the estimates given here. E.ON SE doesnot intend, and does not assume any liability whatsoever, to update these forward-looking statements or toconform them to future events or developments.
Disclaimer