Embed Size (px)
Citation preview

Capital Market StoryJanuary 2016

Empowering
customers
E.ON to split into two publicly listed companies
E.ON to spin off a majority stake in Uniper, its power & gas up-and midstream businesses, to its shareholders
Intention to divest remaining stake in Uniper over the medium term post spin-off
Spin-off expected to be completed in 2016
1
Two highly competitive companies with distinct identities
Shaping
markets
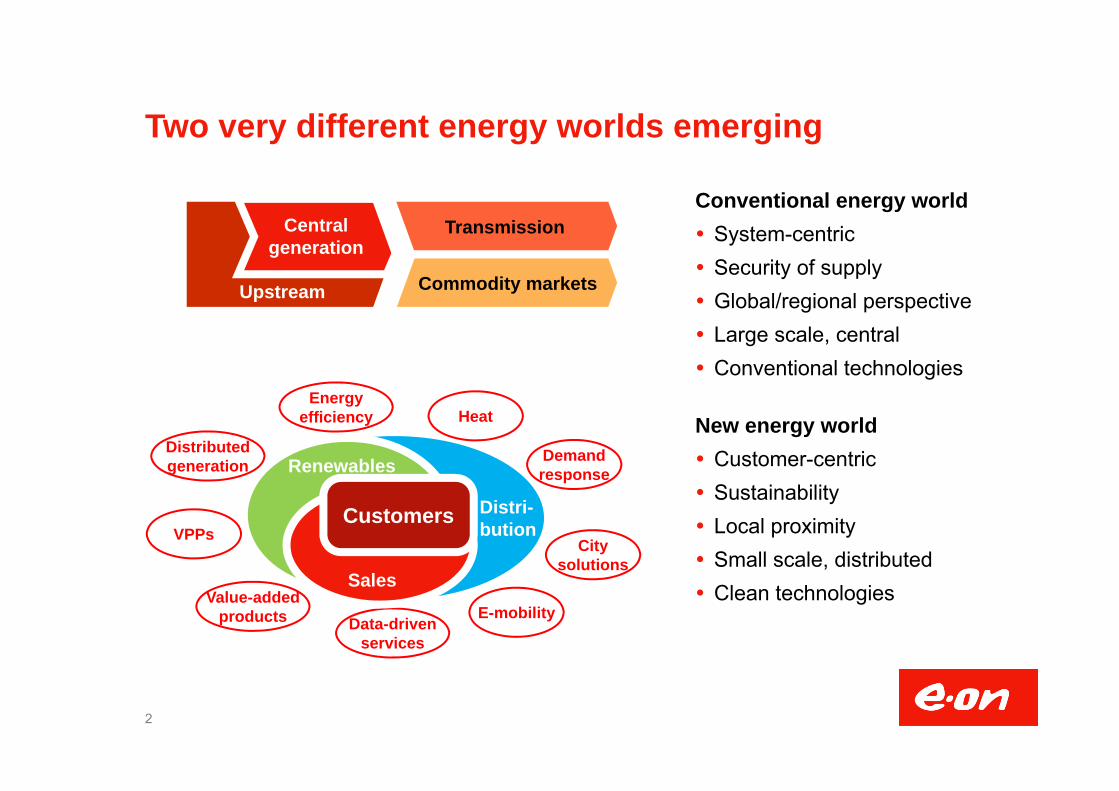
Transmission
Commodity markets
Conventional energy world System-centric Security of supply Global/regional perspective Large scale, central Conventional technologies
New energy world Customer-centric Sustainability Local proximity Small scale, distributed Clean technologies
Customers
Two very different energy worlds emerging
2
Data-drivenservices
Value-addedproducts
Demandresponse
HeatEnergy
efficiency
Distributedgeneration
VPPsCustomers Distri-
bution
SalesE-mobility
Renewables
Citysolutions
Upstream
Centralgeneration

Two leading companies for two energy worlds1
3 1. Details regarding allocation of businesses still under discussion
Distinct opportunities, mindsets and capabilities
Generation
Renewables
Distribution
CustomerSolutions Power Generation
Upstream
Global Commodities
German Nuclear
German Nuclear
Hydro
Wind/Solar/Other
Global Commodities
E&P
Germany
Other EU Countries
Russia
Turkey
Brazil

Accelerating E.ON’s transformation
4
Compelling benefits from the transaction
Stronger and more focused companies
More responsive to changing customer requirements and market dynamics
Expands strategic options
Improves alignment between rewards and results
Simplifies organiza-tional structures
Accelerates decision making
Optimizes the financial profiles of each company to enable distinct investment and growth opportunities
Enhances capital allocation efficiency
Provides two different and compelling invest-ment opportunities
Strategic FinancialOperational

Business portfolio of future E.ON1
~4.0 GW capacity~15 GW global pipelineEurope onshore 1.1 GWEurope offshore 0.5 GWUS onshore 2.3 GW
>1 million km networks~26m grid customersGermany 440,000 kmSweden 137,000 kmOther EU2 311,000 kmTurkey2 200,000 km
5
~33 millionsales customersUK 7.7mGermany 6.3mOther EU2 10.1mTurkey2 9.0m
Portfolio focused on the new energy world
Renewables Distribution Customer Solutions
1. Details regarding allocation of businesses still under discussion. 2014 figures, corrected for Spain and Italian renewables assets (solar business divestment completed, wind assets under strategic review)
2. E.ON holds 49% in ZSE and 50% in Enerjisa. Figures for ZSE and Enerjisa included at 100%
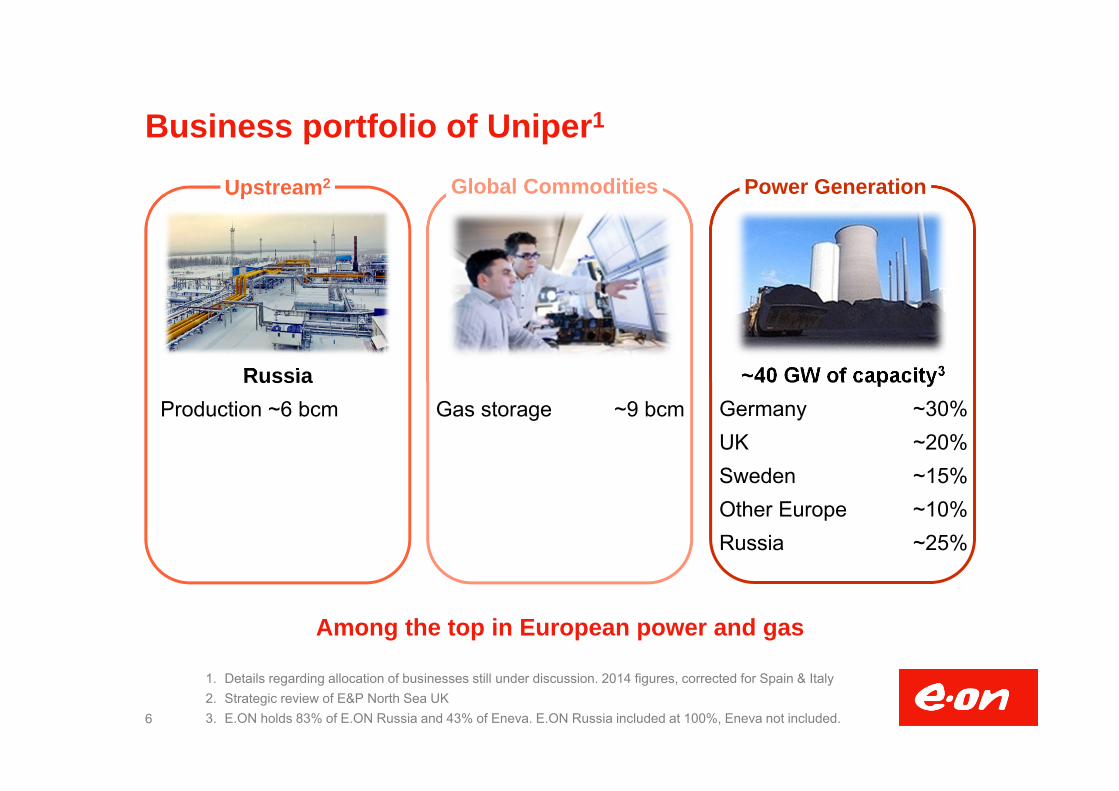
Business portfolio of Uniper1
~40 GW of capacity3
Germany ~30%UK ~20%Sweden ~15%Other Europe ~10%Russia ~25%
RussiaProduction ~6 bcm
6
Gas storage ~9 bcm
Among the top in European power and gas
Power GenerationUpstream2 Global Commodities
1. Details regarding allocation of businesses still under discussion. 2014 figures, corrected for Spain & Italy2. Strategic review of E&P North Sea UK3. E.ON holds 83% of E.ON Russia and 43% of Eneva. E.ON Russia included at 100%, Eneva not included.

Capital structure Most existing financial debt at E.ON, incl.
all bonds Uniper to raise additional financial debt Nuclear provisions with E.ON but also
vast majority of cash and financial assets Pension provisions to follow employeesEarnings & cash flow German nuclear earnings and cash flow
to stay with E.ON Non-cash accretion to German nuclear
provisions stays with E.ON Cash-outs for nuclear decommissioning
also to stay with E.ON Cash interest from liquid funds and non
current securities to stay with E.ON
Financial indications
7
Schematic selected key balance sheet items Key messages
Asset retirementobligations
Non currentsecurities
Liquid funds
Financial liabilities
Pension provisions
E.ON today
Future E.ON Uniper

Dividend during transition phase
Dividend of 0.50 €/share for 2014 and 2015 intended
Fixed dividend to bridge transition phase
Fixed dividend to remove uncertainty stemming from divestments
8
0.50 €/share dividend for 2014 and 2015
0.60€/share
0.50€/share
2013paid in20141
2014paid in20151
2015to be paid
in 2016
1. Scrip dividend scheme in 2014 & 2015: participation rate of 37% in each year leading to total cash savings of roughly €0.6bn

Spin off – Key milestones
9
Q2 2015
Organization & steering concepts for both companies defined, e.g. Organizational
set-up and segmentation
Steering concepts
Management teams
Carve out concept
Both companies operationally independent Carve-out
effective
Employees allocated to both companies
Binding tax rulings obtained
AGM invitation Detailed
financial & legal documentation
Spin-off ratio defined
Capital market day & roadshows Equity story, incl.
strategy, KPIs, dividend policy, capital structure etc.
AGM decision
Roadshows & capital market communication
BaFin approval of prospectus
Listing
From today’s perspective, we stay on schedule
H2 2015
1 Jan 2016
May 2016
8 June 2016
H2 2016
Reconfiguration of transaction structure Carve-out to
be modified
Target capital structures to be modified

Headquarters: EssenManagement team:
Johannes Teyssen Michael SenChief Executive Officer Chief Financial Officer
Karsten Wildberger Leo BirnbaumChief Markets Officer1 Chief Regions Officer
Headquarters and management teams
10
UniperHeadquarters: Düsseldorf
Management team:Klaus Schäfer Christopher DelbrückChief Executive Officer Chief Financial Officer
Eckhardt Rümmler Keith MartinChief Operations Officer Chief Commercial Officer2
1. Karsten Wildberger will join the Management Board in Q2, 2016. Bernhard Reutersberg, currently Chief Markets Officer, will end his service on the E.ON Management Board effective June 30, 2016. He is appointed to become the Chairman of the Uniper Supervisory Board
2. Keith Martin will assume his duties on March 1, 2016

Strategy and business developments
Disciplined investing in growth areas
Renewables: continue to strengthen offshore position
Distribution: strong foundations for steady growth
Customer Solutions: empowering customers
Generation: capacity markets gaining momentum
11
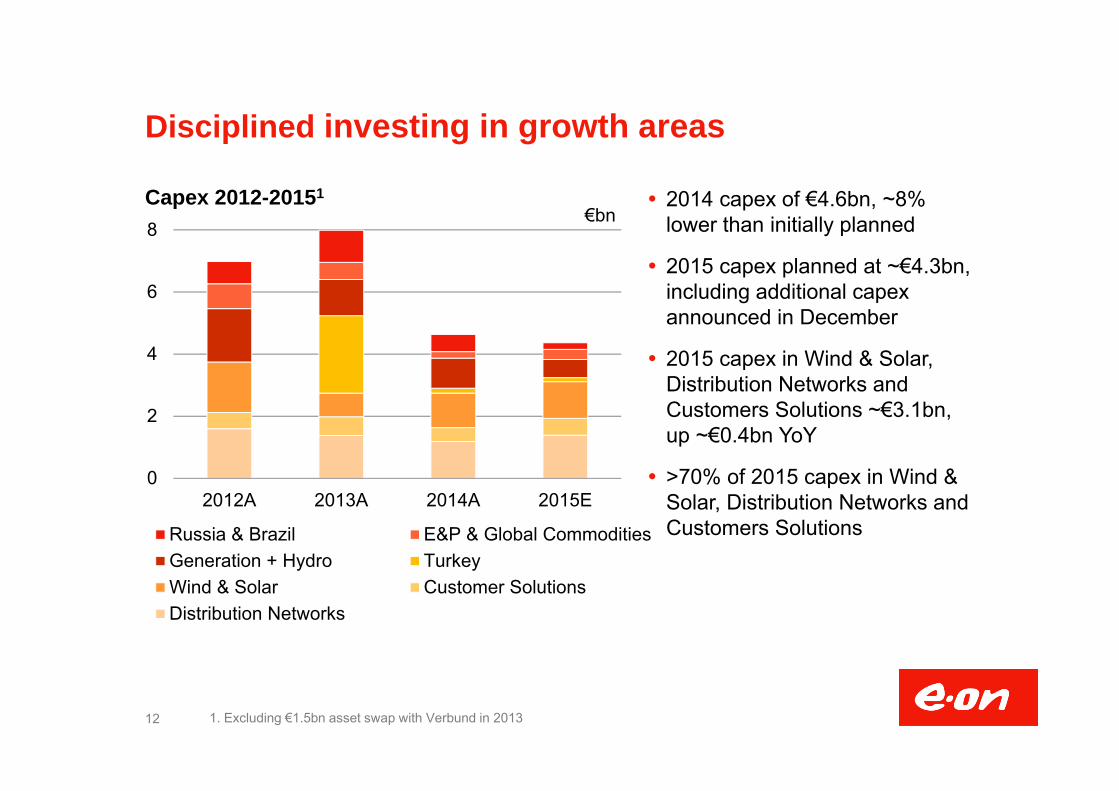
Capex 2012-20151
Disciplined investing in growth areas
2014 capex of €4.6bn, ~8% lower than initially planned
2015 capex planned at ~€4.3bn, including additional capex announced in December
2015 capex in Wind & Solar, Distribution Networks and Customers Solutions ~€3.1bn, up ~€0.4bn YoY
>70% of 2015 capex in Wind & Solar, Distribution Networks and Customers Solutions
12 1. Excluding €1.5bn asset swap with Verbund in 2013
€bn
0
2
4
6
8
2012A 2013A 2014A 2015E
Russia & Brazil E&P & Global CommoditiesGeneration + Hydro TurkeyWind & Solar Customer SolutionsDistribution Networks
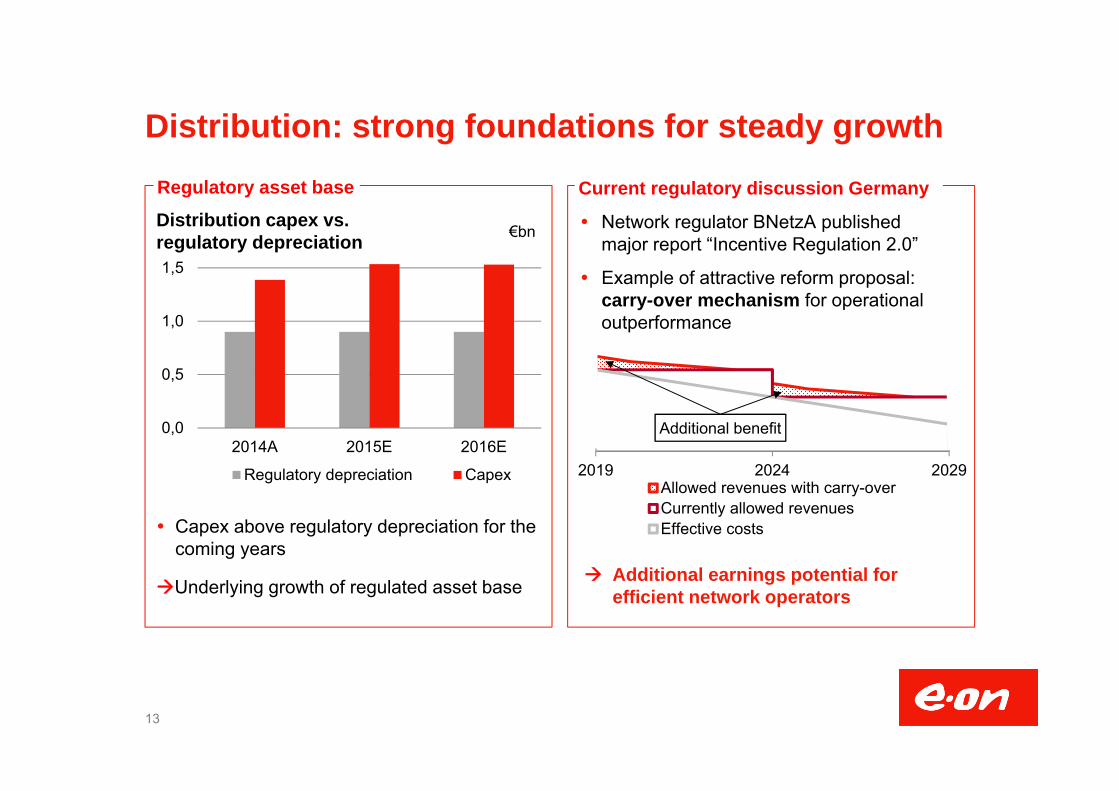
Distribution: strong foundations for steady growth
Distribution capex vs.regulatory depreciation
Capex above regulatory depreciation for the coming years
Underlying growth of regulated asset base
13
0,0
0,5
1,0
1,5
2014A 2015E 2016E
Regulatory depreciation Capex
Regulatory asset base
2019 2024 2029Allowed revenues with carry-overCurrently allowed revenuesEffective costs
Additional benefit
Current regulatory discussion Germany
Network regulator BNetzA published major report “Incentive Regulation 2.0”
Example of attractive reform proposal: carry-over mechanism for operational outperformance
Additional earnings potential for efficient network operators
€bn

14
Renewables: continue to strengthen offshore position
Preparing further organic growth opportunitiesfor future E.ON
Humber Gateway
Rampion
Amrumbank West
Arkona
219 MW
COD in September
Two months ahead of schedule and below budget
288 MW
COD in early October
In time and budget
400 MW and 116 turbines
Final investment decision taken in May, total investment approx. £1.3bn
Canadian energy company Enbridge has acquired a 24.9% stake in the project, E.ON share 50.1%
COD planned for 2018
Up to maximum capacity of 385 MW
Development phase reached important milestone -> nearby port selected as base for construction and future operation
Final investment decision not taken yet
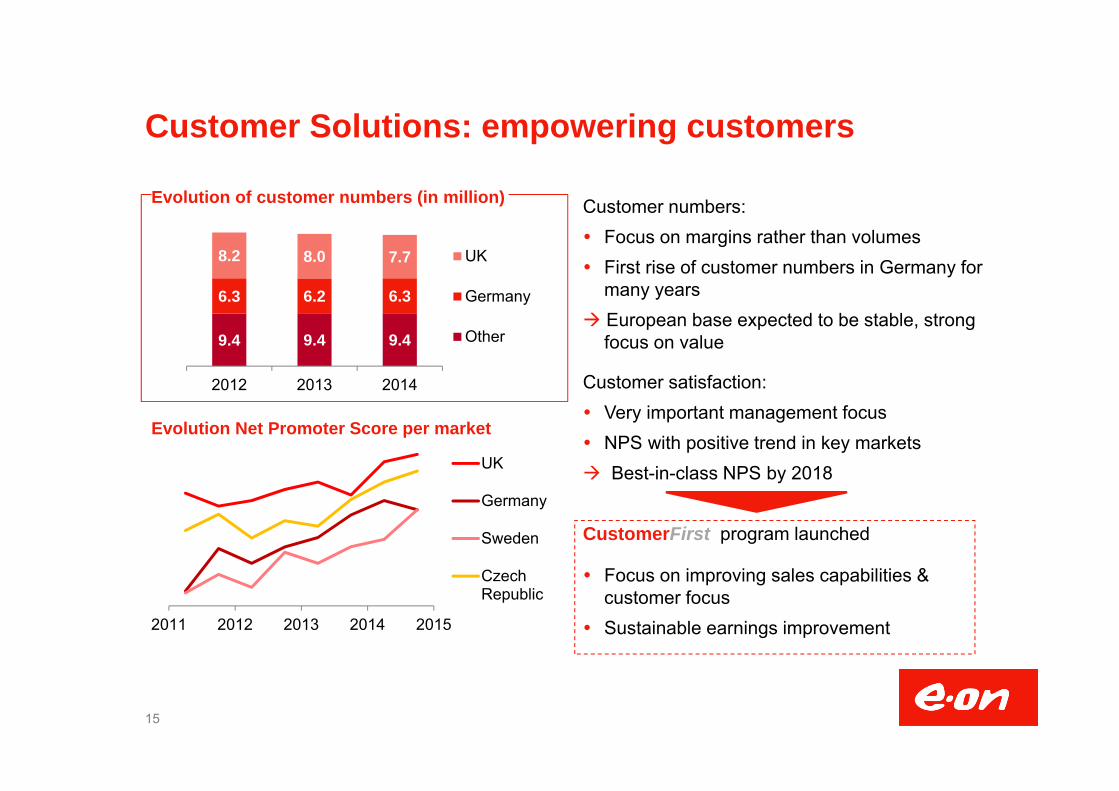
Customer Solutions: empowering customers
Customer numbers: Focus on margins rather than volumes First rise of customer numbers in Germany for
many years European base expected to be stable, strong
focus on value
Customer satisfaction: Very important management focus NPS with positive trend in key markets Best-in-class NPS by 2018
CustomerFirst program launched
Focus on improving sales capabilities & customer focus
Sustainable earnings improvement
15
9.4 9.4 9.4
6.3 6.2 6.3
8.2 8.0 7.7
2012 2013 2014
UK
Germany
Other
Evolution of customer numbers (in million)
Evolution Net Promoter Score per market
2011 2012 2013 2014 2015
UK
Germany
Sweden
CzechRepublic
Backup
Outlook
Financials
Economic net debt
Dividend
Operations
Nuclear
IR contacts
Reporting calendar & Important links
16
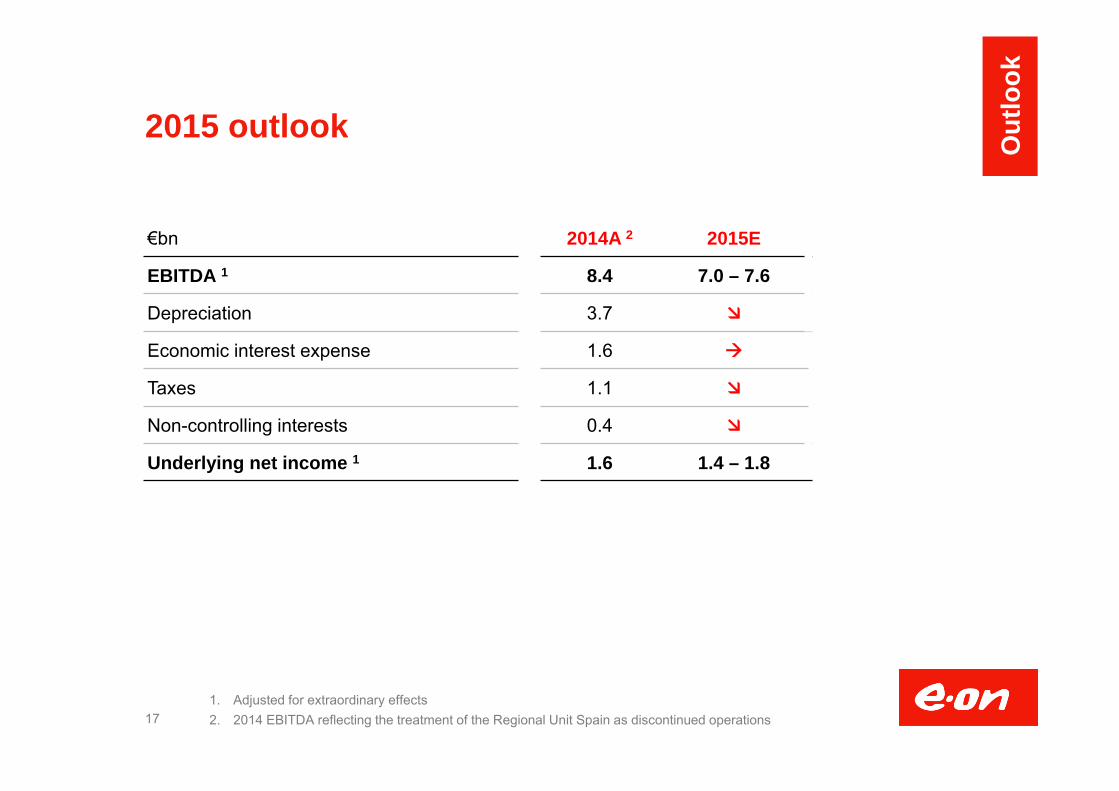
2015 outlook
17
€bn 2014A 2 2015E
EBITDA 1 8.4 7.0 – 7.6
Depreciation 3.7
Economic interest expense 1.6
Taxes 1.1
Non-controlling interests 0.4
Underlying net income 1 1.6 1.4 – 1.8
1. Adjusted for extraordinary effects2. 2014 EBITDA reflecting the treatment of the Regional Unit Spain as discontinued operations
Out
look
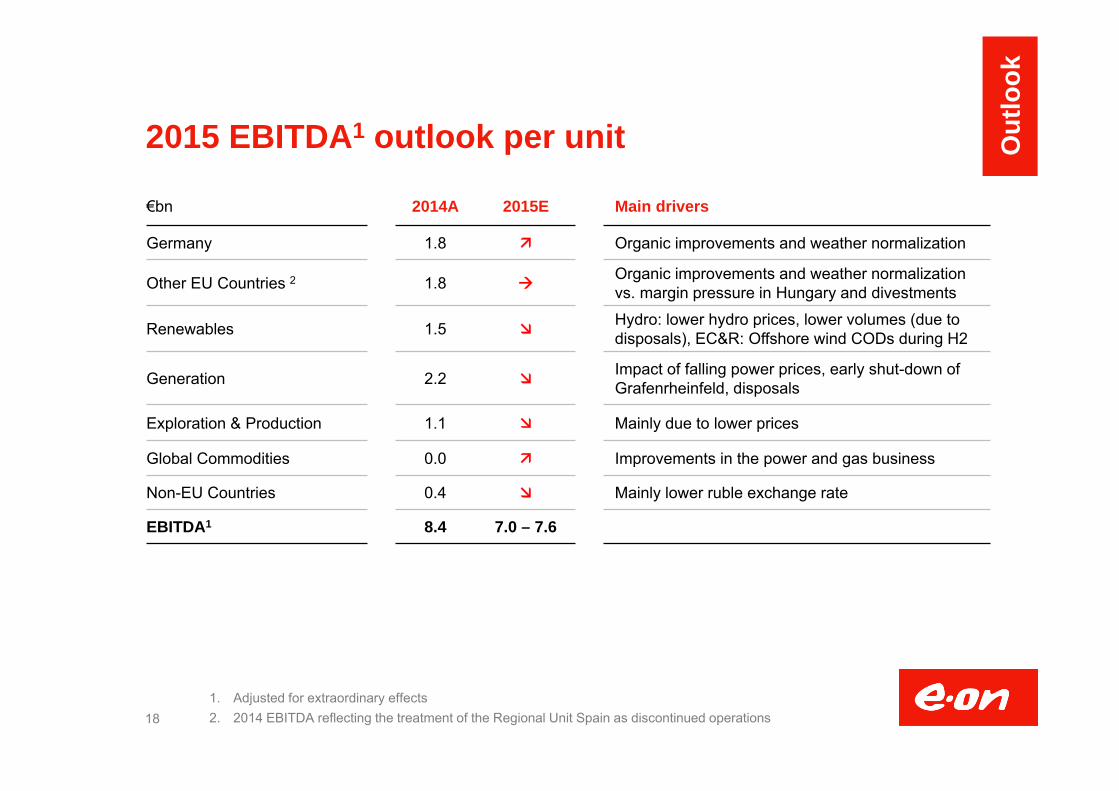
2015 EBITDA1 outlook per unit
18
€bn 2014A 2015E Main drivers
Germany 1.8 Organic improvements and weather normalization
Other EU Countries 2 1.8 Organic improvements and weather normalization vs. margin pressure in Hungary and divestments
Renewables 1.5 Hydro: lower hydro prices, lower volumes (due to disposals), EC&R: Offshore wind CODs during H2
Generation 2.2 Impact of falling power prices, early shut-down of Grafenrheinfeld, disposals
Exploration & Production 1.1 Mainly due to lower prices
Global Commodities 0.0 Improvements in the power and gas business
Non-EU Countries 0.4 Mainly lower ruble exchange rate
EBITDA1 8.4 7.0 – 7.6
1. Adjusted for extraordinary effects2. 2014 EBITDA reflecting the treatment of the Regional Unit Spain as discontinued operations
Out
look
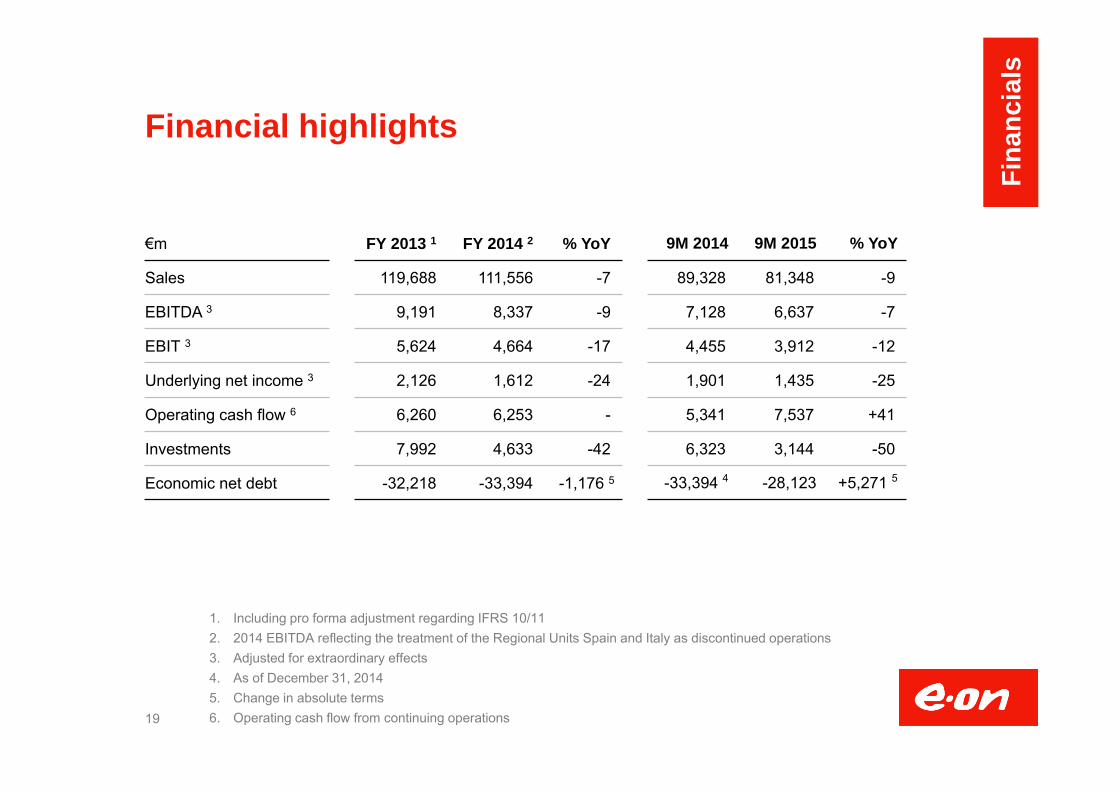
Financial highlights
19
1. Including pro forma adjustment regarding IFRS 10/112. 2014 EBITDA reflecting the treatment of the Regional Units Spain and Italy as discontinued operations 3. Adjusted for extraordinary effects4. As of December 31, 20145. Change in absolute terms6. Operating cash flow from continuing operations
€m FY 2013 1 FY 2014 2 % YoY 9M 2014 9M 2015 % YoY
Sales 119,688 111,556 -7 89,328 81,348 -9
EBITDA 3 9,191 8,337 -9 7,128 6,637 -7
EBIT 3 5,624 4,664 -17 4,455 3,912 -12
Underlying net income 3 2,126 1,612 -24 1,901 1,435 -25
Operating cash flow 6 6,260 6,253 - 5,341 7,537 +41
Investments 7,992 4,633 -42 6,323 3,144 -50
Economic net debt -32,218 -33,394 -1,176 5 -33,394 4 -28,123 +5,271 5
Fina
ncia
ls

FY 2014 EBITDA and EBIT by unit
20
1. Adjusted for extraordinary effects2. Including pro forma adjustment regarding IFRS 10/113. Reflecting the treatment of the Regional Units Spain and Italy as discontinued operations
€m EBITDA 1 EBIT 1
FY 2013 2 FY 2014 % YoY FY 2013 2 FY 2014 % YoY
Generation 1,936 2,215 +14 1,017 1,201 +18
Renewables 1,464 1,500 +2 1,014 1,044 +3
Global Commodities 311 21 -93 192 -75 -
Exploration & Production 1,070 1,136 +6 560 498 -11
Germany 2,387 1,846 -23 1,667 1,184 -29
Other EU Countries 3 2,012 1,732 -14 1,436 1,131 -21
Non-EU Countries 533 439 -18 338 293 -13
Group Management / Consolidation -522 -552 - -600 -612 -
Total 9,191 8,337 -9 5,624 4,664 -17
Fina
ncia
ls

First nine months 2015 EBITDA and EBIT by unit
211. Adjusted for extraordinary effects2. Reflecting the treatment of the Regional Unit Spain as discontinued operations
€m EBITDA 1 EBIT 1
9M 2014 9M 2015 % YoY 9M 2014 9M 2015 % YoY
Generation 1,553 1,057 -32 843 522 -38
Renewables 1,107 923 -17 764 628 -18
Global Commodities 444 259 -42 373 181 -52
Exploration & Production 942 714 -24 459 222 -52
Germany 1,257 1,428 14 787 982 25
Other EU Countries 2 1,226 1,248 2 777 776 -0
Non-EU Countries 339 183 -46 226 116 -49
Group Management / Consolidation -340 -451 - -383 -503 -
Total 6,528 5,361 -18 3,846 2,924 -24
Fina
ncia
ls

2014 EBITDA development 1,2,3
22
1. Adjusted for extraordinary effects2. Individual effects rounded3. Reflecting the treatment of the Regional Unit Spain as discontinued operations
0.1
FY 2013 9.2
German regulation -0.3
0.4
FX effects -0.2
-0.6
Nuclear fuel tax 0.2
Renewables (EC&R) 0.1
E.ON 2.0
Disposals
E&P
-0.1
Power price and volume effect -0.2
Region Czechia -0.2
FY 2014 8.4
Other -0.1
Gas optimization
€bn
Fina
ncia
ls

EBITDA development first nine months 2015
23
1. Adjusted for extraordinary effects2. Individual effects rounded 3. Reflecting the treatment of the Regional Unit Spain as discontinued operations
First nine months 2015 EBITDA development 1,2,3 (in €bn)
Earnings trends in main effects continued, first positiveimpacts of capacity additions feeding through
9M 2014 6.5
Power portfolio
Region Germany 0.2
New capacities
-0.5
0.1
9M 2015 5.4
Other -0.4
Disposals -0.3
E&P -0.2-1.2

Underlying net income
24
1. Adjusted for extraordinary effects2. Including pro forma adjustment regarding IFRS 10/113. Reflecting the treatment of the Regional Units Spain and Italy as discontinued operations4. Reflecting the treatment of the Regional Unit Spain as discontinued operations
€m FY 2013 2 FY 2014 3 %YoY 9M 2014 4 9M 2015 4 % YoY YoY
EBITDA 1 9,191 8,337 -9 6,528 5,361 -18 -1,167
Depreciation/amortization recognized in EBIT 1 -3,567 -3,673 - -2,682 -2,437 - -
EBIT 1 5,624 4,664 -17 3,846 2,924 -24 -922
Economic interest expense (net) -1,874 -1,612 - -1,255 -1,127 - -
EBT 1 3,750 3,052 -19 2,591 1,797 -31 -794
Income taxes on EBT 1 -1,201 -1,090 - -971 -602 - -
% of EBT 1 32 36 - 37 34 - -
Non-controlling interests -423 -350 - -247 -233 - -
Underlying net income 1 2,126 1,612 -24 1,373 962 -30 -411
Fina
ncia
ls

0%
20%
40%
60%
80%
100%
2012 2013 2014
Regulated Quasi-regulated/LT contracted Merchant
More than half of EBITDA from stable businesses
Stable businesses make up around 53% of E.ON’s portfolio mix
In addition, the risk-profile of our merchant activities benefits from early hedging and generally declining commodity price risks
25
1. Adjusted for extraordinary effects2. Regulated: revenues set by law and based on costs plus a reasonable return on capital employed. Example:
regulated network activities3. Quasi-regulated and long-term contracted: revenues with high degree of predictability, price and/or volume largely
set by law or individual contractual arrangements for the medium- to long-term. Examples: renewables with support mechanisms, generation capacity sold under long-term PPAs (Power Purchase Agreements)
EBITDA1 split
2
Stablebusinesses53%
Progressive hedging and risk reduction
3
Fina
ncia
ls
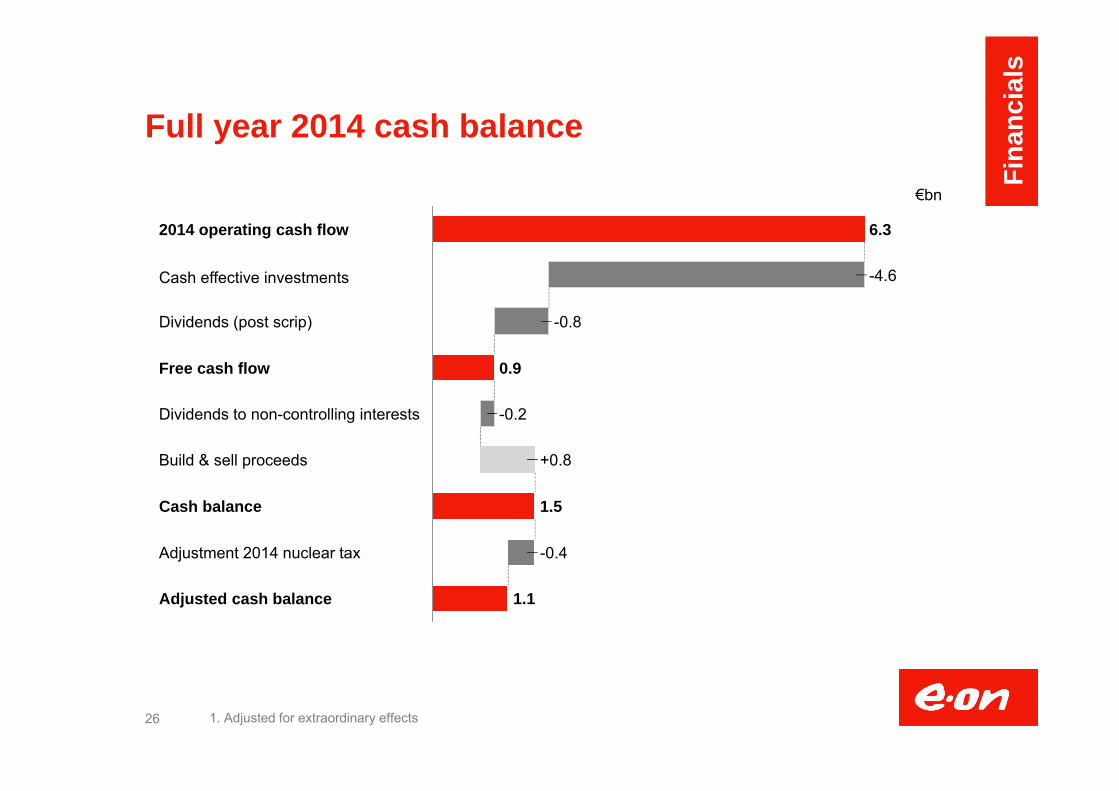
Full year 2014 cash balance
26
Build & sell proceeds
-0.2
+0.8
Dividends to non-controlling interests
Free cash flow 0.9
Dividends (post scrip) -0.8
Cash effective investments -4.6
2014 operating cash flow 6.3
Adjustment 2014 nuclear tax
1.5Cash balance
Adjusted cash balance
-0.4
1.1
1. Adjusted for extraordinary effects
€bn
Fina
ncia
ls
Economic net debt
27
1. Net figure; does not include transactions relating to our operating business or asset management2. Net of Swedish nuclear fund3. Including pro forma adjustment regarding IFRS 10/11
€m 31 Dec 2013 3 31 Dec 2014 30 Sep 2015
Liquid funds 7,814 6,067 7,728
Non-current securities 4,444 4,781 4,837
Financial liabilities -22,724 -19,667 -17,785
Adjustment FX hedging 1 -46 34 261
Net financial position -10,512 -8,785 -4,959
Provisions for pensions -3,418 -5,574 -4,578
Asset retirement obligations 2 -18,288 -19,035 -18,586
Economic net debt -32,218 -33,394 -28,123
Econ
omic
net
deb
t

FY 2014 economic net debt development
28
-8.8 -33.4-24.6
Divestments
Operating cash flow +6.3
-2.5
Investments
+2.8
Other
-4.6
Dividends -1.0
December 31, 2013 -32.2 1-21.7 -10.5
Pension obligations
December 31, 2014
-2.2N
et financial position
Provisions and other
€bn
1. Figures as of December 31, 2013 include pro forma adjustment regarding IFRS 10/11 (before adjustments YE 2013 economic net debt was €32.0bn)
2. Operating cash flow from continuing operations
2
Econ
omic
net
deb
t

29ARO= Asset retirement obligations; END = Economic net debt; NFP=Net financial position; B&S= Build and sell
Economic net debt development first 9M 2015
Econ
omic
net
deb
t
+5.3
Provisions
-23.2
NFP
-5.0
END2015Divest
1.02.4
Pensions OthersDividend
-0.5
B&S
0.1
CAPEX
-2.7
OCF
5.7
-0.9-33.4
NFP
-8.8
Provisions
-24.6
-28.1
END2014
Pensions-5.6 bn
ARO:-19.0 bn
Pensions:-4.6 bn
ARO:-18.6 bn
Cash Balance: 2.3 bn
First nine month debt benefitting from strong cash flow, disposals and reduced pension provisions
First nine months 2015 (in €bn)

Liquidity 2015 2016 2017 2018
Strong liquidity and well-balanced maturity profile
0
1
2
3
4
5
2015 2016 2017 2018 2019 2020 2021 2022 ≥2023
EUR GBP USD YEN Other
30
Flexible funding optionsDebt issuance
program€35bn
EUR CPprogram€10bn
USD CPprogram$10bn
Revolvingcredit facility
€5bn
No benchmark bond issuance since mid 20093
Bond & promissory notes maturities
Upcoming debt maturities easily manageable
Long-term and well-balanced debt maturity profile
No funding needs envisaged
Liquidity and financial flexibility1
1. €bn, as of Sep 30, 2015 2. Bonds and promissory notes issued by E.ON SE , E.ON International Finance B.V. and E.ON Beteiligungen
GmbH (fully guaranteed by E.ON SE)3. E.ON Beteiligungen GmbH issued a bond exchangeable into shares of Swiss energy company BKW AG with
a volume of c. €0.1bn in 2014
Maturity Profile1,2
Revolvingcredit facility
(undrawn)
Liquid funds& non-current
securities
5
12.60.0 1.2
2.7 2.3
Econ
omic
net
deb
t
0% 20% 40% 60% 80% 100%
2012A 2013A 2014A 2015E
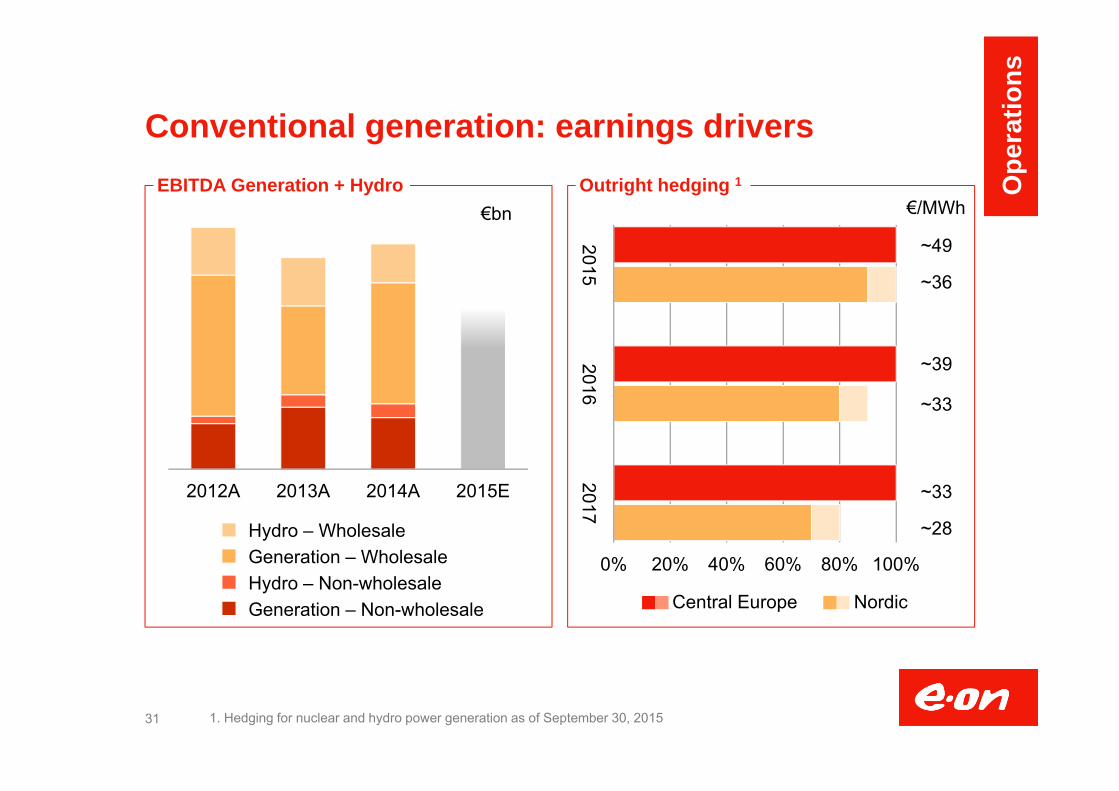
Conventional generation: earnings drivers
31
EBITDA Generation + Hydro Outright hedging 1
1. Hedging for nuclear and hydro power generation as of September 30, 2015
€bn
NordicCentral Europe
~49
~36
~39
~33
~33
~28
€/MWh
Ope
ratio
ns
Hydro – WholesaleGeneration – WholesaleHydro – Non-wholesaleGeneration – Non-wholesale
20152016
2017

0
2
4
6
8
10
12
2012 2013 2014 2015 YTD
Retirements of conventional generation capacity
2014 Fiume Santo 1 & 2 Oil 306 MW Jan 2014 Vilvoorde Gas 385 MW Jan 2014 Datteln 1-3 Coal 303 MW Mar 2014 Lucy 3 Coal 245 MW Mar 2014 Emile Huchet 5 Coal 330 MW Apr 2014
2015 Scholven D & E Coal 690 MW Jan 2015 Scholven F Coal 676 MW Jan 2015 Knepper C Coal 345 MW Jan 2015 Veltheim 3 Coal 202 MW Mar 2015 Veltheim 4 GT Gas 43 MW Mar 2015 GT Ummeln Gas 37 MW Mar 2015 Grafenrheinfeld Nuclear 1275 MW June 2015 Emile Huchet 4 Coal 115 MW Q3 2015
32
Capacity retirements since 2012GW, pro-rata
3.6
3.1
1.6
3.3
Ope
ratio
ns

E&P - Oil & Gas production
33
m boe FY 2013 FY 2014 % YoY 9M 2014 9M 2015 % YoY
Skarv 10.0 13.5 +36 11.4 10.3 -9
Njord/Hyme 2.4 2.8 +18 1.3 3.7 +184
Elgin-Franklin 0.6 0.9 +60 0.6 1.2 +84
Babbage 0.8 1.4 +75 1.1 0.9 -13
Huntington 0.8 1.2 +52 1.1 1.0 -14
Rita 0.3 0.7 +196 0.6 0.3 -56
Total North Sea 16.5 22.4 +40 17.4 18.1 +4
Yuzhno Russkoje 37.4 37.3 - 27.1 27.2 0
Total 52.2 60.0 +11 44.5 45.3 +2
Ope
ratio
ns
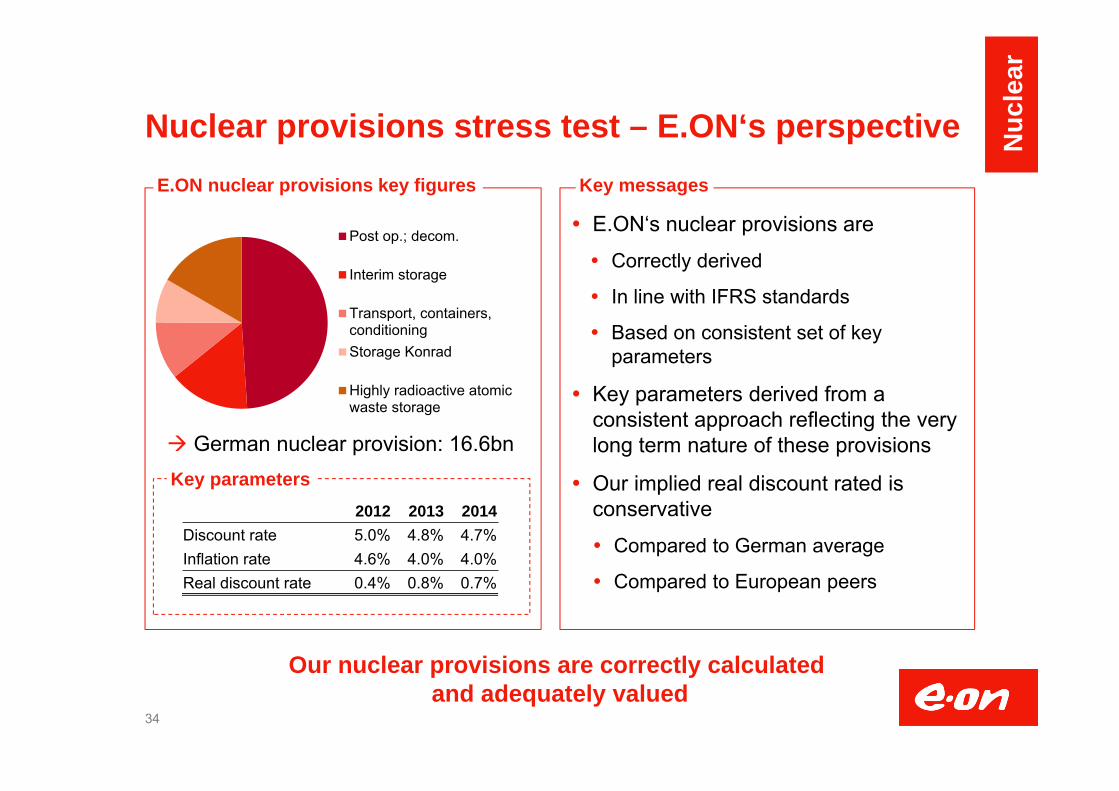
Post op.; decom.
Interim storage
Transport, containers,conditioningStorage Konrad
Highly radioactive atomicwaste storage
Nuclear provisions stress test – E.ON‘s perspective
E.ON‘s nuclear provisions are
Correctly derived
In line with IFRS standards
Based on consistent set of key parameters
Key parameters derived from a consistent approach reflecting the very long term nature of these provisions
Our implied real discount rated is conservative
Compared to German average
Compared to European peers
34
E.ON nuclear provisions key figures Key messages
Our nuclear provisions are correctly calculated and adequately valued
German nuclear provision: 16.6bnKey parameters
2012 2013 2014Discount rate 5.0% 4.8% 4.7%Inflation rate 4.6% 4.0% 4.0%Real discount rate 0.4% 0.8% 0.7%
Nuc
lear

Schematic profile of decommissioning and waste management cash outs for typical NPP in Germany after shut down (in €m per GW)
Decommissioning and waste management costs
All costs after shutdown covered by decommissioning and waste management provisions
Main components of the provisions Cool-down phase Duration ~7 years Costs similar to but lower than plant in
operation Dismantling phase Duration ~12 years Experience acquired with Stade and
Würgassen Costs estimated by independent appraiser NIS
with detailed project plans and costing Waste management costs Costs for containers, conditioning, interim and
final storage
35
0
20
40
60
80
100
00 10 20 30 40 50
€m/G
W in
cur
rent
mon
ey
Years after shutdown
Waste management Cool-down phaseDismantling phase
Nuc
lear
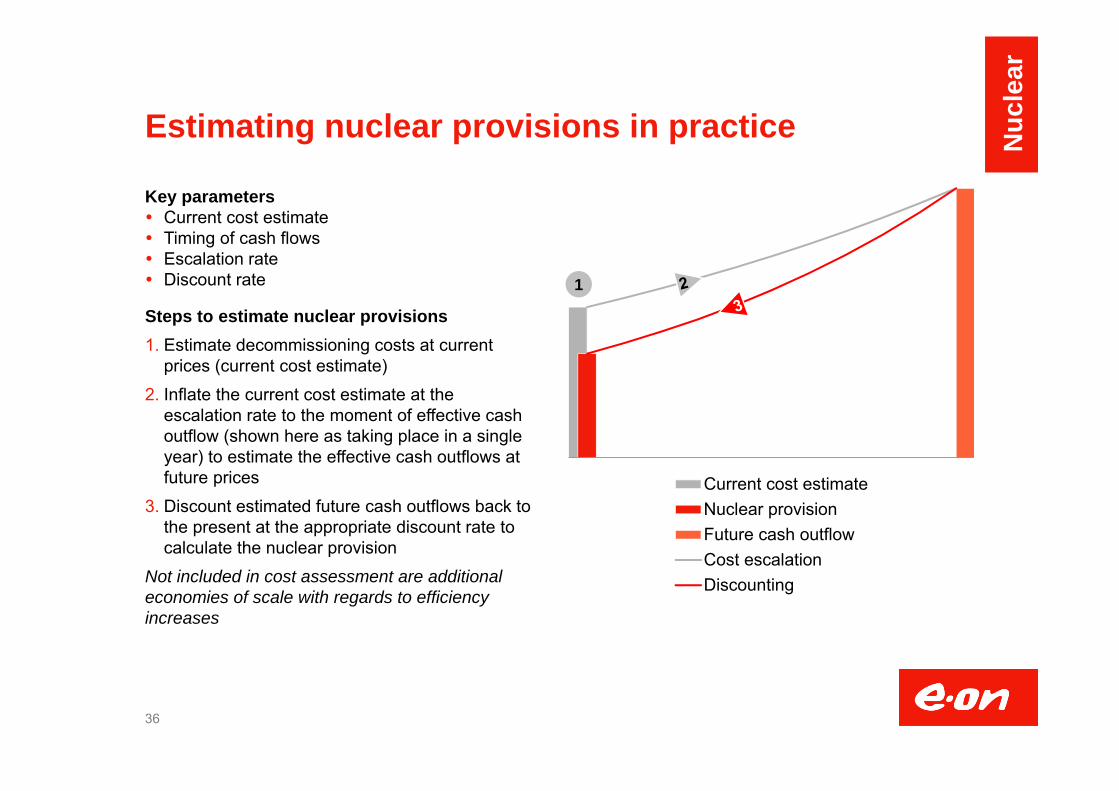
Estimating nuclear provisions in practice
Key parameters Current cost estimate Timing of cash flows Escalation rate Discount rate
Steps to estimate nuclear provisions1. Estimate decommissioning costs at current
prices (current cost estimate)2. Inflate the current cost estimate at the
escalation rate to the moment of effective cash outflow (shown here as taking place in a single year) to estimate the effective cash outflows at future prices
3. Discount estimated future cash outflows back to the present at the appropriate discount rate to calculate the nuclear provision
Not included in cost assessment are additional economies of scale with regards to efficiency increases
36
Current cost estimateNuclear provisionFuture cash outflowCost escalationDiscounting
1
Nuc
lear
From costs to provisions
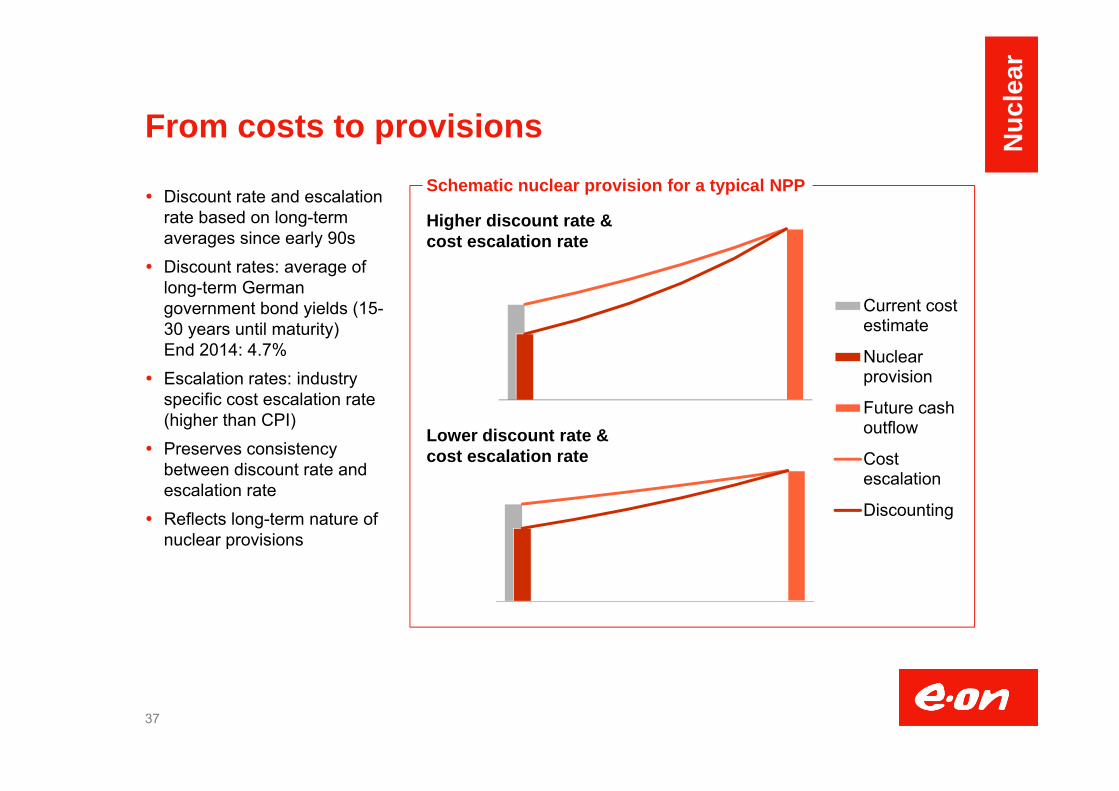
Discount rate and escalation rate based on long-term averages since early 90s
Discount rates: average of long-term German government bond yields (15-30 years until maturity)End 2014: 4.7%
Escalation rates: industry specific cost escalation rate (higher than CPI)
Preserves consistency between discount rate and escalation rate
Reflects long-term nature of nuclear provisions
37
Schematic nuclear provision for a typical NPP
Higher discount rate &cost escalation rate
Current costestimate
Nuclearprovision
Future cashoutflow
Costescalation
Discounting
Lower discount rate &cost escalation rate
Nuc
lear

E.ON’s nuclear plants in Germany
38
Start-upyear
E.ON share(%)
Capacity(MW)
Shutdownyear
Isar 2 1988 75.0 1,410 2022
Brokdorf 1986 80.0 1,410 2021
Grohnde 1985 83.3 1,360 2021
Emsland 1988 12.5 1,329 2022
Gundremmingen C 1985 25.0 1,288 2021
Gundremmingen B 1984 25.0 1,284 2017
Grafenrheinfeld 1982 100.0 1,275 2015
Isar 1 1979 100.0 878 2011
Unterweser 1979 100.0 1,345 2011
Stade 1972 66.7 630 2003
Würgassen 1975 100.0 640 1994
Brunsbüttel1 1977 33.3 771 2011
Krümmel1 1984 50.0 1,346 2011
Gundremmingen A1 1966 25.0 250 1977
Active nuclear plantsE.ON operator
Active nuclear plantsE.ON minority share
Shutdownnuclear plants
1. E.ON is not operator of these plants.
Nuc
lear
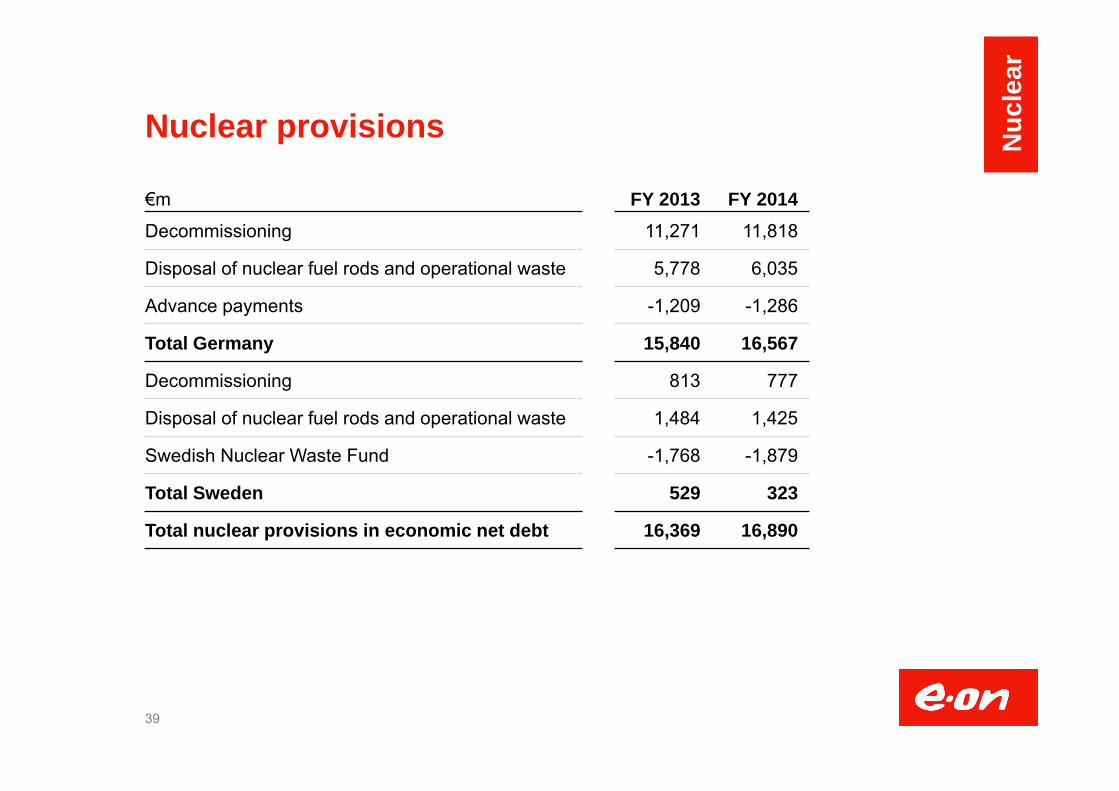
Nuclear provisions
39
Nuc
lear
€m FY 2013 FY 2014Decommissioning 11,271 11,818
Disposal of nuclear fuel rods and operational waste 5,778 6,035
Advance payments -1,209 -1,286
Total Germany 15,840 16,567
Decommissioning 813 777
Disposal of nuclear fuel rods and operational waste 1,484 1,425
Swedish Nuclear Waste Fund -1,768 -1,879
Total Sweden 529 323
Total nuclear provisions in economic net debt 16,369 16,890

E.ON Investor Relations Contact
40
Anke Groth T+49 (201) 184 28 01Head of IR [email protected]
Marc Koebernick T +49 (201) 184 28 [email protected]
Dr. Stephan Schönefuß T +49 (201) 184 28 [email protected]
Carmen SchneiderRoadshow planning & management, T +49 (201) 184 28 04Shareholder ID & Targeting [email protected]
Oliver Roeder T +49 (201) 184 28 [email protected]
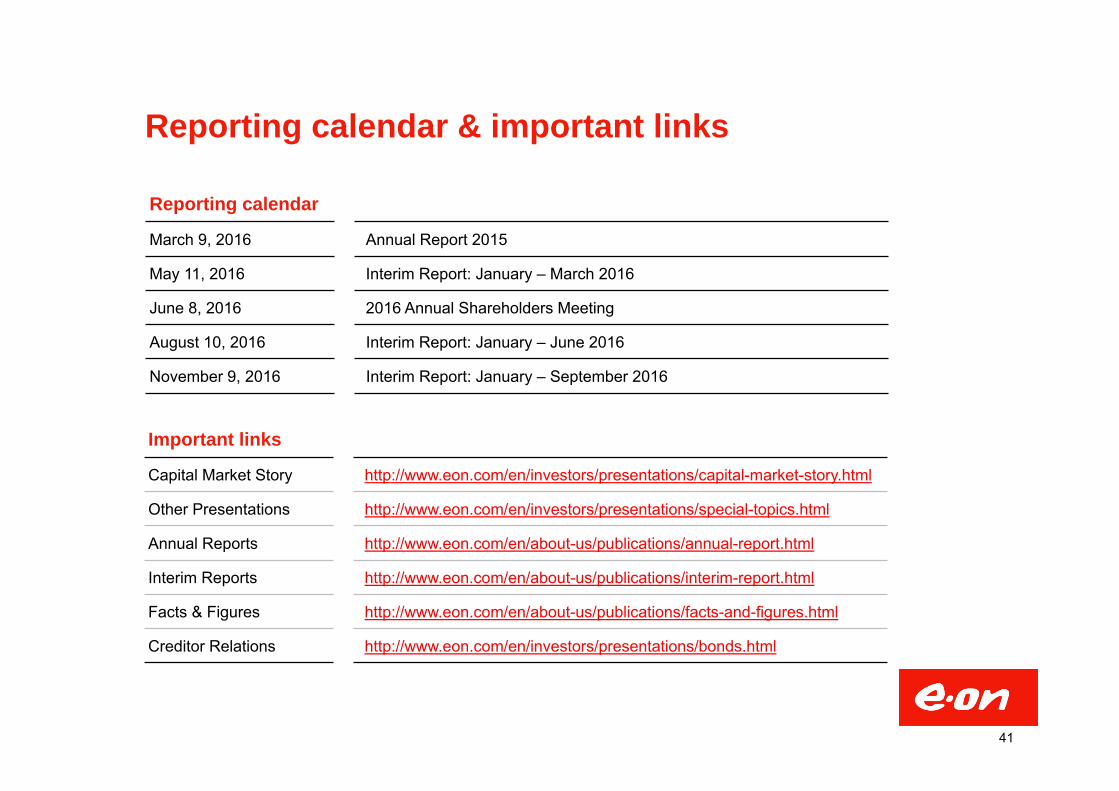
Reporting calendar & important links
Reporting calendar
March 9, 2016 Annual Report 2015
May 11, 2016 Interim Report: January – March 2016
June 8, 2016 2016 Annual Shareholders Meeting
August 10, 2016 Interim Report: January – June 2016
November 9, 2016 Interim Report: January – September 2016
Important links
Capital Market Story http://www.eon.com/en/investors/presentations/capital-market-story.html
Other Presentations http://www.eon.com/en/investors/presentations/special-topics.html
Annual Reports http://www.eon.com/en/about-us/publications/annual-report.html
Interim Reports http://www.eon.com/en/about-us/publications/interim-report.html
Facts & Figures http://www.eon.com/en/about-us/publications/facts-and-figures.html
Creditor Relations http://www.eon.com/en/investors/presentations/bonds.html
41

This presentation may contain forward-looking statements and data based on current assumptions andforecasts made by E.ON and other information currently available to E.ON. Various known and unknown risks,uncertainties and other factors could lead to material differences between the actual future results, financialsituation, development or performance of the company and the estimates given here. E.ON does not intend,and does not assume any liability whatsoever, to update these forward-looking statements and data or toconform them to future events or developments.
Disclaimer