Embed Size (px)
Citation preview

Capital Investment Analysis
ACG 2071Module 12Chapter 25
Fall 2007

Capital Budgeting
Is the process by which management plans, evaluates, and controls investments in fixed assets
Involves long term commitment of funds Must earn a reasonable rate of return

Methods
Methods – not using present value Average rate return Cash payback period
Present Value Methods Net present value
method Present value index Internal rate of return

Methods – not using PV
Used to screen proposals
Minimum standards are set for accepting or not

Average rate of return
ARR = Average annual income Average investment
Where Average investment is one half of the original cost

Example 1:
Suppose that the company is considering the purchase of a machine at a cost of $500,000. The machine is expected to have a useful life of 4 years, with no residual value and to yield total income of $200,000. Compute the average rate of return.

Average of Rate of Return
Average Rate of Return = Average annual income
Average investment Average annual income =
$200,000/4 = $50,000 Average investment = $500,000/2 = $250,000
ARR = 50,000/250,000 = 20%
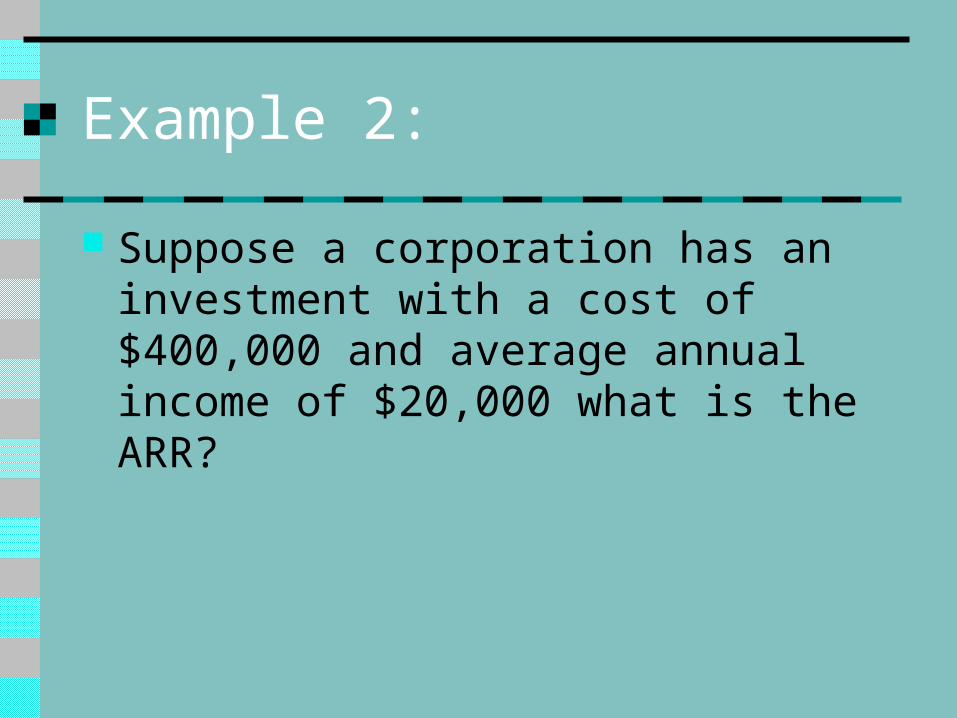
Example 2:
Suppose a corporation has an investment with a cost of $400,000 and average annual income of $20,000 what is the ARR?

Cash Payback Period
Looks for project with the shortest period to recover the original investment
Net cash Flow = excess cash flow from revenues – expenses
Cash payback period = number of years to recover cash invested

Cash Payback Period
EVEN cash flows formula:
Original investment
Net cash flow
= number of years to payback investment

Example 3:
Suppose that the company is considering the purchase of a machine at a cost of $400,000. The machine is expected to have net cash flow if $100,000. What is the cash payback period?
Original investment = $400,000 = 4 years
Net cash flow $100,000

Example 4:
Suppose machine with cost of $500,000 and net cash flow of $75,000 per year. What is the payback period?
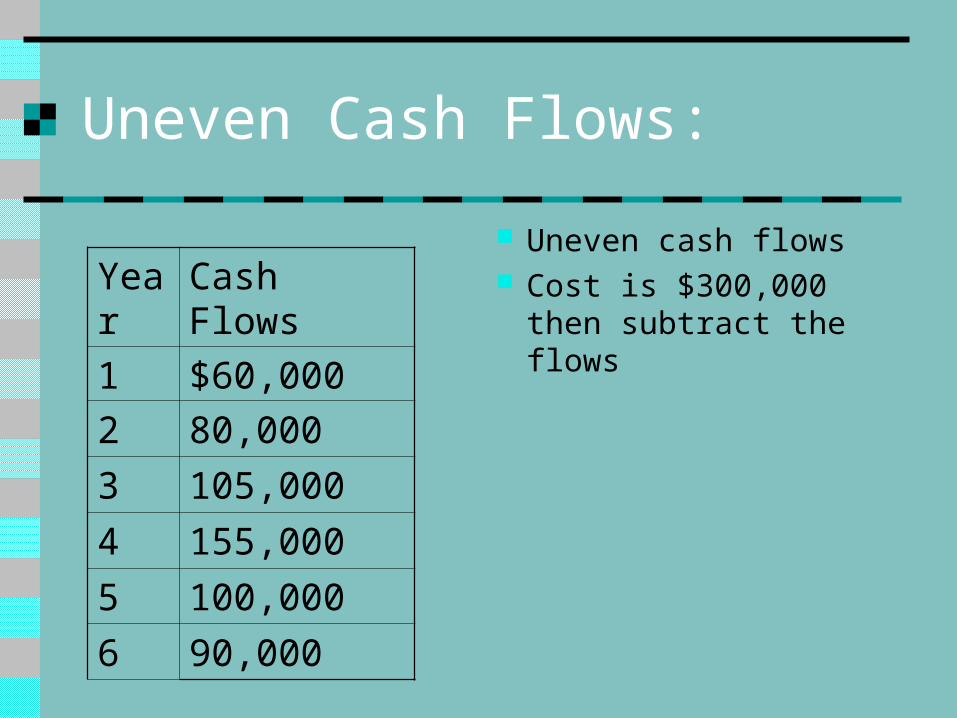
Uneven Cash Flows:
Uneven cash flows Cost is $300,000 then
subtract the flows
Year Cash Flows
1 $60,000
2 80,000
3 105,000
4 155,000
5 100,000
6 90,000

Example:
Year Cash Flows Balance at end of year
1 $60,000 $300,000 - $60,000 = $240,000
2 80,000 $240,000 - $80,000 = $160,000
3 105,000 $160,000 - $105,000 = $55,000
4 155,000 $55,000 - $155,000 = end
5 100,000
5 90,000

Present value methods
Investment in fixed assets may be reviewed as acquiring a series of net cash flows over a period of time
Time is an important factor in determining the value of an investment

Present value of $1
It allows you to compare monies received today to monies received at a future date
Due to the fact that money has a value - interest
The quicker that you receive the money the more it is worth

Net Present Value Method
Analyze capital investment proposals by comparing the initial cash investment with the present value of the net cash flows Called discounted cash flow method
Rate is set my management If Net present value > original investment
then go ahead with project

Discounted Cash Flow Method
Total present value of net cash flow =
Net cash flow x PV of Annuity
Then:
Net cash flow X PV of Annuity
LESS original investment
> 0 then take the project

Present Value of an Annuity
Year 6% 10% 12% 15% 20%
1 0.943 0.909 0.893 0.870 0.833
2 1.833 1.736 1.690 1.626 1.528
3 2.673 2.487 2.402 2.283 2.106
4 3.465 3.170 3.037 2.855 2.589
5 4.212 3.791 3.605 3.353 2.991
6 4.917 4.355 4.111 3.785 3.326
7 5.582 4.868 4.564 4.160 3.605
8 6.210 5.335 4.968 4.487 3.837
9 6.802 5.759 5.328 4.772 4.031
10 7.360 6.145 5.650 5.019 4.192

Present value tablesYear 6% 10% 12% 15% 20%
1 0.943 0.909 0.893 0.870 0.833
2 0.890 0.826 .797 0.756 0.694
3 .840 0.751 0.712 0.658 0.579
4 0.792 0.683 0.636 0.572 0.482
5 0.747 0.621 0.567 0.497 0.402
6 0.705 0.564 0.507 0.432 0.335
7 0665 0.513 0452 0.376 0.279
8 0.627 0.467 0.404 0.327 0.233
9 0.592 0.424 0.361 0.284 0.194
10 0.558 0.386 0.322 0.247 0.162

Example 5:
Suppose that a proposal to acquire $200,000 of equipment with an expected useful life of five years and a minimum desired rate of return of 10%. The net cash flow is $70,000. Should we accept the project?

Example 5:
cash flow x PV of Annuity
$70,000 x 3.170 = $221,900
Net cash flow $221,900
Original investment $200,000
Discounted cash flow 21,900
Since positive accept the proposal

Example 6: Same as 5 but uneven cash flows
Year Cash Flows
1 $70,000
2 60,000
3 40,000
4 40,000
5 20,000
6 20,000
NPV
$70,000 * 0.893 = 62,510
$60,000 * 0.797 = 47,820
40,000 * 0.712 = 28,480
40,000*.636 = $25,440
20,000 * 0.567 = 11,340
20,000 * 0.507 = 10,140
TOTAL $185,730

Example
Add the Net present values = $185,730 Cost of project is $350,000 Since project is more expensive than return Decline the deal

Example 7:
Cost of project $200,000 for 4 years
Cash flows are $90,000 $60,000 $50,000 $40,000 Rate is 10%

Example 7:
Cost is $200,000 NPV is $212,760 Difference is
positive Keep the deal
Year Cash Flow
NPV
1 $90,000 $81,810
2 $80,000 66,080
3 $50,000 37,550
4 $40,000 27,320
Total 212,760

Present value index
= total present value of net cash flow/amount to be invested
Select highest index among the projectsProposal A B C
PV cash flows $107,000 $86,400 $93,600
Original Investment 100,000 80,000 90,000
NPV 7,000 6,400 3,600
Index 1.07 1.08 1.04

Internal Rate of Return
Uses present value concepts to compute the rate of return from the net cash flows
PV of Cash Flows =
Annual cash flows X PV factor NPV = PV cash flows – cost of investment
If NPV > 0 then accept the proposal

Factors complicating capital investment analysis
Income tax Unequal proposal lives Lease versus capital
investment Uncertainty Inflation Qualitative
consideration