Embed Size (px)
Citation preview
www.hks.harvard.edu
Can Online Delivery Increase Access to Education? Faculty Research Working Paper Series
Joshua Goodman Harvard Kennedy School
Julia Melkers Georgia Institute of Technology
Amanda Pallais Harvard University
September 2016
RWP16-035
Visit the HKS Faculty Research Working Paper Series at: https://research.hks.harvard.edu/publications/workingpapers/Index.aspx
The views expressed in the HKS Faculty Research Working Paper Series are those of the author(s) and do not necessarily reflect those of the John F. Kennedy School of Government or of Harvard University. Faculty Research Working Papers have not undergone formal review and approval. Such papers are included in this series to elicit feedback and to encourage debate on important public policy challenges. Copyright belongs to the author(s). Papers may be downloaded for personal use only.
Can Online Delivery Increase Access to Education?∗
Joshua GoodmanHarvard University and NBER
Joshua [email protected]
Julia MelkersGeorgia Tech
Amanda PallaisHarvard University and NBER
October 13, 2016
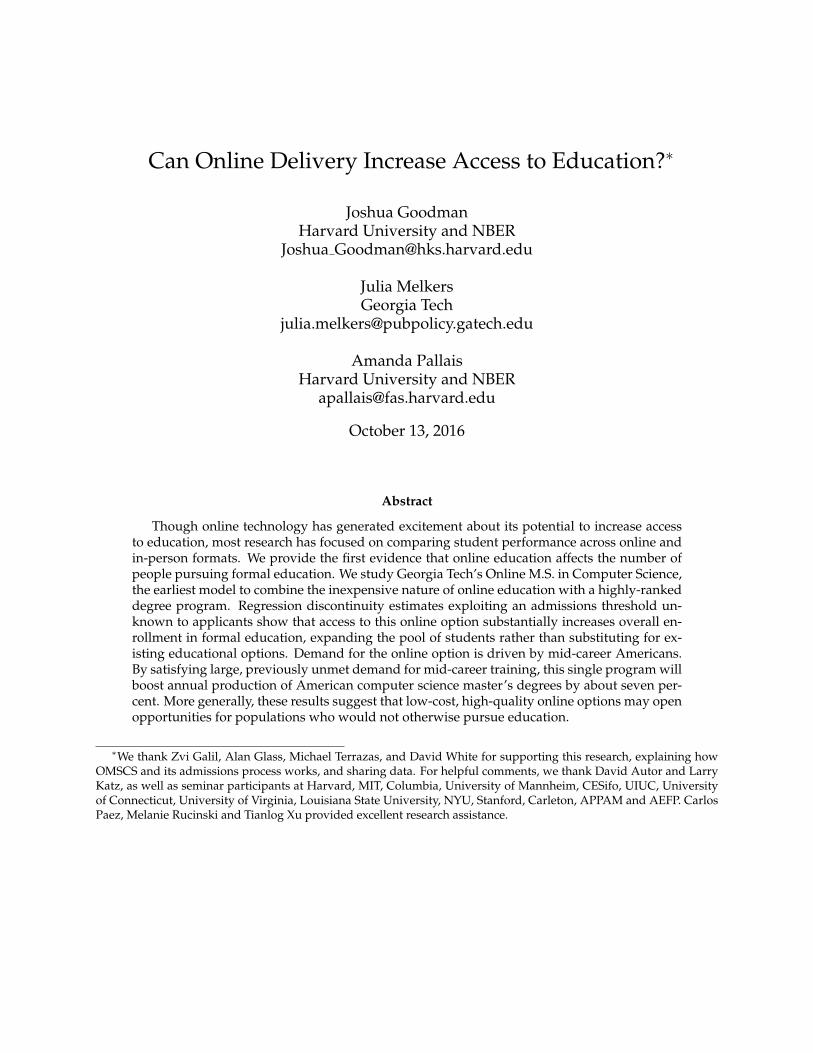
Abstract
Though online technology has generated excitement about its potential to increase accessto education, most research has focused on comparing student performance across online andin-person formats. We provide the first evidence that online education affects the number ofpeople pursuing formal education. We study Georgia Tech’s Online M.S. in Computer Science,the earliest model to combine the inexpensive nature of online education with a highly-rankeddegree program. Regression discontinuity estimates exploiting an admissions threshold un-known to applicants show that access to this online option substantially increases overall en-rollment in formal education, expanding the pool of students rather than substituting for ex-isting educational options. Demand for the online option is driven by mid-career Americans.By satisfying large, previously unmet demand for mid-career training, this single program willboost annual production of American computer science master’s degrees by about seven per-cent. More generally, these results suggest that low-cost, high-quality online options may openopportunities for populations who would not otherwise pursue education.
∗We thank Zvi Galil, Alan Glass, Michael Terrazas, and David White for supporting this research, explaining howOMSCS and its admissions process works, and sharing data. For helpful comments, we thank David Autor and LarryKatz, as well as seminar participants at Harvard, MIT, Columbia, University of Mannheim, CESifo, UIUC, Universityof Connecticut, University of Virginia, Louisiana State University, NYU, Stanford, Carleton, APPAM and AEFP. CarlosPaez, Melanie Rucinski and Tianlog Xu provided excellent research assistance.
1 Introduction
Online coursework has been heralded as potentially transformative for higher education, possibly
lowering costs of delivery and increasing access for disadvantaged students. From 2002 through
2012, the number of online bachelor’s degrees awarded rose from 4,000 to 75,000, or five percent
of all U.S. bachelor’s degrees issued that year (Deming et al., 2015). The federal government
estimates that 27 percent of college students were taking at least one course online as of 2013, the
most recent year for which data exists.1 Though online education is increasingly prevalent, we
know relatively little about the longer run implications of the existence of this new form of human
capital development (McPherson and Bacow, 2015).
This paper provides the first evidence on whether online education can improve access to edu-
cation, a key question in evaluating online education’s overall impact. Does online education sim-
ply substitute for in-person education or does it instead expand access to students who would not
otherwise have enrolled in an educational program? Existing research largely compares student
performance in online and in-person classes, often by randomly assigning students to one format
or the other conditional on already having enrolled. The online format generally leads to worse
learning outcomes (Joyce et al., 2015; Alpert et al., 2016; Krieg and Henson, 2016), particularly for
academically weaker students such as those in community colleges (Xu and Jaggars, 2014) and
for-profit colleges (Bettinger et al., 2015). In some settings, students do equally well across both
formats, raising the possibility that the online format may nonetheless be a cost effective delivery
mechanism (Figlio et al., 2013; Bowen et al., 2014).
Though the body of research on the pedagogical efficacy of the online format is growing, no
prior research on online education has addressed whether the existence of online options increases
the number of people obtaining formal education. This is in part because the ubiquity of such op-
tions makes it difficult to construct convincing counterfactuals. Understanding the impact of on-
line education depends, however, on whether online classes replace in-person classes or generate
additional human capital investment.
1See Table 311.15 of the 2014 Digest of Education Statistics, published by the U.S. Department of Education’s Na-tional Center for Education Statistics.
1
We provide evidence on this by examining the earliest educational model to combine the in-
expensive nature of online education with a degree program from a highly-ranked institution.
Specifically, we study the new Online Master of Science in Computer Science (OMSCS) offered
by the Georgia Institute of Technology (Georgia Tech) and developed in partnership with Udac-
ity and AT&T. In spring 2014, Georgia Tech’s Computer Science Department, which is regularly
ranked in the top ten in the United States, started enrolling students in a fully online version of its
highly regarded master’s degree. The online degree costs about $7,000, less than one-sixth of the
$45,000 out-of-state students pay for Georgia Tech’s in-person computer science master’s degree
(MSCS). Program price and admissions criteria were set in part to attract a much larger number
of students than the in-person program without compromising the quality of the degree.
Importantly, the degree OMSCS students earn is not labeled “online” and is in name fully
equivalent to the in-person degree. As a result, the reputation and labor market value of Georgia
Tech’s in-person degree now at least partially depend on the extent to which Georgia Tech can
ensure that the quality of its graduates does not differ substantially across the two formats. In
an attempt to address the quality concerns that online education raises, Georgia Tech designed
OMSCS such that its courses are online versions of the same courses in-person students take,
designed by the same faculty teaching those courses, and graded using the same standards.
We first document where demand for this model of online education comes from by comparing
the online and in-person applicant pools, as both programs lead to the same degree but through
different formats. We find large demand for the online program, which is now the nation’s largest
master’s degree program in computer science. Importantly, there is nearly no overlap between the
applicant pools to these two programs, with few individuals applying to both. The average in-
person applicant is a 24-year old non-American recently out of college, whereas the average online
applicant is a 34-year old mid-career American. Eighty percent of those admitted to the online
program accept those offers and enroll, suggesting few find compelling alternative educational
options. Large demand from a mid-career population uninterested in its in-person equivalent and
a high matriculation rate both suggest the online program is drawing in students who would not
otherwise enroll elsewhere.
2
Next, we rigorously estimate whether this online option expands access to formal education
for students who would not otherwise enroll, thus increasing the number of students participat-
ing in higher education. To do so, we utilize quasi-random variation in admission to OMSCS
to determine the extent to which access to the online option substitutes for enrollment in other
programs. We exploit the fact that capacity constraints for the first applicant cohort led to the pro-
gram’s admission officer reading applications in descending order of undergraduate GPA until
he had identified about 500 applicants to which immediate admission was offered. As a result,
such offers were made only to those with a GPA of at least 3.26, a threshold that was arbitrary
and unknown to applicants. The officer eventually read all of the applications and some of those
below the threshold were offered deferred admission. A regression discontinuity design shows
this admissions process created at the threshold a roughly 20 percentage point difference in the
probability of admission to the online program.
With National Student Clearinghouse data that tracks enrollment in any U.S. formal higher
education, we use a regression discontinuity design to compare enrollment outcomes for appli-
cants just above and below that threshold, two groups who differ only in their access to this online
option. We find a roughly 20 percentage point difference in the probability of eventually enrolling
in the online program, the magnitude of which suggests that roughly all of the marginal admits
ultimately matriculate.2 Importantly, we show that very few applicants to OMSCS enroll in other,
non-OMSCS programs. Those just below the admission threshold are no more likely to enroll
elsewhere than those just above it, implying that access to the online program does not substitute
for other educational options. Such access thus substantially increases the number of students
enrolling at all. The higher education market appears to have been failing to meet demand for this
online option.
Early evidence also suggests that this online program is delivering a relatively high-quality
educational experience. To test whether students pursuing the degree online were learning as
much as those pursuing it in person, Georgia Tech blindly graded final exams for online and in-
person students taking the same course from the same instructor. The online students slightly
2The difference in OMSCS enrollment at the discontinuity is not due to differential likelihood of enrolling in OMSCSconditional on admission. On both sides of the discontinuity, 80 percent of admitted students enroll in the program.
3
outperformed the in-person students (Goel and Joyner, 2016). OMSCS students are also persisting
at rates substantially higher than students in nearly all MOOCs and higher than in many online
degree programs. Among those students who started OMSCS in 2014, 62 percent remain enrolled
two years later, apparently on track to complete their degrees. This is very likely a lower bound
on completion rates given that over 25 percent of students who take a semester off from the pro-
gram re-enroll in subsequent semesters. Given the nearly 1,200 Americans enrolling each year
in OMSCS and assuming only those 62 percent graduate, this implies production of at least 725
new American computer science master’s degrees holders annually. Roughly 11,000 Americans
earn their master’s degree in computer science each year, implying that this single program will
boost annual national production of American computer science master’s degrees by about seven
percent.
That OMSCS appears to be filling a gap in the higher education market may explain why the
announcement of the program in 2013 garnered such extensive media attention. OMSCS was
described as the first large-scale program offered by a highly-ranked department, priced much
lower than its in-person equivalent and culminating in a prestigious graduate degree. Prior mod-
els of online education had involved highly-ranked institutions offering online degrees as costly
as their in-person equivalents, lower-ranked institutions offering inexpensive degrees with low
labor market returns (Deming et al., 2016), or free massive online open courses (MOOCs) with
unclear returns and very high attrition rates (Perna et al., 2013; Banerjee and Duflo, 2014). Because
OMSCS’ price-quality pairing had not been previously seen in online education, the New York
Times declared that this model meant “disruption may be approaching.”3 President Obama men-
tioned OMSCS in an August 2013 speech on college affordability and again in March 2015 while
visiting Georgia Tech, describing the program as a model for “innovative ways to increase value”
in higher education.4
The low-cost, high-quality model pursued by OMSCS appears to be growing in importance. In
spring of 2016, inspired in part by OMSCS, the University of Illinois at Urbana-Champaign (UIUC)
3T. Lewin (2013), “Master’s Degree Is New Frontier of Study Online” New York Times, August 17.4B. Obama (2015), “Remarks by the President Announcing Student Aid Bill of Rights.” March 10
https://www.whitehouse.gov/the-press-office/2015/03/10/remarks-president-announcing-student-aid-bill-rights.
4
began enrolling students in its “iMBA” program, a fully-online version of its highly-regarded
MBA. The degree costs about $22,000, roughly one-third the cost of the in-person MBA offered
by UIUC and similarly-ranked institutions. Yale University is currently developing a fully online
version of its Master of Medical Science degree for physician assistants. In the fall of 2016, over a
dozen highly ranked universities affiliated with the EdX consortium started by Harvard and MIT
announced plans to offer micro-master’s degrees. Such degrees will be open to any student willing
to pay a total of roughly $1,000 for exam proctoring at the end of each course and will consist of
between one-quarter and one-half of the courses in a traditional version of each degree. Examples
of such degrees include supply chain management from MIT, artificial intelligence from Columbia
University, and social work from the University of Michigan at Ann Arbor.5 That more highly-
ranked institutions appear to be entering the market for inexpensive online degrees suggests our
results may be increasingly relevant to the future of online education.
The remainder of the paper proceeds as follows. In Section 2, we describe the OMSCS pro-
gram in more detail, describe the available data, and descriptively compare the applicant pools to
the in-person and online programs. In Section 3, we present regression discontinuity estimates of
the impact of access to online education on overall enrollment. In Section 4, we discuss the im-
plications of our findings. We argue that the single program studied here will likely increase the
number of Americans earning computer science master’s degrees by about seven percent. We also
discuss the external validity of these findings, as well as concerns about the quality of education
delivered by the online program.
2 Context and Data
2.1 The OMSCS Degree Program
OMSCS courses are offered through a platform designed by Udacity, one of the largest providers
of massive open online courses.6 To earn their degree, OMSCS students must complete 10 courses,
5J. Young (2016), “Online Micro-Master’s Programs Extend Their Reach” Chronicle of Higher Education, September20.
6To create the OMSCS program, Georgia Tech partnered with Udacity and AT&T, the latter of which provided start-up funding.
5
specializing in either computational perception and robotics, computing systems, interactive in-
telligence, or machine learning. Students who have taken two foundational courses can take up
to three classes per semester, while other students can take only two at a time. The typical stu-
dent takes one or two courses each semester, so that expected time to graduation is six to seven
semesters, which can include summer terms. In order to maintain educational quality, the online
courses use similar assignments and grading standards as their in-person counterparts. Consis-
tent with the OMSCS degree being at least nominally equivalent to the in-person degree, OMSCS
is accredited because the accreditor considers it equivalent to the in-person program.
Though deadlines for submitting assignments are the same as the in-person courses, one major
difference is that all lecture-watching and other learning experiences are asynchronous, meaning
that there is no fixed time during which a student must be online. All content is posted at the
start of the semester so that students may proceed at a pace of their choosing. Students sched-
ule their exams within a specified window and are monitored to guard against cheating. Most
interaction happens in online forums where students post questions and receive answers from fel-
low students, teaching assistants, or faculty members. Faculty members interact with students in
online office hours, though online forums are typically run by the head teaching assistant. Feed-
back on assignments comes from teaching assistants, many of whom are current MSCS or OMSCS
students and each of whom serves approximately 50 students.7
AT&T provided roughly $4,000,000 in start-up funds to supplement GA Tech’s own initial in-
vestment. Much of that funded production of the roughly 30 courses OMSCS offers, each of which
initially cost about $300,000 to produce, though production costs have since dropped to under
$200,000. Such costs reflect the fact that OMSCS does not record and re-broadcast in-person lec-
tures as some online courses do, but instead produces original videos and other materials for each
course. Individual faculty members are paid $20,000 for initially creating a course and $10,000
each time they teach the course, which many of them continue to do. In 2015, OMSCS had net
revenues of about $2,000,000 and by fall 2016 had returned the Computer Science Department’s
7One teaching assistant is not human. Professor Ashok Goel, who teaches a course entitled “Knowledge Based Arti-ficial Intelligence,” created a virtual teaching assistant named Jill, based on artificial intelligence technologies adaptedfrom IBM’s Watson platform. Jill regularly answered students’ questions and was only revealed to them as virtual latein the semester.
6
initial investment in the program.
To make OMSCS accessible to a wider range of applicants than its in-person counterpart, its
admissions website describes as “preferred qualifications” having a B.A. in computer science or a
related field with an undergraduate GPA of 3.0 or higher.8 Such qualifications do not guarantee
admission and, as the website notes, “applicants who do not meet these criteria will be evaluated
on a case-by-case basis.” The admissions website to the in-person program describes a GPA of
3.0 as a “desirable minimum” and notes that “most candidates score higher.” MSCS also requires
submission of GRE scores, which OMSCS does not. Whereas MSCS has one cohort of applicants
each year who apply to start in the fall, OMSCS has two applicant cohorts each year as students
can begin their coursework in either the fall or the spring. The first OMSCS enrollees began their
coursework in the spring of 2014.
2.2 Data
We have data from Georgia Tech’s Computer Science Department on all applicants to OMSCS’s
first six cohorts, who started their courses in spring 2014, fall 2014, spring 2015, fall 2015, spring
2016, and fall 2016. We also have data on four cohorts of applicants to MSCS, those applying to
start classes in each fall from 2013 through 2016. For each applicant, we have basic self-reported
demographic information including age, gender, race/ethnicity, and citizenship. Applicants also
report their postsecondary educational history, including the name of each college attended, their
GPA at that college, and the field and type of any degree earned. Applicants report the name of
their employer if employed at the time of application. We also observe whether a given applicant
was ever admitted to or enrolled in OMSCS or MSCS.
We merge all applicants’ data to the National Student Clearinghouse (NSC), an organization
that tracks enrollment at post-secondary institutions throughout the United States. The NSC iden-
tifies which, if any, institution a student is enrolled in at any moment in time, allowing us to track
the educational trajectories of students who enroll in Georgia Tech and other institutions.9 NSC
8As we describe below, our regression discontinuity analysis uses a different GPA cutoff that affected the probabilityof admission but was unknown to applicants.
9Though the NSC also records degree completion, it is too early to measure this given that most initial OMSCSenrollees have not yet been enrolled for the two to three years expected for graduation.
7
coverage rates for undergraduates in Georgia are around 95 percent and generally above 90 per-
cent in other states (Dynarski et al., 2015). Though less is known about graduate student coverage
rates, we show that a very high fraction of MSCS applicants are observed enrolling in institutions
other than Georgia Tech, suggesting widespread coverage of master’s degree students. Impor-
tantly, we do observe many for-profit and nonprofit institutions that primarily offer online course-
work, such as the University of Phoenix and Western Governor’s University. We supplement this
with data from the National Science Foundation on the full population of students earning com-
puter science master’s degrees in the United States in 2013, the most recent year available.
3 Descriptive Comparison of Applicant Pools
To document where demand for OMSCS comes from, we describe the characteristics of the OM-
SCS applicant pool and compare them to the characteristics of the MSCS applicant pool. Because
both programs culminate in the same nominal degree, we view such a comparison as controlling
for the degree sought. As such, we argue that differences in the applicant pools between these
programs are largely due to differences in the programs’ costs and methods of curriculum deliv-
ery.
Demand for the online program is large, as seen in panel A of Table 1. OMSCS attracts over
3,400 applicants annually, about twice as many as its in-person equivalent. This is not due simply
to large pent-up demand, as the most recent applicant cohort is larger than all but the first cohort,
which contained many AT&T employees.10 OMSCS admits 61 percent of those applicants, almost
five times the 13 percent admission rate for the in-person program. OMSCS is thus less selective
and more open than its in-person counterpart, as program designers intended.
Eighty percent of those admitted to the online program enroll, so that each year nearly 1,700
students begin a computer science master’s degree through OMSCS, more than 10 times as many
who begin a degree through MSCS. This makes OMSCS the largest computer science master’s
degree program in the United States, and possibly the world. By way of comparison, the NSF
estimates that U.S. institutions issued about 21,000 computer science master’s degrees in 2013. If
10See columns 1-6 of Table A.1.
8
all OMSCS enrollees were to complete their degrees, OMSCS would be responsible for the pro-
duction of eight percent of all computer science master’s degrees in the country. The nearly 1,200
annual American enrollees in OMSCS would represent over ten percent of all Americans earning
such degrees.
Two descriptive facts suggest that demand for the online program comes from a different pop-
ulation than demand for the in-person program. First, in our data, fewer than 0.2 percent of the
nearly 18,000 applicants to either program applied to both programs, suggesting that students
view these programs as distinct educational products. Second, as panel B in Table 1 shows, the
applicant pools to the two programs look very different, particularly in terms of nationality and
age.11
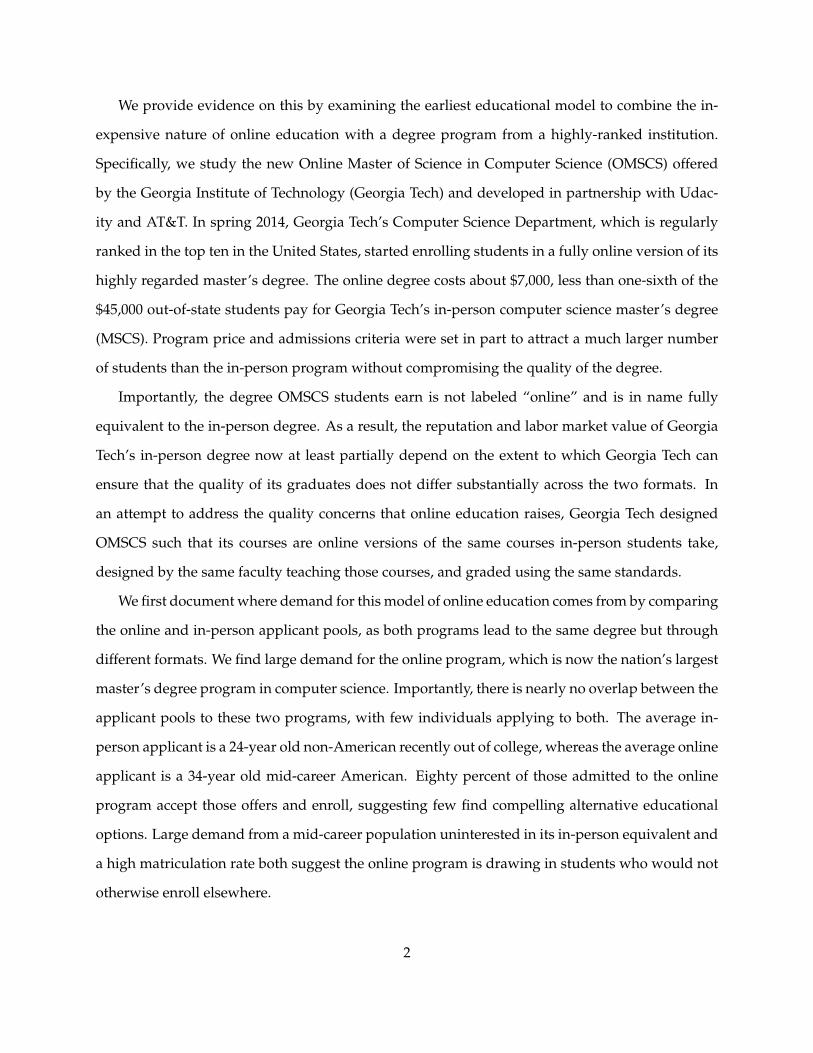
The online program attracts a much more American demographic than does the in-person
program. About 70 percent of the online applicants are U.S. citizens, compared to 8 percent of
in-person applicants. Figure 1 shows the distribution of citizenship across the two pools. The
vast majority of in-person applicants are citizens of India (nearly 70 percent) or China (nearly 20
percent). After admissions and enrollment decisions, the fraction of in-person enrollees who are
U.S. citizens rises to 26 percent. Even so, over half of that student body are Indian or Chinese citi-
zens. Panel B shows that fewer than 10 percent of applicants to the online program are Indian or
Chinese citizens, proportions that do not change substantially with admissions and enrollment de-
cisions. That international applicants show stronger demand for the in-person program suggests
such students may value the opportunity to be physically present in the U.S., which admission
to an online program does not grant.12 That over 70 percent of online program enrollees are U.S.
citizens makes that pool substantially more American than the national pool of those completing
computer science master’s degrees, of whom 52 percent are U.S. citizens.
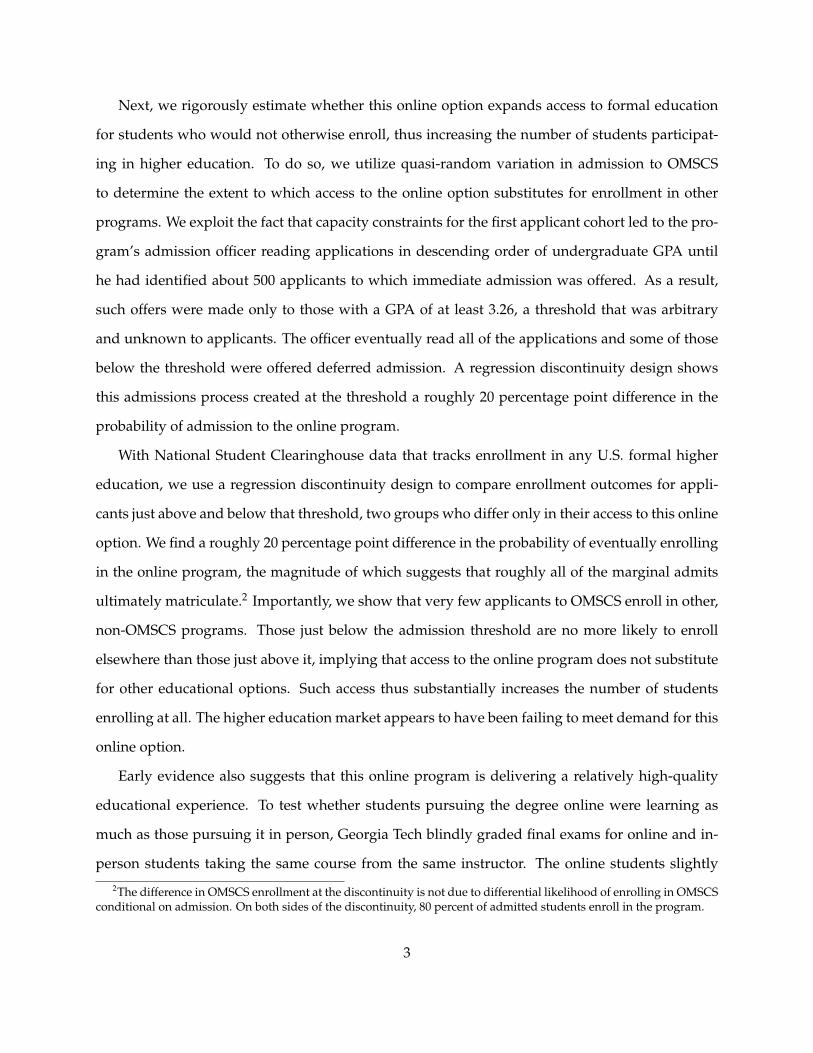
The online program attracts a substantially older demographic than does the in-person pro-
gram. Online applicants are on average 34 years old, compared to an average age of 24 for in-
11Table A.1 shows the characteristics of individual cohorts of applicants. None of the demographic facts highlightedhere change substantially over the observed time period.
12Low international awareness of OMSCS’ existence may explain a small portion of their proportionally strongerdemand for the in-person program, as Table A.1 shows that the international composition of the applicant pool hasvery slowly increased over time, perhaps because such awareness has increased.
9
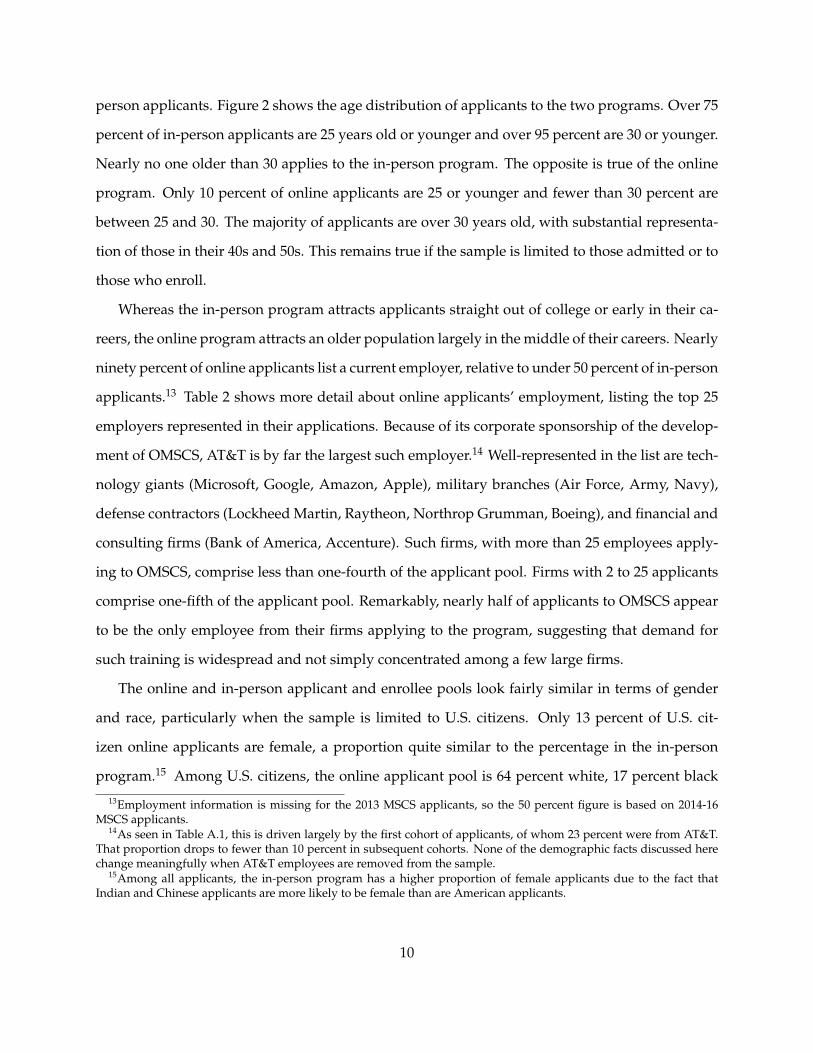
person applicants. Figure 2 shows the age distribution of applicants to the two programs. Over 75
percent of in-person applicants are 25 years old or younger and over 95 percent are 30 or younger.
Nearly no one older than 30 applies to the in-person program. The opposite is true of the online
program. Only 10 percent of online applicants are 25 or younger and fewer than 30 percent are
between 25 and 30. The majority of applicants are over 30 years old, with substantial representa-
tion of those in their 40s and 50s. This remains true if the sample is limited to those admitted or to
those who enroll.
Whereas the in-person program attracts applicants straight out of college or early in their ca-
reers, the online program attracts an older population largely in the middle of their careers. Nearly
ninety percent of online applicants list a current employer, relative to under 50 percent of in-person
applicants.13 Table 2 shows more detail about online applicants’ employment, listing the top 25
employers represented in their applications. Because of its corporate sponsorship of the develop-
ment of OMSCS, AT&T is by far the largest such employer.14 Well-represented in the list are tech-
nology giants (Microsoft, Google, Amazon, Apple), military branches (Air Force, Army, Navy),
defense contractors (Lockheed Martin, Raytheon, Northrop Grumman, Boeing), and financial and
consulting firms (Bank of America, Accenture). Such firms, with more than 25 employees apply-
ing to OMSCS, comprise less than one-fourth of the applicant pool. Firms with 2 to 25 applicants
comprise one-fifth of the applicant pool. Remarkably, nearly half of applicants to OMSCS appear
to be the only employee from their firms applying to the program, suggesting that demand for
such training is widespread and not simply concentrated among a few large firms.
The online and in-person applicant and enrollee pools look fairly similar in terms of gender
and race, particularly when the sample is limited to U.S. citizens. Only 13 percent of U.S. cit-
izen online applicants are female, a proportion quite similar to the percentage in the in-person
program.15 Among U.S. citizens, the online applicant pool is 64 percent white, 17 percent black
13Employment information is missing for the 2013 MSCS applicants, so the 50 percent figure is based on 2014-16MSCS applicants.
14As seen in Table A.1, this is driven largely by the first cohort of applicants, of whom 23 percent were from AT&T.That proportion drops to fewer than 10 percent in subsequent cohorts. None of the demographic facts discussed herechange meaningfully when AT&T employees are removed from the sample.
15Among all applicants, the in-person program has a higher proportion of female applicants due to the fact thatIndian and Chinese applicants are more likely to be female than are American applicants.
10
or Hispanic, and 15 percent Asian, proportions roughly similar to the in-person applicant pool.
There is little evidence of differential gender or racial diversity by program type. Other forms of
diversity, such as socioeconomic status and academic skill, are hard to evaluate because our appli-
cation data contain no information on family background and no objective measures of academic
skill that are comparable across the two applicants pools.16
We can, however, use characteristics of applicants’ undergraduate institutions as proxies for
applicants’ family backgrounds and academic skills. To do so, we use data from the Integrated
Postsecondary Education Data System (IPEDS) to characterize applicants by the U.S. colleges they
attended.17 Table 3 shows clear differences across the two applicant pools. Online applicants come
from colleges where the average student’s SAT math score is 30 points, or about 0.2 standard devi-
ations, lower than students from in-person applicants’ colleges. Online applicants’ colleges have
a higher proportion of low income students, as well as a substantially lower six-year graduation
rate. Differences among admitted students and enrollees are of similar magnitude. This suggests
that the online program attracts applicants who are from more economically disadvantaged back-
grounds and who are academically weaker on average than their in-person counterparts. Online
applicants also have a more diverse set of college majors, as they are much less likely than in-
person applicants to have majored in computer science. Instead, they are more likely to have
majored in engineering, mathematics, physical sciences, and even social sciences and humanities.
The descriptive comparison of the two applicant pools thus provides three pieces of evidence
that together are consistent with the possibility that OMSCS represents a new educational prod-
uct for which there is currently no close substitute in the formal higher education market. First,
though the two programs culminate in the same degree, there is nearly no overlap in the pop-
ulations interested in these educational options. The typical applicant to the in-person program
is a 24-year old recent college graduate from India, whereas the typical applicant to the online
program is a 34-year old currently-employed American. Second, demand from Americans for
16Unlike the in-person program, the online program does not require applicants to submit GRE scores.17We use IPEDS data from 2005, roughly the average year of college graduation for online applicants. Our results are
not sensitive to this choice given how slowly college characteristics change over time. We are able to link 67 percent ofOMSCS applicants and 11 percent of MSCS applicants to colleges in IPEDS. For both programs, we can link 88 percentof U.S. citizen applicants to their colleges.
11
the online version of the program is large, with well over 10 times more American applicants
to OMSCS than to MSCS. Third, eighty percent of those admitted to the online program accept
those offers and enroll, suggesting that relatively few such admits find alternative higher educa-
tion options compelling. Large demand for OMSCS from a mid-career population uninterested
in its in-person equivalent and the high enrollment rate among admits both suggest that OMSCS
provides an educational pathway for which there has previously been no compelling, competing
alternative. To strengthen the case for this argument, we turn to a second empirical strategy that
focuses on causal inference and complements the descriptive analysis above.
4 The Impact of Online Access on Educational Trajectories
4.1 Regression Discontinuity Design
Our goal is to determine whether the existence of an online option alters applicants’ educational
trajectories. If not for access to such an option, would its applicants pursue other educational op-
tions? Or does the online option lack close substitutes in the current higher education market? The
difficulty in answering this question is that applicants admitted to OMSCS are generally academ-
ically stronger than and differ along other dimensions from those denied admission. Comparing
the subsequent educational trajectories of these two groups of students would confound the im-
pact of online access with the impact of underlying academic skills and other characteristics.
We solve this problem by identifying an exogenous source of variation in the probability that
an applicant had access to the online option. In particular, though OMSCS admitted a wider
range of students in later cohorts, the program decided to somewhat constrain the number of
students admitted to the very first cohort in spring 2014. OMSCS did this to ensure that any
challenges inherent in starting a new program would not be compounded by an overly large
enrollment total. The chief admissions officer therefore read applications in descending order of
undergraduate GPA and offered immediate admission only to the first 500 or so applications he
read that he deemed admissible. As a result, only applicants with an undergraduate GPA of 3.26
or higher were eligible for admission in spring 2014.
12
The admissions officer ultimately read all applications and some students both below and
above the 3.26 threshold were made offers of deferred admission. Such students were allowed to
enroll in summer 2014, fall 2014 or spring 2015. The admissions data we have can not distinguish
between students made offers of admission for spring 2014 and those who were offered deferred
admission. We therefore measure enrollment outcomes as of fall 2016, well beyond the point at
which all spring 2014 applicants would have had to enroll if admitted or would have had time
to apply to and enroll in other institutions if rejected. We focus on the probability that a given
student received any admission offer, regardless of its timing.
The GPA threshold thus represents an exogenous source of variation in whether a given stu-
dent was offered admission to OMSCS. We use the threshold to implement a regression disconti-
nuity design (RD) that compares the educational trajectories of applicants just above and below
that threshold. Such students should be nearly identical in terms of academic skills, as measured
by GPA, as well as other characteristics. They should differ only in their access to the online
option. We estimate the impact of having a GPA above the admissions threshold on enrollment
outcomes of the first applicant cohort through the following baseline specification:
Enrolledi = β0 + β1Admissiblei + β2GPAi + β3Admissiblei ×GPAi + εi. (1)
Here,Enrolled indicates enrollment status in OMSCS or other programs for applicant i,Admissible
indicates the applicant is above the GPA threshold and GPA measures his distance from that
threshold in GPA points. In this local linear regression, the two GPA variables model the relation-
ship between GPA and college outcomes as linear, with the interaction term allowing that slope to
vary on either side of the threshold. The coefficient on Admissible thus measures the difference in
OMSCS enrollment probability between applicants just above and just below that threshold. This
specification generates intent-to-treat estimates of the impact of increased access to OMSCS.
Using the same basic specification, we also generate instrumental variables estimates of the
impact of admission on enrollment, where admission is instrumented with having an immediately
13
admissible GPA. Specifically, we estimate the first stage equation
Admittedi = α0 + α1Admissiblei + α2GPAi + α3Admissiblei ×GPAi + εi. (2)
whereAdmitted indicates eventual admission to OMSCS. We then use predicted values ofAdmitted
to estimate a second stage of the form
Enrolledi = γ0 + γ1 ˆAdmittedi + γ2GPAi + γ3Admissiblei ×GPAi + εi. (3)
This yields estimates of the impact of OMSCS admission on enrollment choices for compliers at the
margin, namely those students for whom the threshold itself altered their probability of eventual
admission. We think of this as a matriculation rate for such applicants.
Following Lee and Card (2008), our baseline specifications for all of these estimates cluster
standard errors by distance from the GPA threshold because GPA is a fairly discrete variable, with
many students reporting values that are multiples of 0.1 or 0.25. To improve precision, we include
demographic controls for gender, race/ethnicity, citizenship, age, employment and college major.
Optimal bandwidths, as suggested both by Imbens and Kalyanaraman (2012) and Calonico et al.
(2014), are between 0.3 and 0.5 GPA points for all outcomes. We treat 0.5 GPA points as our default
bandwidth but show that our results are robust to use of smaller and larger bandwidths, as well
as to exclusion of demographic controls.
Validity of our RD estimates requires that students not systematically manipulate which side
of the GPA threshold they fall on. Though they do self-report GPAs, two facts suggest little scope
for manipulation. First, applicants were required to submit transcripts and thus knew that their
self-reported GPAs might be checked against officially reported ones. Second, applicants had no
knowledge that a GPA of 3.26 would play any role in the admissions process, a fact that was
decided only after all applications had been submitted. The only GPA criterion publicized was
that a GPA of 3.0 or higher was preferred, though applicants with lower GPAs could be admitted.
It thus seems highly unlikely that there could be differential sorting across the 3.26 threshold. We
confirm this in two ways.
14
First, as suggested by McCrary (2008), we show in Figure A.1 that the density of students just
above the threshold looks similar to the density just below. Multiples of 0.1, as well as 3.0 and 4.0,
are particularly common, but there is no clear difference in the distribution of GPAs around the el-
igibility threshold. Formal tests show no evidence that GPAs just above 3.26 are over-represented
relative to GPAs just below 3.26, suggesting no obvious manipulation by students. Second, we
confirm that observable covariates are balanced across the threshold by running the specification
in Equation 1 using such covariates as outcomes. Table A.2 shows the results of these covariate
balance tests, using a variety of bandwidths. There is no practically or statistically significant
evidence of differential sorting across the threshold in terms of gender, race, citizenship, age, em-
ployment, or college major. The balance of density and covariates at the threshold suggest that
students on either side of the threshold are similar along both observed and unobservable dimen-
sions. Our regression discontinuity coefficients should therefore provide unbiased estimates of
the impact of online access on educational trajectories.
4.2 Causal Estimates
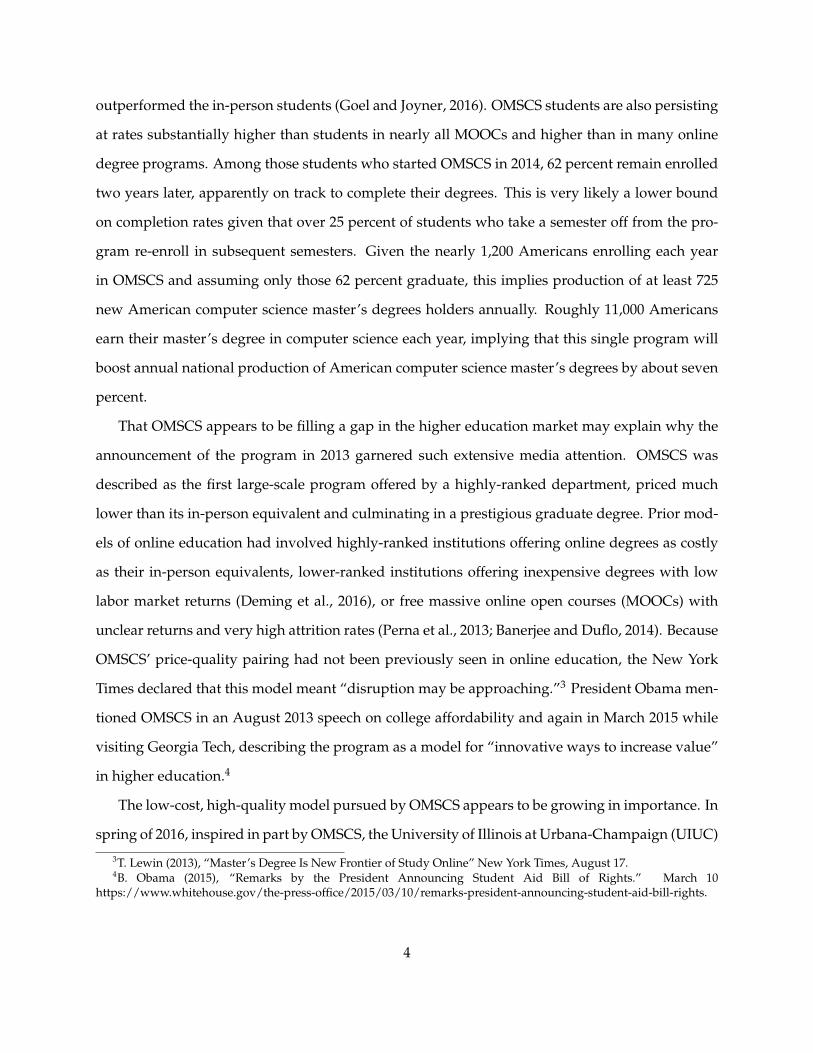
We first document how the GPA threshold affected the probability of admission to OMSCS. The re-
lationship between GPA and the probability of being offered admission, seen in Panel A of Figure
3, shows a clear discontinuity. The first stage estimates in column 1 of Table 4 suggest that those
just above the GPA threshold were about 20 percentage points more likely to be admitted to the
online program than their counterparts with slightly lower GPAs. This difference represents the
extent to which the GPA threshold generated exogenous variation in access to the online option.
Importantly, access to the online program generates enrollment in that program. We define
OMSCS enrollment as a student having enrolled in at least one semester by fall 2016.18 At that
point, all immediate and deferred admissions offers would have expired, and applicants would
have had the opportunity to apply to and enroll in other, competing degree programs. Panel B of
Figure 3 shows the fraction of applicants who ever enrolled in OMSCS. The graphical evidence, as
18The relationship between spring 2014 enrollment and GPA in Figure A.2 is consistent with the requirement of aGPA of at least 3.26 for immediate admission. Only four applicants below the GPA threshold appear to have enrolledin OMSCS in spring 2014.
15
well as the estimates in column 2 of Table 4, suggest that threshold-based admissibility increases
enrollment in the online option by slightly more than 20 percentage points. This implies that
roughly all of the marginal applicants admitted because of the GPA threshold accepted the offer
of admission and enrolled. Instrumental variables estimates, shown in column 3, confirm that the
matriculation rate of such students is close in magnitude and statistically indistinguishable from
100 percent. These applicants appear not to have competing options that would cause them to
decline their admissions offer.
Importantly, though admission affects enrollment, admission timing does not appear to. Fig-
ure A.3 shows OMSCS enrollment rates as a function of GPA, for the sub-sample of applicants
offered admission. Those above the threshold were largely given immediate offers and those be-
low deferred offers, yet at the threshold there is no clear difference in the probability of enrolling in
OMSCS, conditional on admission. The point estimate of the discontinuity is close to zero and sta-
tistically insignificant whether we use our default bandwidth of 0.5 or the Imbens-Kalyanaraman
optimal bandwith of 0.3.
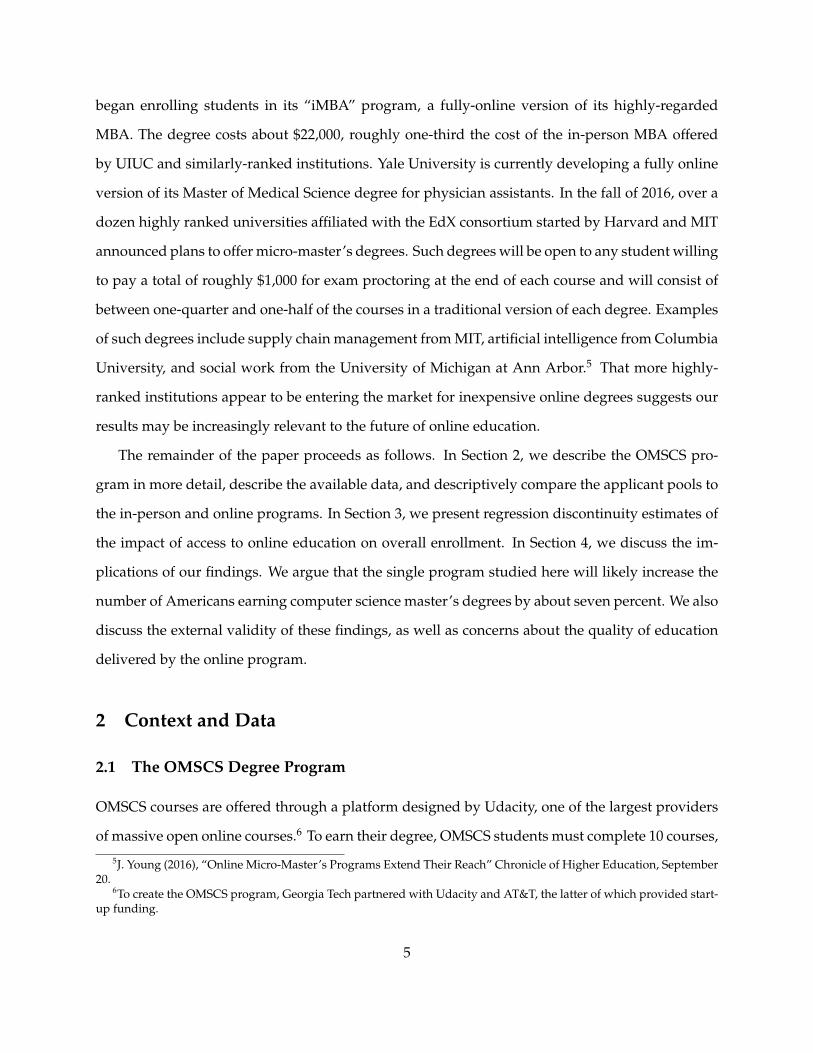
Examination of enrollment in other programs confirms that OMSCS has no close substitutes.
Panel A of Figure 4 shows the fraction of OMSCS applicants who enrolled in other, non-OMSCS
programs by fall 2016. The overall levels of such enrollment are quite low, with fewer than 20
percent of those just below the threshold enrolling elsewhere. The few alternatives chosen by
such applicants are rarely the more prestigious competitors of MSCS, such as Carnegie Mellon or
University of Southern California, but are instead lower-ranked online programs from institutions
such as DeVry University or Arizona State University. This is in contrast to MSCS applicants,
many hundreds of whom choose those prestigious competitors over Georgia Tech. Panel B shows
that over 50 percent of MSCS applicants enroll in alternative U.S. programs, a fraction that rises
to 65 percent when considering just U.S. applicants to the in-person program. Those interested
in the online program appear to have fewer competing alternatives than those interested in the
in-person program.
In addition to the low overall rate of online program applicants enrolling in alternatives to
OMSCS, there is also no visually apparent discontinuity in non-OMSCS enrollment, with columns
16
4 and 5 of Table 4 showing statistically insignificant point estimates close to zero. If access to
OMSCS were substituting for other in-person programs, we would expect to see a clear drop in
enrollment elsewhere to the right of the GPA threshold. Though our regression discontinuity
estimates are generated by those at a particular point in the GPA distribution, it is worth noting
that those with much higher or lower GPAs also do not appear to enroll in non-OMSCS options.
This suggests the market is not providing appealing alternatives for a wide range of students for
whom OMSCS is appealing. In contrast, most MSCS applicants with lower and higher GPAs find
suitable alternatives in which to enroll.
Access to the online option therefore increases the number of people pursuing education at
all. We see this in Figure 5, which shows the fraction of applicants enrolling in any formal higher
education. There is a large, clear discontinuity at the admissions threshold, with estimates from
column 6 of Table 4 suggesting that admissibility to the online program increases enrollment in
formal higher education by about 20 percentage points. The instrumental variables estimates in
column 7 imply that roughly 100 percent of the marginal admits to OMSCS represent new entrants
into formal higher education. Access to this online option thus increases the number of people
pursuing education.
We perform a number of robustness checks to confirm that our estimates are not sensitive
to our specification choices. The first two rows of Table 4 show that inclusion of demographic
controls improves the precision of our estimates, but does not meaningfully alter their magnitude.
The remaining rows of the table show that our point estimates are robust to a fairly wide set of
bandwidths, including those close to the optimal bandwidths mentioned previously. To check
that our estimated discontinuities in admission, OMSCS enrollment and overall enrollment are
not driven by spurious features of the data, we test for placebo discontinuities by running our
baseline regression specification placing the admissions threshold at GPA values other than 3.26.
The resulting coefficients are shown in panel A of Figures A.4, A.5 and A.6. In all cases, the
actual threshold of 3.26 generates the largest discontinuity and the only one that is positive and
statistically significant.
One other potential concern is that the location of the threshold was endogenous to the qual-
17
ity of the applicant pool in that part of the GPA distribution. If students with a 3.26 GPA were
of particularly high quality and thus ended the admissions process by using up the program’s
final capacity, then our estimates might be biased by correlations between such quality and en-
rollment decisions. To test whether such endogenous threshold location is generating bias, panel
B of Figures A.4, A.5 and A.6 show estimated discontinuities from donut hole RD specifications
that exclude observations close to the threshold. The resulting coefficients are, if anything, slightly
larger, suggesting that our estimates are not driven by observations very close to the threshold.
As a final check, we explore heterogeneity in enrollment impacts of online access in Table 5.
Limiting the sample to non-AT&T employees has little effect on our point estimates, suggesting
that our results are not driven by this potentially unusual subset of applicants. Limiting the sam-
ple to U.S. citizens has similarly little effect. Subsequent rows separate the sample by age, gender
and race. The main takeaway from these estimates is that there is no subgroup of applicants for
whom access to OMSCS substitutes for enrollment in other educational programs. None of the
point estimates in columns 4 and 5 are significantly negative. The result is that, for all subgroups
for whom the threshold clearly generates variation in access to OMSCS, such access clearly in-
creases overall enrollment in higher education.
5 Discussion and Conclusion
Our descriptive evidence shows large demand for the first low-cost online degree offered by a
highly-ranked institution. Applicant pools to the online and in-person versions of this degree
program show almost no overlap in individuals or in demographic characteristics. Unlike its in-
person equivalent, the online option generates demand largely from mid-career Americans. Large
demand from older, employed individuals is consistent with the possibility that the geographic
and temporal flexibility of the online option are critical to its appeal. Online education can provide
mid-career training without forcing individuals to quit their jobs or move to locations with appro-
priate educational institutions. Relatively low demand for the online option from non-Americans
is consistent with the value of in-person programs stemming at least partially from physical access
to U.S. social networks and labor markets.
18
Our causal evidence shows that this online option expands access to formal education and
does not substitute for other programs. Eighty percent of those accepted by OMSCS enroll. The
vast majority of applicants denied access do not pursue any form of further formal education.
Most importantly, gaining access to the online option does not decrease the extent to which stu-
dents enroll in other educational programs. This is the first rigorous evidence that we know of
showing an online degree program can increase educational attainment, implying that the higher
education market had previously been failing to meet demand for this particular bundle of pro-
gram characteristics.
This model of online education thus has the potential to substantially increase the national
stock of computer science human capital. OMSCS enrolls about 1,170 Americans annually. Though
it is too early to measure completion rates, NSC data on the 2014 OMSCS enrollees suggest that
at least 62 percent are still enrolled at least two years after they begin the program and thus ap-
parently on track to graduate. The actual fraction who will graduate may be substantially higher
than that, given that the flexible nature of the program and mid-career students’ busy professional
and family lives makes persistence somewhat difficult to measure. For example, over 25 percent
of students who take a fall or spring semester off appear to re-enroll in the subsequent spring or
fall semester. Persistence to graduation could therefore be as high as 90 percent.19 Conservatively,
if only 62 percent of enrollees graduate, OMSCS will annually produce about 725 American com-
puter science master’s degree recipients. According to IPEDS’ Completion Survey, about 11,000
American citizens earned a master’s degree in computer science in 2013, the most recent year
data is available. This implies that OMSCS will generate a seven percent increase in the national
production of such degrees. If 90 percent of enrollees graduate, OMSCS will increase such produc-
tion by 10 percent. Either way, the program will produce a substantial fraction of such computer
science human capital.
We conclude with two questions raised by this research. The first concerns external validity.
To what extent will the conclusions drawn from this particular online program apply to other
populations and subjects? It seems likely, for example, that mid-career training in other fields
19By comparison, about 95 percent of MSCS students graduate within two years.
19
might be amenable to this model. The recent rise of “iMBA” and “micro-master’s” programs
suggests that other institutions believe there are untapped markets in such training. Whether
such low-cost, high-quality models can make inroads in undergraduate or secondary education
remains to be seen.
The second question concerns the quality of the education that this online option provides.
How large are the learning and labor market impacts of this online degree and how do they com-
pare to that of the in-person equivalent? Comparing the undergraduate colleges attended by
OMSCS and MSCS students suggests that OMSCS students are, on average, somewhat weaker
academically than their in-person counterparts. Nonetheless, comparisons of student achieve-
ment across the online and in-person formats suggests that OMSCS students finish their courses
with at least as much knowledge as their in-person counterparts (Goel and Joyner, 2016). We
hope to explore in subsequent work the extent to which the OMSCS degree is valued by the labor
market and whether and how it affects career advancement. Whether the labor market perceives
OMSCS graduates as similar in quality to their in-person counterparts will have implications for
the impact of such models on the postsecondary sector more generally (Hoxby, 2014).
20
References
Alpert, W. T., K. A. Couch, and O. R. Harmon (2016). A randomized assessment of online learning.American Economic Review 106(5), 378–82.
Banerjee, A. V. and E. Duflo (2014). (Dis) organization and success in an economics MOOC. TheAmerican Economic Review 104(5), 514–518.
Bettinger, E., L. Fox, S. Loeb, and E. Taylor (2015). Changing distributions: How online collegeclasses alter student and professor performance. Technical report, Working Paper, StanfordUniversity.
Bowen, W. G., M. M. Chingos, K. A. Lack, and T. I. Nygren (2014). Interactive learning online atpublic universities: Evidence from a six-campus randomized trial. Journal of Policy Analysis andManagement 33(1), 94–111.
Calonico, S., M. D. Cattaneo, and R. Titiunik (2014). Robust nonparametric confidence intervalsfor regression-discontinuity designs. Econometrica 82(6), 2295–2326.
Deming, D. J., C. Goldin, L. F. Katz, and N. Yuchtman (2015). Can online learning bend the highereducation cost curve? The American Economic Review 105(5), 496–501.
Deming, D. J., N. Yuchtman, A. Abulafi, C. Goldin, and L. F. Katz (2016). The value of post-secondary credentials in the labor market: An experimental study. The American Economic Re-view 106(3), 778–806.
Dynarski, S. M., S. W. Hemelt, and J. M. Hyman (2015). The missing manual: Using NationalStudent Clearinghouse data to track postsecondary outcomes. Educational Evaluation and PolicyAnalysis 37(1 suppl), 53S–79S.
Figlio, D., M. Rush, and L. Yin (2013). Is it live or is it internet? Experimental estimates of theeffects of online instruction on student learning. Journal of Labor Economics 31(4), 763–784.
Goel, A. and D. Joyner (2016). An experiment in teaching cognitive systems online. InternationalJournal for Scholarship of Technology Enhanced Learning 1(1).
Hoxby, C. M. (2014). The economics of online postsecondary education: MOOCs, nonselectiveeducation, and highly selective education. The American Economic Review 104(5), 528–533.
Imbens, G. and K. Kalyanaraman (2012). Optimal bandwidth choice for the regression disconti-nuity estimator. The Review of economic studies 79(3), 933–959.
Joyce, T., S. Crockett, D. A. Jaeger, O. Altindag, and S. D. O’Connell (2015). Does classroom timematter? Economics of Education Review 46, 64–77.
Krieg, J. M. and S. E. Henson (2016). The educational impact of online learning: How do universitystudents perform in subsequent courses? Education Finance and Policy 11(4), 426–448.
Lee, D. S. and D. Card (2008). Regression discontinuity inference with specification error. Journalof Econometrics 142(2), 655–674.
21
McCrary, J. (2008). Manipulation of the running variable in the regression discontinuity design: Adensity test. Journal of Econometrics 142(2), 698–714.
McPherson, M. S. and L. S. Bacow (2015). Online higher education: Beyond the hype cycle. TheJournal of Economic Perspectives 29(4), 135–153.
Perna, L., A. Ruby, R. Boruch, N. Wang, J. Scull, C. Evans, and S. Ahmad (2013). The life cycle of amillion mooc users. In MOOC Research Initiative Conference, pp. 5–6.
Xu, D. and S. S. Jaggars (2014). Performance gaps between online and face-to-face courses: Differ-ences across types of students and academic subject areas. The Journal of Higher Education 85(5),633–659.
22
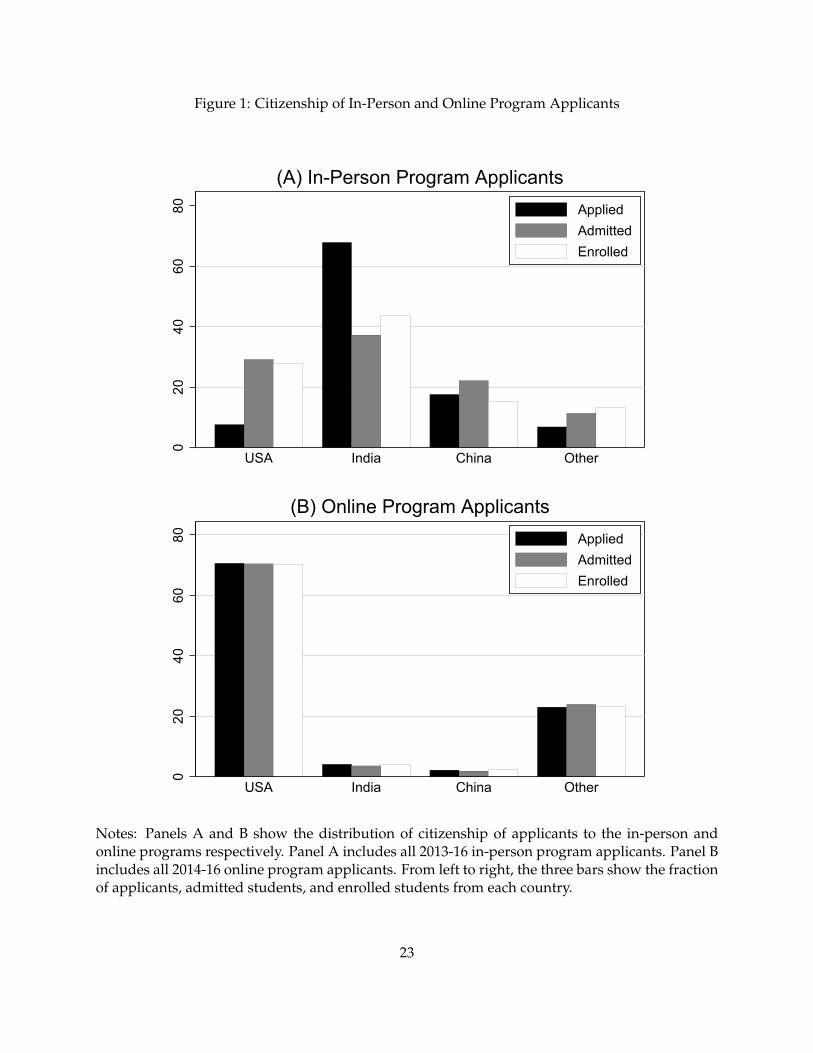
Figure 1: Citizenship of In-Person and Online Program Applicants
020
4060
80
USA India China Other
(A) In-Person Program ApplicantsAppliedAdmittedEnrolled
020
4060
80
USA India China Other
(B) Online Program ApplicantsAppliedAdmittedEnrolled
Notes: Panels A and B show the distribution of citizenship of applicants to the in-person andonline programs respectively. Panel A includes all 2013-16 in-person program applicants. Panel Bincludes all 2014-16 online program applicants. From left to right, the three bars show the fractionof applicants, admitted students, and enrolled students from each country.
23
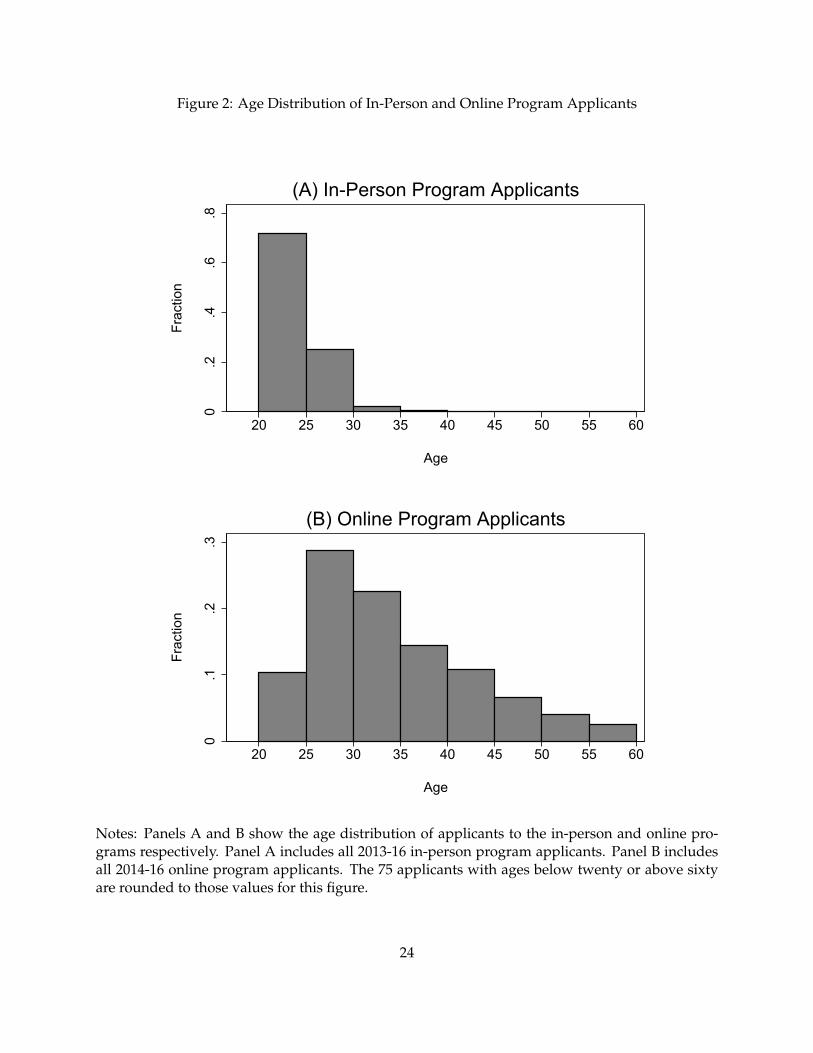
Figure 2: Age Distribution of In-Person and Online Program Applicants
0.2
.4.6
.8
Frac
tion
20 25 30 35 40 45 50 55 60
Age
(A) In-Person Program Applicants0
.1.2
.3
Frac
tion
20 25 30 35 40 45 50 55 60
Age
(B) Online Program Applicants
Notes: Panels A and B show the age distribution of applicants to the in-person and online pro-grams respectively. Panel A includes all 2013-16 in-person program applicants. Panel B includesall 2014-16 online program applicants. The 75 applicants with ages below twenty or above sixtyare rounded to those values for this figure.
24
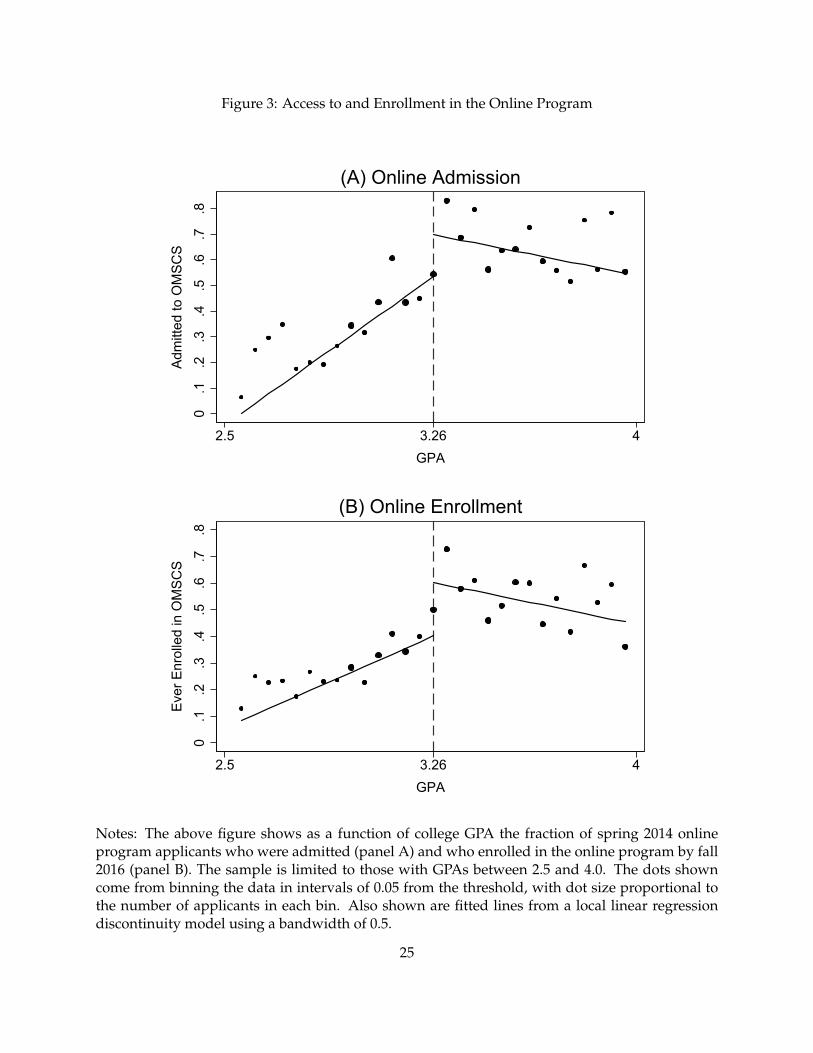
Figure 3: Access to and Enrollment in the Online Program
0.1
.2.3
.4.5
.6.7
.8A
dmitt
ed to
OM
SC
S
2.5 3.26 4GPA
(A) Online Admission0
.1.2
.3.4
.5.6
.7.8
Eve
r Enr
olle
d in
OM
SC
S
2.5 3.26 4GPA
(B) Online Enrollment
Notes: The above figure shows as a function of college GPA the fraction of spring 2014 onlineprogram applicants who were admitted (panel A) and who enrolled in the online program by fall2016 (panel B). The sample is limited to those with GPAs between 2.5 and 4.0. The dots showncome from binning the data in intervals of 0.05 from the threshold, with dot size proportional tothe number of applicants in each bin. Also shown are fitted lines from a local linear regressiondiscontinuity model using a bandwidth of 0.5.
25
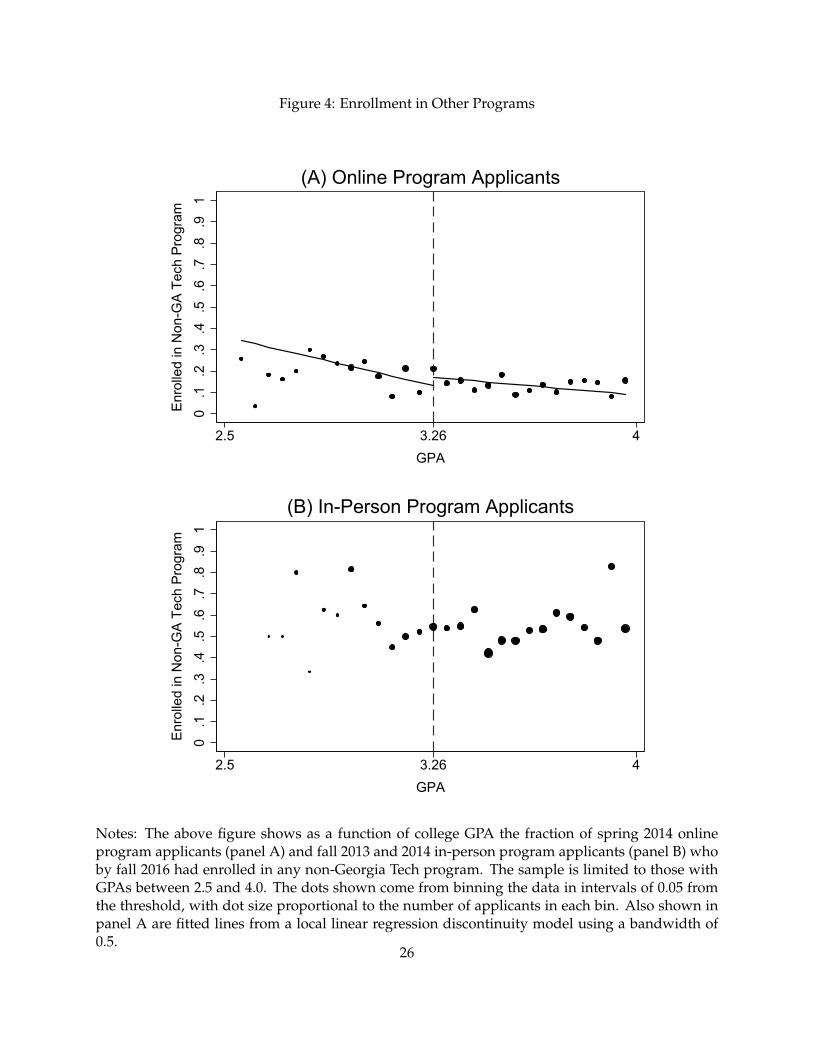
Figure 4: Enrollment in Other Programs
0.1
.2.3
.4.5
.6.7
.8.9
1E
nrol
led
in N
on-G
A T
ech
Pro
gram
2.5 3.26 4GPA
(A) Online Program Applicants0
.1.2
.3.4
.5.6
.7.8
.91
Enr
olle
d in
Non
-GA
Tec
h P
rogr
am
2.5 3.26 4GPA
(B) In-Person Program Applicants
Notes: The above figure shows as a function of college GPA the fraction of spring 2014 onlineprogram applicants (panel A) and fall 2013 and 2014 in-person program applicants (panel B) whoby fall 2016 had enrolled in any non-Georgia Tech program. The sample is limited to those withGPAs between 2.5 and 4.0. The dots shown come from binning the data in intervals of 0.05 fromthe threshold, with dot size proportional to the number of applicants in each bin. Also shown inpanel A are fitted lines from a local linear regression discontinuity model using a bandwidth of0.5.
26
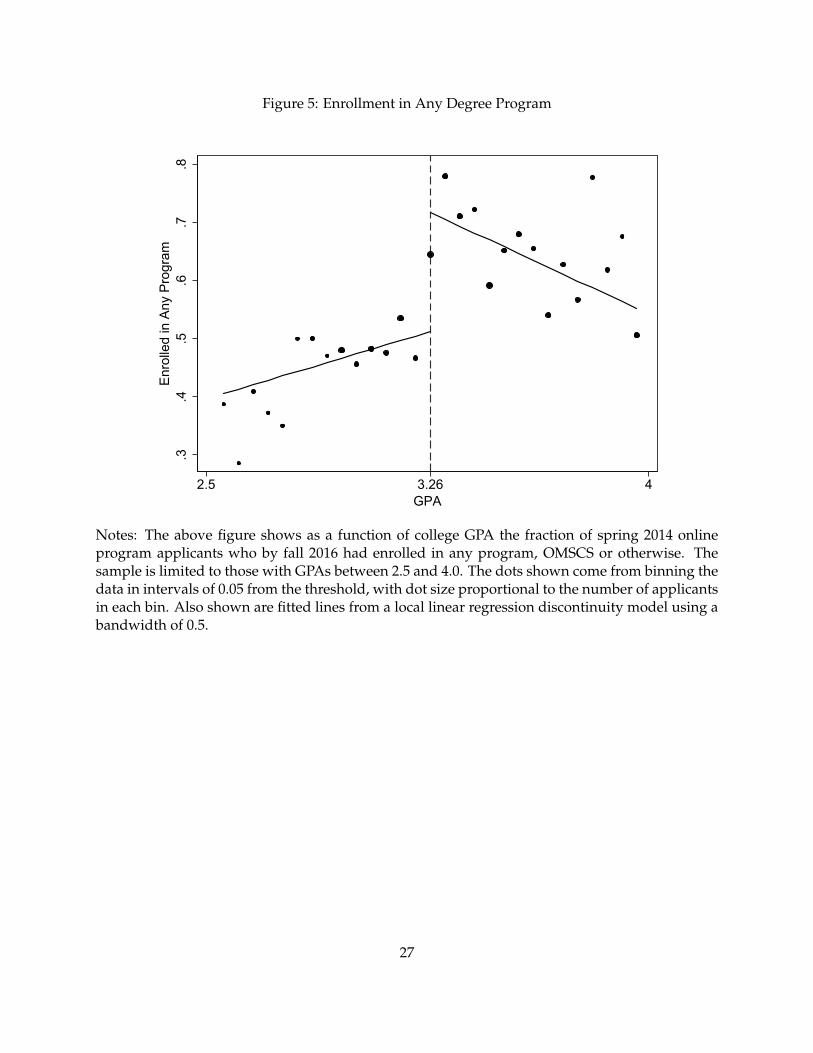
Figure 5: Enrollment in Any Degree Program
.3.4
.5.6
.7.8
Enr
olle
d in
Any
Pro
gram
2.5 3.26 4GPA
Notes: The above figure shows as a function of college GPA the fraction of spring 2014 onlineprogram applicants who by fall 2016 had enrolled in any program, OMSCS or otherwise. Thesample is limited to those with GPAs between 2.5 and 4.0. The dots shown come from binning thedata in intervals of 0.05 from the threshold, with dot size proportional to the number of applicantsin each bin. Also shown are fitted lines from a local linear regression discontinuity model using abandwidth of 0.5.
27

Table 1: Characteristics of Program Applicants and Enrollees
All US
Online In-person NSF Online In-person NSF(1) (2) (3) (4) (5) (6)
(A) Application and enrollment
Degrees awarded 20,983 10,948Number applied (annualized) 3,410 1,851 2,407 141Number admitted (annualized) 2,075 233 1,462 68Number enrolled (annualized) 1,663 120 1,169 33Admission rate 0.61 0.13 0.61 0.48Enrollment rate 0.49 0.06 0.49 0.24
(B) Applicant characteristics
U.S. citizen 0.71 0.08Age 33.8 23.9 34.7 25.1Employed 0.87 0.49 0.90 0.41White 0.50 0.06 0.64 0.54Black or Hispanic 0.16 0.02 0.17 0.15Asian 0.31 0.91 0.15 0.27Female 0.15 0.25 0.13 0.17Computer science major 0.37 0.63 0.40 0.52
(C) Enrollee characteristics
U.S. citizen 0.70 0.28 0.52Age 32.4 24.1 33.0 25.8Employed 0.89 0.42 0.92 0.41White 0.51 0.23 0.67 0.61 0.54Black or Hispanic 0.12 0.06 0.12 0.14 0.18Asian 0.33 0.70 0.17 0.20 0.14Female 0.13 0.30 0.27 0.11 0.17 0.26Computer science major 0.42 0.62 0.46 0.56
Notes: Data in columns 1 and 4 come from all 2014-16 online program applicants. Data in columns 2 and and 5come from all 2013-16 in-person program applicants. Column 3 describes those who completed computer sciencemaster’s degrees in the US in 2013 and comes from 2013 IPEDS Completion Survey, accessed through the NSF’sWebCASPAR site. Columns 1-3 include all individuals, while columns 4-6 limit the sample to American citizens.For comparability, the numbers in columns 1, 2, 4 and 5 of panel A are scaled to be annual. In panel A, the enrollmentrate is calculated as the fraction of applicants who enrolled.
28
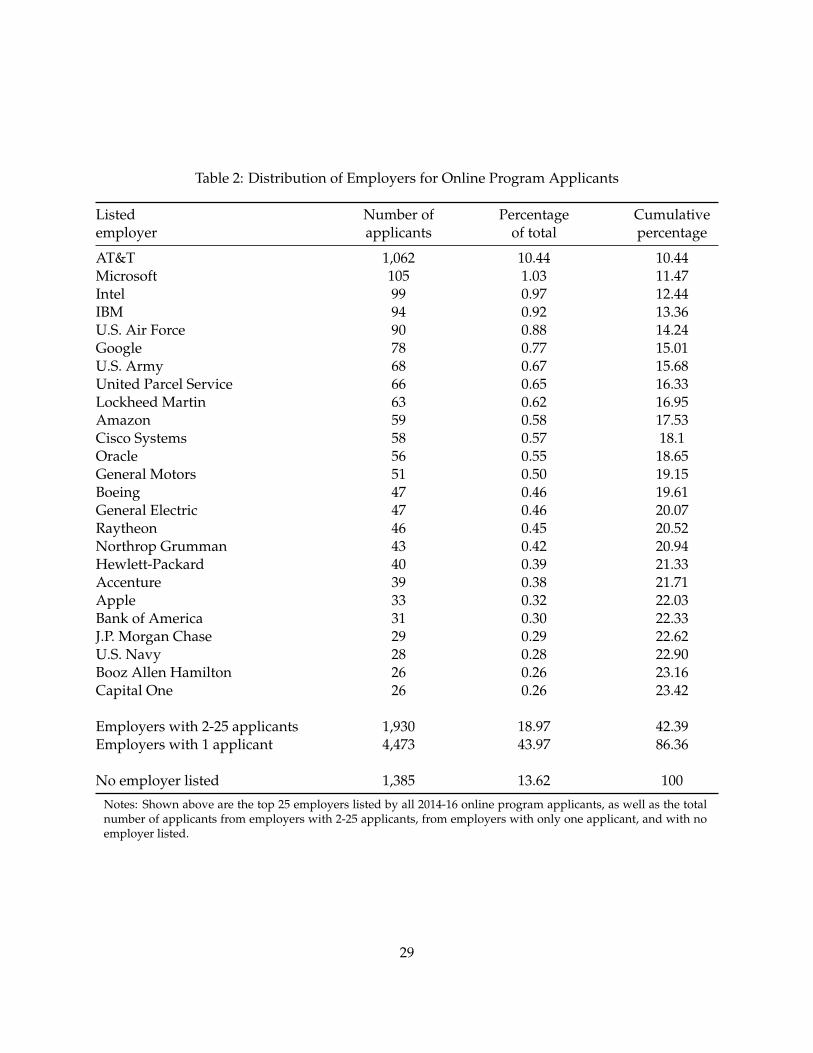
Table 2: Distribution of Employers for Online Program Applicants
Listed Number of Percentage Cumulativeemployer applicants of total percentage
AT&T 1,062 10.44 10.44Microsoft 105 1.03 11.47Intel 99 0.97 12.44IBM 94 0.92 13.36U.S. Air Force 90 0.88 14.24Google 78 0.77 15.01U.S. Army 68 0.67 15.68United Parcel Service 66 0.65 16.33Lockheed Martin 63 0.62 16.95Amazon 59 0.58 17.53Cisco Systems 58 0.57 18.1Oracle 56 0.55 18.65General Motors 51 0.50 19.15Boeing 47 0.46 19.61General Electric 47 0.46 20.07Raytheon 46 0.45 20.52Northrop Grumman 43 0.42 20.94Hewlett-Packard 40 0.39 21.33Accenture 39 0.38 21.71Apple 33 0.32 22.03Bank of America 31 0.30 22.33J.P. Morgan Chase 29 0.29 22.62U.S. Navy 28 0.28 22.90Booz Allen Hamilton 26 0.26 23.16Capital One 26 0.26 23.42
Employers with 2-25 applicants 1,930 18.97 42.39Employers with 1 applicant 4,473 43.97 86.36
No employer listed 1,385 13.62 100
Notes: Shown above are the top 25 employers listed by all 2014-16 online program applicants, as well as the totalnumber of applicants from employers with 2-25 applicants, from employers with only one applicant, and with noemployer listed.
29
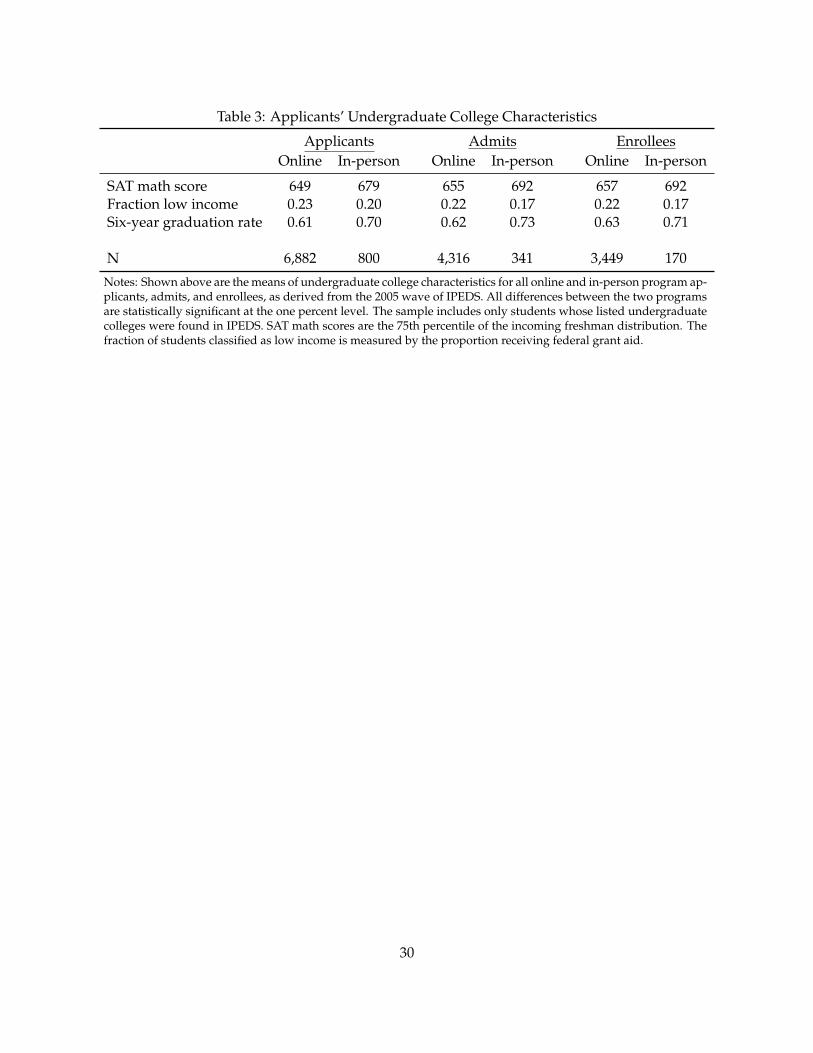
Table 3: Applicants’ Undergraduate College Characteristics
Applicants Admits EnrolleesOnline In-person Online In-person Online In-person
SAT math score 649 679 655 692 657 692Fraction low income 0.23 0.20 0.22 0.17 0.22 0.17Six-year graduation rate 0.61 0.70 0.62 0.73 0.63 0.71
N 6,882 800 4,316 341 3,449 170
Notes: Shown above are the means of undergraduate college characteristics for all online and in-person program ap-plicants, admits, and enrollees, as derived from the 2005 wave of IPEDS. All differences between the two programsare statistically significant at the one percent level. The sample includes only students whose listed undergraduatecolleges were found in IPEDS. SAT math scores are the 75th percentile of the incoming freshman distribution. Thefraction of students classified as low income is measured by the proportion receiving federal grant aid.
30
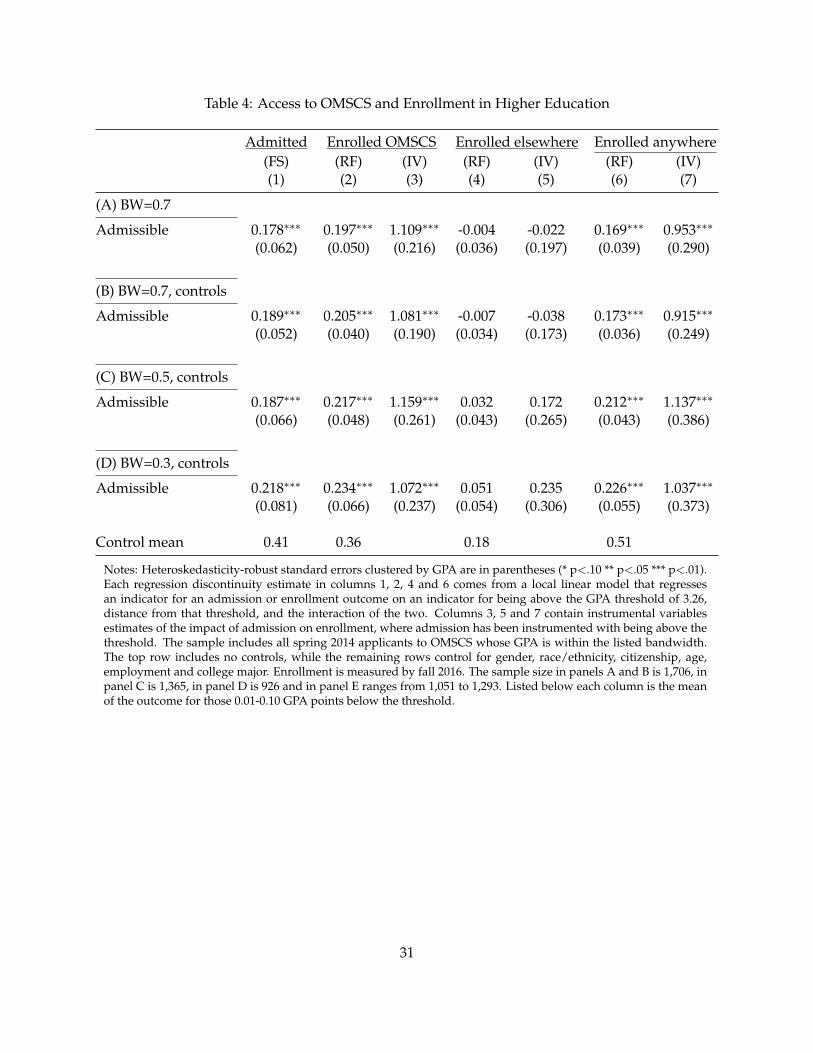
Table 4: Access to OMSCS and Enrollment in Higher Education
Admitted Enrolled OMSCS Enrolled elsewhere Enrolled anywhere(FS) (RF) (IV) (RF) (IV) (RF) (IV)(1) (2) (3) (4) (5) (6) (7)
(A) BW=0.7
Admissible 0.178∗∗∗ 0.197∗∗∗ 1.109∗∗∗ -0.004 -0.022 0.169∗∗∗ 0.953∗∗∗
(0.062) (0.050) (0.216) (0.036) (0.197) (0.039) (0.290)
(B) BW=0.7, controls
Admissible 0.189∗∗∗ 0.205∗∗∗ 1.081∗∗∗ -0.007 -0.038 0.173∗∗∗ 0.915∗∗∗
(0.052) (0.040) (0.190) (0.034) (0.173) (0.036) (0.249)
(C) BW=0.5, controls
Admissible 0.187∗∗∗ 0.217∗∗∗ 1.159∗∗∗ 0.032 0.172 0.212∗∗∗ 1.137∗∗∗
(0.066) (0.048) (0.261) (0.043) (0.265) (0.043) (0.386)
(D) BW=0.3, controls
Admissible 0.218∗∗∗ 0.234∗∗∗ 1.072∗∗∗ 0.051 0.235 0.226∗∗∗ 1.037∗∗∗
(0.081) (0.066) (0.237) (0.054) (0.306) (0.055) (0.373)
Control mean 0.41 0.36 0.18 0.51
Notes: Heteroskedasticity-robust standard errors clustered by GPA are in parentheses (* p<.10 ** p<.05 *** p<.01).Each regression discontinuity estimate in columns 1, 2, 4 and 6 comes from a local linear model that regressesan indicator for an admission or enrollment outcome on an indicator for being above the GPA threshold of 3.26,distance from that threshold, and the interaction of the two. Columns 3, 5 and 7 contain instrumental variablesestimates of the impact of admission on enrollment, where admission has been instrumented with being above thethreshold. The sample includes all spring 2014 applicants to OMSCS whose GPA is within the listed bandwidth.The top row includes no controls, while the remaining rows control for gender, race/ethnicity, citizenship, age,employment and college major. Enrollment is measured by fall 2016. The sample size in panels A and B is 1,706, inpanel C is 1,365, in panel D is 926 and in panel E ranges from 1,051 to 1,293. Listed below each column is the meanof the outcome for those 0.01-0.10 GPA points below the threshold.
31
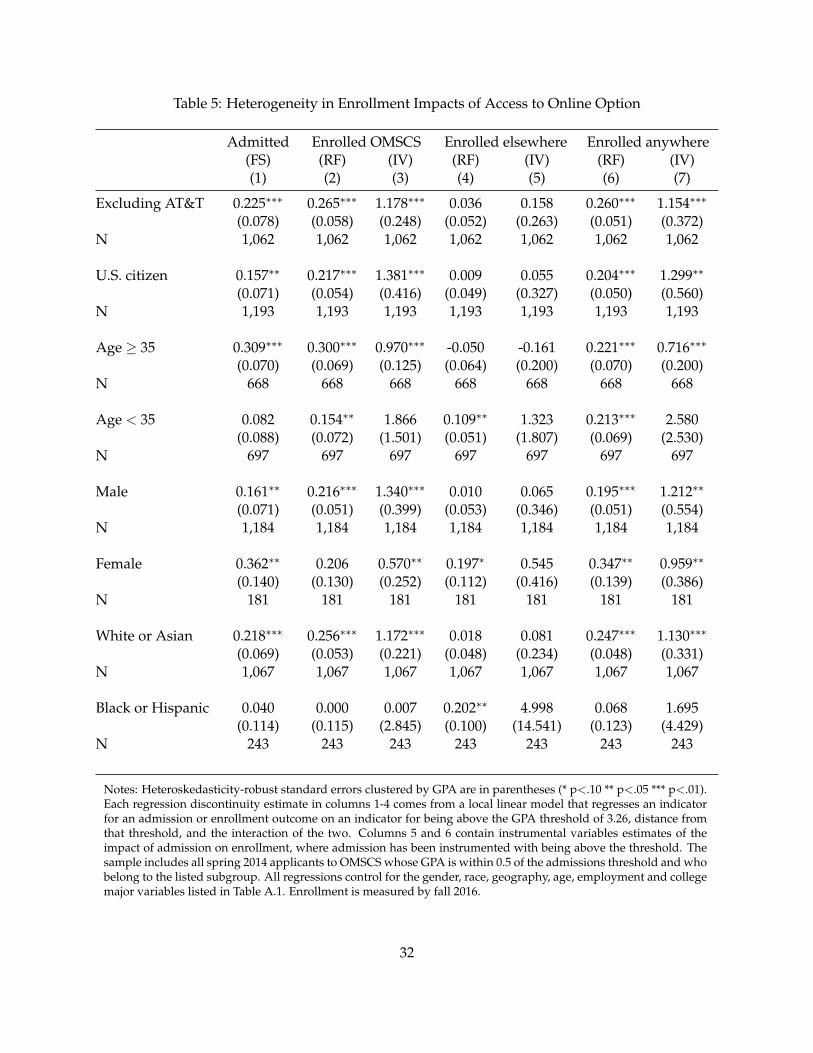
Table 5: Heterogeneity in Enrollment Impacts of Access to Online Option
Admitted Enrolled OMSCS Enrolled elsewhere Enrolled anywhere(FS) (RF) (IV) (RF) (IV) (RF) (IV)(1) (2) (3) (4) (5) (6) (7)
Excluding AT&T 0.225∗∗∗ 0.265∗∗∗ 1.178∗∗∗ 0.036 0.158 0.260∗∗∗ 1.154∗∗∗
(0.078) (0.058) (0.248) (0.052) (0.263) (0.051) (0.372)N 1,062 1,062 1,062 1,062 1,062 1,062 1,062
U.S. citizen 0.157∗∗ 0.217∗∗∗ 1.381∗∗∗ 0.009 0.055 0.204∗∗∗ 1.299∗∗
(0.071) (0.054) (0.416) (0.049) (0.327) (0.050) (0.560)N 1,193 1,193 1,193 1,193 1,193 1,193 1,193
Age ≥ 35 0.309∗∗∗ 0.300∗∗∗ 0.970∗∗∗ -0.050 -0.161 0.221∗∗∗ 0.716∗∗∗
(0.070) (0.069) (0.125) (0.064) (0.200) (0.070) (0.200)N 668 668 668 668 668 668 668
Age < 35 0.082 0.154∗∗ 1.866 0.109∗∗ 1.323 0.213∗∗∗ 2.580(0.088) (0.072) (1.501) (0.051) (1.807) (0.069) (2.530)
N 697 697 697 697 697 697 697
Male 0.161∗∗ 0.216∗∗∗ 1.340∗∗∗ 0.010 0.065 0.195∗∗∗ 1.212∗∗
(0.071) (0.051) (0.399) (0.053) (0.346) (0.051) (0.554)N 1,184 1,184 1,184 1,184 1,184 1,184 1,184
Female 0.362∗∗ 0.206 0.570∗∗ 0.197∗ 0.545 0.347∗∗ 0.959∗∗
(0.140) (0.130) (0.252) (0.112) (0.416) (0.139) (0.386)N 181 181 181 181 181 181 181
White or Asian 0.218∗∗∗ 0.256∗∗∗ 1.172∗∗∗ 0.018 0.081 0.247∗∗∗ 1.130∗∗∗
(0.069) (0.053) (0.221) (0.048) (0.234) (0.048) (0.331)N 1,067 1,067 1,067 1,067 1,067 1,067 1,067
Black or Hispanic 0.040 0.000 0.007 0.202∗∗ 4.998 0.068 1.695(0.114) (0.115) (2.845) (0.100) (14.541) (0.123) (4.429)
N 243 243 243 243 243 243 243
Notes: Heteroskedasticity-robust standard errors clustered by GPA are in parentheses (* p<.10 ** p<.05 *** p<.01).Each regression discontinuity estimate in columns 1-4 comes from a local linear model that regresses an indicatorfor an admission or enrollment outcome on an indicator for being above the GPA threshold of 3.26, distance fromthat threshold, and the interaction of the two. Columns 5 and 6 contain instrumental variables estimates of theimpact of admission on enrollment, where admission has been instrumented with being above the threshold. Thesample includes all spring 2014 applicants to OMSCS whose GPA is within 0.5 of the admissions threshold and whobelong to the listed subgroup. All regressions control for the gender, race, geography, age, employment and collegemajor variables listed in Table A.1. Enrollment is measured by fall 2016.
32
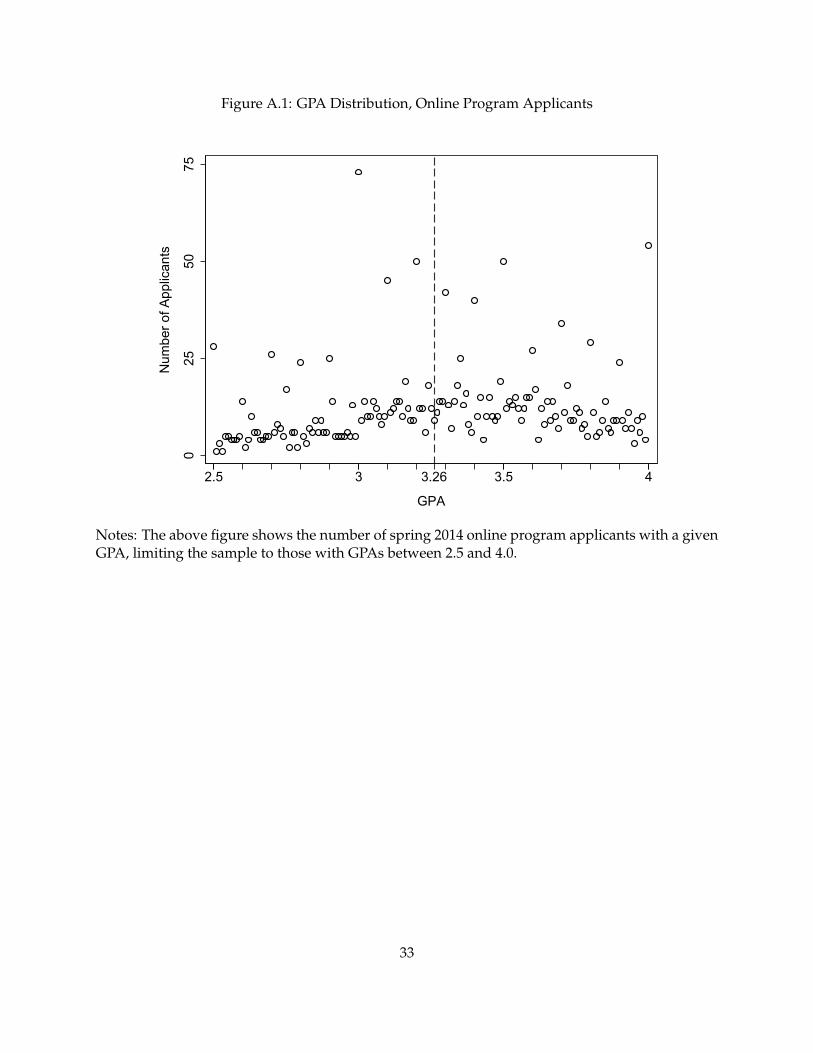
Figure A.1: GPA Distribution, Online Program Applicants
025
5075
Num
ber o
f App
lican
ts
2.5 3 3.26 3.5 4
GPA
Notes: The above figure shows the number of spring 2014 online program applicants with a givenGPA, limiting the sample to those with GPAs between 2.5 and 4.0.
33
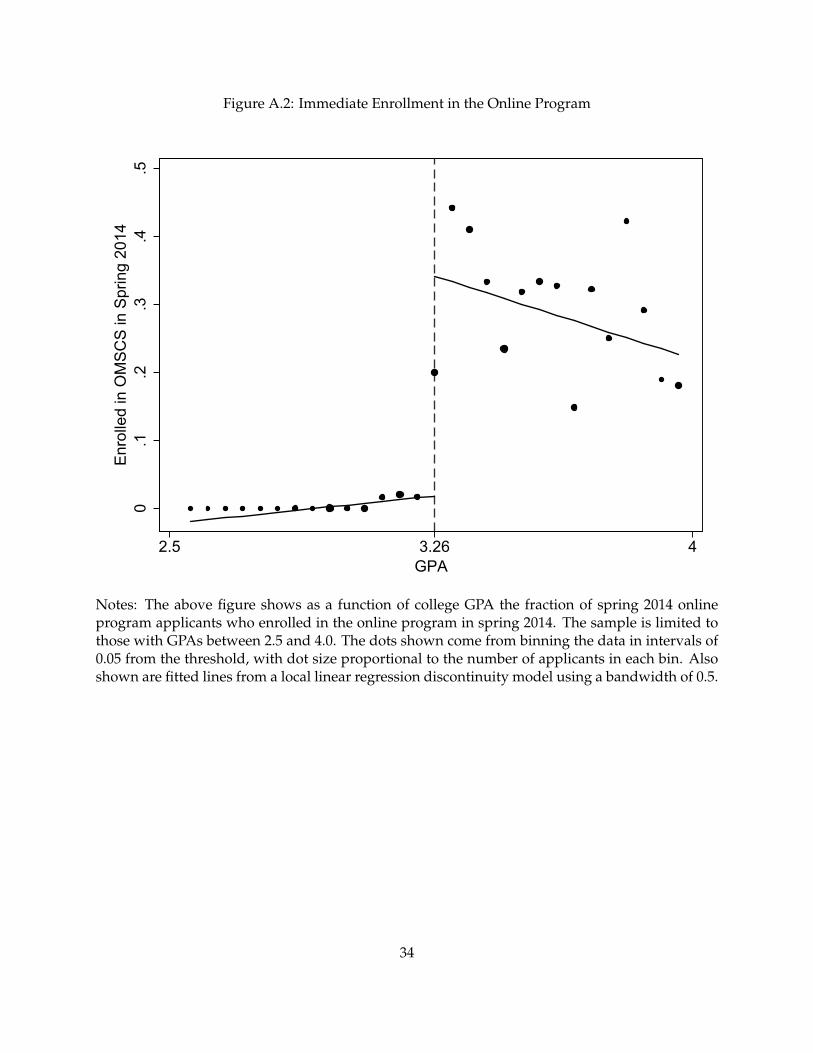
Figure A.2: Immediate Enrollment in the Online Program
0.1
.2.3
.4.5
Enr
olle
d in
OM
SC
S in
Spr
ing
2014
2.5 3.26 4GPA
Notes: The above figure shows as a function of college GPA the fraction of spring 2014 onlineprogram applicants who enrolled in the online program in spring 2014. The sample is limited tothose with GPAs between 2.5 and 4.0. The dots shown come from binning the data in intervals of0.05 from the threshold, with dot size proportional to the number of applicants in each bin. Alsoshown are fitted lines from a local linear regression discontinuity model using a bandwidth of 0.5.
34
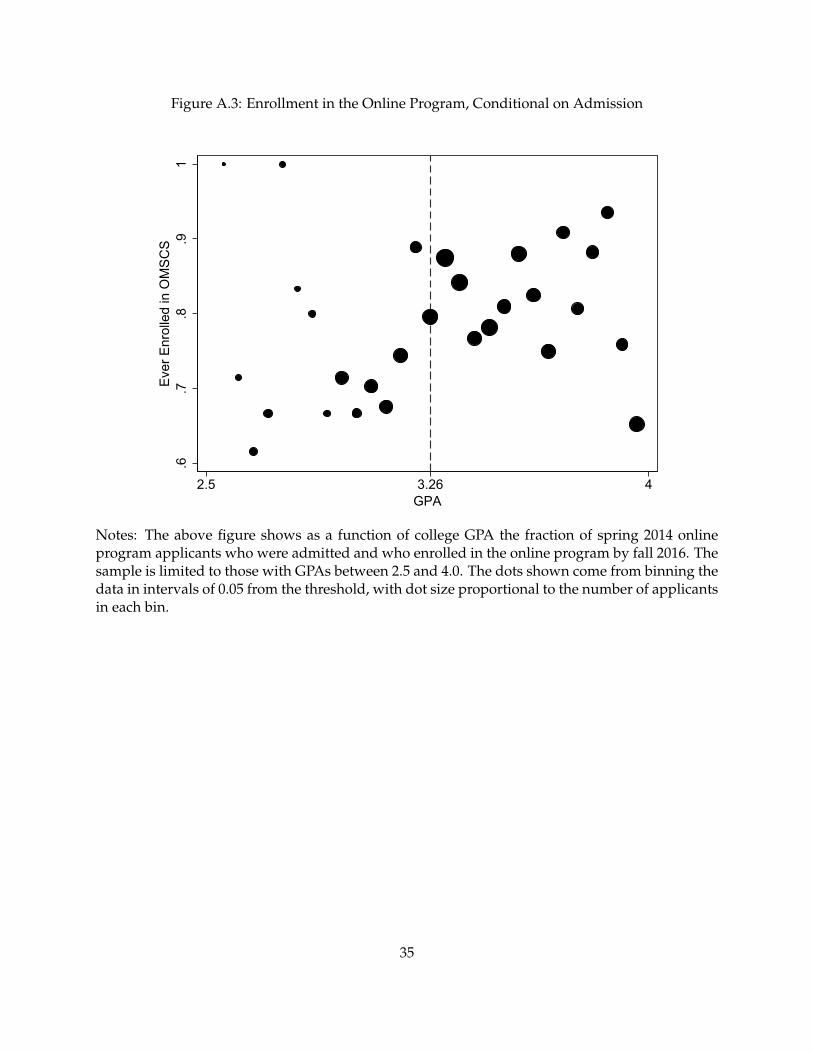
Figure A.3: Enrollment in the Online Program, Conditional on Admission
.6.7
.8.9
1E
ver E
nrol
led
in O
MS
CS
2.5 3.26 4GPA
Notes: The above figure shows as a function of college GPA the fraction of spring 2014 onlineprogram applicants who were admitted and who enrolled in the online program by fall 2016. Thesample is limited to those with GPAs between 2.5 and 4.0. The dots shown come from binning thedata in intervals of 0.05 from the threshold, with dot size proportional to the number of applicantsin each bin.
35
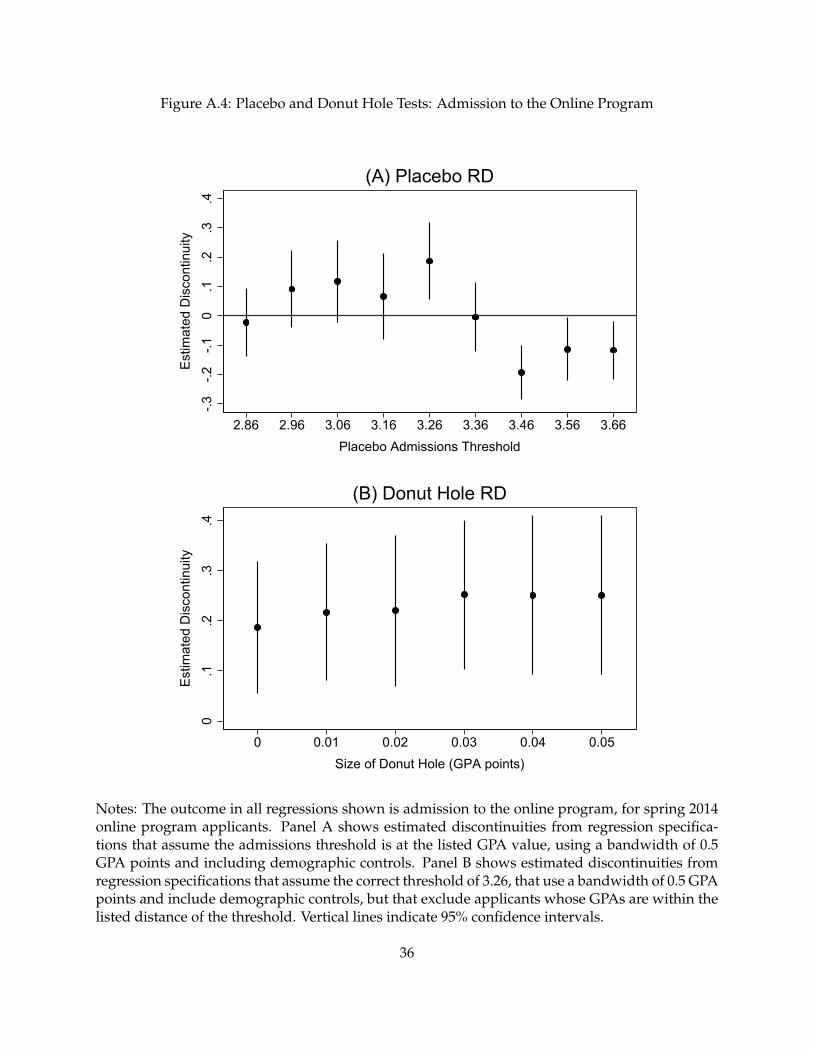
Figure A.4: Placebo and Donut Hole Tests: Admission to the Online Program
-.3-.2
-.10
.1.2
.3.4
Est
imat
ed D
isco
ntin
uity
2.86 2.96 3.06 3.16 3.26 3.36 3.46 3.56 3.66Placebo Admissions Threshold
(A) Placebo RD0
.1.2
.3.4
Est
imat
ed D
isco
ntin
uity
0 0.01 0.02 0.03 0.04 0.05Size of Donut Hole (GPA points)
(B) Donut Hole RD
Notes: The outcome in all regressions shown is admission to the online program, for spring 2014online program applicants. Panel A shows estimated discontinuities from regression specifica-tions that assume the admissions threshold is at the listed GPA value, using a bandwidth of 0.5GPA points and including demographic controls. Panel B shows estimated discontinuities fromregression specifications that assume the correct threshold of 3.26, that use a bandwidth of 0.5 GPApoints and include demographic controls, but that exclude applicants whose GPAs are within thelisted distance of the threshold. Vertical lines indicate 95% confidence intervals.
36
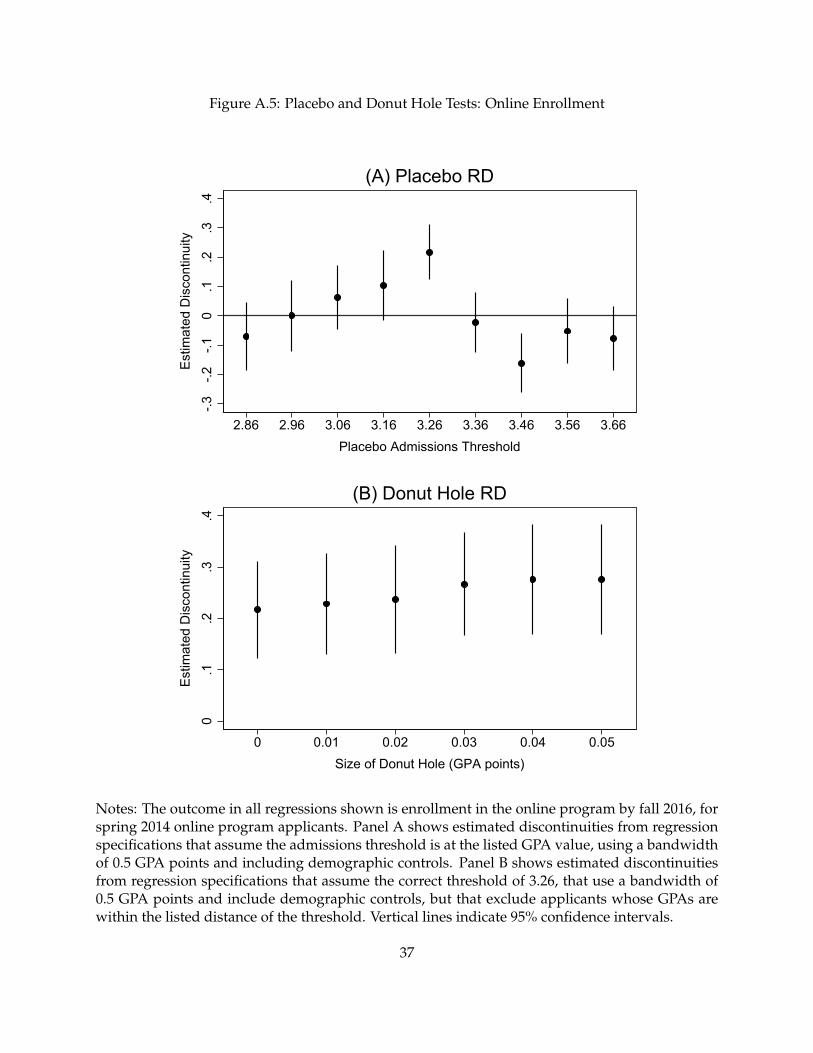
Figure A.5: Placebo and Donut Hole Tests: Online Enrollment
-.3-.2
-.10
.1.2
.3.4
Est
imat
ed D
isco
ntin
uity
2.86 2.96 3.06 3.16 3.26 3.36 3.46 3.56 3.66Placebo Admissions Threshold
(A) Placebo RD0
.1.2
.3.4
Est
imat
ed D
isco
ntin
uity
0 0.01 0.02 0.03 0.04 0.05Size of Donut Hole (GPA points)
(B) Donut Hole RD
Notes: The outcome in all regressions shown is enrollment in the online program by fall 2016, forspring 2014 online program applicants. Panel A shows estimated discontinuities from regressionspecifications that assume the admissions threshold is at the listed GPA value, using a bandwidthof 0.5 GPA points and including demographic controls. Panel B shows estimated discontinuitiesfrom regression specifications that assume the correct threshold of 3.26, that use a bandwidth of0.5 GPA points and include demographic controls, but that exclude applicants whose GPAs arewithin the listed distance of the threshold. Vertical lines indicate 95% confidence intervals.
37
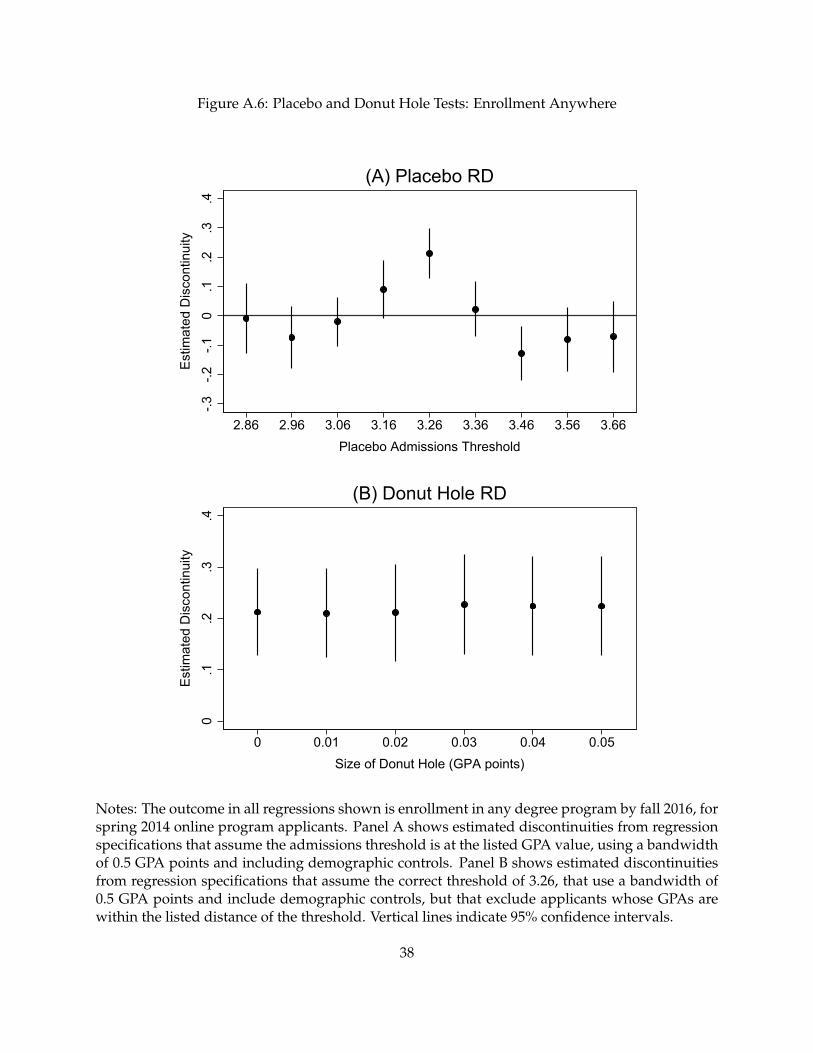
Figure A.6: Placebo and Donut Hole Tests: Enrollment Anywhere
-.3-.2
-.10
.1.2
.3.4
Est
imat
ed D
isco
ntin
uity
2.86 2.96 3.06 3.16 3.26 3.36 3.46 3.56 3.66Placebo Admissions Threshold
(A) Placebo RD0
.1.2
.3.4
Est
imat
ed D
isco
ntin
uity
0 0.01 0.02 0.03 0.04 0.05Size of Donut Hole (GPA points)
(B) Donut Hole RD
Notes: The outcome in all regressions shown is enrollment in any degree program by fall 2016, forspring 2014 online program applicants. Panel A shows estimated discontinuities from regressionspecifications that assume the admissions threshold is at the listed GPA value, using a bandwidthof 0.5 GPA points and including demographic controls. Panel B shows estimated discontinuitiesfrom regression specifications that assume the correct threshold of 3.26, that use a bandwidth of0.5 GPA points and include demographic controls, but that exclude applicants whose GPAs arewithin the listed distance of the threshold. Vertical lines indicate 95% confidence intervals.
38
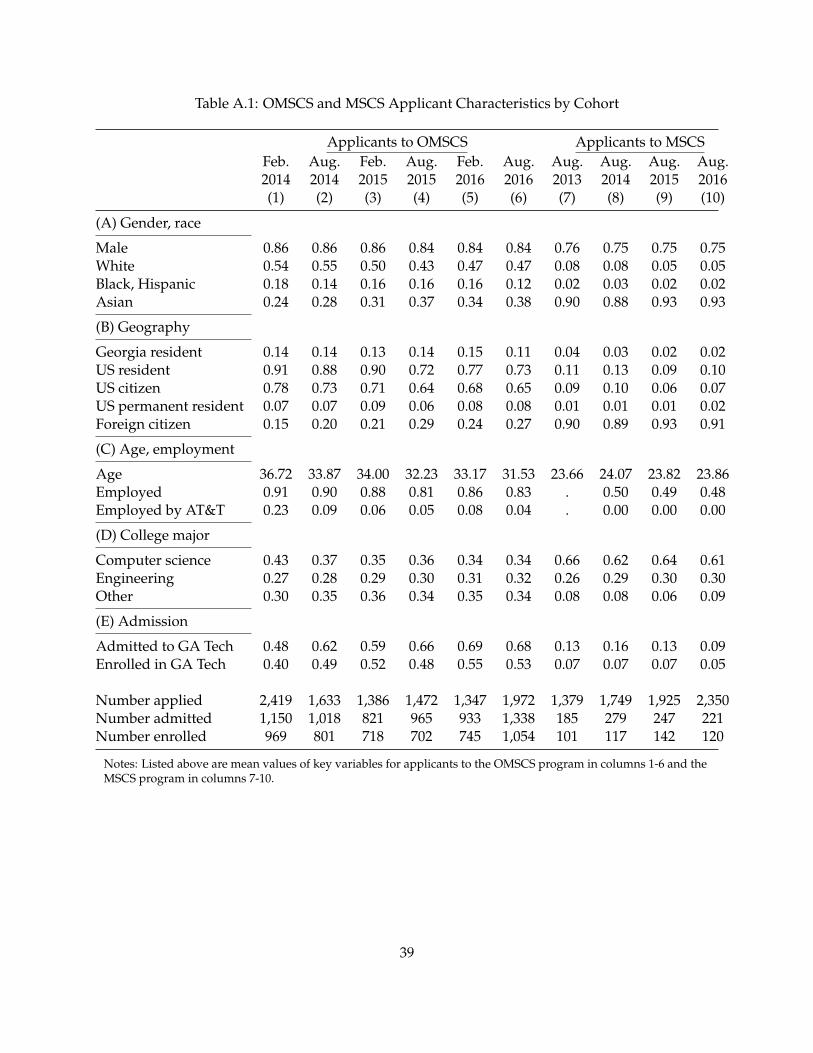
Table A.1: OMSCS and MSCS Applicant Characteristics by Cohort
Applicants to OMSCS Applicants to MSCSFeb. Aug. Feb. Aug. Feb. Aug. Aug. Aug. Aug. Aug.2014 2014 2015 2015 2016 2016 2013 2014 2015 2016(1) (2) (3) (4) (5) (6) (7) (8) (9) (10)
(A) Gender, race
Male 0.86 0.86 0.86 0.84 0.84 0.84 0.76 0.75 0.75 0.75White 0.54 0.55 0.50 0.43 0.47 0.47 0.08 0.08 0.05 0.05Black, Hispanic 0.18 0.14 0.16 0.16 0.16 0.12 0.02 0.03 0.02 0.02Asian 0.24 0.28 0.31 0.37 0.34 0.38 0.90 0.88 0.93 0.93
(B) Geography
Georgia resident 0.14 0.14 0.13 0.14 0.15 0.11 0.04 0.03 0.02 0.02US resident 0.91 0.88 0.90 0.72 0.77 0.73 0.11 0.13 0.09 0.10US citizen 0.78 0.73 0.71 0.64 0.68 0.65 0.09 0.10 0.06 0.07US permanent resident 0.07 0.07 0.09 0.06 0.08 0.08 0.01 0.01 0.01 0.02Foreign citizen 0.15 0.20 0.21 0.29 0.24 0.27 0.90 0.89 0.93 0.91
(C) Age, employment
Age 36.72 33.87 34.00 32.23 33.17 31.53 23.66 24.07 23.82 23.86Employed 0.91 0.90 0.88 0.81 0.86 0.83 . 0.50 0.49 0.48Employed by AT&T 0.23 0.09 0.06 0.05 0.08 0.04 . 0.00 0.00 0.00
(D) College major
Computer science 0.43 0.37 0.35 0.36 0.34 0.34 0.66 0.62 0.64 0.61Engineering 0.27 0.28 0.29 0.30 0.31 0.32 0.26 0.29 0.30 0.30Other 0.30 0.35 0.36 0.34 0.35 0.34 0.08 0.08 0.06 0.09
(E) Admission
Admitted to GA Tech 0.48 0.62 0.59 0.66 0.69 0.68 0.13 0.16 0.13 0.09Enrolled in GA Tech 0.40 0.49 0.52 0.48 0.55 0.53 0.07 0.07 0.07 0.05
Number applied 2,419 1,633 1,386 1,472 1,347 1,972 1,379 1,749 1,925 2,350Number admitted 1,150 1,018 821 965 933 1,338 185 279 247 221Number enrolled 969 801 718 702 745 1,054 101 117 142 120
Notes: Listed above are mean values of key variables for applicants to the OMSCS program in columns 1-6 and theMSCS program in columns 7-10.
39
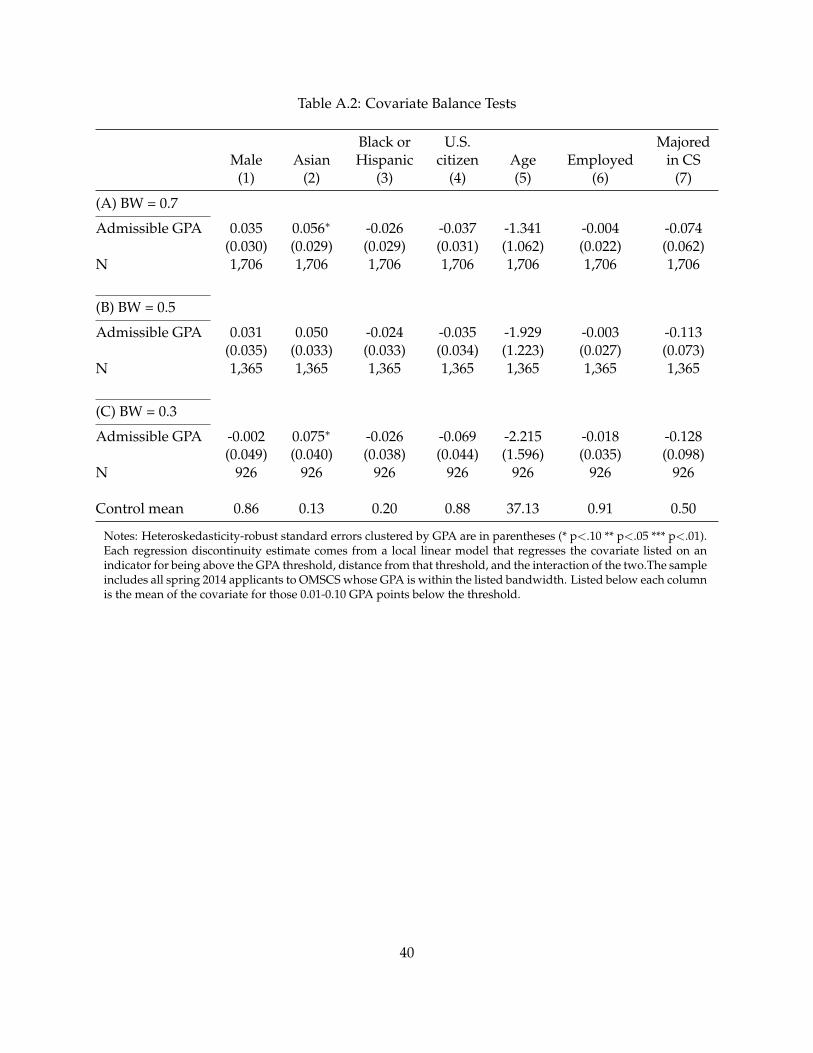
Table A.2: Covariate Balance Tests
Black or U.S. MajoredMale Asian Hispanic citizen Age Employed in CS
(1) (2) (3) (4) (5) (6) (7)
(A) BW = 0.7
Admissible GPA 0.035 0.056∗ -0.026 -0.037 -1.341 -0.004 -0.074(0.030) (0.029) (0.029) (0.031) (1.062) (0.022) (0.062)
N 1,706 1,706 1,706 1,706 1,706 1,706 1,706
(B) BW = 0.5
Admissible GPA 0.031 0.050 -0.024 -0.035 -1.929 -0.003 -0.113(0.035) (0.033) (0.033) (0.034) (1.223) (0.027) (0.073)
N 1,365 1,365 1,365 1,365 1,365 1,365 1,365
(C) BW = 0.3
Admissible GPA -0.002 0.075∗ -0.026 -0.069 -2.215 -0.018 -0.128(0.049) (0.040) (0.038) (0.044) (1.596) (0.035) (0.098)
N 926 926 926 926 926 926 926
Control mean 0.86 0.13 0.20 0.88 37.13 0.91 0.50
Notes: Heteroskedasticity-robust standard errors clustered by GPA are in parentheses (* p<.10 ** p<.05 *** p<.01).Each regression discontinuity estimate comes from a local linear model that regresses the covariate listed on anindicator for being above the GPA threshold, distance from that threshold, and the interaction of the two.The sampleincludes all spring 2014 applicants to OMSCS whose GPA is within the listed bandwidth. Listed below each columnis the mean of the covariate for those 0.01-0.10 GPA points below the threshold.
40