Embed Size (px)
Citation preview

Cametrics: A Novel Data Logger, Aggregator, and Visualizer
Cloud Service
Olmo Maldonado, [email protected], UCLA Department of Electrical EngineeringEE 299, Masters Project, Spring 2009
1

Abstract
Logging and visualization of data collected is becoming practical to implement in many projects due toa growing number of tools and web services. There are difficulties in transferring custom visualizationsor measurements between projects, however, because of losing compatibility or a heavy learning curvein understanding the logging and visualization tools. Likewise, the actual logging system, visualizationtool, and storage protocols are all separate from each other. This makes management and deploymenta consuming process. In order to mitigate these challenges, we propose to standardize the measurementinterface, centralize all the collected data, and to format the retrieval and visualization of the measureddata. Cametrics, or campaign metrics, does this by providing a developer with client libraries with asimple initialize and measure functions. Furthermore, the data is stored in Google App Engine’sdatastore, which allows the system to scale to demand. Cametrics can also accept any type of data,and is able to return any format that the organizer requests. Cametrics has large support for standardstatistical summaries, which can be visualized with Google Charts or Maps API. This paper detailsthe design choices and requirements made to complete the first iteration of Cametrics. Moreover, wediscuss the issues, limitations, evaluation, and future work needed for Cametrics.
2

Contents
Cametrics: A Novel Data Logger, Aggregator, and Visualizer Cloud Service
Abstract
Introduction
Related Work
Criteria
ManyEyes
Track-n-Graph
Mycrocosm
Trendrr
Timetric
Contributions
System Design
Design Principles
FlexibilityAccessibilityExtensibility
Platform Selection
Home Brew or Framework (Symfony, Doctrine, PostgreSQL) SolutionGoogle’s App Engine
Limitations and RequirementsDeadlinesQuotasTimeoutsInstabilities
Inputs
Required Outputs
Processing
Proposed System
System Architecture
Structure
URI FormatModules
ModelsStatRendererVisualize
Client Libraries
Bulk UploadsRequest Size
3

Input Processing
Framework of Input Processing
Output Generation
Framework of Output Processing
Evaluation
Test Setup
Client Setup
Server Setup
Results
Developer Survey
Conclusions
Future Work
Filtering, Granularity, and Selecting Data
Summaries of Summaries
Event System
More Internal Logging
Summary and Visualization Snapshot System
Memcached and Persistence
Removing or Guessing the ’type’ input argument
4

Introduction
Logging and measuring usage of a system is an important feedback for system debugging and design.A developer can monitor the usage of a website by injecting logging calls inside of their scripts thatlog to a flat file or database. After some time, the developer creates a script to parse the log and usesthird party libraries to construct a visualization of the data. A trend of number of users per month, forexample would be a metric to understand if a website is becoming more popular. What if the developerwanted to visualize the geolocation of the user’s IP address? The developer has to create yet anotherscript to mine the logs of their web server for all the visitor IP addresses and then geocode the IPaddress. Then, he would take the GPS coordinates and use another third party service to display thedata on a world map. As the complexity of the visualization or requirements of the developer growsmore and more, more scripts are created which may eventually become incompatible across projects ordifficult to maintain because of the rapid development of the scripts.
This is an ongoing challenge in participatory sensing (coordinated data gathering by individuals,groups, and communities to explore the world around them) campaigns. Campaigns are targeted andcoordinated data collection efforts between an organizer (anyone with an interest in coordinating adata-gathering campaign) and a large number of participants of the campaign. In order to manage thecampaign, an organizer typically creates a new web site to personalize the campaign for the participantsand other guests that might like to join the campaign. Although the act of creating a new websiteis trivial, migrating subsystems like a logging system are non-trivial due to organizers expertise inthe subsystem. Moreover, the original author of the scripts may not be the current organizer of thecampaign. Due to the environment of participatory sensing there is a need to minimize the amount ofcode and settings changes that an organizer must do in order for the system to be a fully functionalcampaign.
In this paper, we discuss such a participatory sensing campaign: What’s Invasive1. What’s Invasiveis a test pilot campaign that is an effort to equip the National Park Services with GPS-ready smartphones that can be used to map the Santa Monica mountains for invasive species. Invasive species arespecies that are not native to the area that if otherwise left alone would consume resources, which mayendanger the indigenous plants.
Cametrics, or campaign metrics, was created to reduce the complexity in migrating the loggingsystems between new campaigns and to reduce the amount of code to produce visualization of the datacollected from participants and/or the systems that the campaign is running on. After extensive work,and research, we have found that Cametrics’ scope is no longer narrowed to just campaigns. Cametricshas become a general-purpose logging, aggregator, and visualization web service that any device thatsupports the HTTP protocol can use to log data, which can then be rendered as visualization or anyother requested format. Cametrics lives in the cloud and is capable of scaling between large numbersof concurrent users. Most important, due to the mission to be simple and flexible, Cametrics is easyto get started and producing visualizations. This is a divergence from other logging and visualizationweb services. Furthermore, Cametrics is unique in its way it aggregates the data by having standardsummarization classes per data type. Cametrics also supports large number of types, which is contrary tomany web services, which would constrict an organizer to a fixed set of types. For example, location andGPS data types are now supported and summarized to simplify the organizer’s time in understandingthe area covered by a participant. If the system does not support a format or type, Cametrics can beeasily be extended by a developer contributed classes which will work as plug and play classes.
In this paper, we discuss related web services that have a similar scope as Cametrics and how theycompare. We list the contributions made by this research and how we stand apart from the previousworks. The requirements and choices made on the design of the system and the architecture of thesystem are also included. Lastly, we conclude with the evaluation of the system with quantitative andqualitative measurements and future work that is interesting or are required for Cametrics to moveforward.
5

Related Work
The following table compares other web services against Cametrics.
Table 1: Web Service Comparison against Cametrics
CriteraManyEyes
TrackN-Graph
Mycro-cosm
Trendrr Timetric Cametrics
API No No No Yes Yes2 YesSchemaless No No Yes No Yes YesFormless Setup No No Yes Yes Yes YesFormless Entry No No No3 Yes Yes YesAuto. Visual. No No Yes4 Yes5 Yes6 YesEditable Data Yes Yes Yes No7 Yes PlannedSelectable Data8 No Yes No No No PlannedShareable Yes9 Yes Yes Yes Yes YesAggregator No Yes No No No YesEmbeddable Yes Yes Yes Yes Yes10 Yes
Criteria
The following defines the criteria evaluation.
API If the service provides a HTTP RESTful API (independent of the features the API supports).
Schemaless If the user, or developer of the system, does not have to define for a data set any unit,type, or attribution in order for the backend of the system to function appropriately.
Formless Setup If the user, or developer of the system, is not troubled to fill out a form on a websitein order for the system to create a new data set, then we say that the system has a formless setup.
Formless Entry If the user of the system is not required to manually, submit a form to enter a singlevalue or a bulk of values.
Auto. Visual (Automatic Visualization) If the service automatically generates any form of visu-alization without the intervention of the user or developer.
Editable Data If the system allows at least edit or delete for a set or individual data.
1 http://whatsinvasive.com/2 Supports bulk uploads (CSV), individual values, and increment decrement value. Access to the dataset with a generated hashed key.3 Mycrocosm uses a single input form field with a unique Domain-Specific-Language (DSL) for inputs.4 Automatic visualization occurs for specific options and choices, selected by user.5 Only supports automatic visualization of a trend chart (line chart).6 Only supports automatic visualization of a trend chart (line chart).7 Data source property and delete of the data set are the only forms of data edit.8 This excludes datum selection (e.g. first, last, by specific timestamp)9 Note, in ManyEyes all data posted is shared publicly without the option for privacy.10 Embeds a flash object, which may not be available to the client browser
6

Selectable Data If the system has the ability to return to the requestor a subset of the data (withthe exception of single values -- first or last value, for instance).
Sharable If the system has the ability to share the data or visualization between an individual or agroup of persons.
Aggregator If the system has the ability to summarize, or aggregate, the data submitted for statisticalunderstanding. For example, for a number series if the system can return the maximum valuepassed
Embeddable If the system has the ability to provide the user with a manner to publish to a websiteor to copy/paste some code into another website without any further user intervention.
ManyEyes11
ManyEyes, by the IBM’s Visual Communication Lab, allows the community to take public data setsand visualize them from a slew of available visuals. Due their strong focus on visualizations, they havelacked support many of the criteria. The social and the wide variety of visualization options, however,could and should be implemented in Cametrics in the future.
Track-n-Graph12
Track-n-Graph is a tool to track anything about your own personal life. Track-n-Graph depends highlyon user’s input on the type, unit, and other attributes so that the data set that is uploaded can bevisualized correctly. All steps in the flow of the data the users have a critical role. Track-n-Graph’s lackof an API, for instance, forces the users to go on their web site to upload bulk sets of data in additionto the user having to setup a schema of the data appropriately before any uploads can occur.
Mycrocosm13
Mycrocosm is a form of microblogging with the use of visualization. Assogba, et. al., had similarobjectives with Mycrocosm as Cametrics. Mycrocosm attempts to reduce the time to report/collectthe user data by simplifying the user interface to report new data to the system. To enter data a userfollows a simple Domain Specific Language (DSL) to denote new data sets or new values for a dataset. Furthermore, Mycrocosm appears to be schemaless, which has the added benefit of reducing thecomplexity of the DSL. For time inputs, for example, the user just has to have ’time’ as part of theinput string and the type of the data set is automatically associated with time intervals. Unfortunately,they do not have an API or an aggregation (summary) of the data passed to the data sets.
Trendrr14
Trendrr takes public data sources and creates trend lines from the data received. Trendrr has customdata input, but is limited to the allowed data types that can be passed. Trendrr also has restrictions onhow to select or delete portions of the data. Otherwise, Trendrr follows similar features as Cametrics inthat they support an API for client input. This allows a generic device to create a data source streamfor many others to use the feed for their own purposes.
11 http://manyeyes.alphaworks.ibm.com/manyeyes/12 http://www.trackngraph.com/www/13 http://mycro.media.mit.edu/14 http://trendrr.com/
7

Timetric15
Timetric is a tool for visualizing statistical data. Timetric became very close to supporting most of thecriteria that would satisfy the requirements for the project. Unfortunately, their focus of their serviceis strictly on time series events, in other words on number value inputs. Aggregation of the data is alsoan unsupported feature.
15 http://timetric.com/
8

Contributions
Camertrics is a new take on the data visualization, aggregation, and logging. In all the services, no oneattempts to log data as it is being pushed by a script. The only one comparable to that is trendrr butthey use public data streams, which do not have the same data rate as participatory campaigns andtherefore are difficult to make clear comparison if they can support such a feature. Moreover, some ofthe services are strict in the type of data that is passed into the system. In contrast, Cametrics acceptsany data type as passed by the organizer. If the system does not support the type, it is a matter ofextending a subclass and following the interface defined in the parent class. Afterwards the system iscapable of supporting the type. Likewise, formats as returned by Cametrics are independent on thelimitations of the system. New formats can be added in hours and organizers can contribute their ownRenderer classes. By far the biggest contribution is the simplicity in getting started and visualizingthe data collected, or being collected. All other services require the user to build the visualization, forCametrics the visualization is automated and can be customized to fit their needs.
9

System Design
Design Principles
The design of the system should support flexibility, accessibility, and extensibility principles.
Flexibility
The developer should not have to learn a new language or have formal training on database systemdesign to understand how to create or organize data sets. The system should conform to the developer’sown concept of how the data is organized -- be it hierarchical or relational. Likewise, the system shouldencourage code reuse, simplicity (KISS), and intuitiveness when defining new data sets and recallingvalues or statistics from the system.
Accessibility
The system should be accessible programmatically and through an interface on a website. In eithercase, the system should have standard Create, Retrieve, Update, and Delete operations for all datasets, datum, and campaigns. The system should have a 99.9% up time and the responsiveness of theupload and download mechanisms of the site should be responsive so that Cametrics do not bottlenecksystems that embeds or pushes data out and into the system.
Extensibility
Since campaigns are rapidly being deployed and user requirements per campaign fluctuate per clientbasis, the system has to have the ability to start with a base class of standard features but be ableto support outside development of the system. At each critical stage of the data flow from the input,processing, storage, retrieval, and the visualization should have a standard interface that a developercan use to subclass into a specific purpose that may not have been covered.
Platform Selection
In selecting a platform to build Cametrics, one has a large variety of options that range from buildingyour own personal framework, using a framework solution, or using a cloud service. Although there isgreat benefit, and practice, in creating your own framework or utilizing a known, and popular, frameworksolution, which includes an ORM, and a standard DB (which can then be deployed to Amazon’s EC2)we found Google’s App Engine to be most appropriate for the system.
Home Brew or Framework (Symfony, Doctrine, PostgreSQL) Solution
The strength in creating an in-house solution by starting from scratch or selecting from a popularsolution such as Symfony16, Doctrine17, and PostgreSQL18, is in the flexibility in owning your ownsystem. There’s no quota limit, no time limit (assuming you remove execution limit in the programminglanguage configurations -- PHP’s set_time_limit, for example), and there’s no unexpected platformlimitations that we might encounter by using a specific version of a language or missing dependenciesdue to system security measures by the platform developers. In summary, there are less things that onewill be surprised by.
The downfall of a home brew or even using popular frameworks is the learning curve. This isespecially true for the home brew system, which has minimal documentation and maintenance supportfrom a community. For the popular framework solution, it is less of a problem because the frameworkstend to have a large and active community to improve documentation and troubleshooting of the systemusage and bugs; but due to the large number of framework components one would have to learn multipletools before one can understand how to troubleshoot errors. Additionally there is no guarantee thatthe system is scalable or responsive. Due to the prototype nature of most projects, one cannot load
10

the testing environment with stress tests or real world usage. On average, most systems have to go anextensive testing to realize that a large portion of code worked but was extremely ineffective to returnresults in a responsive manner.
A counter argument would be to use Amazon’s EC219 to compliment the home brew or frameworksolution so that it becomes scalable. In other words, use more resources only when necessary. Whilethis may be true, we argue that the system is not scalable. The system was simple fed more fuel toconsume. Using EC2 will not address the non-scalable portions of the system and will only accrue costswhich will then make the service impossible to run for free or without support from the community.
Google’s App Engine20
Almost the reciprocal of the previous platform considerations, Google App Engine has a standard lookand feel. The platform runs under Python 2.5.2, and only Python. All necessary packages to run afull-fledge system is already included in the SDK and makes getting started a breeze. This shouldsatisfy a concern that the system may become unmanageable between the number of administratorsand developers that shift and join the team as the years and use of the system progresses. Furthermore,the SDK makes the distribution of “Cametrics” as an open source project more appealing for others touse for their own projects to host to other people or domains.
The app engine also has a unique technology not common to the previous platforms: BigTable[BigTable]. The BigTable has an interesting property that each entity (or record) is unique from eachother. One record may have x-number of attributes (or columns) associated to the entity. This candiffer from the kind (or table) definition that was defined in a model (schema) file. This is a veryappealing property. One of the criteria discussed previously in the Criteria section is flexibility. If thecolumns are not fixed and we can create new columns for an object at run time, then this allows usto create decorator modules that receive the records, which then modify the record columns withoutknowledge of the rest of the system. .. ˆˆ may not be done
We are also guaranteed that the system will be accessible and scalable. The deployed applicationCametrics, will run on Google’s infrastructure and it is very unlikely that their systems will go downwithout anyone noticing. Outsourcing the maintenance of the system is very appealing because thisallows us to focus strictly on the code quality and usage of the system. The site is almost guaranteedto be scalable not because we are in the “cloud” but because we are forced to be scalable. Googlehas a 30 second deadline that if a script does not finish within 30 seconds all operations seize and aDeadlineExceptionError is raised and the system has to respond within a few microseconds to handlethe exception or the exception will terminate the running code. In the Limitations and Requirementswe discuss other Google App Engine limitations and how they forced a specific manner of designing theinternals of the system.
16 http://symfony-project.org/17 http://doctrine-project.org/18 http://postgresql.org/19 http://aws.amazon.com/ec2/20 http://code.google.com/appengine/[BigTable]
F. Chang, J. Dean, S. Ghemawat, W. C. Hsieh, D. A. Wallach, M. Burrows, T. Chandra, A.Fikes, and R. E. Gruber. BigTable: A distributed storage system for structured data. InOperating Systems Design and Implementation, 2006.
11

Limitations and Requirements In the process of design and testing of the system, the followinglimitations became strict requirements.
Deadlines Google App Engine has a strict execution time deadline. In other systems, one couldchange the execution time limit to more than 30 seconds, but in Google App Engine, all requests aregiven a 30-second window to execute. If the request handler script fails to terminate before the deadline,the script is terminated by a DeadlineException exception. Simple optimizations can lend a big handto reducing the latency of a script. For example, maintenance of your code and keeping it simple andwith minimal dependencies has an immediate benefit in the execution time. For example, the firstiteration of Cametrics all critical paths used Django 1.0.2 framework (in Google App Engine SDK,Django 0.96 is available) to handle requests. Because the 1.0.2 version of Django is not included in theSDK, a separate .zip archive of all the Django files is used in order to pass the 1000 files allowed in anapplication requirement. At every request, the zip file had been unzipped and loaded onto the Pythonruntime so that the framework can properly handle the request. This meant that every request had afixed cost of a few seconds. Although this was not a big concern in the processing, other issues willbe discussed in this section, a few seconds can be saved by removing this dependency from the criticalpaths. In a newer iteration of Cametrics, the POST and GET of data paths have been regressed to onlyuse native SDK environment. As a result, GET operations are taking milliseconds in response ratherthan seconds. The difference is very apparent to a user.
Quotas21 Everyday an application under the Google App Engine platform has to execute within acertain quota that is limited per day and per rate. For example, the CPU Time spent in a day may notexceed 46.30 CPU hours. Requests, for example, may not exceed 133328 requests in a day and cannotexceed 500 requests per seconds. Understandably these quotas and requirements are set to preventsystem overloading and for ensuring equal share of the platform.
With billing enabled, these limits may change and daily limits are increased. For example, therequests allowed in a day can change to 43,000,000 requests and the rate allowed is now 30,000 re-quests/minute. From speaking to a Google App Engine developer in the bi-monthly Internet RelayChat (IRC) sessions, even enabling the Billing without a set budget has an immediate impact on thesystem performance. More tests are needed to verify this claim.
However, even with billing enabled there are fixed requirements that a developer must obey. Filecount limit, for example, states that an application may not have more than 1000 files in an application.This prevents users using the App Engine as a data warehouse. Likewise, one cannot exceed 1 MB perrecord size in the datastore. There are many more quota limits and many more hidden, or at least notwell outlined, that an application has to follow.
Even with these requirements, a developer learns how to adjust the design of the system and perhapsit is warranted to claim that out of necessity a stronger and faster system is built.
Timeouts After deploying Cametrics and a few number of users of the What’s Invasive campaignstarted contributing data to the campaign, we noticed a large number of Deadline Exceptions. Aftersome investigation, we found that there were two reasons for this occurrence. First, the number of datapoints passed to the system was well over 50 records. For each record a statistic and histogram record,needed to be retrieved or created from the datastore. These retrieves or creates per 50 records has animmediate toll on the execution time. Moreover, for each of the 50 records and any modified statisticor histogram record each had to be saved to the datastore before the execution would finish. Evidentlypulling, updating, and saving per record was an efficient design choice. This has since been modifiedand now the goal for this critical path is to reach a near 1:1 ratio (meaning for 1 data record, 1 put orsave transactions required). This is discussed further in the Input Processing section.
21 http://code.google.com/appengine/docs/quotas.html
12

What we were soon to discover, however, of doing a 1:1 optimization was that the datastore issometimes incapable of storing large number of modules in one transaction. When we attempted tosave 1000 and more entities in one transaction (using a single db.put with a list, or array, of 1000entities) a sudden rise in Timeout exceptions. After doing some research, this is yet another one ofthose limitations by the Google App Engine that has not been underlined by any documentation. Theresponses to the Timeout exceptions in the Google Discussion Group for the App Engine, the GoogleDevelopers suggest that this may be due to internals not responding on time to save the entities andthat the current solution is to “try again.” As a result, a new algorithm that attempts to save all thedatastore was devised and further discussed in the Input Processing section.
Instabilities Similarly to the Timeout exceptions, another unexpected exceptions were beingraised when we wanted to wipe the datastore (Google App Engine) of all the data that had beensaved in one day. In particular, we were anticipating large volume of data from the campaign and wewished to have a clean datastore to so that we can understand the impact of a real world usage on thedata store. Although these timeouts were of no severity, since we were Bulk deleting the data, we soonfound out that there is collateral damage when doing bulk delete on the Google datastore. After sometime of deleting all the data, we were soon pressed to find that the site, and system, were behaving er-ratically. After some investigation, other developer have reported incidents that after massive deletionsof the datastore their system became unstable and that only after a large period of time did the systemstart to behave as expected. This is an ongoing issue for the Google App Engine developers, and ouronly solution is to be more careful with the data that we upload to the application. As a result, a sep-arate application has been created (cametrics-stress) to be used a testing and staging environment.We found that after 4 days of allowing the Cametrics application to have 0 data contributed (we usedcametrics-stress as a temporary datastore), that on the 4th day we found the system to start behavingcorrectly by showing some data that did not get deleted correctly.
Inputs
As discussed in the Flexibility subsection, the allowed inputs to the system should have minimal re-strictions and low number of requirements for the user can start to measure (log) data to the System.The formats allowed as inputs should also accept various popular formats like CSV, JSON, or at theroot of the allowed accepted values a simple POST with multiple or single value for the value field.
Required Outputs
At a minimum, the system should return the logged data and any summaries/statistics that werecomputed as the data had arrived in the requested format provided by the user. Additional formats,or allowed outputs, should include images for Charts and JavaScript objects for easily populating aGoogle Maps API. These are the typical tools used by researchers to visualize statistical data as wellas representing a location trace as a polyline or a series of GMarkers for marking specific points in thepath. As discussed, the output should support extensibility principle and have an accessible interfacefor a developer to contribute their own output format for others to use for their own projects. Moreover,the objects that can be selected for the output should be accessible without the use of client softwareand to select the format of the output should not require the user to have a client for the system toreturn the data in the requested format.
Processing
There are three processing stages that should occur: preparing, calculating, and visualizing the data.The prepare process should clean and validate the input to the system. The calculations that are exe-cuted, according to the type of data, should produce, and update, a summary of statistical informationfor that data. Lastly, the developer will use the summaries or the values of as they were logged or
13

cleaned by the system and a visualization process should represent the data in the requested formatand representation by the user or developer.
Proposed System
Cametrics is the culmination of addressing all the previous design and user requirements. Cametricsprovides other developers with a base class for Summaries, Rendering, and Visualizations, which shouldcover most use cases, but if necessary, the system has the ability to accept developer contributed classesand should adapt naturally without internal modifications. Because the system runs in the Google AppEngine, the system can be accessed with an uptime of at least 99.9% and the infrastructure will scale(up to the quota limits) without system developer’s intervention on the system. Furthermore, AppEngine simplifies the deployment, development, and contributions of the system. The development andexternal developer’s contributions are simplified due to BigTable’s unique property of having a flexible(schemaless) entity definition which would allow entities (records) in the system to be decorated withadditional attributes (columns) by the Summary modules that are applied to the type of data passed tothe system. Additional details of the running system in the System Architecture section of this paper.
14

System Architecture
To best describe the architecture, we will use a concrete example. At this time a participatory sensingcampaign, What’s Invasive22, is using Cametrics to provide the participants with feedback in the formof statistics of their number of contributions, the coverage of the area by the participants, the varietyand quantity of the invasive plants that have been discovered, and more. The objective of the What’sInvasive campaign is to empower the National Park Services in the Santa Monica Mountains with newtracking and discovery technology against invasive species. An invasive species is a species that is notindigenous in the area and that are consuming resources from native species.
Campaign participants run a campaign client called Campaignr [Campaignr], which posts sensordata (GPS, tags, and images) to an organizer’s script on their web server. For demonstration purposes,the organizer’s script is using the Cametrics PHP Client, but this step may have been unnecessary ifthe organizer had prepared the Campaignr client to post appropriately to the Cametrics server usingHTTP methods. In the organizer’s script, Cametrics is initialized with a secret key (given to theorganizer when they author a campaign via the Cametrics website -- the only required step before theycan begin using Cametrics). The organizer’s script will process the data and call the static measurefunction to log a value to Cametrics. This value may be a number, string, location, datetime, andmany more. See the discussion in the Input Processing subsection for more information. At the endof the PHP script, all the recorded data is POST-ed to the Cametrics server. Cametrics then processesthe input and calculates summaries, which can be used immediately after the request. The organizer’swebsite can then include the visualization by requesting to the Cametrics server for the namespace,path, and format of the data. For example in the following figure, the organizer’s website is requestingthat Cametrics provide all the values that have been posted to the namespace entries with the gc(Google Charts API) format.
Figure 1: An overview of a simple participatory sensing campaign using Cametrics.
22 http://whatsinvasive.com/[Campaignr] http://wiki.urban.cens.ucla.edu/index.php/Campaignr
15

Structure
URI Format
Cametrics follows a strict, but flexible, URI format/pattern to access all the data sets, summaries, andvisualizations stored.
.../namespace[/path[.format[?query_string]]]
namespace: The namespace is synonymous to a nickname created by the organizer. This is contraryto timetric, trendrr, and other web services that allow the user to create their own data setsbecause these services return a hashed key for the created data set. The hashed key requires theorganizer to keep a mapping file/script or to use the service’s web site to associate a key to a dataset. A namespace is an unencoded text; the namespace has representation and a meaning for theorganizer. For example, a simple namespace of: ’participant.visited’ is easy to rememberand understand. Furthermore, an organizer can use the participant to keep all things thatrelated to the participant together. For example, a namespace of ’participant.trace’ definesa relationship between the trace data and to the participant. Moreover, an interesting futurework would be to relate data sets across multiple campaigns/projects by using the namespaceand history of the namespace usage (formats requested, visualizations rendered, and most usedobjects of the data set) in order to optimize retrieving of data sets.
Even though the example states that the user can use participant.visited, but correct toaccess the namespace with Cametrics is to convert any combination of non-alpha numerical char-acter into a single /. For example, participant.visited (as entered through the PHP client)would be accessed through HTTP with participant/visited. This is also the case for partici-pant::visited, which would result in: participant/visited. This restriction may be removedin the future.
path: The path is an accessor mechanism into the data set. The path is best described with a series ofexamples. Assuming the namespace is ’participant.trace’ and type is ’location’, the pathof values returns all the location values stored on Cametrics. The path of stats returns all thestatistics calculated by the summary modules that matched the type of the data set. The path ofstats/min.longitude returns a single longitude value (useful for knowing the boundary of thedata). Path of stats/geotudes/37561.91.68.99.62 returns the total number of GPS locationsthat are inside the Geotude23 box (useful for understanding area covered by the participant).
format: The format similar to file extensions in a file system. By appending a .json to a path,Cametrics returns a JSON24 formatted object. The Renderer modules define supported formatsfor Cametrics and have a simple interface for an external developer to contribute their own formats.For the What’s Invasive campaign, for instance, a request was made to support rendering locationvalues into a Google Maps API25 ready objects, such as polylines or markers. By overwriting afew of the base classes that Renderer module provides, we were able to transform the locationtraces from one representation (a Python dictionary) into a JavaScript string that uses the GoogleMap API’s GMarker, GLatLng and GPolyLine.
query string: The query string is the analogous of passing arguments to a function. Each argumentis passed along the Render and Visuals modules. More documentation is available on the website26,but as an example using the .gchart format and a query_string of: ?cht=p3&chs=250x100&chco=054700informs the Google Chart Renderer that the object should be represented as a 3D-pie chart (p3),the size of the chart should be 250 by 150 pixels (chs), and the color of the chart (chco) shouldbe #054700. Notice that the parameters are exactly as if someone was using the Google ChartAPI directly. The Google Chart formatter happens to generate a URL with the data (chd) andother data dependent parameters like the x- and y- labels. Having to provide a query_string isa bit convoluting, so most formatters have default options. A future work would be to adjust thedefault parameters by how organizers (or participants) like to view their data by following thesystem usage.
16

The following is a complete example of a possible URL that Cametrics supports:
http://cametrics.appspot.com/measure/public_key/participant/visits/stats/weekday.gc?cht=bhs
This will use the participant.visits namespace, and access the statistics (stats) calculated forall the datetime (defined in the statistic object, or the data) entries and return a stacked Google Chart’s(gc an alias for gchart) bar graph of all the weekdays (Sunday through Saturday) that the participanthas visited the website.
With exception of path and query_string, Cametrics also uses the URI format to accept HTTPPOST. For bulk uploads, Cametrics currently only accepts bulk uploads POSTs to an empty namespace.
Modules
Models The models module contains all the kinds (models) known to Cametrics: Campaign, Storage,Statistics, and Histogram. Each of the models are subclasses of the SerializableExpando (a subclass ofthe db.Expando, from App Engine), which has the ability to transform the models into JSON or Pythondictionaries.
The Campaign holds all the campaigns known to the system. This is equivalent of a project. Thereare no limit to the number of campaigns that an organizer can create and the campaign are strictly forseparating the datasets from each other -- so that there are no namespace collisions -- and for otherattributes that make up a campaign: title, description, and homepage.
The Storage model houses all the data with campaign, namespace, type, created on, and statsattributes (columns). Although the statistics for a data set is unique to each namespace, the Storageentities have a referenced property to their statistics to reduce the number of requests to the datastoreand to simplify the development in the other modules (in particular the Stats module).
The Statistics holds all the statistics for a campaign and namespace. The stats module will eitherget or create a statistic entry based on the campaign and namespace combination. The only definedattributes are the campaign, namespace, count, and histograms. The count is the only mandatorystatistic because of its use in other statistics (for example calculating the mean of a number) andorganizer’s own tracking.
Histogram model is similar to the statistics model because there are almost no attributes attachedto the model. The histogram has a statistic and name attributes which when combined produces thekey to the histogram. The stats module will try to tally all occurrences to various histograms. If thehistogram is not stored in the datastore, the tally function will add a reference to the statistics, createthe Histogram entity, and increment the count in the index (attribute) of the Histogram. For examplein the string summary class, a ’hits’ histogram is attached to the stats entity for the namespace. Ifthe string of the value passed to Cametrics has not been seen before, the Histogram entity (created orretrieved) gets a new attribute as the value. Then, the histogram attribute is incremented to indicatethat the value has been seen before. The next time that Cametrics received the exact (case sensitive)of the value, the value for the histogram attribute (of the passed value) will be 2.
Stat The Stat module contain all the Summary classes known to Cametrics: NoSummary, Summary,NumberSummary, StringSummary, DatetimeSummary, and LocationSummary. All Summary classesmust have a prepare and calculate method which are called for each datum in the data passed toCametrics. The prepare method primarily converts the value passed to the system into the expected
23 http://www.geotude.com/about/nutshell24 http://www.json.org/25 http://code.google.com/apis/maps/26 http://cametrics.appspot.com/
17

format. This is particularly important to datetime and location summaries. The DatetimeSummary andLocationSummary normalize the raw string by adding to the datum two new attributes: timestamp,datetime and longitude and latitude; respectively. This allows for the calculate method and othersubclasses of these classes to have a standard interface to access from the datum. If an exception isthrown, or the datum cannot be prepared for processing, the datum is invalidated and removed fromthe input processing pipeline.
All Summaries subclass NoSummary. NoSummary’s prepare method simply assures that the datumentity passed has a value attribute (the raw value) and that it is not empty. The calculate methodincrements the statistic’s count by one. The NoSummary also defines other helper methods such asinvalidate and tally. The invalidate method adds a private attribute, _valid, that is used by the pipelinestages to remove the datum from being saved into the datastore. The tally method is a helper for thethe histogram classes. This reduces the need to understand the intricacies of Cametrics model design.The required parameter are the statistic entity and the name and index of the histogram that needs tobe incremented.
NumberSummary’s prepare method converts all expected numbers to its appropriate type. Note,however, that integers stored in the datastore become long integers. This is the normal behavior of thedatastore. The calculate method, currently, adds a min, max, sum, and mean to the statistics. Themin and max are continuously updated if the value is less or greater than the min and max values,respectively. The sum and mean are accumulated and computed for the running sum and average ofthe data series. The NumberSummary matches any of the following types (as provided by the organizerin their scripts): number, float, int, integer, long.
StringSummary inherits from the Summary class, which keeps a tally of all the values passed. TheStirngSummary matches all: str, string, and text types passed. The prepare method ensures that thesystem can properly parse the value passed into a string.
DatetimeSummary accepts date, datetime, and timestamp values and normalizes the datum entitieswith the timestamp and datetime attributes so that the calculate method and other subclasses canproperly work with the datum. The calculate method creates a number of interesting histograms:years, months, days, hours, minutes, seconds, weekdays, dayth, weekdayth, hour.weekday, day.hour,and weekday.month. Each of these are just counters for the the series of the data passed to Cametrics.From these buckets one can discern the most active months, hours, minutes, weekday (Mon.-Sun.) andeven seconds (although this may be removed if we find that this histogram is rarely used). The daythand weekdayth buckets are histograms for day and weekday in the year. After a year this can provide aclear picture of a trend in contributions. The hour.weekday, day.hour, and weekday.month have specialmeanings. The hour.weekday is a timecard that can be visualized with a bubble scatter plot. The sizeof the bubble is the value at the hour.weekday, and the indexing to the chart is done by the ’.’ separatedvalues. For example, ’8.1’ = 2 indicates that there were two events that occured at 8 am on Monday(1). This is similar to the other ’.’ separated attributes.
LocationSummary accepts location and gps type inputs. For each data passed, LocationSummaryprepare normalizes each datum entry with longitude and latitude. In the calculate method, we arecurrently augmenting the datum entry with a min, max longitude and latitude for creating a boundaryof the data set. Moreover, the calculate method adds a geotudes27 histograms which up to 7 gridresolutions. For example, an input of -118.44271302223206,34.06945813747638 would have up to37561.95.35.07.52.48.16 indexable values.
Currently the system does not support Intervals (start and stop timestamps), will soon be addeddue to its importance.
Renderer Renderer classes have a very similar interface to Summary classes in order to minimize thecomplexity in developing new subclasses. The Renderer classes that are currently supported: NoRen-derer, Renderer, GChartRenderer, and GMapRenderer.
27 http://www.geotude.com/about/nutshell
18

The NoRenderer defines the interface that all other renderer classes should use. The get_values,get_statistics, render_values, render_stats, and render are all the functions that the subclassesmay need to override. By default, the get_* methods return empty list and dictionaries. The Rendererclass override the get methods for centralizing a single point to get the values and statistics.
The JSONRenderer matches the JSON format, and converts all values into JSON ready objectsby replacing the datastore specific types into types that can be simplejson28 can convert into a JSONstring. Additionally, the render method returns a JSON object with the values and stats if the path isempty. Otherwise, if the path is stats or values it returns the JSON object for the object as describedin the URI Format section.
The GChartRenderer matches gc and gchart formats and redirect the user to a generated url asspecified by the Google Chart API. Similar to the JSONRenderer, the GChartRenderer converts thevalues and stats into dictionaries or objects that the Visualize module can accept. The Visualizemodule then has the logic necessary to transform the object passed to it (either a list of values, statisticdictionary, or an object within the statistic).
GMapRenderer matches gm or gmap formats and currently only support the rendering of values.Using the type parameter in the query string (see URI Format) the GMapRenderer renders the valuesas a JSON list (when type is raw), a JSON dictionary for an encoded polyline (when type is encoded),a GMap API-ready encoded polyline (when type is polyline), or as a GMap API-ready markers(when type is markers). The last two cases follow a simple example29 [by the Google Map API. TheGMapRenderer also supports callback and class parameter in the query string which will format thestring returned by the renderer to do a standard JavaScript function call with the first parameter asthe object returned, or similarly to use a map class to directly add the overlay (polyline or markers)directly.
Visualize The Visualize classes follow the same pattern as the previous classes. The classes currentlysupported by Cametrics to visualize the data are: NoVisual, Visual, NumberVisual, StringVisual, Date-timeVisual, and LocationVisual. The Visual module uses a third-party Google Charts API PythonClient pygooglecharts30 to minimize the load on the developers to derive helper functions to generatea url. The NoVisual class has a simple interface: get_url and add_labels. The Visual class overridesthe get_url, and its purpose is to get the correct chart according to the cht parameter passed in thequery string, and to set the values and keys that the chart needs to add as the data and values for thechart. Lastly, it generates the url and appends all non-visual specific parameters to the resultant url.This in effect opens the Google Chart API for the organizer or user to modify at their leisure withouthaving the Visual classes to reproduce the same behaviors. For example, one can pass the chart colorparameter (chco) and the Visual classes will ignore this parameter and the Google Charts API will dothe necessary work so that the chart uses that color scheme.
The NumberVisual which matches the same types as the NumberSummary types, simply overridesthe add_labels method so that the order and position of the values and keys are appropriate whenvisualizing numerical data.
The other visual: String, Datetime, and Location, lack a complete implementation and currentlybehave as a NumberVisual. The Datetime visual will soon incorporate visualization for timelines andsupport for the ’.’ separated histograms like the hour.weekday histogram (a timecard31).
28 http://undefined.org/python/#simplejson29 http://code.google.com/apis/maps/documentation/overlays.html#Encoded Polylines30 http://pygooglechart.slowchop.com/31 http://dustin.github.com/2009/01/11/timecard.html
19
Client Libraries
At this time, Cametrics has released a PHP client. Python and JavaScript clients are next to beingreleased. The two main functions of the PHP client are initialize and measure. The initializefunction’s first argument is the secret_key as given by the Cametrics website in the campaign detailspage, and the second argument is for modifying the default options that the client uses like changingthe hostname (typically, for local testing) or modify the request size required before the client can postto the server.
Bulk Uploads
The early development of the client POST-ed to the Cametrics server at every measure call. Thisseemed appropriate when testing locally, but one of the lessons learned from working with the GoogleApp Engine, is that doing a request per every call of measure does not scale. For example, the What’sInvasive logging script file has 8 measurements. At 8 requests per execution, PHP began to limit on theamount of memory and resources that the system can consume. As a result, the client and Cametricswere modified to allow bulk uploading. In this manner, the execution of the script would only requestat the end of the script execution. This reduced the latency of the script. The results are shown in theEvaluation of Cametrics.
Request Size
In addition to the bulk upload feature that resulted out of too many requests to the server, anotheremerging problem was exceeding the deadline allowed for an execution of a python script on Google.See Limitations and Requirements for more information on the deadline exceeded exception. As atemporary work around, the PHP client trades, reduced latency for guarantee that the data passed tothe server is saved. Notably, this should not be something that a client library should be concerned of,but until a more permanent solution is in place on the Google App Engine -- like immediately savingany unsaved Python objects to Memcached before the script is terminated -- the client reduces theamount of data Cametrics has to process.
Input Processing
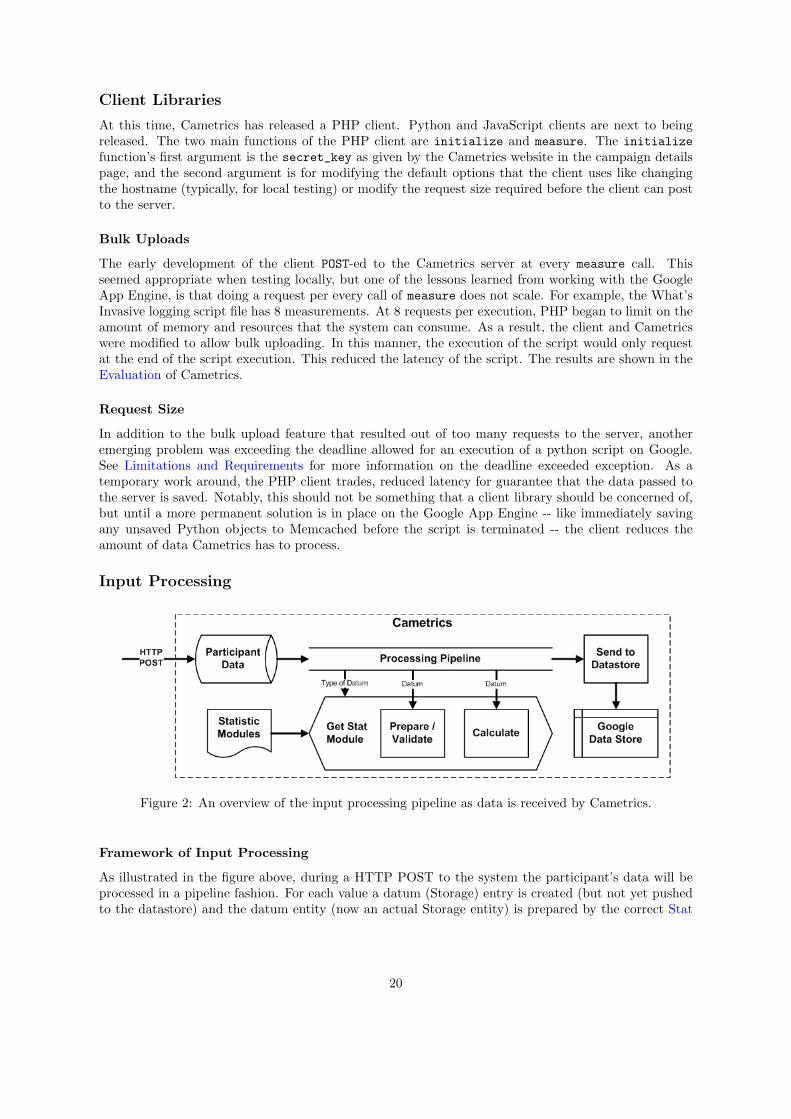
Figure 2: An overview of the input processing pipeline as data is received by Cametrics.
Framework of Input Processing
As illustrated in the figure above, during a HTTP POST to the system the participant’s data will beprocessed in a pipeline fashion. For each value a datum (Storage) entry is created (but not yet pushedto the datastore) and the datum entity (now an actual Storage entity) is prepared by the correct Stat
20

module which will augment the entity if necessary. During the calculate method of the stats, thenecessary statistic entity and histogram entities are created and incremented.
After the datum passes through the processing (without an invalidation from the prepare method)the data is stored in local memory (in a Python list). The created or retrieved statistics and histogramsare also kept locally in two separate data structures. The first, a global private variable _STATS is adictionary indexed by the statistic’s key (or generated key by using the campaign key and namespacevalue -- important to prevent unnecessary datastore transactions). Likewise a _HISTS global privatevariable exists for all the histograms that are retrieved or created. On the next datum, the storageentity is created but the stats and histograms are checked if they exist locally in the _STATS and _HISTSdata structures to be reused and updated. This had a significant decrease in the latency for inputprocessing. Discussion on the evaluation of Cametrics in the Evaluation section.
After all the data is processed and is waiting to be saved, the send to datastore combines all the data,statistics, and histogram entities into a single list. As mentioned in the Limitations and Requirementssubsection we were surprised that we could not put a large (over 500 entities in a list) into the datastorein a single transaction. Due to the timeout exceptions that were raised by the datastore, the Send toDatastore method had to be redesigned so as to prevent that the complete transaction from being rolledback -- and preventing any data from being saved.
Figure 3: Pictorial explanation of the send to datastore algorithm and an example of an erroneousentity and how the algorithm adjust against it
Likewise, we found that if an entity could not be saved, for any particular reason, into the datastorethen the complete set of entities would be rolled back. The above figure demonstrates how the mostcurrent send to datastore algorithm works. A while loop that terminates if the entity list is empty, shiftsthe first entity (initialized to the complete entity list as previously mentioned) into a current variable.The current set of entities is then attempted to be stored into the Google datastore. If the datastoredoes not raise an exception then the loop continues. Otherwise, on an exception (timeout, or otherwise)the current data set is split in half and the entities list is appended with the first and second half ofthe last current set. In the next iteration of the loop the first half, or any other set previously in thelist, will then be attempted to be put into the datastore. This continues until all the entities have beensaved.
In the case that there is an erroneous entity in the data set, the algorithm is capable of withdrawingthe datum from the set after a series of iterations (if the length of the data set is one, the datum isremoved). The datum is logged and used later for further testing. As shown on the right of the abovefigure, the complete data set could not be put to the datastore because of the red malicious entity. Theset is split and appended to the empty list (since it was the first iteration, and the complete set wasshifted out of the list). In the second iteration, the first half of the original set will still be unable to bestored in the datastore, and further split. In the third iteration, the second half of the original set willbe stored and this pattern continues until the fifth iteration when the erroneous data set (now lengthof 1) will be discarded and the iteration continues to store the last (white) entity.
21

In the future, we wish to minimize the number of iterations. For large quantity of entities in thelist, the large number of iterations may cost (in time) more than then if we had saved each datum ata time. We can reduce the number of iterations by diving the sets more appropriately to the observedmaximum length of set allowed. This can be done by analyzing the history of the most allowed numberof entities saved (discussed in the Evaluation briefly) and dividing the complete set into n-number ofmaximum allowed stored length. This system information can be stored in the datastore or persistentlyin Memcached.
Output Generation
Figure 4: An overview of the output generation
Framework of Output Processing
For all HTTP gets whose public or secret key retrieves a campaign the path (after the namespace,see section URI Format for more information) is used to execute one of the methods provided by theRenderer module. Note that the format requested in the URI selects the appropriate Renderer module.Depending on the Renderer module, the object returned from the Renderer (varies between the functioncalled) will be passed to the Visual module that is selected by the type of the object resultant from theRenderer module.
The objects that may be returned by the Renderer module are as follows:
render stats: This may be the statistic entity, or dictionary, for the namespace and campaign. Theobject may also be a value or dictionary (for Histograms) within the statistic object.
render values: This is strictly all the values stored in the datastore. In the future, this can be a rangeof values or single values. Moreover, it would be appropriate to return a resolution of the data.
render: Depending on the Renderer this may return the values of render_stats and render_valuesplus the type of a data series.
The Renderer may then write the output to the stream and if necessary, the Visual module mayredirect the request to a permanent URL for the URI given. For more information on the constructionof the output or URL for the redirect, refer to the Renderer and Visualize sections.
22

The first design of the output processing did not separate the paths into the three aforementionedpaths. After a long series of values had been stored in the datastore, we noticed that too many Deadlineexceptions were being thrown. As a result, we have elected to only retrieve from the data when and ifit is necessary. Moreover, the current paths do not reflect a pipeline structure. The next iteration ofthe visualization framework should follow this so that a single iteration is necessary to prepare a datuminto visualization.
The current performance of the output (the limits), is yet to be fully quantified but some statisticsof the current performance is provided in the Evaluation section.
23

Evaluation
Test Setup
Using two computers:
• client, a (separate) computer that acts as multiple users sending multiple POST to the server
• server, a (separate) computer that receives the data from the users/clients and will syslogand Cametrics:measure
Client Setup
The client is on a separate network than the sever and is using the FunkLoad functional and load webtester32 tool to simulate the user/device.
Server Setup
The server is dedicated to the tests and not running/hosting any other project.Server Specification:
CPU: Intel(R) Core(TM)2 Quad CPU Q8300 @ 2.50GHzRam/Memory: 512MBDisk Space: 20GBBandwidth: 1500GB
The server also has the FunkLoad Monitor Server33 to monitor the health of the server to understandthe different load the system has with and without the use of Cametrics.
Results
The following results summarize the average response time and the number of requests per a 45 sec-ond deadline. We do not compare the ideal case (using syslog) because the charts would not be ofsignificance. In comparison, the ideal case performs linearly to the number of concurrent users on thesystem. In the other hand, as seen below in the graphs server (the machine sending measurements toCametrics) exhibits a worsening of performance as the number of concurrent users increases.
Now, the What’s Invasive campaign needs to support 9 participants and the worst case of 40 con-current users is a very unlikely condition. When looking at the following charts, however, it is best totreat the typical case in the range of 4-12 concurrent users.
v1 Cametrics PHP client: This is the first iteration of the PHP client (using CURL). In this version,the client does a POST on each time the script executes the measure function. As discussedbefore, we saw the worst-case performance in this version because of the large number of requestsoccurring.
v1 with Bulk, Curl: This is an optimization to the PHP client in that the only POST made to theserver is one massive upload of all the data collected when the script finished execution. As seenthis showed some improvements in the response time but the number of requests per 45 secondsis still in the lower end of the results.
32 http://funkload.nuxeo.org/33 http://funkload.nuxeo.org/#monitor-server
24

Figure 5: Seven average response times against a varying number of concurrent users.
Figure 6: Successful requests per 45 seconds against various concurrent users for seven different testcases
25

v1 with Bulk, fopen: Looking at the successful tests/45 second graph this and the next test casewere used to compare if the performance of the client depended strongly on the function usedto send the HTTP post. We compared the CURL, fopen, and sockets. The fopen seemed to beworst in most of the range of users. This is especially true after 12 users. We expect this to be asa result of PHP limits on the number of concurrent fopens allowed per system.
v1 with Bulk, fsockets: Sockets are the lowest implementation to the stream of data. We foundsockets to be the least performing of the three test cases. It is unclear as to why this may bethe case. From the results, the current version of the client (and following tests) use the CURLfunction to upload the data.
v2 of Cametrics: This is the single transaction for bulk uploads optimization done on Cametrics (notthe client). As seen the client has an immediate benefit in the response time. Other optimizationswere to separate the POST critical path from the Django (zipimported) path. This immediatelyhas a reduction in the latency, as seen from Cametrics.
v3 of Cametrics, limited: Version 3 of Cametrics indicates that this version has the newest algorithmof the send to datastore that had been previously mentioned in the Framework of Input Processingsection. The limited indicates that the Cametrics PHP client is limited in the request.size asdiscussed in the Request Size subsection. At the time of this test case the client was limited to25 data points. This meant that the test case might have POST to the server more times, thanif the client had not been limited.
v3 of Cametrics, unlimited: In order to understand the request size implications, we created a lasttest case to understand if the increased number of POST requests to the server had reduced theperformance of the PHP client. As seen from the charts, the best performing test case is this case.As a result, the PHP client should be simplified to not have to deal with the deadline issues onthe server end.
As seen from the ongoing stress tests, the server is the direct effect as to how fast the PHP (and theother clients in other languages) client will perform. First, the optimizations that have been describedin this paper had a significant improvement on the performance of the client. Second, the limits imposedon the client in order to ensure that Cametrics does not raise a Deadline exception do show a negativeeffect on the performance. This requires further investigation on Cametrics’ POST critical path and toensure that it returns a 200 status code (or ACK) to the client so that the client can return finish as soonas possible.
Developer Survey
Although the number of developers currently helping to test is small the survey does answer and raisesome questions of the project.
When asked, “what was the most difficult concept to understand of Cametrics,” there was disparityin the responses but one of the developers indicated that the concept and purpose behind Cametrics wasnot easily understood. From other responses in the survey, the namespace and type concept were notclearly understood by some of the developers. This indicates that the project has not done a good jobin documenting, giving examples, or provides enough guideline on how to understand the capabilitiesand limits of Cametrics.
The rest of the responses, however, indicate that Cametrics is shown to be flexible and responsive.When asked, “What is the Cametrics’ best feature” overwhelmingly the Summaries and Statistics werechosen as the best feature. Coming in second were the flexibility and visualizations of the system. Eventhough one of the organizers indicated that the concepts were not understood, they found that it wasnot difficult to setup (about 1-10 minute estimated setup times) for the organizers.
As shown in the previous evaluation, the stress tests do indicate that Cametrics may seem to beslow or unresponsive. When asked, “How is the ”feel“ of the system ...” for uploading and accessing thedata, the average response showed about 2-3 second wait time. The uploading of data seemed more
26

responsive (according to one of the organizers) and this may be because of an ongoing analysis andoptimization on that critical path. More investigation and test cases are needed to understand why thedevelopers showed that Cametrics had a 2-3 second response for accessing the data.
When asked, if they “intend to continue using ...” and if they would suggest to their friends to useCametrics, an overwhelming response of yes from all the developers indicate all the organizers approvethat project as a tool that may have a significant part in their projects. As such, it is warranted tokeep optimizing and improving the summaries.
27

Conclusions
The project thus far is successful in being simple, flexible, and extensible. The organizers have indicatedin the surveys that it took them less than 3 minutes to setup and start logging data. Moreover, theorganizers spent about the same time to embed on their web pages. Cametrics is flexible by allowingthe organizer to set their data set key (the namespace) as they would like without having to have amapping between a hashed key to their data set. Moreover, the system already accepted a large numberof input types: string, integer, float, long, datetime, timestamp, location, gps, and more planned. All ofthese have summaries and histograms that automatically have visualizations that the organizer can useon run time. A feat. not yet possible with any other service. Although Cametrics has had a run in withscalability issues with the Google App Engine, learning from the difficulties has improved the designof the system and the future work will improve even further what Cametrics has already succeeded indoing well.
28

Future Work
Because Cametrics is a generic logging, aggregator, and visualization platform there are many featuresthat have yet to be implemented. Moreover, the organizers of the campaigns already have a runninglist of requests that would make their development lives even easier. This section outlines a few of suchrequests and plans for the future of Cametrics.
Filtering, Granularity, and Selecting Data
An ever-growing request is to select particular data from the data set -- the first and last collected data,for example. Additionally, a date range of when it was created would improve responsiveness since thiscould reduce the amount of processing on the GET critical path. Other improvements would be thegranularity of the data. This is a tougher order to server, however, since Google App Engine does notallow complex queries in their query language. The best one can do is to define bookmarks in the dataset for certain granularity. When the granularity is requested, one would iterate for all the bookmarksthat match the granularity (which reference the entities that match the bookmark). Thorough testingis needed to ensure that the processing is not too strenuous on the system.
Summaries of Summaries
Pardon the confusion. An example should help make this idea concrete. At this time, Cametrics adds acreated on attribute for each of the datum that are POST-ed. Summaries of Summaries would mean thatthe created on would not be an additional attribute on the datum, but rather an additional data setautomatically created for the datum. This would mean that there would be a direct association betweenthe namespace that the user used to POST the datum, and the namespace.created_on that Cametricswould automatically create for the user. More needs to be researched in how these associations wouldoccur (because of the complexity in the queries), and how the responses by the Renderer and Visualizemodules should behave.
Event System
As of recent there are more web articles on “Web Hooks”34. Web Hooks are similar to callbacks in Eventbased languages. A user registered to a web service can register a callback, or web hook, in the servicefor when an event would occur. This is becoming more and more common in popular web servicesand we think that Cametrics would benefit greatly if we implemented an Event System. An organizer,for instance, can register a URL for when a value passed into Cametrics is higher or lower a threadshold. This can signify an anomaly from the expected trend. Moreover, histograms or other objectsin the summaries can be listened to for an event to occur and the organizer would be notified via aweb hook that the event has occurred. This is an asynchronous, and cheap, call. It would simply be aPOST to their server of the event and reference to the object that caused the event. Other interestingapplications would be a PHP client that would update a local cache of the organizer. Any new dataor summaries, after a set number of new data (to minimize calls between servers), would be postedto the organizer’s server’s caching system. This way the calls between their server and Cametrics (forvisualizations, for example) are minimized -- in other words a cooperative caching mechanism.
More Internal Logging
Use Cametrics to measure system usage, and performance. As seen in the bulk upload and the masssaving to the datastore. Many interesting, and unexpected, anomalies occur because of working onthe Google App Engine platform. If these can be quantified (for the example the maximum number
34 http://blog.webhooks.org/
29

of entities that can be saved at one time) or observed (which visualizations are used the most) thencritical paths can be optimized.
Summary and Visualization Snapshot System
Currently the system does an aggregation of all the running data. This is only partially useful. Forquestions that require a comparison between days, weeks, or months it is difficult (especially because oflack of selection mechanism) to compare values or even summaries. We have already begun to devisea way to “snapshot” the summaries and “visualizations” into frozen sets. Then one can request for aspecific frozen or live summary or visualization of the namespace.
Memcached and Persistence
Through the work with the What’s Invasive campaign one notices that on average the same statisticsand histograms are used across multiple requests. If these objects can persist in Memcached withouthaving to go to the datastore, a large portion of the delay between requests can be cut by accessing theseobjects directly from the Memcached. Similarly, for visualizations, many of the requests for GChart,values, or statistics may not have changed since the previous request. To improve the responsivenessof these requests, Memcached can be updated as data comes in or as requested by a user visiting anorganizer’s site. Due to quota limits on the Memcached, significant research on the use of the Memcachedfor various functions of Cametrics is necessary to understand if this is feasible.
Removing or Guessing the ’type’ input argument
This may not be a high priority future work, since I think that one of the strengths of Cametrics is thatthe type of the input can be defined by the organizer/developer. As mentioned, is the type does notfit the summary that the developer is looking then them or via a request, a new Summary can matchthe new type for the correct summarization. Removing, or at least reducing, the number of times thetype is used in the Cametrics can help to reduce the amount of developer responsibilities so this maybe beneficial if completed.
30


![[DRAFT, PRE-FINAL OR FINAL] REPORT - OECD](https://img.dokumen.tips/doc/110x75/5ec770f8c7c9f9670a3f7375/-draft-pre-final-or-final-report-.jpg)


