Embed Size (px)
Citation preview
CALL CENTRE MANAGEMENT BASICSThe Planning and Management Process of Call
Centers
Intr
od
ucti
on
• 6-hour course - 3 hrs – 2 sessions
PLEASE TURN OFF YOUR MOBILE PHONE NOW
Cou
rse O
utl
ine
Key Topics:
• Call Center Management
• The Planning and Management Process of Call Centers
• How incoming call centers behave
• Service Level
• Service Level and Quality
• Forecasting
• Scheduling
• Immutable Laws of Call Center Management
• Real time Management
Call C
en
ter
man
ag
em
en
tWhat is Call Center Management?
Is defined as the art of having the right number of skilled people and supporting resources in place at the right times to handle an accurately forecasted workload, at service level and with quality.

QUIZ
Call C
en
ter
man
ag
em
en
tWhat makes call centers unique ?
• Externally Generated Work
• Random Call Arrival
• Invisible World
• Service Benchmarking
• Main Customer Touchpoint
Call Arrival Exercise
Random Call ArrivalW
hat
makes c
all c
en
ters
un
iqu
e?
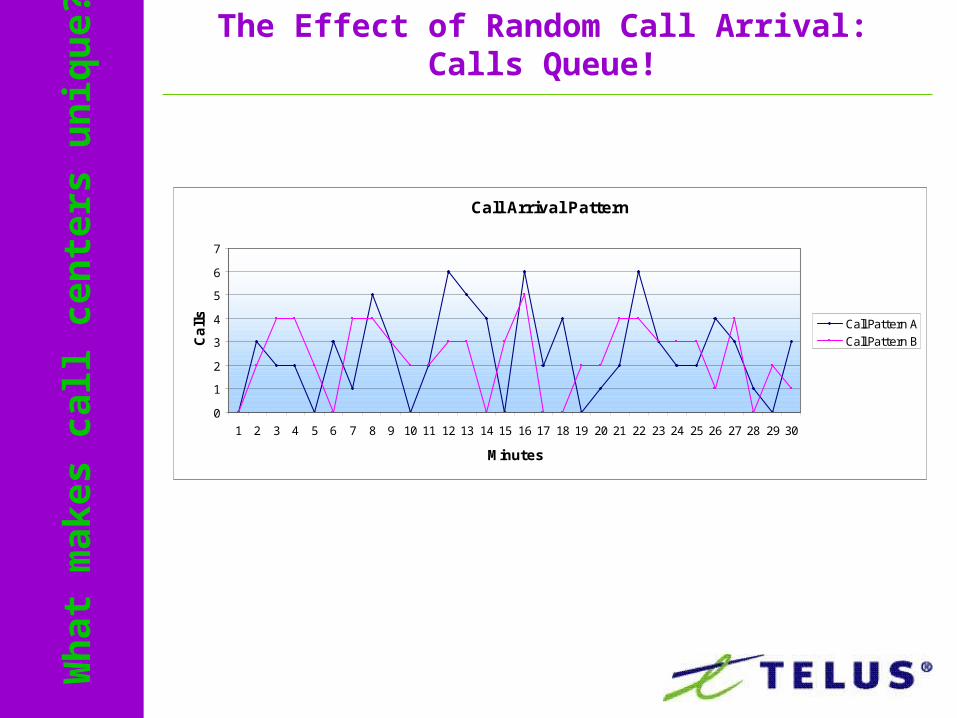
GRAPH
Call Arrival Pattern
0
1
2
3
4
5
6
7
1 2 3 4 5 6 7 8 9 10 11 12 13 14 15 16 17 18 19 20 21 22 23 24 25 26 27 28 29 30
Minutes
Calls
Call Pattern ACall Pattern B
The Effect of Random Call Arrival: Calls Queue!
Wh
at
makes c
all c
en
ters
un
iqu
e?
Random Call ArrivalW
hat
makes c
all c
en
ters
un
iqu
e?
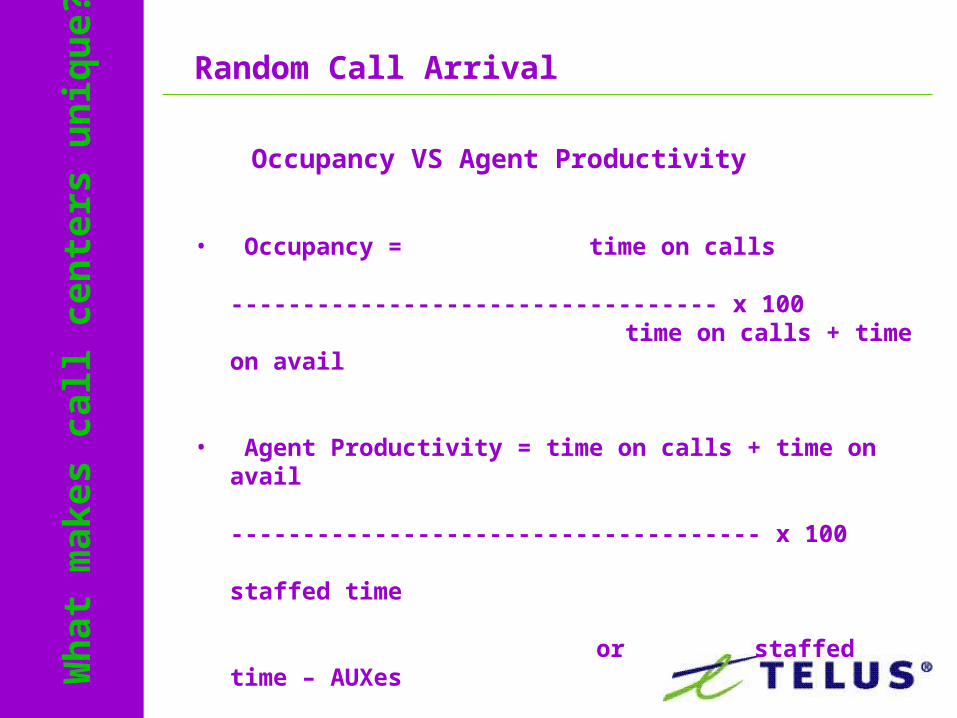
Occupancy VS Agent Productivity
• Occupancy = time on calls ---------------------------------- x 100 time on calls + time on avail
• Agent Productivity = time on calls + time on avail ------------------------------------- x
100 staffed time
or staffed time – AUXes ----------------------------- x 100 staffed time
Call C
en
ter
man
ag
em
en
tWhat makes call centers unique ?
• Externally Generated Work
• Random Call Arrival
• Invisible World
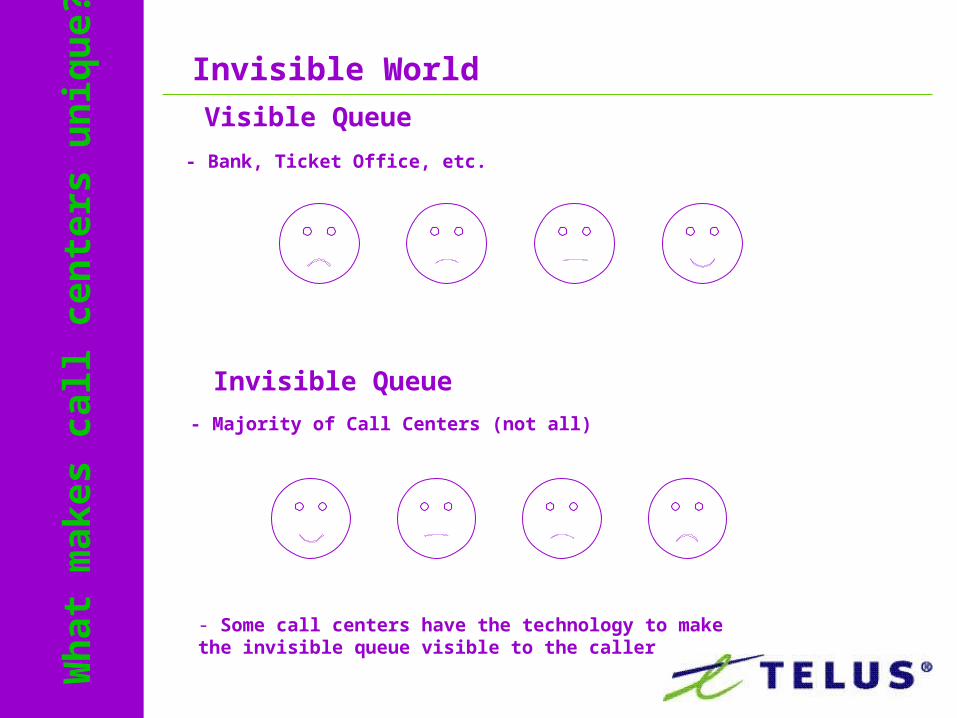
Visible Queue
- Bank, Ticket Office, etc.
Invisible Queue
- Majority of Call Centers (not all)
- Some call centers have the technology to makethe invisible queue visible to the caller
Wh
at
makes c
all c
en
ters
un
iqu
e?
Invisible World
1. Degree of Motivation
2. Availability of Substitutes
3. Competition’s Service Level
4. Level of Expectations
5. Time Available
6. Who’s Paying for the Call
7. Human Behavior
Invisible World: 7 Factors of Caller ToleranceW
hat
makes c
all c
en
ters
un
iqu
e?
Call C
en
ter
man
ag
em
en
tWhat makes call centers unique ?
• Externally Generated Work
• Random Call Arrival
• Invisible World
• Service Benchmarking
• Main Customer Touchpoint
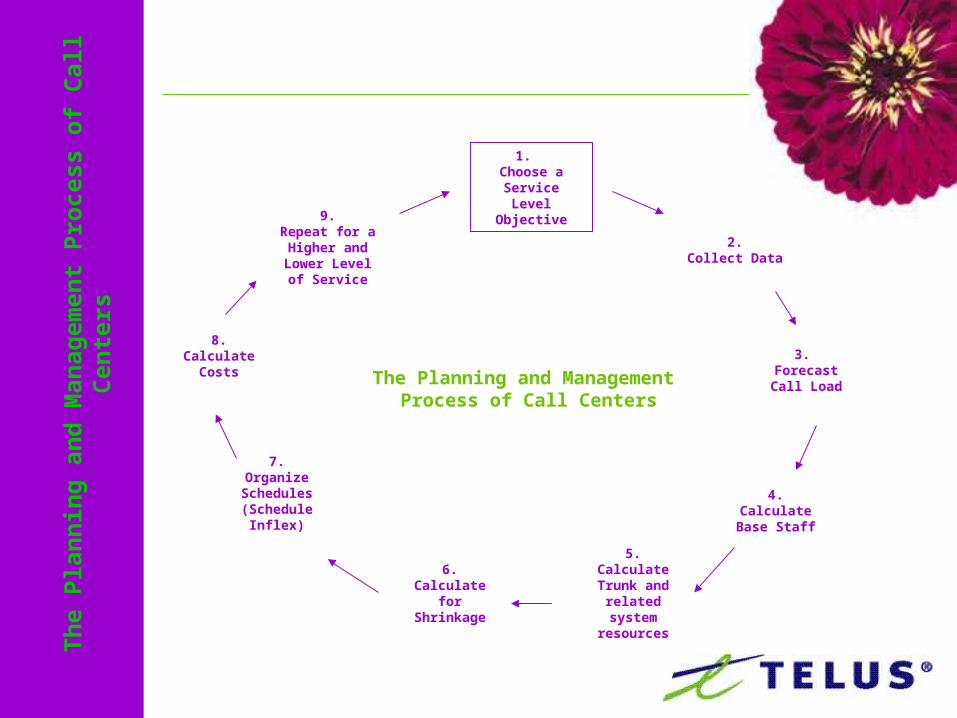
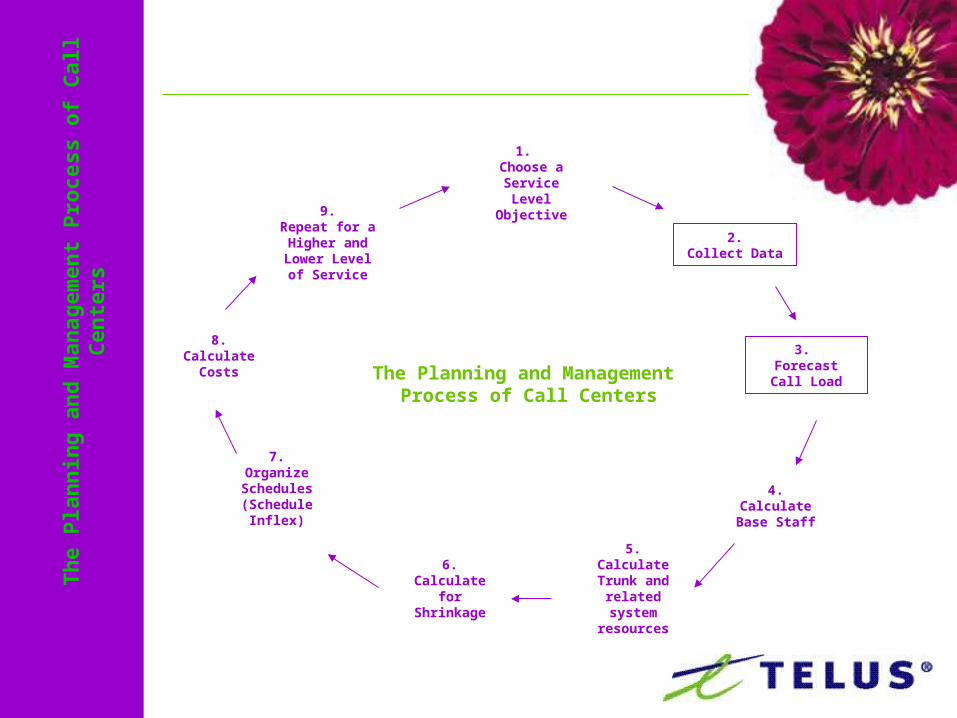
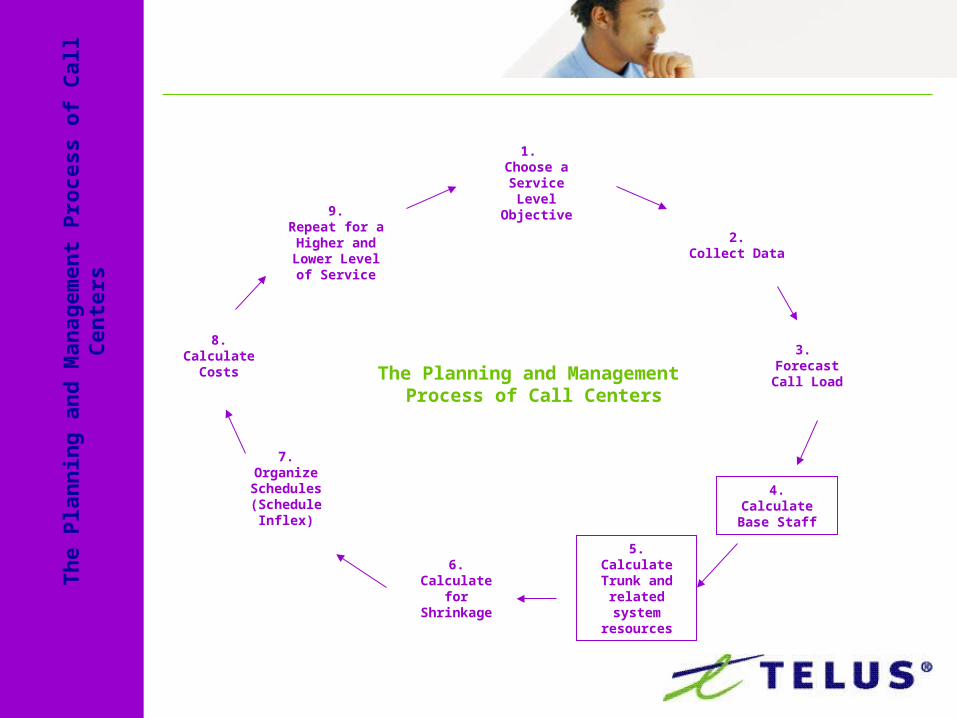
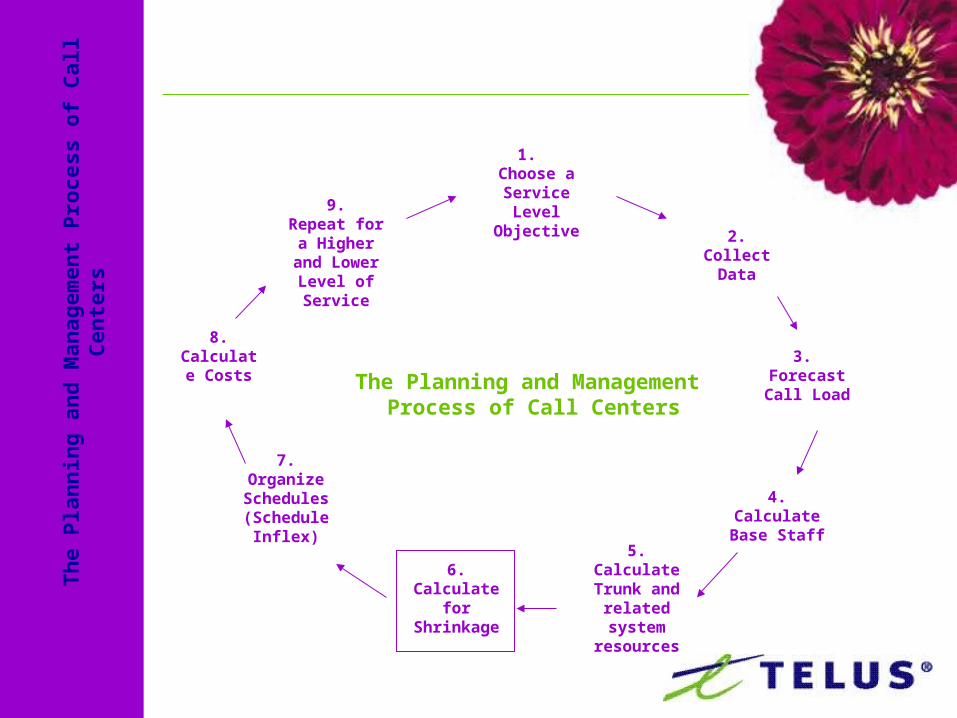
8.Calculate
Costs
1. Choose a
Service Level Objective
The Planning and Management Process of Call Centers
4.Calculate Base Staff
9.Repeat for a Higher and Lower Level of Service
2.Collect Data
5.Calculate Trunk and
related system
resources
7.Organize Schedules (Schedule
Inflex)
3. Forecast Call
Load
6.Calculate for
Shrinkage
Th
e P
lan
nin
g a
nd
Man
ag
em
en
t P
rocess o
f C
all
Cen
ters
SERVICE LEVEL – THE CORE VALUE
• What is Service Level ?
• What is the difference between SL and Response Time
SER
VIC
E LEV
EL
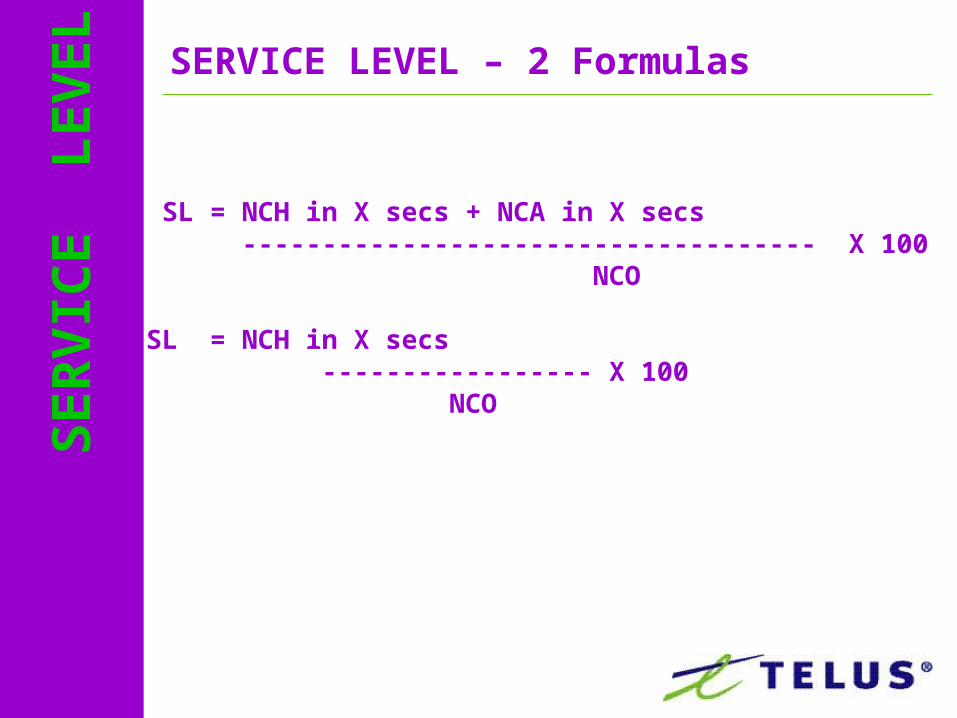
SERVICE LEVEL – 2 Formulas
1. SL = NCH in X secs + NCA in X secs ------------------------------------ X 100 NCO
2. SL = NCH in X secs ----------------- X 100 NCO
SER
VIC
E LEV
EL
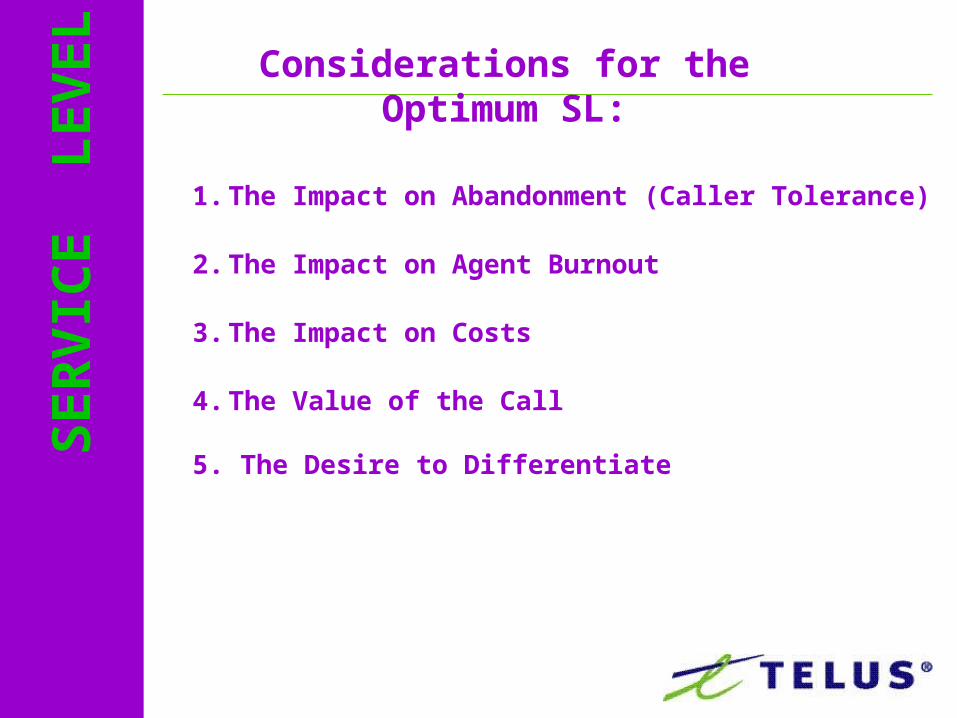
Considerations for the Optimum SL:
1. The Impact on Abandonment (Caller Tolerance)
2. The Impact on Agent Burnout
3. The Impact on Costs
4. The Value of the Call
5. The Desire to DifferentiateSER
VIC
E LEV
EL
SER
VIC
E LEV
EL a
nd
QU
ALIT
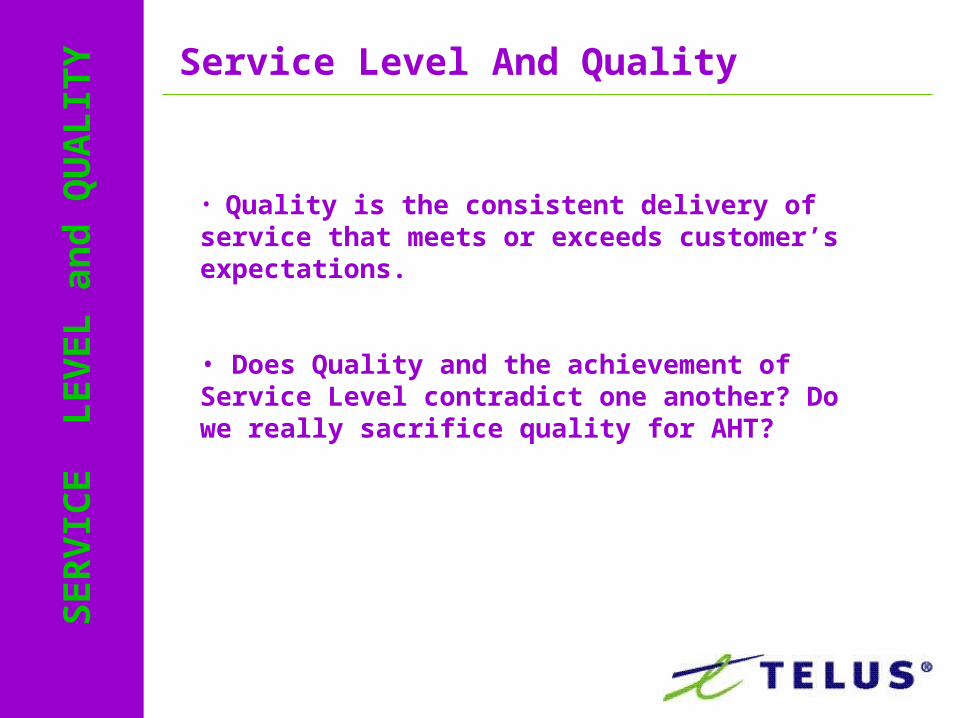
Y Service Level And Quality
• Quality is the consistent delivery of service that meets or exceeds customer’s expectations.
• Does Quality and the achievement of Service Level contradict one another? Do we really sacrifice quality for AHT?
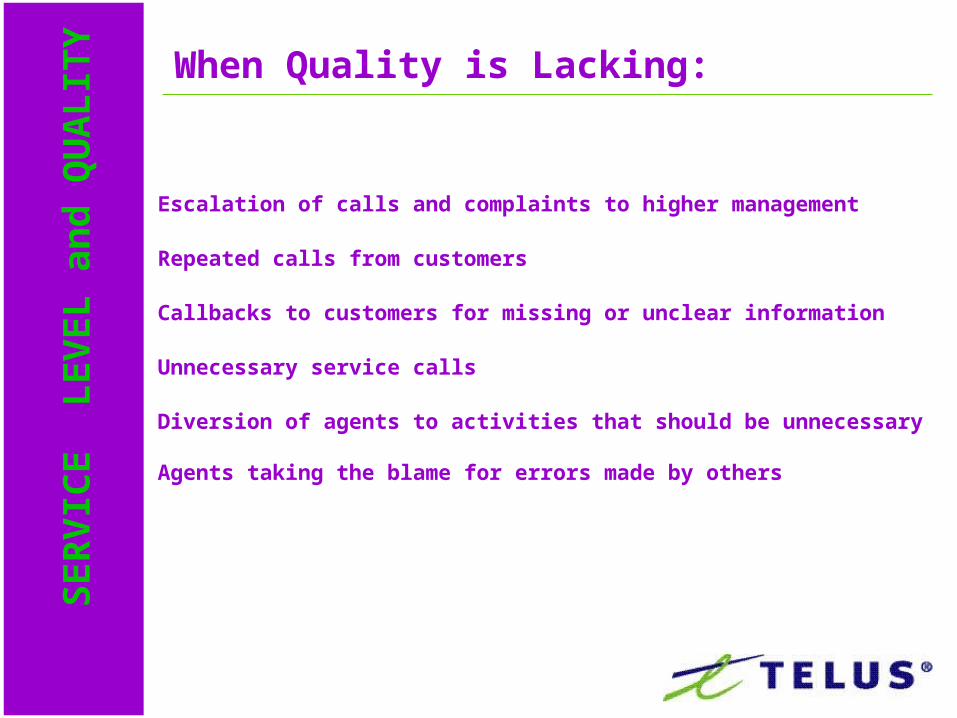
When Quality is Lacking:
• Escalation of calls and complaints to higher management
• Repeated calls from customers
• Callbacks to customers for missing or unclear information
• Unnecessary service calls
• Diversion of agents to activities that should be unnecessary
• Agents taking the blame for errors made by others
SER
VIC
E LEV
EL a
nd
QU
ALIT
Y
Th
e P
lan
nin
g a
nd
Man
ag
em
en
t P
rocess o
f C
all
Cen
ters
1. Choose a
Service Level Objective
The Planning and Management Process of Call Centers
4.Calculate Base Staff
9.Repeat for a Higher and Lower Level of Service
2.Collect Data
5.Calculate Trunk and
related system
resources
7.Organize Schedules (Schedule
Inflex)
3. Forecast Call
Load
6.Calculate for
Shrinkage
8.Calculate
Costs
FO
REC
AS
TIN
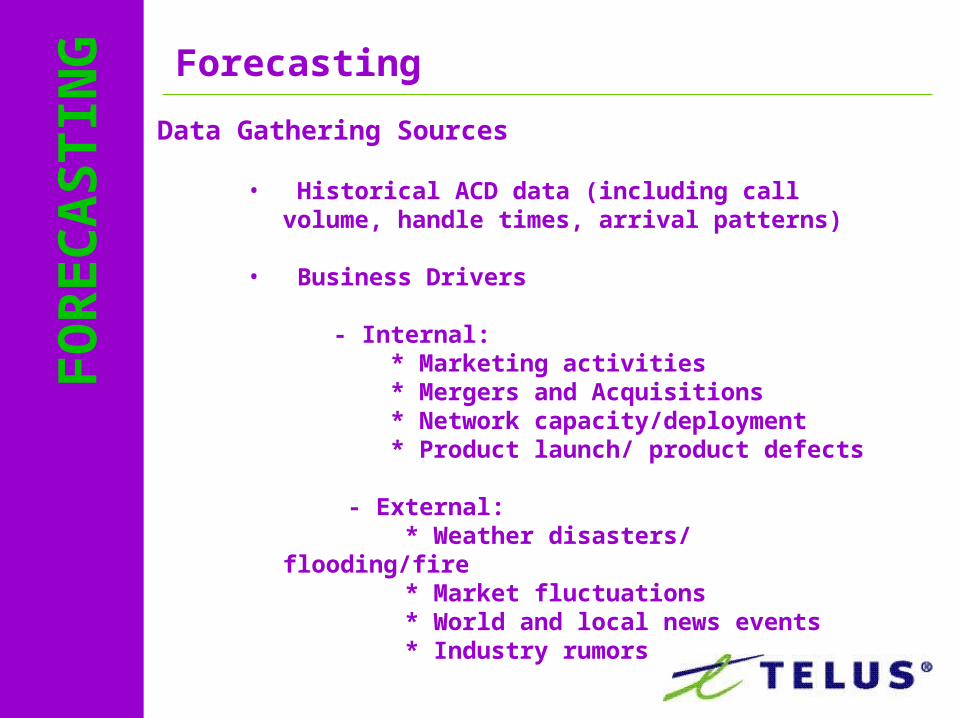
GForecasting
Data Gathering Sources
• Historical ACD data (including call volume, handle times, arrival patterns)
• Business Drivers - Internal: * Marketing activities * Mergers and Acquisitions * Network capacity/deployment * Product launch/ product defects
- External: * Weather disasters/ flooding/fire * Market fluctuations * World and local news events * Industry rumors
FO
REC
AS
TIN
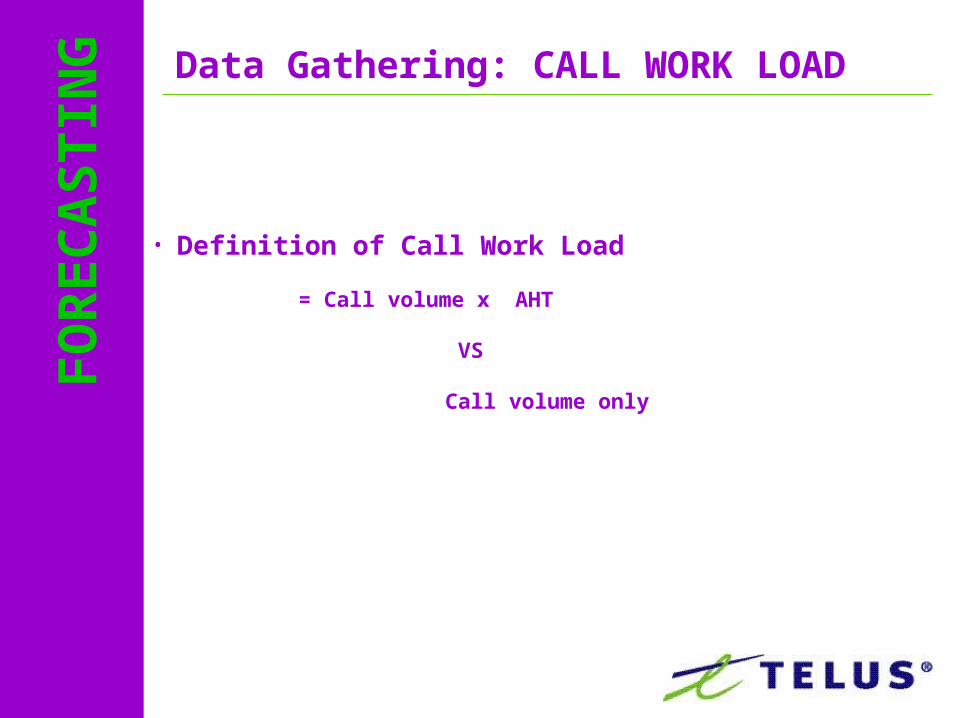
G Data Gathering: CALL WORK LOAD
• Definition of Call Work Load
= Call volume x AHT
VS
Call volume only
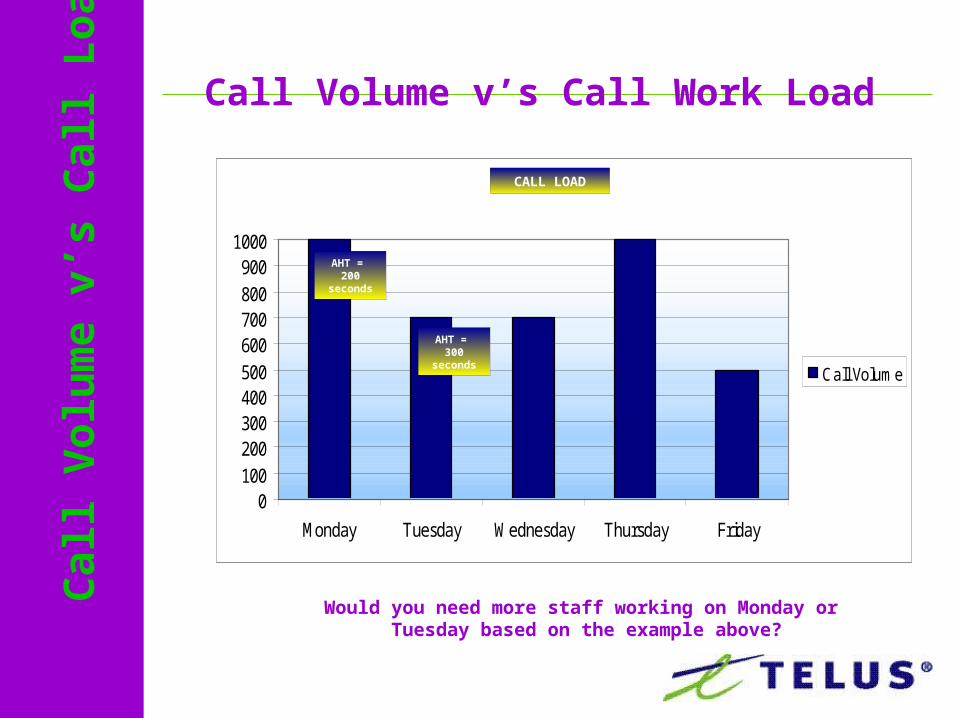
Call Volume
0100200300400500600700800900
1000
Monday Tuesday Wednesday Thursday Friday
Call Volume
Call Volume v’s Call Work LoadC
all V
olu
me v
’s C
all L
oad
Would you need more staff working on Monday or Tuesday based on the example above?
AHT = 200
seconds
AHT = 300
seconds
CALL LOAD
FO
REC
AS
TIN
GFO
REC
AS
TIN
G ACD Data: Check for volume, AHT, patterns
Volume: Trunk capacity Data Aberrations
Handle Time: Time of day Day of week Events
Arrival Patterns: Holiday factors Events Monday effect
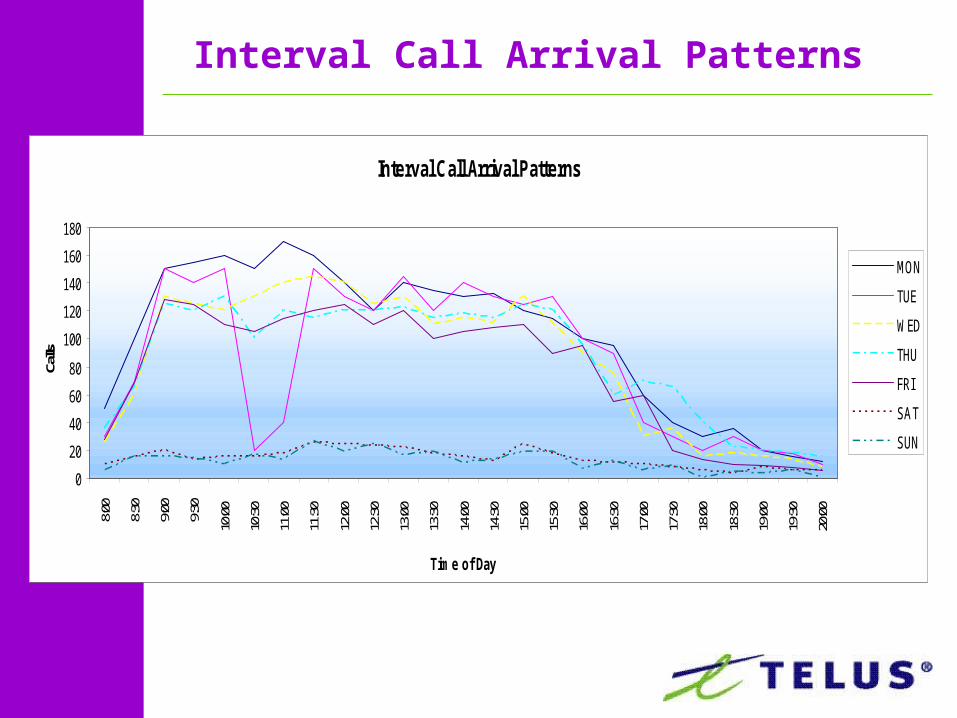
Interval Call Arrival Patterns
0
20
40
60
80
100
120
140
160
180
8:00
8:30
9:00
9:30
10:00
10:30
11:00
11:30
12:00
12:30
13:00
13:30
14:00
14:30
15:00
15:30
16:00
16:30
17:00
17:30
18:00
18:30
19:00
19:30
20:00
Time of Day
Calls
MON
TUE
WED
THU
FRI
SAT
SUN
Interval Call Arrival Patterns
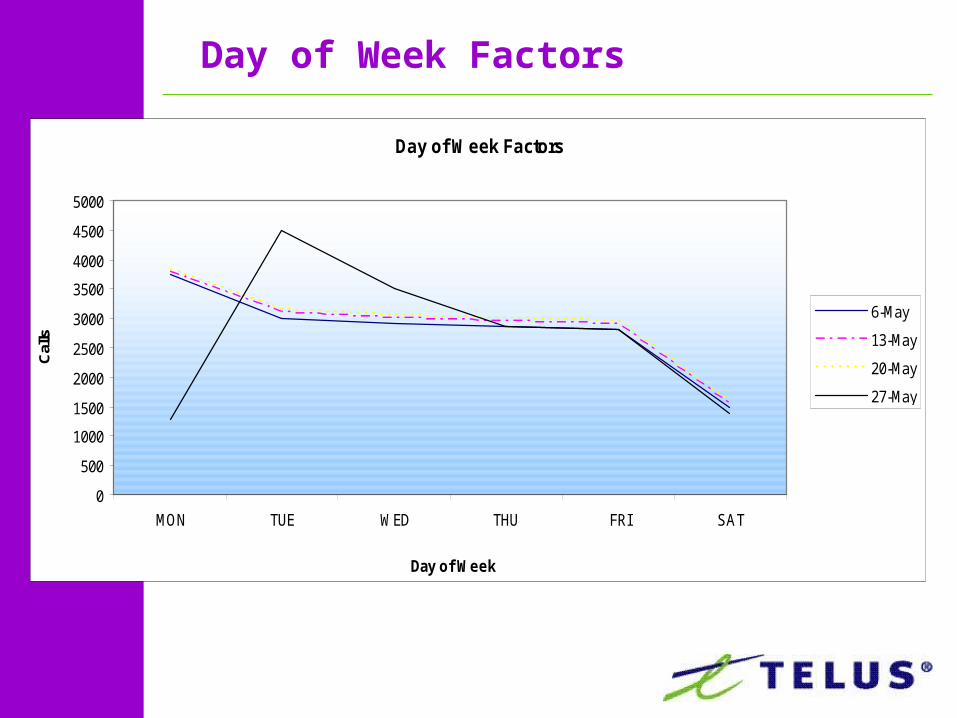
Day of Week Factors
0
500
1000
1500
2000
2500
3000
3500
4000
4500
5000
MON TUE WED THU FRI SAT
Day of Week
Cal
ls
6-May
13-May
20-May
27-May
Day of Week Factors
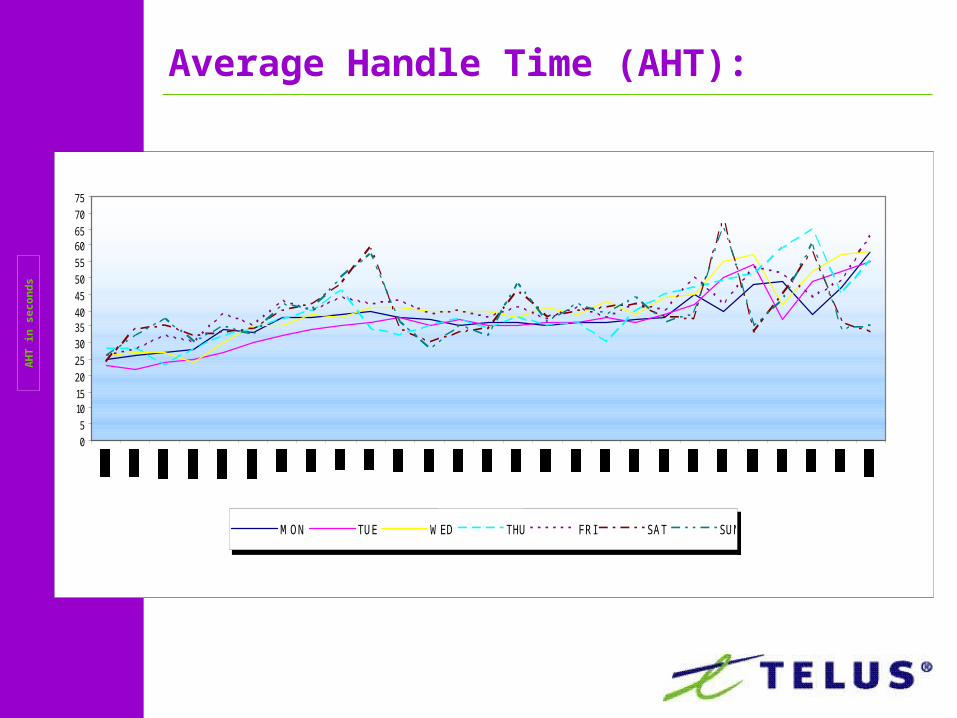
Average Handle Time (AHT):A
HT in
secon
ds
05
1015202530354045505560657075
MON TUE WED THU FRI SAT SUN
Time of Day
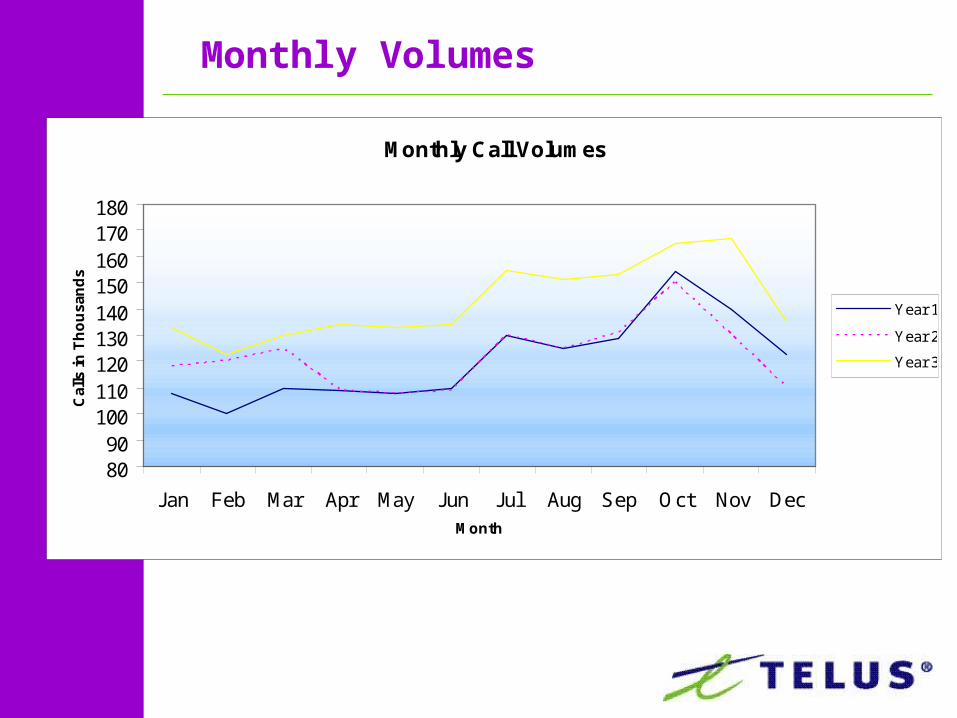
Monthly Call Volumes
8090
100110120130140150160170180
Jan Feb Mar Apr May Jun Jul Aug Sep Oct Nov DecMonth
Cal
ls in
Th
ou
san
ds
Year 1
Year 2
Year 3
Monthly Volumes
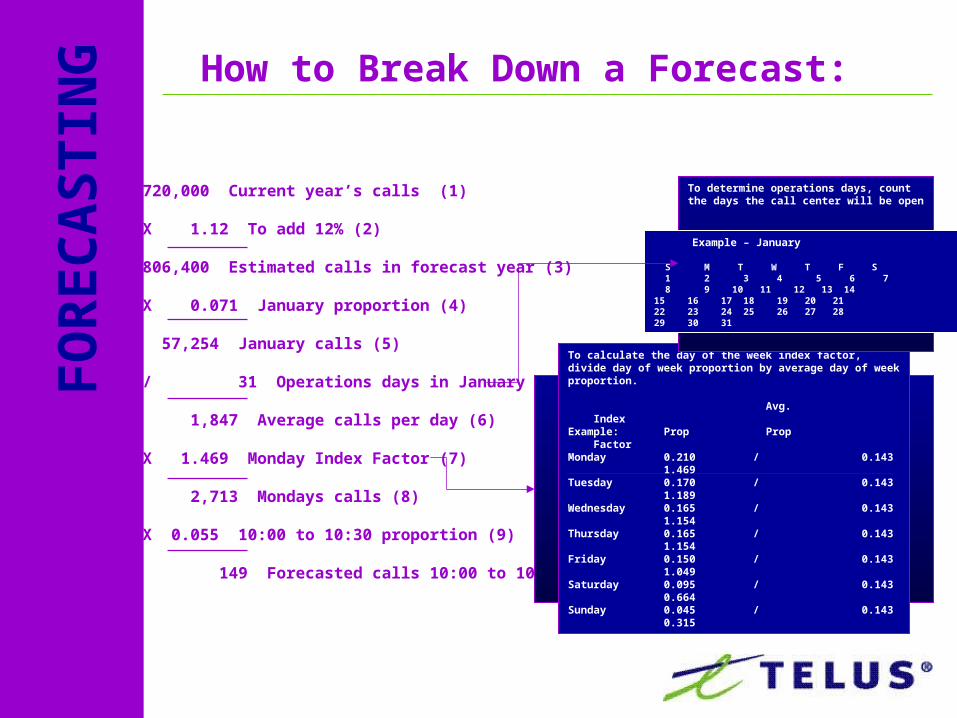
720,000 Current year’s calls (1)
X 1.12 To add 12% (2)
806,400 Estimated calls in forecast year (3)
X 0.071 January proportion (4)
57,254 January calls (5)
/ 31 Operations days in January
1,847 Average calls per day (6)
X 1.469 Monday Index Factor (7)
2,713 Mondays calls (8)
X 0.055 10:00 to 10:30 proportion (9)
149 Forecasted calls 10:00 to 10:30
How to Break Down a Forecast:
To calculate the day of the week index factor, divide day of week proportion by average day of week proportion.
Avg. IndexExample: Prop Prop FactorMonday 0.210 / 0.143 1.469Tuesday 0.170 / 0.143 1.189Wednesday 0.165 / 0.143 1.154Thursday 0.165 / 0.143 1.154Friday 0.150 / 0.143 1.049Saturday 0.095 / 0.143 0.664Sunday 0.045 / 0.143 0.315
To determine operations days, count the days the call center will be open
Example – January
S M T W T F S 1 2 3 4 5 6 7 8 9 10 11 12 13 1415 16 17 18 19 20 2122 23 24 25 26 27 2829 30 31
FO
REC
AS
TIN
G
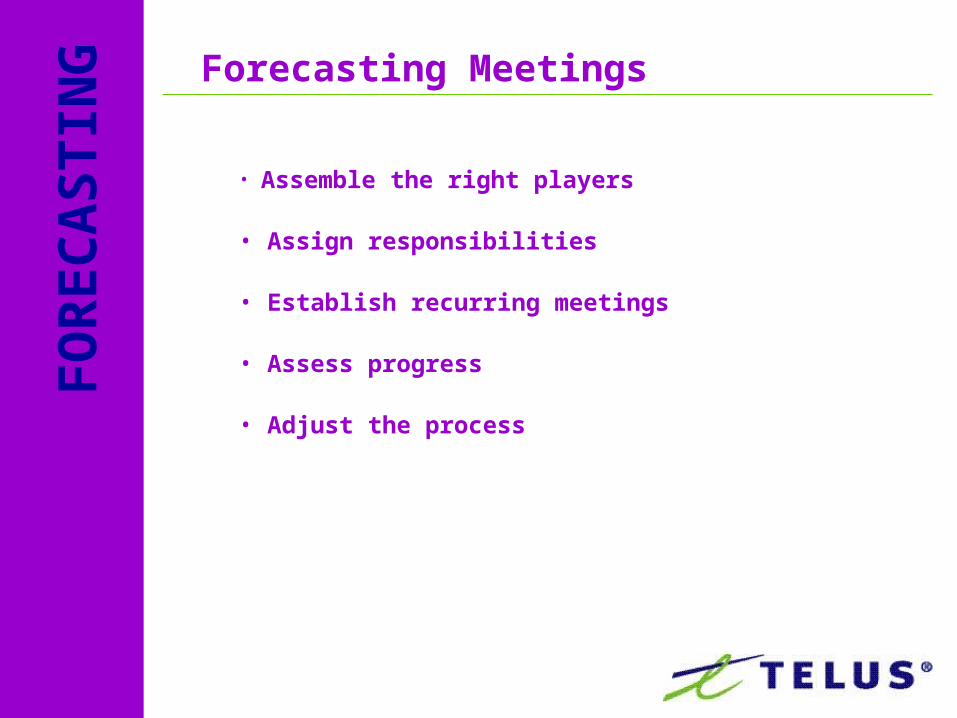
Forecasting MeetingsFO
REC
AS
TIN
G
• Assemble the right players
• Assign responsibilities
• Establish recurring meetings
• Assess progress
• Adjust the process
Th
e P
lan
nin
g a
nd
Man
ag
em
en
t P
rocess o
f C
all
Cen
ters
1. Choose a
Service Level Objective
The Planning and Management Process of Call Centers
4.Calculate Base Staff
9.Repeat for a Higher and Lower Level of Service
2.Collect Data
5.Calculate Trunk and
related system
resources
7.Organize Schedules (Schedule
Inflex)
3. Forecast Call
Load
6.Calculate for
Shrinkage
8.Calculate
Costs
Calculate Base Staff S
taff
Req
uir
ed
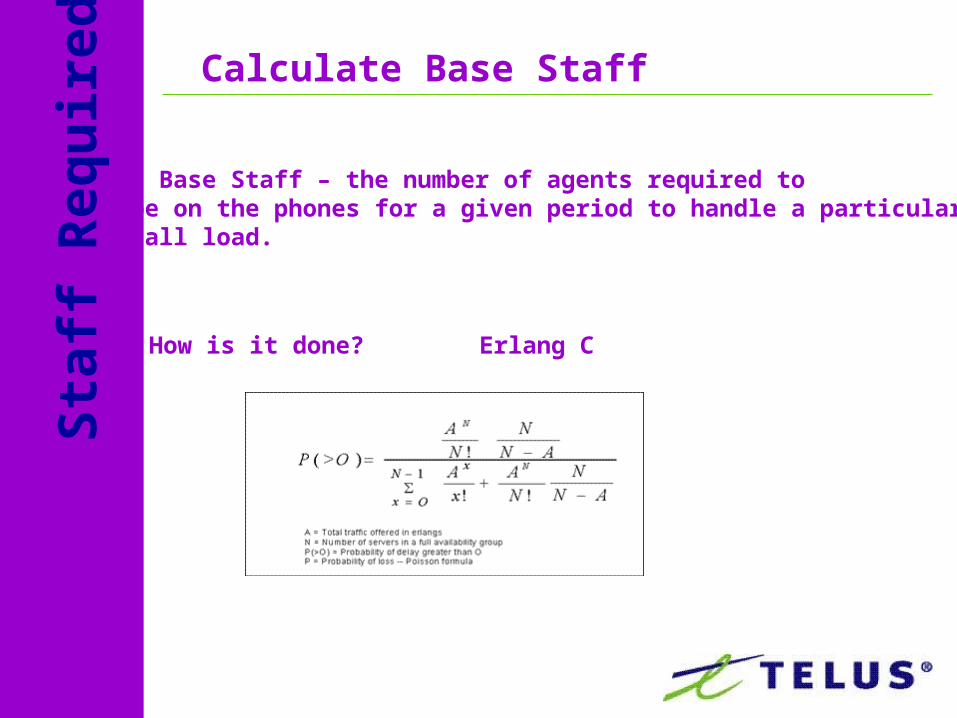
How is it done? Erlang C
• Base Staff – the number of agents required to be on the phones for a given period to handle a particularcall load.
Erl
an
g C Erlang C Module
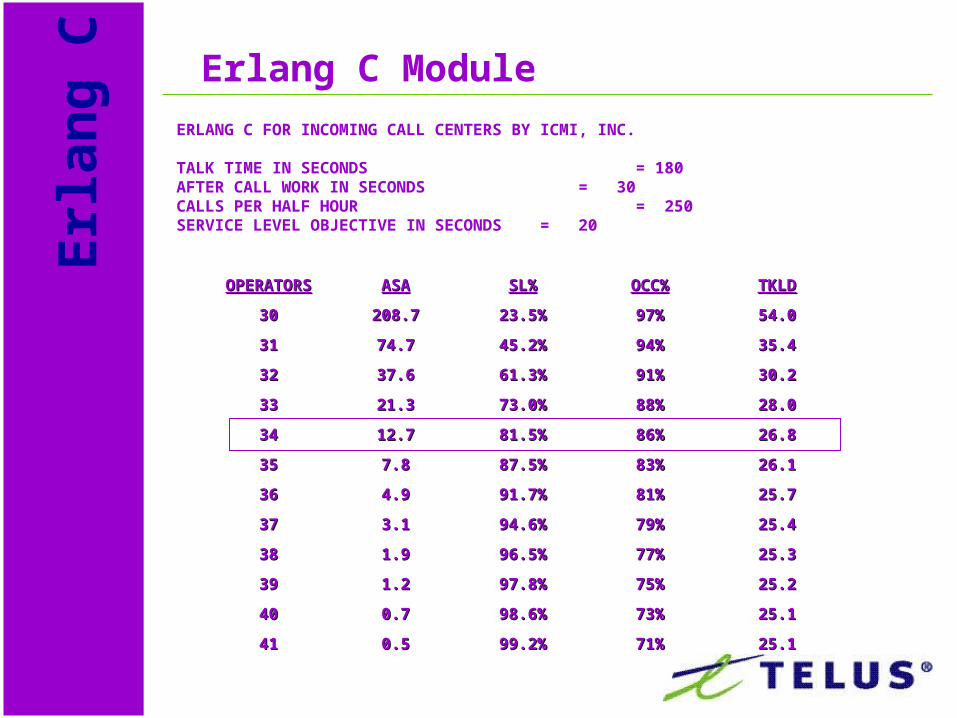
ERLANG C FOR INCOMING CALL CENTERS BY ICMI, INC.
TALK TIME IN SECONDS = 180AFTER CALL WORK IN SECONDS = 30CALLS PER HALF HOUR = 250SERVICE LEVEL OBJECTIVE IN SECONDS = 20
OPERATOROPERATORSS ASAASA SL%SL% OCC%OCC% TKLDTKLD
3030 208.7208.7 23.5%23.5% 97%97% 54.054.0
3131 74.774.7 45.2%45.2% 94%94% 35.435.4
3232 37.637.6 61.3%61.3% 91%91% 30.230.2
3333 21.321.3 73.0%73.0% 88%88% 28.028.0
3434 12.712.7 81.5%81.5% 86%86% 26.826.8
3535 7.87.8 87.5%87.5% 83%83% 26.126.1
3636 4.94.9 91.7%91.7% 81%81% 25.725.7
3737 3.13.1 94.6%94.6% 79%79% 25.425.4
3838 1.91.9 96.5%96.5% 77%77% 25.325.3
3939 1.21.2 97.8%97.8% 75%75% 25.225.2
4040 0.70.7 98.6%98.6% 73%73% 25.125.1
4141 0.50.5 99.2%99.2% 71%71% 25.125.1
Erl
an
g C
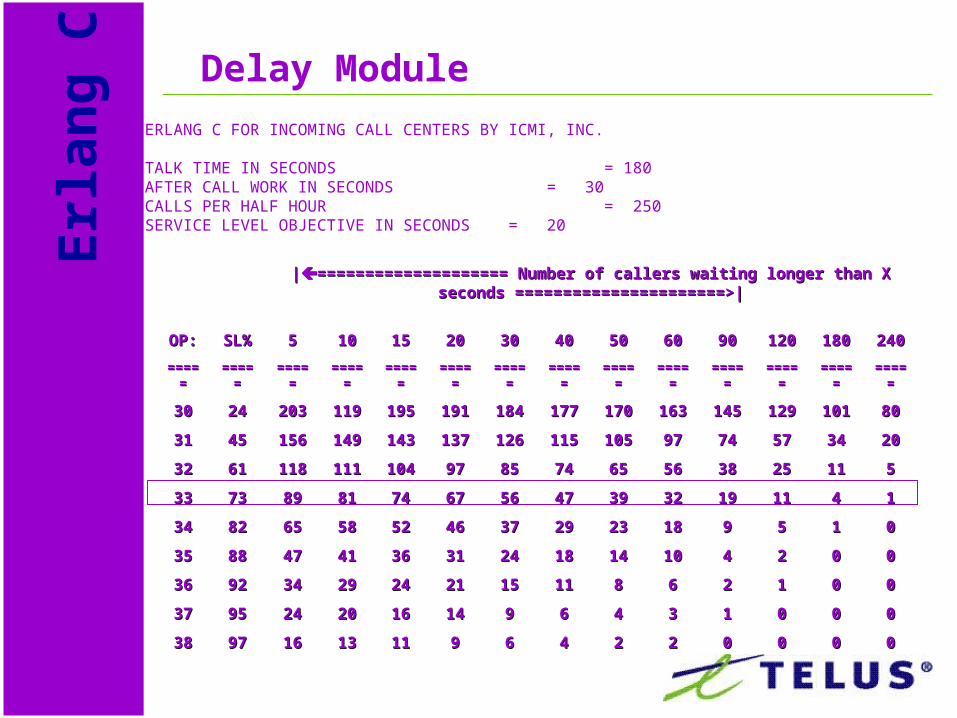
ERLANG C FOR INCOMING CALL CENTERS BY ICMI, INC.
TALK TIME IN SECONDS = 180AFTER CALL WORK IN SECONDS = 30CALLS PER HALF HOUR = 250SERVICE LEVEL OBJECTIVE IN SECONDS = 20
Delay Module
||==================== Number of callers waiting longer ==================== Number of callers waiting longer than X seconds ======================>|than X seconds ======================>|
OP:OP:SLSL%% 55 1010 1515 2020 3030 4040 5050 6060 9090 120120 180180 240240
==========
==========
==========
==========
==========
==========
==========
==========
==========
==========
==========
==========
==========
==========
3030 2424 203203 119119 195195 191191 184184 177177 170170 163163 145145 129129 101101 8080
3131 4545 156156 149149 143143 137137 126126 115115 105105 9797 7474 5757 3434 2020
3232 6161 118118 111111 104104 9797 8585 7474 6565 5656 3838 2525 1111 55
3333 7373 8989 8181 7474 6767 5656 4747 3939 3232 1919 1111 44 11
3434 8282 6565 5858 5252 4646 3737 2929 2323 1818 99 55 11 00
3535 8888 4747 4141 3636 3131 2424 1818 1414 1010 44 22 00 00
3636 9292 3434 2929 2424 2121 1515 1111 88 66 22 11 00 00
3737 9595 2424 2020 1616 1414 99 66 44 33 11 00 00 00
3838 9797 1616 1313 1111 99 66 44 22 22 00 00 00 00
1. Choose a Service Level
Objective9.Repeat for a Higher and Lower Level of Service
8.Calculate
Costs
Th
e P
lan
nin
g a
nd
Man
ag
em
en
t P
rocess o
f C
all
Cen
ters 2.
CalculateBase Staff
3.ForecastCall Load
4.CalculateBase Staff
5.Calculate
Trunk(and Related
SystemResources)
1. Choose a Service Level
Objective
The Planning and Management Process of Call Centers
4.Calculate Base Staff
9.Repeat for a Higher
and Lower Level of Service
2.Collect Data
5.Calculate Trunk and
related system
resources
7.Organize
Schedules (Schedule
Inflex)
3. Forecast Call Load
6.Calculate
for Shrinkage
8.Calculate Costs
Sh
rin
kag
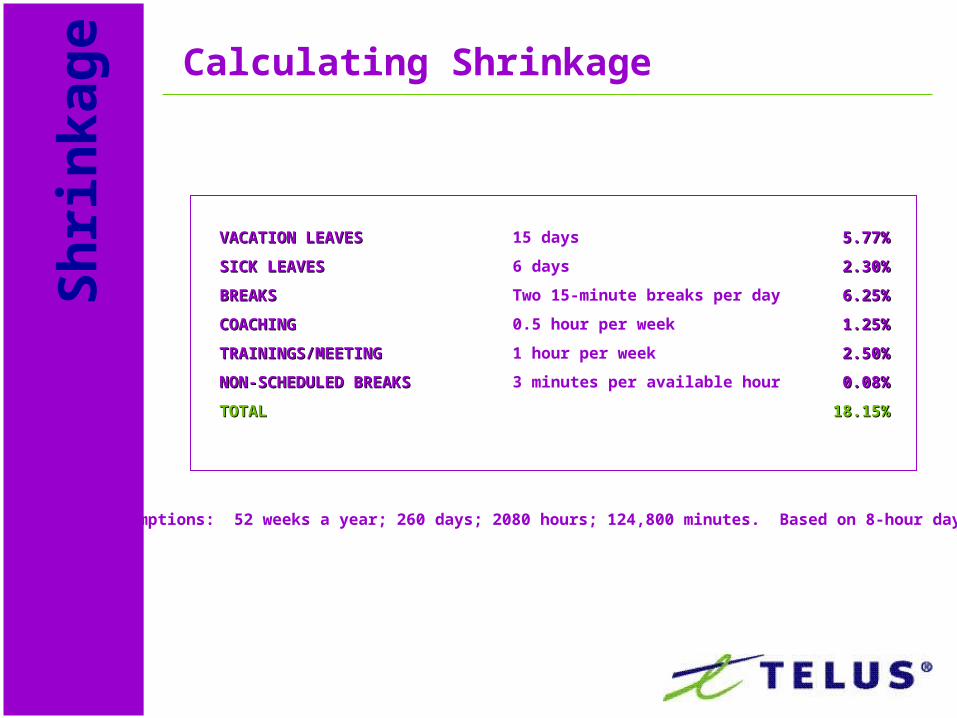
eCalculating Shrinkage
VACATION LEAVESVACATION LEAVES 15 days 5.77%5.77%
SICK LEAVESSICK LEAVES 6 days 2.30%2.30%
BREAKSBREAKS Two 15-minute breaks per day 6.25%6.25%
COACHINGCOACHING 0.5 hour per week 1.25%1.25%
TRAININGS/MEETINGTRAININGS/MEETING 1 hour per week 2.50%2.50%
NON-SCHEDULED BREAKSNON-SCHEDULED BREAKS 3 minutes per available hour 0.08%0.08%
TOTALTOTAL 18.15%18.15%
Assumptions: 52 weeks a year; 260 days; 2080 hours; 124,800 minutes. Based on 8-hour days.
Sh
rin
kag
e
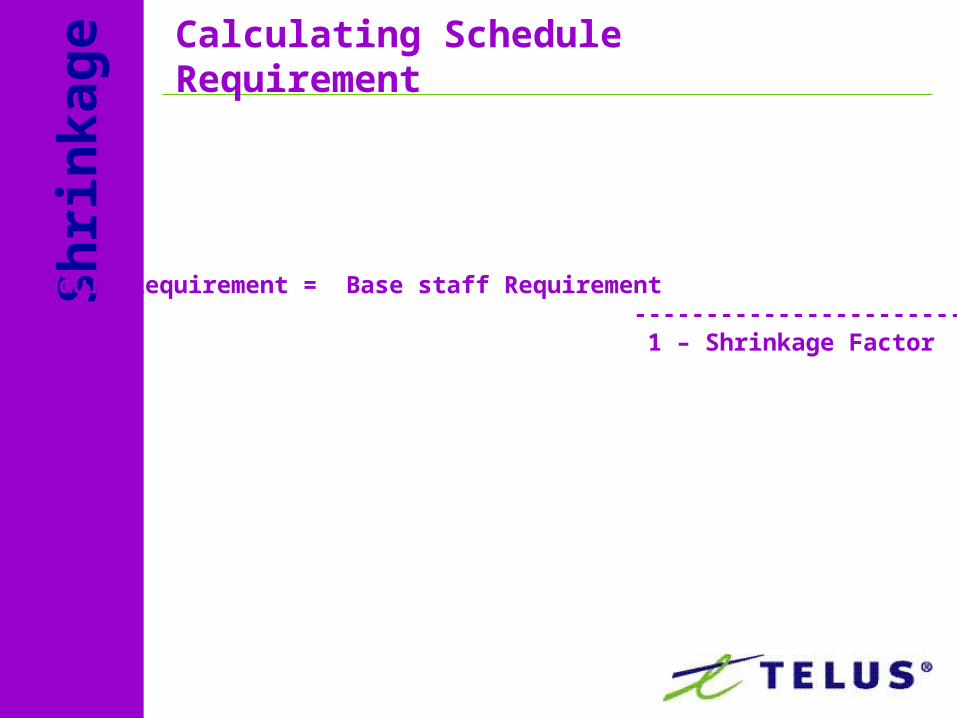
Schedule Requirement = Base staff Requirement ----------------------------- 1 – Shrinkage Factor
Calculating Schedule Requirement
Sch
ed
ule
In
flex
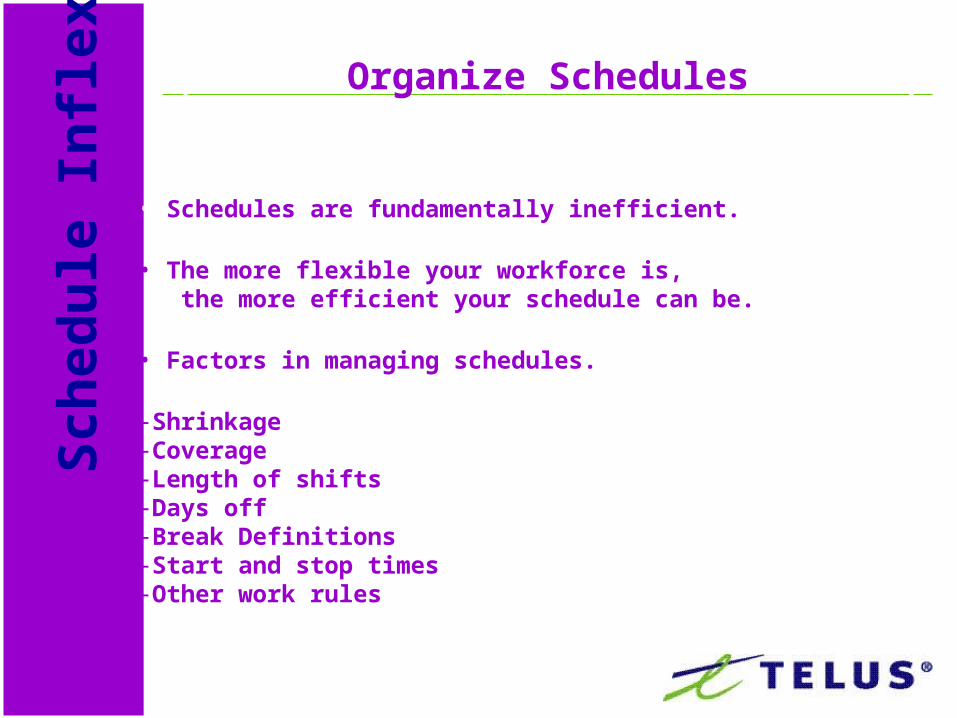
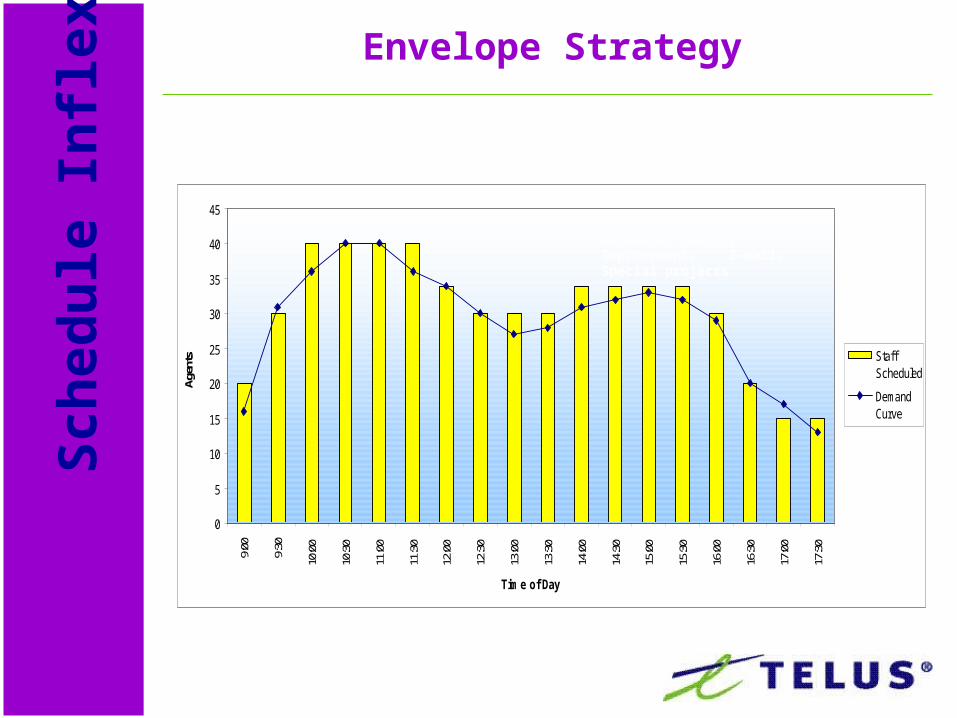
Organize Schedules
• Schedules are fundamentally inefficient.
• The more flexible your workforce is, the more efficient your schedule can be.
• Factors in managing schedules.
-Shrinkage-Coverage-Length of shifts-Days off-Break Definitions-Start and stop times-Other work rules
0
5
10
15
20
25
30
35
40
459:
00
9:30
10:0
0
10:3
0
11:0
0
11:3
0
12:0
0
12:3
0
13:0
0
13:3
0
14:0
0
14:3
0
15:0
0
15:3
0
16:0
0
16:3
0
17:0
0
17:3
0
Time of Day
Agen
ts StaffScheduled
DemandCurve
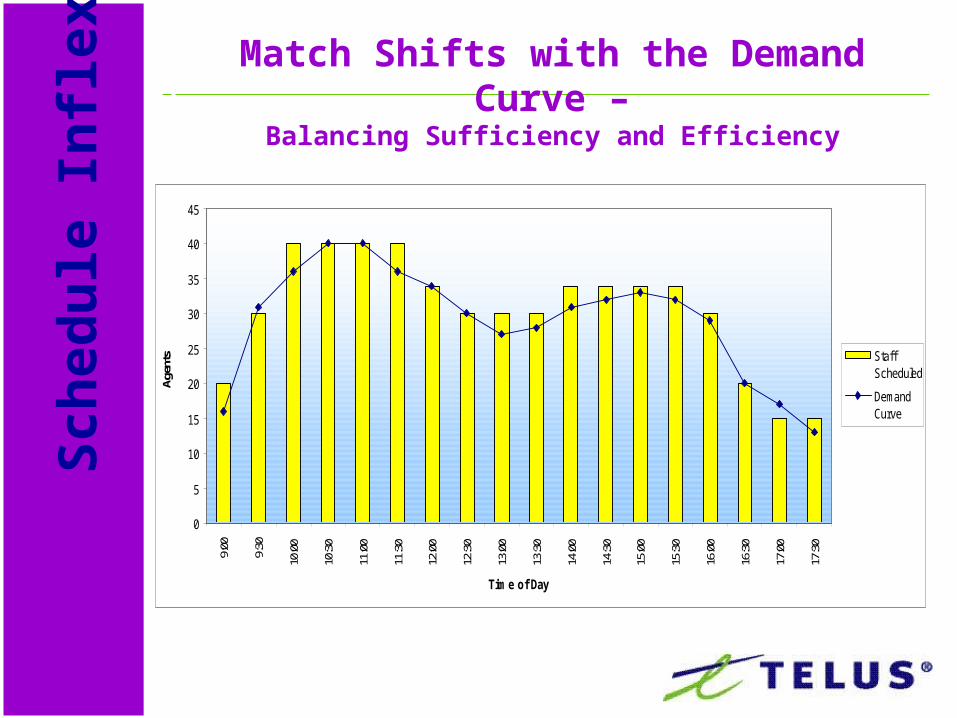
Match Shifts with the Demand Curve –
Balancing Sufficiency and Efficiency
Sch
ed
ule
In
flex
Sch
ed
ule
In
flex
0
5
10
15
20
25
30
35
40
45
9:00
9:30
10:0
0
10:3
0
11:0
0
11:3
0
12:0
0
12:3
0
13:0
0
13:3
0
14:0
0
14:3
0
15:0
0
15:3
0
16:0
0
16:3
0
17:0
0
17:3
0
Time of Day
Agen
ts StaffScheduled
DemandCurve
Envelope Strategy
Outbound; Quality Improvement; E-mail; Special projects
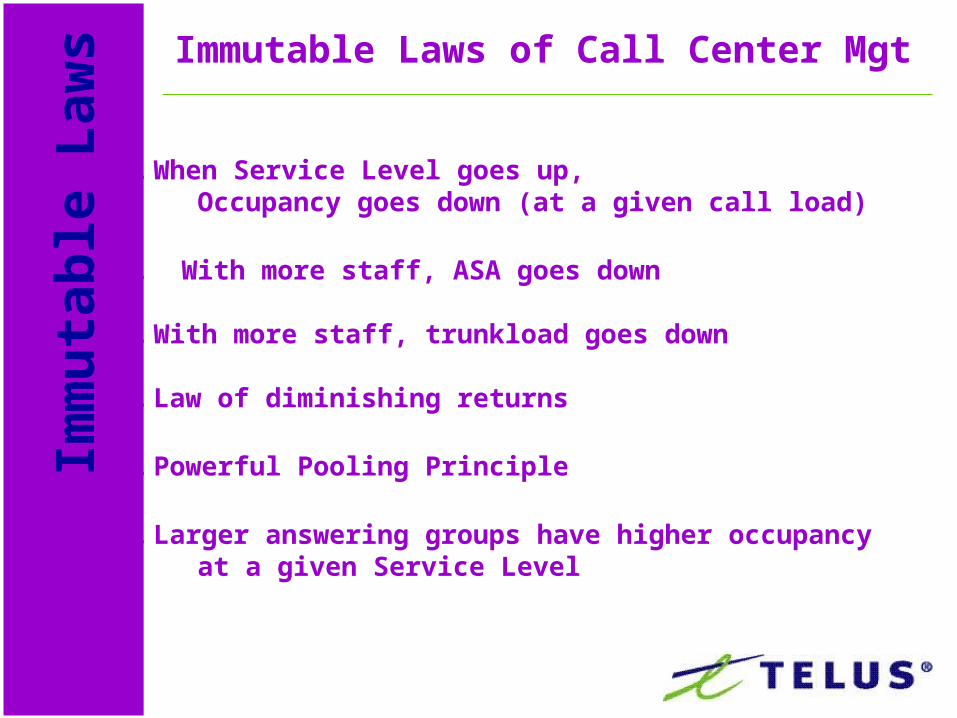
Immutable Laws of Call Center MgtIm
mu
tab
le L
aw
s
1. When Service Level goes up, Occupancy goes down (at a given call load)
2. With more staff, ASA goes down
3. With more staff, trunkload goes down
4. Law of diminishing returns
5. Powerful Pooling Principle
6. Larger answering groups have higher occupancy at a given Service Level
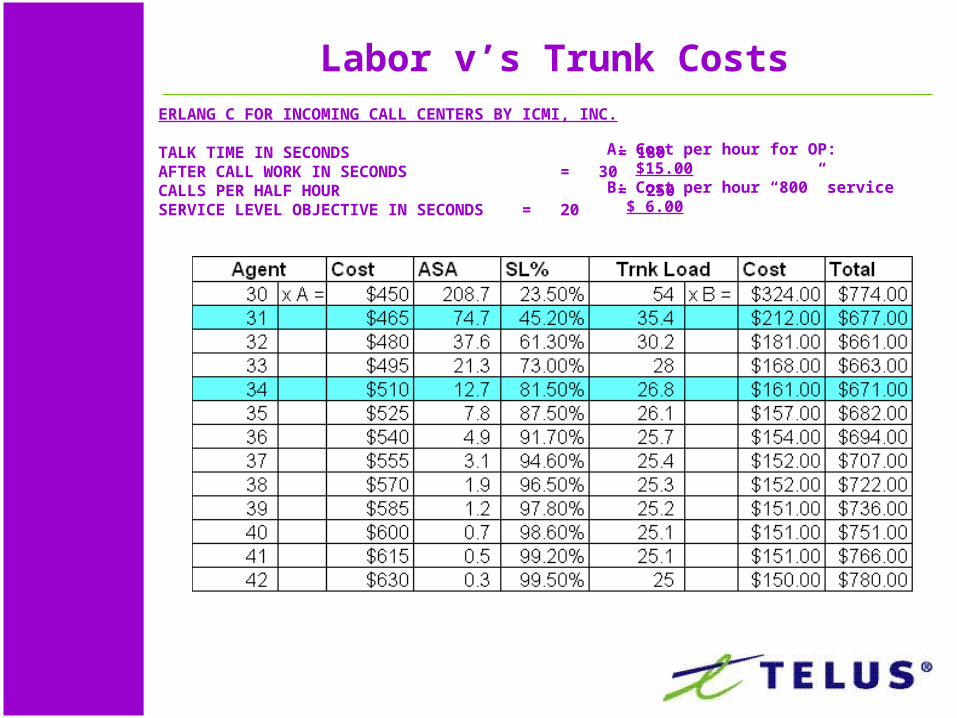
Labor v’s Trunk CostsERLANG C FOR INCOMING CALL CENTERS BY ICMI, INC.
TALK TIME IN SECONDS = 180AFTER CALL WORK IN SECONDS = 30CALLS PER HALF HOUR = 250SERVICE LEVEL OBJECTIVE IN SECONDS = 20
A: Cost per hour for OP: $15.00B: Cost per hour “800” service $ 6.00
Imm
uta
ble
Law
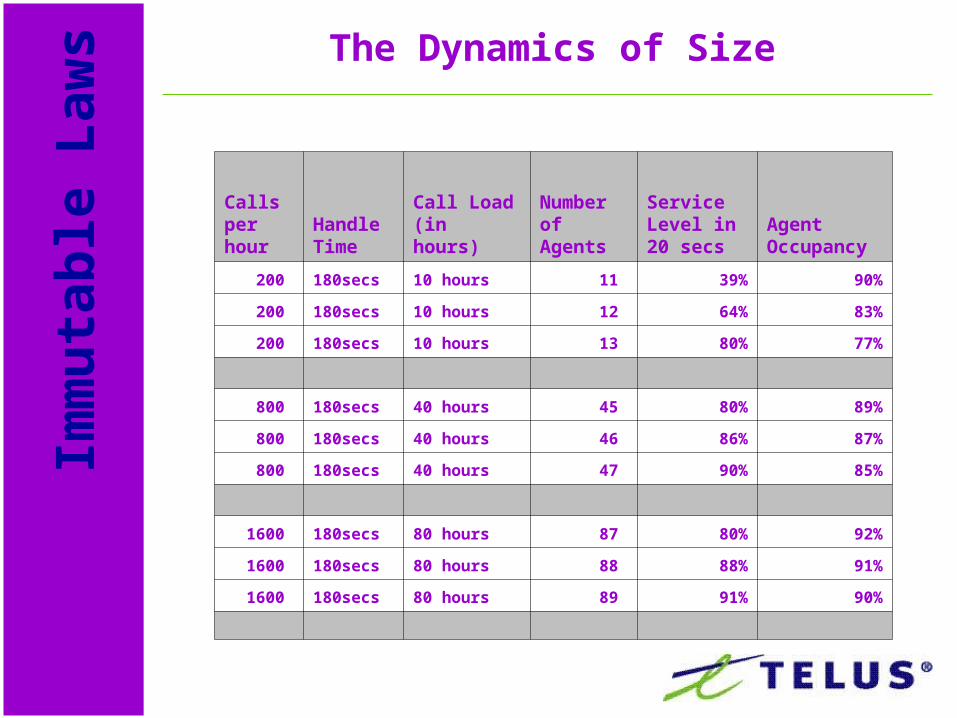
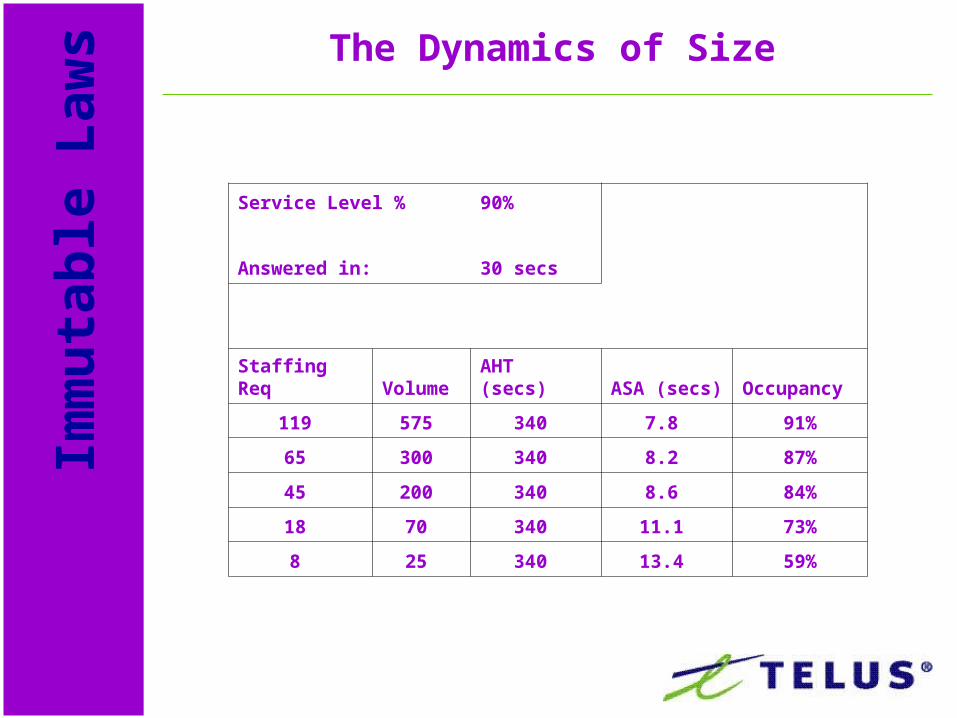
sThe Dynamics of Size
Calls per hour
Handle Time
Call Load (in hours)
Number of Agents
Service Level in 20 secs
Agent Occupancy
200 180secs 10 hours 11 39% 90%
200 180secs 10 hours 12 64% 83%
200 180secs 10 hours 13 80% 77%
800 180secs 40 hours 45 80% 89%
800 180secs 40 hours 46 86% 87%
800 180secs 40 hours 47 90% 85%
1600 180secs 80 hours 87 80% 92%
1600 180secs 80 hours 88 88% 91%
1600 180secs 80 hours 89 91% 90%
Imm
uta
ble
Law
sThe Dynamics of Size
Service Level % 90%
Answered in: 30 secs
Staffing Req Volume AHT (secs) ASA (secs) Occupancy
119 575 340 7.8 91%
65 300 340 8.2 87%
45 200 340 8.6 84%
18 70 340 11.1 73%
8 25 340 13.4 59%
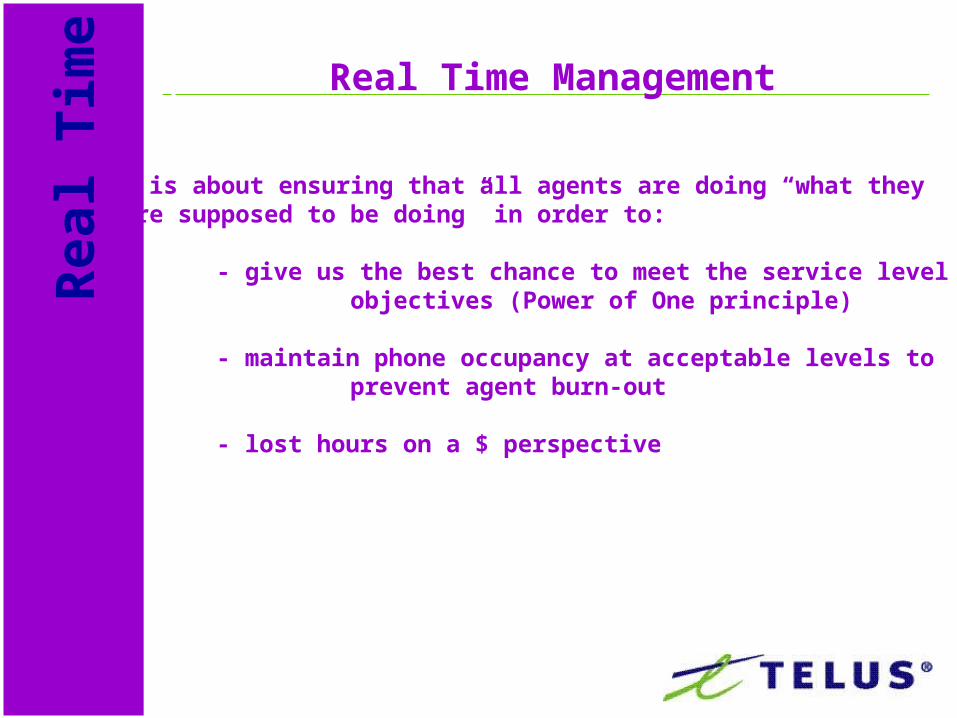
Real Time ManagementR
eal Tim
e
• is about ensuring that all agents are doing “what theyare supposed to be doing” in order to:
- give us the best chance to meet the service level objectives (Power of One principle)
- maintain phone occupancy at acceptable levels to prevent agent burn-out
- lost hours on a $ perspective

- QUIZ -