1
Novato Novato San Rafael San Rafael Lucas Valley-Marinwood Lucas Valley-Marinwood Santa Venetia Santa Venetia Black Point-Green Point Black Point-Green Point Fairfax Fairfax Woodacre Woodacre San Anselmo San Anselmo Fairfax Fairfax ¬ « 37 ¬ « 37 £ ¤ 101 122°30’0"W 122°30’0"W 122°32’30"W 122°32’30"W 122°35’0"W 122°35’0"W 122°37’30"W 122°37’30"W 38°7’30"N 38°7’30"N 38°5’0"N 38°5’0"N 38°2’30"N 38°2’30"N 38°0’0"N 38°0’0"N 5 33 000m E 5 33 000m E 34 34 35 35 36 36 37 37 38 38 39 39 5 40 5 40 41 41 42 42 43 43 5 44 000m E 5 44 000m E 42 06 000m N 42 06 000m N 07 07 08 08 09 09 42 10 42 10 11 11 12 12 13 13 14 14 15 15 16 16 17 17 18 18 19 19 42 20 000m N 42 20 000m N This information is being made available for informational purposes only. Users of this information agree by their use to hold blameless the State of California, and its respective officers, employees, agents, contractors, and subcontractors for any liability associated with its use in any form. This work shall not be used to assess actual coastal hazards, insurance requirements, or property values and specifically shall not be used in lieu of Flood Insurance Studies and Flood Insurance Rate Maps issued by the Federal Emergency Management Agency (FEMA). Data Sources: US Geological Survey, Department of Commerce (DOC), National Oceanic and Atmospheric Administration (NOAA), National Ocean Service (NOS), Coastal ServicesCenter (CSC), Scripps Institution of Oceanography, Phillip WIlliams and Associates, Inc. (PWA), US Department of Agriculture (USDA), California Coastal Commission, and National Aeronautics and Space Administration (NASA). Imagery from ESRI and i-cubed. Created by the Pacific Institute, Oakland, California, 2009. California Flood Risk: Sea Level Rise 0 0.5 1 1.5 2 0.25 Miles 0 1 2 3 0.5 Kilometers 1: 2: 3: 4: 5: 6: 7: 8: Petaluma Petaluma River Sears Point not printed Petaluma Point Bolinas San Rafael San Quentin 8 6 7 1 2 3 5 4 § ¨ ¦ £ ¤ " ) ¬ « Interstate US Highway State Highway County Highway Grid coordinates: UTM Zone 10N meters Adjoining Quadrangles: Map extents match USGS 7.5 minute topographic maps Project funded by the California Energy Commission’s Public Interest Energy Research Program, CalTrans, and the California Ocean Protection Council Novato Quadrangle NAD83 GCS degrees Coastal Zone Boundary Current Coastal Base Flood (approximate 100-year flood extent) Sea Level Rise Scenario Coastal Base Flood + 1.4 meters (55 inches) Landward Limit of Erosion High Hazard Zone in 2100

California Flood Risk: Sea Level Rise Novato Quadrangle

  • Upload
    others

  • View
    3

  • Download
    0

Embed Size (px)

Citation preview

NovatoNovato

San RafaelSan Rafael

Lucas Valley-MarinwoodLucas Valley-Marinwood

Santa VenetiaSanta Venetia

Black Point-Green PointBlack Point-Green Point

FairfaxFairfax

WoodacreWoodacre

San AnselmoSan AnselmoFairfaxFairfax

¬«37

¬«37

£¤101

122°30’0"W

122°30’0"W

122°32’30"W

122°32’30"W

122°35’0"W

122°35’0"W

122°37’30"W

122°37’30"W

38°7’30"N38°7’30"N

38°5’0"N38°5’0"N

38°2’30"N38°2’30"N

38°0’0"N38°0’0"N

533000mE

533000mE

34

34

35

35

36

36

37

37

38

38

39

39

540

540

41

41

42

42

43

43

544000mE

544000mE

4206

00

0m

N

4206

00

0m

N

07 07

08 08

09 09

4210 4210

11 11

12 12

13 13

14 14

15 15

16 16

17 17

18 18

19 19

4220

00

0m

N

4220

00

0m

N

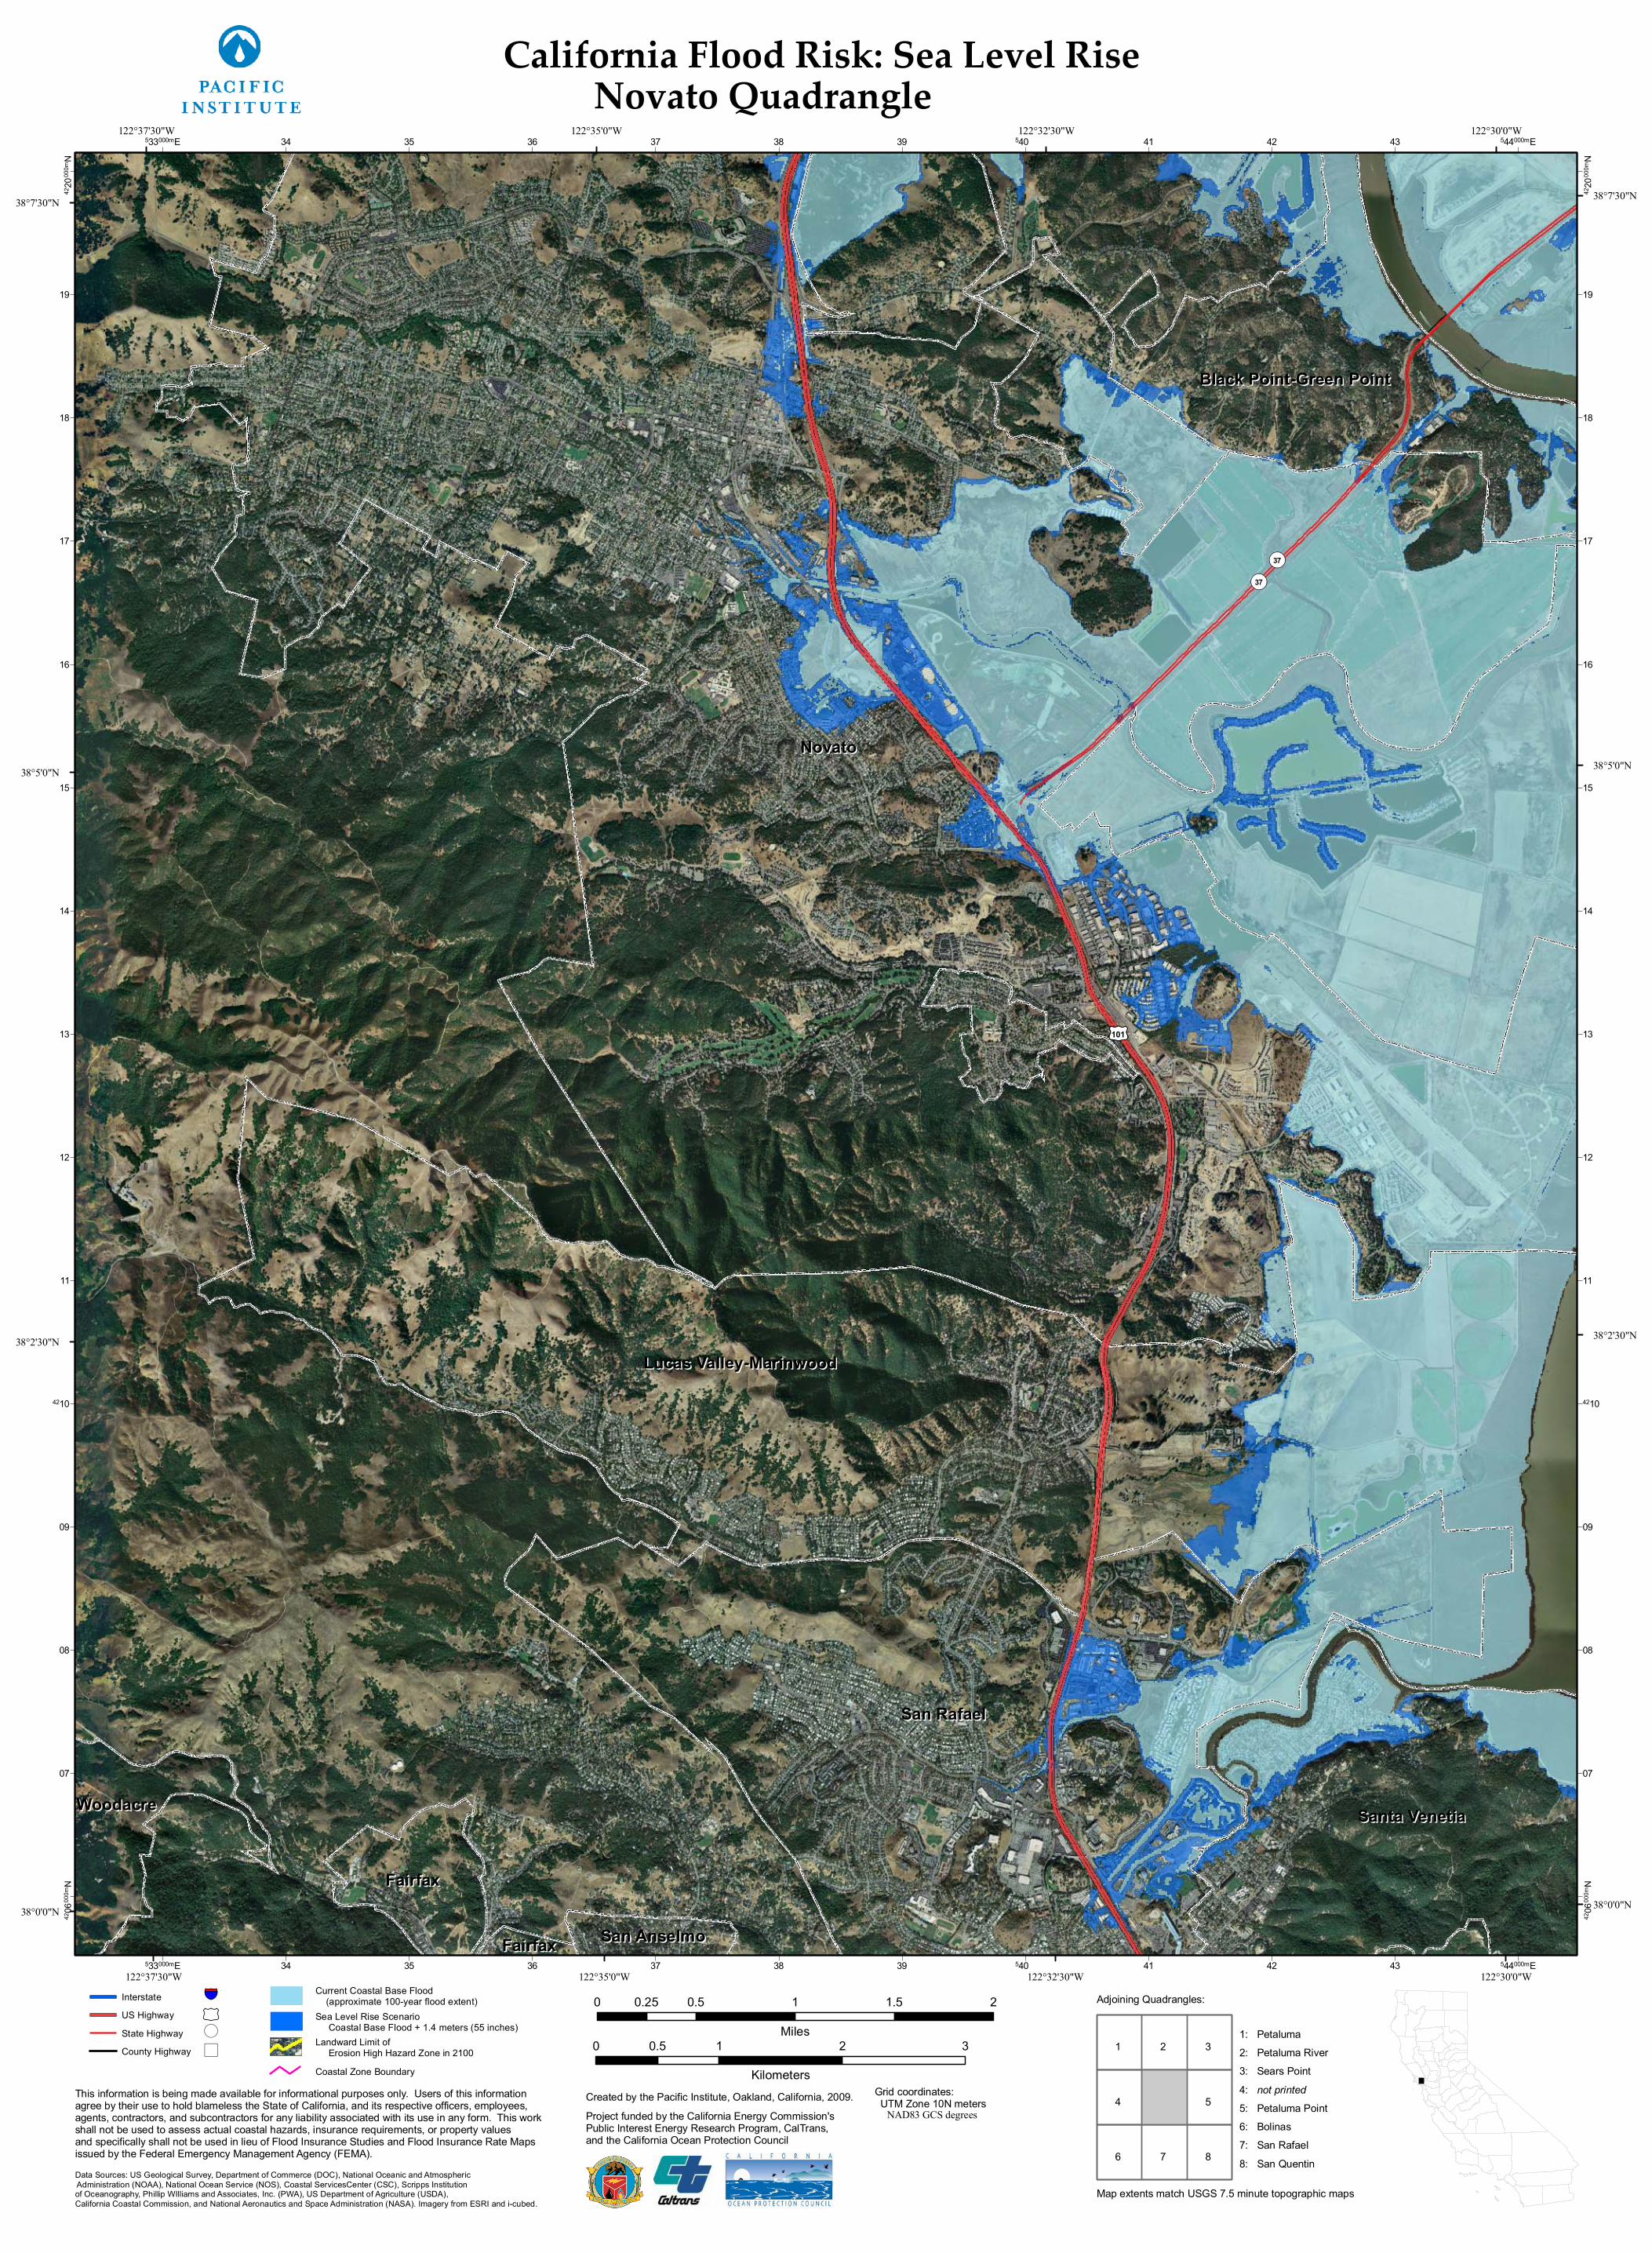
This information is being made available for informational purposes only. Users of this informationagree by their use to hold blameless the State of California, and its respective officers, employees,agents, contractors, and subcontractors for any liability associated with its use in any form. This workshall not be used to assess actual coastal hazards, insurance requirements, or property values and specifically shall not be used in lieu of Flood Insurance Studies and Flood Insurance Rate Maps issued by the Federal Emergency Management Agency (FEMA).

Data Sources: US Geological Survey, Department of Commerce (DOC), National Oceanic and Atmospheric

Administration (NOAA), National Ocean Service (NOS), Coastal ServicesCenter (CSC), Scripps Institution of Oceanography, Phillip WIlliams and Associates, Inc. (PWA), US Department of Agriculture (USDA),

California Coastal Commission, and National Aeronautics and Space Administration (NASA). Imagery from ESRI and i-cubed.

Created by the Pacific Institute, Oakland, California, 2009.

California Flood Risk: Sea Level Rise

0 0.5 1 1.5 20.25

Miles

0 1 2 30.5

Kilometers

1:

2:

3:

4:

5:

6:

7:

8:

Petaluma

Petaluma River

Sears Point

not printed

Petaluma Point

Bolinas

San Rafael

San Quentin86 7

1 2 3

54

§̈¦

£¤

")

¬«

Interstate

US Highway

State Highway

County Highway

Grid coordinates: UTM Zone 10N meters

Adjoining Quadrangles:

Map extents match USGS 7.5 minute topographic maps

Project funded by the California Energy Commission’s Public Interest Energy Research Program, CalTrans,and the California Ocean Protection Council

Novato Quadrangle

NAD83 GCS degrees

Coastal Zone Boundary

Current Coastal Base Flood (approximate 100-year flood extent)

Sea Level Rise Scenario Coastal Base Flood + 1.4 meters (55 inches)

Landward Limit of Erosion High Hazard Zone in 2100