Embed Size (px)
Citation preview

Vietnam Is Beginning To Deliver On A Decade of Promise
The pace of economic growth, policy reform and development in Vietnam’s
capital markets now demand attention. One of the last frontier markets to
emerge in Asia, we see Vietnam as a ten-year buy. It now represents 3% of
our regional model portfolio.
The Economy Is Vibrant, And Rapidly Growing
The Vietnamese economy is now one of the fastest growing in the region,
trending above 7% since 2002, under pinned by proactive government policy,
annual FDI of US$5bn and US$4bn of inward remittances.
Consumption Is Turning Conspicuous
The population of 82m is amongst the youngest in Asia, literacy rates are
above 96% and consumption is growing at 20% p.a. This is an economy that
is communist in name only.
Embryonic Stock Market, Developing Through Privatisation
Market capitalization to GDP is only 4%, the government is targeting 15% -
the regional average is closer to 130%. A slew of privatizations over the next
twenty four months should dramatically expand this and bring Vietnam closer
to inclusion in regional benchmarks.
Bring On The Banks
The bank sector is one of the most interesting ways to play the growth of
Vietnam Inc as the consumer gains appetite for credit, infrastructure needs
are addressed and the private sector looks to fund its capital expenditure.
We liked ACB and Sacom Bank. Other meetings included Vinamilk, BT6 and
GemAdept.
PACIFIC RIM
Equity Strategy
Spencer White, CFA>> Strategist, Merrill Lynch (Hong Kong) (852) 2536 3093 [email protected]
Stephen Corry>> Strategist, Merrill Lynch (Hong Kong)
(852) 2536 3403 [email protected]
Willie Chan>> Strategist, Merrill Lynch (Hong Kong)
(852) 2536-3960 [email protected]
Asia Pac Financial Institutions
Alistair Scarff>>
Research Analyst, Merrill Lynch (Hong Kong)
(852) 2536 3966
2 February 2006
Asian Insights Buy Vietnam - The Emerging Frontier Of ASEAN
Merrill Lynch does and seeks to do business with companies covered in its research reports. As a result, investors should be aware that the firm may have a conflict of interest that could affect the objectivity of this report.
Investors should consider this report as only a single factor in making their investment decision.
Refer to important disclosures on page 52. Analyst Certification on page 51.
Global Securities Research & Economics Group Global Fundamental Equity Research DepartmentRC#60403301
>>Employed by a non-US affiliate of MLPF&S and is not registered/qualified as a research analyst under the NYSE/NASD rules.

Asian Insights – 2 February 2006
2 Refer to important disclosures on page 52.
CONTENTS
� Section Page
Insight Focus : Vietnam Investment Summary: From Bicycles to BMWs ? It’s A Buy 3 - 5
Capital Markets – Equity, Debt & FX 6 - 9
Government Policy And Politics 10 - 14
Economic Drivers – Investment & Consumption 15 - 17
The Bank Sector In-Depth 18 - 24
Company Themes & Visit Highlights 25 - 29
Risks For Vietnam 30
Trading Vital Statistics 31 – 32
Regular Sections The Big Picture - Current Equity Strategy for Asia ex-Japan 33 – 37
Asset Allocation & Thematic Model Portfolio 38 – 40
Foreign Net Buying & Selling, Market Turnover, PE & PB, EY &DY 41 – 48
Correlation Table & Pair Trade Charts 49- 50

Asian Insights – 2 February 2006
Refer to important disclosures on page 52. 3
From Bicycles to BMWs ? It’s A Buy
Vietnam should not be dismissed as more interesting than investible. It is one
of the last frontier emerging economies in the region that will demand
investor attention over the next decade. In the last four years we have seen
rapid changes in both the economy and in government policy that are
generating consistent 8% GDP growth.
Wealth is being created at a turbo-charged rate, and the young, newly
affluent population is engaging in a startling wave of (largely un-financed)
conspicuous consumption. Accelerating foreign direct investment, the
prospects of WTO-entry by 2007, opportunities to develop tourism much
more significantly and a wide ranging infrastructure program are all
important drivers of sustainable long term growth. The privatization
program that is underway has the potential to meaningfully expand the
breadth and depth of this market over the next five years.
Why Vietnam And Why Now
Vietnam is one of the last frontier emerging economies in the region that will demand serious investor attention over the next decade. Buy equity exposure now. For your fund, for yourself or for your children. Buy now and tuck the investment away for ten years. In 2016 we can come back to discuss compound returns, the toys that you can buy or the college that they will go to.
None of this promise is new, of course. Vietnam looked very promising ten years ago in 1994-1995. But then the Asia Crisis came, investors pulled cash out of high risk and peripheral markets, cash was swept out of the Vietnamese economy and momentum was lost. Most importantly, there was no stock market at that time, and the capital extraction process was painful for many. However, in the last five years there have seen rapid changes in both the economy and in government policy that are generating consistent 7%- 8% GDP growth. More startling for us has been to observe this pace of positive change accelerate quite dramatically in the past twelve months.
Wealth is being created at a turbo-charged rate, and the young, newly affluent population is engaging in a startling wave of (largely un-financed) conspicuous consumption. In the last eight months bicycles have been swapped for BMW’s in the streets of Hanoi and Ho Chi Minh. McDonald’s may be conspicuous by its absence but there is no shortage of high-end electronics retail outlets, mobile phone distributors and auto dealers challenging the spaces previously dominated by art and lacquer ware. Accelerating foreign direct investment, the prospects of WTO-entry by 2007, opportunities to develop tourism much more significantly and a wide ranging infrastructure program are all important drivers of sustainable long term growth.
The disconnect has always been the nascent state of development of the capital markets. With a total market capitalization of just over US$1.1bn, consisting of 35 listed stocks and one fund, the VN-Index remains niche, to say the least. However, we do believe that the privatization program that is underway has the potential to meaningfully expand the breadth and depth of this market over the next five years. Opportunities for the direct accumulation of equities exist in both the OTC as well as the listed market. The increasing number of domestically-run funds offer a more diversified play on the longer term prospects.
Valuations For The VN-Index
2005F 2006F
PE (x) 11.6 9.7
EPS Growth (%) 27.5 20.2
PB (x) 3.1 2.6
DY (%) 3.6 3.6
RoE (%) 29.7 29.8
Source: IBES
This Year Vietnam Has The Second Highest Growth Rate In Asia
3.0
4.0
5.0
6.0
7.0
8.0
9.0
China
Vietn
amIn
dia
Pakista
n
Hon
g Kon
g
Singa
pore
Malay
sia
Korea
Taiwan
Thaila
nd
Philip
pine
s
Indo
nesia
Aus
tralia
(%)
2006 GDP Growth (%)
Source: Merrill Lynch, Asian Development Bank
GDP growth has exceeded 7%
for each of the last four years
And consumption is becoming
very conspicuous
The privatization program is
the driving force behind the
expansion of the equity market

Asian Insights – 2 February 2006
4 Refer to important disclosures on page 52.
Asset Classes For Expressing A View On Vietnam
� Equities (Direct)
Accounts take a couple of weeks to set up. For details see the section titled ‘Vital Trading Statistics’. There are no lock-up periods for secondary market purchases but here is a 49% foreign ownership limit for all stocks except banks which are currently 30%. Liquidity is tight, however. The largest market cap stock, Vinamilk, currently trades US$300,000 per day.
� Equities (Indirect)
A small but growing number of funds are now established, ranging from pure venture capital to OTC and listed equities. Some include other asset classes such as property as well. From our discussions it seems likely that several will be offering additional capacity over the coming months. The only other choice is to buy the listed units (where relevant). These closed end funds tend to trade at close to a 10% premium to NAV.
Selection Of Vietnam Funds
Company Name Contact Fund Name NAV (US$mn) Listed Type
Dragon Capital www.dragoncapital.com
Vietnam Enterprise Investment Fund (VEIL)
185 Dublin Listed and pre-IPO equity, debt and property
Vietnam Growth Fund (VGF) 115 Dublin Listed and pre-IPO equity, debt
Vietnam Dragon Fund (VGF)^ 35^ Dublin Listed and pre-IPO equity, debt
Mekong Capital www.mekongcapital.com
Mekong Enterprise Fund 19 N/A Private equity
Mekong Enterprise Fund II 40 N/A Private equity
PXP Asset Management www.pxpam.com PXP Vietnam Fund Ltd 25 Dublin Listed and pre-IPO equity
PXP Vietnam Emerging Equity Fund*
14* Dublin Listed and pre-IPO equity
Vietnam Pioneer Partners [email protected]
Vietnam Pioneer Fund Raising US$50mn N/A Pre-IPO equity
Vina Capital www.vinacapital.com
Vietnam Opportunities Fund 170 London Stock Exchange
(AIM)
Listed equity, pre-IPO equity, debt and property
Source: Merrill Lynch Asia Pacific Equity Strategy Group, *PXP has just raised US$14m for the Vietnam Emerging Equity Fund, it has capacity for another US$36m, same listing and closed end structure as the existing Vietnam Fund, ^second fund raising for VDF due in 2Q06
� Bonds
The US$750m sovereign bond issue in October 2005 was the first issue since the Brady bonds in the late 1990’s. These are now trading at a spread of 168bps over Treasuries. The corporate debt market has not been developed yet and the Vietcom Bank CB issue from November 2005 is not available to foreign investors.
� Property
Prime residential property in Hanoi has doubled over the last couple of years and is now close to US$200 per square foot. Ho Chi Minh City prices are comparable and foreigners can only get a 50 year lease. Whilst increased access by budget airlines combined with domestic wealth creation usually underpins property prices the development of the equity market creates a competing asset class. We prefer equity exposure, although prime beach property may be worth a look.
� Currency
Currency controls prevent this being a useful avenue. The Dong has depreciated by close to 1% per annum over the last five years as the State Bank of Vietnam has allowed the official rate to follow the unofficial rates on the street.
No lock up periods for equities
but volumes remain
challenging, for now
The equity market represents
competition for the previous
asset of choice – Property

Asian Insights – 2 February 2006
Refer to important disclosures on page 52. 5
Summary of Key Investment Arguments For Vietnam
The Opportunity
1. Dramatically high growth economy, opening up and becoming more diverse
2. Major infrastructure requirements that are beginning to be addressed and which should sustain the current economic trajectory
3. Accelerating privatization program that is sent to dramatically enlarge this frontier Asian emerging market
4. A young, aspirational, highly literate workforce that is only now developing a precocious appetite for conspicuous consumption
5. A very under developed banking system that is on the cusp of major change
6. Under stated valuations embedded in the balance sheets of many companies. PE multiples of 8x-10x are usually paired with EPS growth of 20%-40% and dividend yields range from 3% to 10%.
7. WTO membership may attract further capital flows together, whilst FDI continues to be robust at more than US$4bn per year.
The Challenge
1. Even after the market capitalization doubled during our visit, trading volumes of listed equities are extremely thin at circa US$1m a day.
2. The party congress takes place in April. The promotion of less reform minded officials could de-rail the momentum that has been so carefully established since 2000.
3. The property market has had a remarkable bull run, gaining some 1000% in the last four years. This could come under pressure from the development of the equity market.
4. The strong agricultural bias to the economy leaves it vulnerable to drought. Furthermore, 56% of power is hydro-derived. This has crimped output and failure to relieve this will act as a drag to Vietnam’s growth potential.
5. Levels of corruption are of a concern to some, but we view this through a rather more pragmatic lens. It is institutionalized enough to ensure policy momentum at the current time.

Asian Insights – 2 February 2006
6 Refer to important disclosures on page 52.
Capital Markets
One of the biggest challenges for potential investors in Vietnam’s embryonic
capital markets is capacity. Debt accounts for 96% of current value of listed
securities. Daily transaction volumes for the US$1.1bn worth of listed equities
are still close to US$1m. However, valuations do look attractive - the average
PE of listed securities is 9.7x, with 20% earnings growth, a 30% RoE and a
dividend yield of 3.6%.
Privatization IPOs will boost market capitalization over the next twenty four
months, particularly from the bank sector. In the meantime, a number of
existing funds are expanding capacity, new privatization funds are being
launched and equity risk appetite of the Japanese is about to be satiated by
the set up of the first on-line brokerage giving access to Vietnamese equities.
Market Valuations
2006F
EPS Growth (%) PE (x) PB (x) RoE (%) DY (%)
Vietnam* 20.2 9.7 2.6 29.8 3.6
Indonesia 13.9 12.7 2.6 20.4 3.4
Malaysia 10.8 13.0 1.8 14.9 4.2
Philippines 15.0 10.8 1.4 12.9 1.8
Singapore 9.6 14.5 1.8 12.8 3.4
Thailand 3.8 9.6 2.9 19.9 4.4
Japan 9.7 18.7 2.2 11.8 1.2
China 6.8 11.6 1.9 16.8 2.8
Hong Kong 0.9 13.7 1.7 12.6 3.9
South Korea 9.4 10.2 1.5 16.0 1.6
Taiwan 11.0 12.0 2.1 17.1 4.2
Australia 10.8 14.5 2.6 18.0 3.8
India 18.5 14.7 3.3 24.2 1.8
Pakistan 10.4 11.3 3.0 27.1 5.1
Source: Merrill Lynch Asia Pacific Equity Strategy Group, *Consensus forecasts
An Embryonic, But Rapidly Growing, Equity Market
Vietnam’s equity market is one of the newest in Asia, the Ho Chi Minh Exchange began in July, 2000 with Hanoi following some five months later. Progress since then has been understandably slow but steady. However, it has been the listing of Vinamilk that has potentially marked the arrival of this embryonic equity market upon the emerging frontier of Asia.
The top dairy company in Vietnam added US$513m worth of market capitalization to the VN Index, taking its total value to US$1.1bn in the space of the twenty minute trading session that occurs between 9.00am and 9.20 am. With only thirty five listed companies, plus one fund, this remains one of the smallest and least liquid markets in the region. Average trading volumes in the listed market are close to US$1m and the regulator, the Securities Stock Commission (SSC), estimates that retail investors account for 90% of this.
Vietnam Market Index
100
150
200
250
300
350
400
450
500
550
600
Jul-00 Jul-01 Jul-02 Jul-03 Jul-04 Jul-05
Vietnam Index
Source: Bloomberg
Regional Market Turnover –
Vietnam Is Coming Off A Low Base
(US$mn)
Vietnam 1
Indonesia 167
Malaysia 121
Philippines 19
Singapore 424
Thailand 414
China 507
Hong Kong 3,659
South Korea 5,015
Taiwan 3,937
Australia 2,408
India 963
Pakistan 545
Source: Thomson Financial DataStream

Asian Insights – 2 February 2006
Refer to important disclosures on page 52. 7
However, this equity market is also likely to be one of the fastest growing as more privatizations come through and, perhaps, some of OTC-traded private sector companies are persuaded to go public. However, for now the majority of listed companies are ex-state enterprises. The ratio of market-cap to GDP is also amongst the lowest in Asia at just 4%. The official target is to raise this to as much as 15% by 2010 – even then it would still be the most under-represented in the Asia - the regional average is 127%).
To help pave the way for this the government has begun to loosen its investment restrictions, as well as introduce new securities-related legislation that we will be hearing much more about over the next six months. However, the first step has been taken with the increase in foreign ownership limits (from 30% to 49%) that was implemented in October, 2005. The table below highlights the major stocks, and their foreign holdings.
Top 10 Stocks By Mkt Cap
2006F
Foreign Ownership
Symbol
Company
Mkt Cap(US$mn) DY (%)
EPS growth (%) PE (x) PB (x) RoE (%)
Total shares (m) %
VNM Vinamilk 524.4 3.0 16.8 10.5 2.9 30.6 159.0 14.9
GMD Gemadept 90.4 3.5 26.8 9.4 2.3 27.0 21.0 19.4
KDC South Kinh Do 83.2 3.0 29.5 10.3 3.3 35.5 25.0 24.1
REE REE 63.0 4.1 21.6 10.7 2.4 24.5 28.2 38.2
SAM Sacom Cable 61.7 3.4 (8.7) 7.0 2.4 34.1 23.4 34.0
NKD North Kinh Do 23.7 3.3 22.4 7.8 3.0 43.3 7.0 17.1
SSC Southern Seed 16.5 4.5 19.5 6.9 2.0 31.7 6.0 19.1
TMS Transimex 11.9 3.5 7.6 9.8 2.4 26.0 4.3 40.3
BT6 Concrete 620 11.8 4.8 55.2 5.8 1.4 26.6 5.9 44.6
DHA Hoa An Stone 10.7 4.7 (22.3) 7.6 1.8 25.5 3.8 20.4
Source: IBES, Thomson Financial DataStream
� Market Volumes Healthiest In The Unlisted Segment
Thin market volumes are currently the major obstacle to broader institutional involvement in this equity market. The listed equity market only consists of thirty five companies which are shown in the full table at the back of this section.
For now, there continues to be much greater volume in the pre-listed OTC market. This consists of more than 2,000 mostly private companies and total daily volumes are estimated to be in the range of US$5m-US$6m. However, transparency in this unregulated area is low. Indicative prices are published in the press, and some of the local brokers will, selectively, provide quotes. In July, 2005, the OTC market was taken online with the launch of www.oma.com.vn which allows buyers and sellers to negotiate without reference to Vietstock, the Vietnam Stock Market news and information service. This service is currently only available in Vietnamese.
Ultimately, however, the transaction price is determined by an opaque agreement (by international standards, at least) between the specific buyers and sellers, and this can take place anywhere, at anytime. Think of this as the Starbucks trade – terms and conditions can be settled in local coffee shops and simply reported to the company registrar as the pile of certificates is re-registered to the buyer. As for brokered deals, commission rates can be extremely high – ranging from anything between 5% and 20%.
It is only in the last twenty four months that the number of listed companies has exceeded the number of registered brokers, with the largest including Bao Viet Securities and Saigon Securities. The number of institutional buy side participants is equally limited to a handful of funds, most of which have only come into
Vietnam’s Market Cap to GDP Ratio Is Targeted To Grow To 15% By 2010
0%
100%
200%
300%
400%
500%
600%
HK
Singapore
Malaysia
Taiwan
Philippines
Thailand
India
Korea
Indonesia
China
Vietnam
(%)
Mkt Cap to GDP ratio (%) Average Source: CEIC
The OTC market is 6x-7x more
liquid than the listed market,
but pricing can be opaque

Asian Insights – 2 February 2006
8 Refer to important disclosures on page 52.
existence in the past five years, or are onshore arms of international insurance companies. Some of the more successful of the stand alone funds include PXP and Mekong Capital, whilst the longest track records reside with Dragon Capital and Vinafund.
There is no national pension fund to speak of. Domestic retail interest is growing rapidly, however. Although the absolute number of retail accounts is still reasonably modest at 40,000, new accounts are expanding at a rate of 30% to 40% per annum.
� Regulatory Changes Are Happening At A Reasonable Pace
To an extent the regulations governing the equity markets are still playing catch up with the rapid pace of development amongst the traded securities. Public companies already have to release both quarterly results as well as monthly revenues. Our visit to the Securities Stock Commission (SSC) highlighted that the most important piece of legislation on the horizon is the new Securities Law which should be in force by January, 2007. This seeks to lay out formal standards of disclosure and governance for all public companies – whether they trade OTC or on the formal exchanges in HCMC or Hanoi.
Further details can be found at www.ssc.gov.vn
Company meetings quickly highlight the low levels of disclosure by the majority of management. Much of this is historical baggage, of course. The majority of companies did not have bank accounts for the fear that these would reveal revenues that attracted the attention of the tax authorities. Only in the last five years has this begun to change – in part driven the developments in the banking system that we discuss later in this report and in part by the simplification of tax codes and the introduction of a 10% VAT rate.
� Alternative Routes To Equity Exposure
More flexible investors may look for alternative routes to gain equity exposure. For the banking sector this has taken the form of convertible loans, thus far issued by the likes of Maritime Bank and VP Bank. Voting share structures are also flexible enough that control can be exerted without holding a majority stake.
� IPOs To Watch Out For
Although there is a fairly constant stream of IPO’s the majority of these are very small scale. To list the SSC only requires that companies have a paid in capital of VND5bn and to have registered a profit for the past two years – for state owned enterprises this requirement drops to a single year. The other major requirement is that 20% of the shares are held by outside investors.
Amongst the most interesting in the next twelve months are likely to be those that add meaningful scale to the overall index. According to the largest local brokers, Saigon Securities and Bao Viet these will include Sacom Bank (probably mid-2006), Vietcom Bank (2H06), VNPT (the mobile operator) also in 2007, together with PetroVietnam, Vina Re and perhaps one of the power companies.
� And Here Come The Japanese
Japan’s involvement in Vietnam does not stop at FDI (for which it is the single largest source, see Economic Section), attention is also turning to indirect investment. On-line broker service Babu.com has teamed up with one of the local brokerage companies to provide direct equity access to the Vietnamese market for retail investors in Japan.
It is also interesting to note that amongst the current round of capital raising being done by the local fund management companies, Dragon Capital is, for the first time, having a public offering for retail investors in Japan.
With only 40,000 retail
accounts currently set up there
is plenty of growth for a
population of close to 83m
The new Securities Law should
improve corporate disclosure
and accountability
Private companies need two
years of profits, SoEs only a
single year before they can IPO
The risk appetite of Japanese
retail investors is about to be
unleashed on Vietnam as well

Asian Insights – 2 February 2006
Refer to important disclosures on page 52. 9
� Not In The Benchmark Indices, Yet
Vietnam is not currently included in any of the regional benchmarks constructed by either MSCI or FTSE. The combination of limited market capitalization as well as free float may well delay the likelihood of this for another couple of years, at the least. In the meantime the main determinant will be the pace of privatization that the government manages to keep up. The supply of IPO’s such as Sacombank, Vietcombank, Vinaphone, Vietel and the downstream oil companies will be critical in delivering critical mass to this index.
Debt Is Government Related
The credit market is relatively more developed, but is still small in scale compared to others in the region. According to HSBC Custodial Services there are more than 220 government bonds outstanding with a value of circa US$2,500m. However, there is currently no domestic credit rating service available to facilitate the corporate debt market.
In September 2005, Vietnam made the headlines in the credit markets with the launch of the first sovereign bond deal since the Brady issues of the late 1990’s. The USS$750m 10-year issue was extremely well bid, finally pricing at 256bps over 10-year Treasuries, for a yield of 7.125% - at the time between 60bps and 90bps tighter than comparable issues for Indonesia and the Philippines. Since then the issue has traded strongly – see the chart on the right.
The other paper in issue comes from city governments (HCMC and Hanoi) as well as the Vietcom Bank convertible bond. Given the profound infrastructure requirements faced by the economy it seems likely that the pace of sovereign issuance will pick up from this modest base.
Bond Yield Comparisons – Vietnam, Indonesia and the Philippines
4.0
5.0
6.0
7.0
8.0
9.0
10.0
May-03 Nov-03 May-04 Nov-04 May-05 Nov-05
(%)
Vietnam Bond Yield Par Indonesia Yield 14 Philippines Yield 08 Source: Merrill Lynch Asia Pacific Equity Strategy Group

Asian Insights – 2 February 2006
10 Refer to important disclosures on page 52.
Government Policy And Politics
Government policies currently revolve around several key areas : (1) the
development of the private sector (2) attracting FDI (3) the privatization of
state-owned companies, (4) membership of WTO and (5) infrastructure
development. In combination these will both act as a driver of growth but
also provide alternative avenues of capital raising as the listed market gains
greater breadth and depth.
The Party Congress, which will set the road map for the next five year plan
(2006-2010) will take place in the first half of April, 2006. As such we would
not expect to see any particularly important new initiatives take place over
the next few months. However, with the Cabinet re-shuffle expected to elevate
more reform minded officials to key decision posts, the second half of the year
will be very interesting to watch.
Development of the SME and Medium Sized Enterprise sector
The steadily growing foreign direct investment (FDI) sector
50%39%
25%
25%
25%36%
1995 2003
3.2
6.4
8.8
10.811.5
13.1
14.4
15.6
18.3
408
795
1,153
1,438
1,749
2,138
2,688
3,490
4,238
1995 1996 1997 1998 1999 2000 2001 2002 2003
0
1000
2000
3000
4000
5000
Cumulated disbursed investment capital
(VND Billion)
Cumulated number of foreign invested
companies100%= VND 103,375 billion VND 302,990 billion
Foreign invested
Non-State owned
State-owned
Structure of industrial output by ownership
Foreign direct investments have been flowing continuously into Vietnam even after the 1997
Asian crisis
As a result, foreign-invested firms are steadily taking away the lion share in industrial output from
the SOEs in the past 10 years
50%39%
25%
25%
25%36%
1995 2003
3.2
6.4
8.8
10.811.5
13.1
14.4
15.6
18.3
408
795
1,153
1,438
1,749
2,138
2,688
3,490
4,238
0.0
2.0
4.0
6.0
8.0
10.0
12.0
14.0
16.0
18.0
20.0
1995 1996 1997 1998 1999 2000 2001 2002 2003
0
1000
2000
3000
4000
5000
Cumulated disbursed investment capital
(VND Billion)
Cumulated number of foreign invested
companies100%= VND 103,375 billion VND 302,990 billion
Foreign invested
Non-State owned
State-owned
Structure of industrial output by ownership
Foreign direct investments have been flowing continuously into Vietnam even after the 1997
Asian crisis
As a result, foreign-invested firms are steadily taking away the lion share in industrial output from
the SOEs in the past 10 years
50%39%
25%
25%
25%36%
1995 2003
3.2
6.4
8.8
10.811.5
13.1
14.4
15.6
18.3
408
795
1,153
1,438
1,749
2,138
2,688
3,490
4,238
0.0
2.0
4.0
6.0
8.0
10.0
12.0
14.0
16.0
18.0
20.0
1995 1996 1997 1998 1999 2000 2001 2002 2003
0
1000
2000
3000
4000
5000
Cumulated disbursed investment capital
(VND Billion)
Cumulated number of foreign invested
companies100%= VND 103,375 billion VND 302,990 billion
Foreign invested
Non-State owned
State-owned
Structure of industrial output by ownership
Foreign direct investments have been flowing continuously into Vietnam even after the 1997
Asian crisis
As a result, foreign-invested firms are steadily taking away the lion share in industrial output from
the SOEs in the past 10 years
Source: ADB, World Bank, Vietnam Pioneer Partners
The establishment of the Enterprise Law in 2000 set the stage for the rapid growth that has occurred in the private sector over the last five years. From less than 100 private companies at the time there are now more than 200,000 and the number continues to expand. Many of these are small scale and essentially family run businesses, in part because of the difficulty in accessing loan capital from the banks.
However, as Alistair Scarff, our Regional Bank Research Analyst, notes this is beginning to change, especially as foreign banks are taking stakes and starting the process of upgrading credit assessment systems as well as credit products. The introduction of a unified tax rate (28%) has also helped to improve both the transparency for companies as well as tax collections for the government.
Over the past five years the
number of private companies
has expanded from 100 to an
estimated 200,000

Asian Insights – 2 February 2006
Refer to important disclosures on page 52. 11
Privatisation Program – Needs More Scale
The Vietnamese have studied China’s development model carefully. Foreign appetite for investment into areas such as banking is welcomed under the auspices of providing technical assistance to the domestic entity. In many cases this involves a whole scale upgrade of everything from database IT to credit risk assessment procedures, whilst at the same time driving the launch of new products. Whilst willing to sell some SoEs completely the government has a long list of strategic industries where it will retain a 51% controlling stake. Some of the more obvious include areas such as electricity production, telecomm infrastructure, mineral exploration and water supply. Less obvious are high quality cement production, large scale milk and beer production, labour export services and agricultural equipment.
The privatization process itself begins with ‘equitization’, effectively an incorporation process that creates shares that are all held by the State. After this the true privatization process begins, usually with a limited public offering and an allocation of shares to employees that is typically anything between 20%-30% of total shares in issue. In the first instance these trade on the OTC market ahead of the actual IPO which takes place by Dutch-style auction. To date close to 2,000 companies have been taken down this route (about a third of the total SoEs) but the size of these individual companies has been relatively modest. The State Securities Commission (SSC) calculates that these SoEs only account for 8% of the total invested capital of all registered enterprises.
In tandem with this there have been important revisions to foreign ownership restrictions that are reminiscent of what we have seen across markets such as Thailand and Taiwan over the past decade. Private companies can be 100% foreign owned but for listed companies this falls to 49% - prior to October, 2005 it was even lower at 30%.
The new Enterprise Law is due to come into effect from July, 2006, and this will require that all state owned enterprises are incorporated within four years. Our sense is that this will set the stage for a sustained privatization stream over the next couple of years. At the same time the government is also setting up a Temasek-type asset holding company to accommodate all the residual holdings.
An important element of these IPO’s is the allocation of stock to management and employees as the joint stock entity is created – which can be as much as 30% of the total shares in issue. This provides much of the liquidity that passes through the OTC market and provides a potential source of stock for institutional investors to access.
Private sector has been blossoming in both number and size
...and driving the development of the overall economy
Source: ADB, World Bank, Vietnam Pioneer Partners Source: ADB, World Bank, Vietnam Pioneer Partners
Vietnam has adapted some
important lessons from China.
FDI is actively encouraged to
boost the development and
upgrading of domestic
industries.
2,000 state companies have
been equitized, but the largest
are yet to come
Foreign ownership limits have
recently been increased to 49%
8.5%
62.1%
55.0%
38.4%
16.2%
10.0%
87.8%
16.5%
27.0%
47.9%
79.9%
89.1%
3.7%
21.4%
18.0%
13.8%
3.9%0.9%
Number of companies Assets size at current
prices
Investment at current
prices
GDP at current prices Retail sales at current
prices
Employment
Foreign
invested
Non-state
owned
State-
owned
100%= 62.908 VND 1,440,738 bio VND 193,099 bio VND 535,762 bio VND 280,884 bio 37,676,000

Asian Insights – 2 February 2006
12 Refer to important disclosures on page 52.
WTO Ahead
WTO is serving as a major driver of administrative reform. Negotiations for WTO membership are undergoing some renewed momentum. The U.S. team that arrived during our visit appeared keen to get the agreements signed in the next couple of months, making membership by the end of 2007 a fairly credible possibility. Assuming that the other outstanding bilateral agreements are not delayed it could actually be sooner.
As we have seen elsewhere around Asia in the past decade, areas such as telecoms and financial services will be amongst those to face the most intense competition as the domestic market is opened up. However, there is likely to be resistance from areas dominated by the SME sector, such as distribution and retailing, due to the relative lack of sophistication and scale. However, for some it will present the opportunity to capitalize on the expansion of the global supply chain into Vietnam.
Infrastructure Development
Vietnam badly needs to upgrade its infrastructure across many of the most obvious areas. Energy is probably the most important area that needs to be addressed. Power needs are rising at 15% p.a. and the huge reliance on hydro (56% of total generation capacity) leaves Vietnam vulnerable to droughts. Sixty new plants are planned by 2020 to meet the rate of domestic demand growth. For investors with an appetite for strategic, long term projects, the power sector in Vietnam is, from our perspective, worth a very close look. Electricity of Vietnam (EVN) generates 95% of the countries power and faced with such huge investment requirements has begun selling off stakes in some facilities, starting with the 25% sales of Pha Lai, a 600-megawatt thermal power plant in November, 2005.
Furthermore, there is no domestic refining capacity until the Dung Quat Refinery comes on line at 2008 at the earliest, and even then only 60% of current needs will be met by this facility. This leaves Vietnam as a net exporter of crude oil and gas but a net importer of fuel oil and gasoline for the foreseeable future.
Transportation is another bottleneck to growth. Ports are running at full capacity and three large scale deepwater ports are under construction south of HCMC. Only a year ago, cars took up one lane of the highways, now it is three. Neither HCMC nor Hanoi suffer from the traffic congestion found in other major cities such as Mumbai, Jakarta or Bangkok, but at the current rate of growth in car ownership this can only be a matter of time.
Politics & The Military
As with China, the momentum seen in the economy is not being accompanied by any discernable pace of political reform for Vietnam. To be fair, there does not appear to be a strong push for democracy either. The broad population seems more intent on taking advantage of the wealth opportunities that are coming as a result of the economic reform process. As such the muted noises heard from the middle class or overseas nationals (Viet Kieu) does not present an obvious destabilizing factor likely to impact risk premiums. Our sense is that the Vietnamese people want accountability before democracy.
However, the Party Congress takes place in April, setting the administrative agenda for 2006-2010 as well as heralding a cabinet re-shuffle which will see Prime Minister Khan Van Khai replaced and several other key posts likely changed. Investors will be watching carefully to gauge how this will impact the reform process.
Corruption is one of the main complaints of the business community. However the sheer scale of vested interests will make the process of reform a long and slow one, we believe. In a recent IAB survey, one-third of officials and civil servants
WTO entry should be a reality
within eighteen months,
perhaps sooner
Vietnam’s infrastructure needs
are considerable. Energy is a
key area that needs to be
addressed if growth potential is
not to be hampered
No major policy changes are
expected ahead of the Party
Congress in April. Watch for
key position changes and an
acceleration in momentum in
the latter half of the year

Asian Insights – 2 February 2006
Refer to important disclosures on page 52. 13
were willing to take bribes, and 56% said that their superiors were involved in corruption.
The high level of military involvement in senior government positions also highlights the relatively modest level of international experience that investors are used to seeing amongst senior decision makers in the region. As with Pakistan, the military also occupies a large position in the economy. In the long run this runs the risk of driving down returns for the private sector because entities run by the military will frequently have a lower cost of capital or could be given preferential terms on which to compete. As such it will be interesting to watch how the role of the military evolves over the next decade. In other economies around the region it has been tough to balance vested interests with creating a level playing field – especially where the military has significant political influence.
Industrial Structure – A Growing Export Engine
Vietnam’s key industries are oil and gas, textiles, banks, consumer goods, telcos, mining/resources and tourism. Amongst the fastest growing areas has been textiles which now account for 19% of total exports. These received a major boost from the bi-lateral trade agreements already signed with the U.S. in 2001. As a result export growth has been extremely robust over the past five years, as the bar charts highlight on the left. The key product areas behind this growth include crude oil, seafood, textiles and footwear.
The large number of SMEs operating in the Vietnamese economy lends it considerable flexibility. Most notably the ability to handle much smaller scale orders than their Chinese competitors whilst at the same time remaining price competitive.
Major Exports By Destination
Country (US$m) 2003 2004 Oct-05 Nov-05 (%)
EU 3,783 4,915 443 488 19.9
USA 3,939 4,992 516 482 19.7
Japan 2,909 3,502 358 439 17.9
China 1,748 2,735 275 315 12.9
Australia 1,420 1,822 189 249 10.1
Singapore 1,024 1,370 209 137 5.6
Germany 855 1,066 82 104 4.3
Indonesia 467 447 45 71 2.9
UK 755 1,011 80 86 3.5
Taiwan 749 906 85 79 3.2
Total 17,649 22,766 2,282 2,450 100.0
Source: CEIC
Property – Competition From Equity Opportunities
The lack of development in the capital markets has resulted in property being the asset of choice for domestic investors – at least until the last twelve months. Our sense is that the growth in the equity market will continue to exert a competitive influence and draw speculative capital away from physical assets.
According to some unofficial estimates, property prices in Hanoi have risen tenfold since 1998. The absence of capital gains tax on un-built property means that apartments can be traded 6x-7x between initial purchase and actual delivery of the keys to the owner. However, prices are not extreme by Asian standards. Prime residential property in central Hanoi and Ho Chi Minh City is priced at between US$180-US$200 per sq ft, broadly equivalent to Metro Manila whilst Bangkok is still close to double that level.
The high level of involvement
of the military in the economy
is a long term negative for
private sector returns
Import & Export Growth
0% 5% 10% 15% 20% 25% 30% 35%
2001
2002
2003
2004
2005
Exports Growth (%) Imports Growth (%) Source: CEIC
The absence of capital gains on
un-finished property has fueled
buying activity

Asian Insights – 2 February 2006
14 Refer to important disclosures on page 52.
Our contacts at the Real Estate Finance Corporation (Refico) report that monthly office rents in HCMC are currently in the region of US$3 per sq ft per month – double what it was in 2003 but supply remains very tight and they are confident of achieving US$4 within three years. Predictably, their activities are also expanding, to now include shopping malls, where there is considerable pent up demand, as well as residential units. Commercial rental yields are still fairly healthy at between 12% and 15%.
And yet, whilst the magnitude of these price rises are reminiscent of some of the bubbles that have brewed elsewhere around Asia, the relative lack of leverage amongst the population probably acts as a circuit breaker to significant downside from these elevated levels. Mortgages account for less than 3% of outstanding loans in the banking system. They are conservative in structure –typically seven to ten years in duration and banks usually only lend up to 60% of the stated value. This falls far short of the bubbles seen in economies such as Thailand and Hong Kong over the past decade.
Commercial yields
are 12%-15%
But mortgages only account for
less than 3% of the loans in the
banking system, and loan-value
rations are conservative

Asian Insights – 2 February 2006
Refer to important disclosures on page 52. 15
Economic Drivers – Investment & Consumption In economic terms Vietnam has recently undergone important changes. Over
the past six years GDP growth has averaged 7.4% (second only to China) and
for neighboring Thailand this is beginning to emerge as a driver to its own
export profile. In Vietnam confidence is high at both a corporate as well as
individual level, government policy is supportive and the absence of ethnic
problems is helping tourism to boom. Poverty has been reduced to less than
20% of the population and literacy rates are above 96%. The demographic
profile is extremely positive as half of the population is under the age of 25.
The manufacturing sector is now growing at close to 11% whilst the services
sector is also picking up strongly, driven by areas such as retail and tourism.
The weakest spot in the economy has been agriculture, which grew at around
4% last year as output was constrained by drought and the adverse impact of
avian flu. However, the growth in both investment and consumption has
more than taken up the slack. From our perspective these are likely to be the
strongest drivers going forward.
Key Historic Economic Statistics For Vietnam
2000 2001 2002 2003 2004 2005
GDP Growth (%) 6.8 6.9 7.1 7.3 7.7 8.4
Trade Balance (US$mn) (1,154.0) (1,189.0) (3,027.0) (5,115.0) (5,520.0) (4,648)
CPI (%) 4.4 3.1 7.8 8.3
FDI (US$mn) 2,192 1,333 1,513 2,084 3,896
Source: CEIC
Investment – FDI Accelerating, Domestic Too
In 2005 foreign direct investment is estimated to have reached US$5bn – representing an eight year high (see chart on the left). In many cases we are seeing Vietnam attract capital as a complementary production base to China as manufacturers seek to diversify supply chains. For the many overseas development agencies in Vietnam this also represents something of a success story and there is active investment activity from the likes of the ADB and IFC. In addition, Vietnam has yet to experience anything like the wage inflation currently occurring in the major manufacturing regions of China, and the workforce is expanding by 1.4m people every year.
Minimum wages are still very low. For government employees it is just US$19 per month, foreign invested enterprises (FIEs) pay closer to US$60 per month. But even the Prime Minister only gets US$240 per month. From our perspective, this goes a long way to explaining both the appetite for tax evasion as well as the wide-scale corruption that is reported.
The Japanese have been amongst the largest investors, with US$590m committed last year and a cumulative total of US$4.5bn (close to 17% of the total). Other key sources have been Korea, Hong Kong, Taiwan and Singapore. The recent MoA signed with Intel, for an estimated commitment of more than US$600m, would be the single largest technology investment in the country.
In combination with domestic capex this has helped to push the overall ratio of investment to GDP to over 35%. As the chart on the left highlights, this is the second highest ratio that we find across the whole of non-Japan Asia.
Vietnam’s Foreign Direct Investment Has Been Steadily Picking Up
0
100
200
300
400
500
600
700
800
900
Jul-01 Jan-02 Jul-02 Jan-03 Jul-03 Jan-04 Jul-04 Jan-05 Jul-05
(US$mn)
-100
-50
0
50
100
150
200
250
300
YoY (%)
FDI (US$mn) FDI YoY (%) (RHS)
Source: CEIC
Investment to GDP (%)
0.0
5.0
10.0
15.0
20.0
25.0
30.0
35.0
40.0
45.0
50.0
Pak
ista
n
Phi
lippi
nes
Mal
aysi
a
Indo
nesi
a
Tai
wan
Hon
g K
ong
Sin
gapo
re
Indi
a
Tha
iland
Sri
Lank
a
Kor
ea
Vie
tnam
Chi
na
Fixed Capital Formationas % of GDP
0.0
5.0
10.0
15.0
20.0
25.0
30.0
35.0
40.0
45.0
50.0
Pak
ista
n
Phi
lippi
nes
Mal
aysi
a
Indo
nesi
a
Tai
wan
Hon
g K
ong
Sin
gapo
re
Indi
a
Tha
iland
Sri
Lank
a
Kor
ea
Vie
tnam
Chi
na
Fixed Capital Formationas % of GDP
Source: CEIC

Asian Insights – 2 February 2006
16 Refer to important disclosures on page 52.
Consumption Is Getting More Conspicuous
Consumption is clearly on the rise in Vietnam. Last year retail sales alone rose by more than 20% YoY, supported by selective increases in minimum wages – especially those at foreign invested enterprises (FIEs). Demographics also play a powerful role – more than half of the population is under the age of 25 making this one of the youngest populations in Asia.
Inward remittances are another important source of income. Official sources account for annual flows of US$4bn whilst, according to our friends in the local banks, a similar amount probably passes through unofficial channels. This is easily comparable to the annual flows into either Pakistan or the Philippines. The retail banking sector has only really begun to develop in the past four years. Overall deposit growth has averaged between 20% and 30% since 2002 – three times the rate of GDP growth. Although growth rates are unusually high they at least partially underscore the pace of wealth creation, and ultimately this will set the stage for an explosion in credit products for Vietnam’s wave of new consumers. The cars on the streets say it all. Porsche, Mercedes, Hummer, BMW and even a Maybach have all appeared in the past twelve months. The sources of this conspicuous wealth are probably a combination of the property cycle, the relaxation of investment rules, the shift in policy to encourage private enterprise and the flow of overseas remittances.
� Plane Spotting
Tourism is rapidly become an important source of growth in the economy. With a population that is almost 95% ethnic Vietnamese (over 80% have no declared religion) Vietnam has none of the social conflicts that have arisen in places such as Indonesia, Thailand or India. Add to that almost 3,500kms of coastline, some of the best value for money accommodation in South East Asia and it is easy to understand why tourist arrivals have now reached 2.3m a year, about twice the absolute number for the Philippines. Furthermore, tourist spending accounts for 9% of GDP – which is 50% higher than for Thailand. The single largest group of visitors comes from Japan, which also helps to explain the level of retail investor interest in Vietnam.
The catalyst for an even sharper increase (in both spending and, ultimately, the price of beach property) would likely be greater access for the region’s airlines. So far, amongst the low cost carriers, only Tiger and Air Asia appear on the arrival boards of the major cities. However, as Paul Dewberry, our regional airlines analyst notes, a partial open skies agreement between capital cities in the ASEAN region is due to come into effect by the end of 2008. This would likely set the stage for a sharp increase in intra-regional access that would benefit less developed destinations such as Vietnam.
Retail Sales Growth YoY (%)
5%
10%
15%
20%
25%
30%
35%
40%
1994 1995 1996 1997 1998 1999 2000 2001 2002 2003 2004 2005
Retail Sales Growth YoY (%)
Source: CEIC
GDP per capital (US$)
2000 2002 2004
Australia 25,617 27,972 30,682
China 856.2 992.4 1,486
Hong Kong 25,356 24,180 23,608
India 449 485 622
Indonesia 736 865 1,191
Japan 37,512 31,280 36,596
Korea 10,882 11,468 14,151
Malaysia 3,876 3,880 4,646
Philippines 952 926 1,010
Singapore 23,040 21,210 24,740
Taiwan 14,457 13,130 13,451
Thailand 1,966 1,998 2,521
Vietnam 404 440 548
Source: CEIC
Tourism is already a major
contributor to GDP (9%) and
improved access to low-cost
carriers will only add to the
2.3m visitors that Vietnam
already receives

Asian Insights – 2 February 2006
Refer to important disclosures on page 52. 17
Potential Economic Stress Points
� Under-Developed Power Sector
Power is a major area of concern. Demand is growing at 14%-15% p.a. and power black outs are a regular occurrence, even in Ho Chi Minh’s business district. Whilst there is a growing acceptance of the BOT model, decision making appears to still be slow and re-tendering of bids is a common feature of the process. Utilization rates at some of the hydro facilities fell as low as 20% in 2005 due to constrained water supply suggesting that more stable capacity is going to be needed if Vietnam is to (quite literally) fuel its growth.
GDP By Sector
1999 2000 2001 2002 2003 2004
GDP Growth (%) 4.8 6.8 6.9 7.1 7.3 7.7
Agriculture 1.2 1.1 0.7 0.9 0.7 0.8
Industry & construction 2.6 3.5 3.7 3.5 3.9 3.9
Services 1.0 2.2 2.5 2.7 2.7 3.0
GDP per capita ($) 372 403.6 415.4 440.1 483.1 547.7
GDP at current price ($mn) 28,567 31,336 32,686 35,085 38,973 45,188
Agriculture * 7,266 7,688 7,596 8,067 8,496 9,832
% share of GDP 25% 25% 23% 23% 22% 22%
% growth 6% -1% 6% 5% 16%
Industry & construction 9,854 11,510 12,463 13,524 15,579 18,116
% share of GDP 34% 37% 38% 39% 40% 40%
% growth 17% 8% 9% 15% 16%
Services ^ 11,447 12,138 12,626 13,494 14,898 17,241
% share of GDP 40% 39% 39% 38% 38% 38%
% growth 6% 4% 7% 10% 16%
Source: CEIC * Total includes agriculture, forestry and fisheries ^ incl real estate, transport, hotels and tourism
� Government Finances
The budget deficit is reasonably high at 4% of GDP for a reason common to many emerging economies – poor tax collection. However, with the 10% VAT rate in place, increased transparency being forced on companies and 82% of state owned companies (by number, anyway) now being incorporated, the levels of corporate collection are improving.
Demographic & Other Statistics For Vietnam
1999 2000 2001 2002 2003 2004
Population (mn) 76.5 77.6 78.7 79.7 80.9 82.5
Population density (people/sq km) 231.2 234.4 237.7 241.5 243.7 249.3
Literacy rate (%) 90.0 94.0 95.0 96.0 96.0 96.0
Unemployment rate (%) 7.4 6.4 6.3 6.0 5.8 5.6
in Hanoi 10.3 8.0 7.4 7.1 6.8 6.7
in HCMC 7.0 6.5 6.0 6.7 6.6 6.5
Universities & colleges 131.0 178.0 191.0 202.0 214.0 214.0
Telephones (mn) 2.4 2.9 3.8 5.6 8.2 8.8
Telephones per 100 people 3.1 3.5 4.2 8.5 11.0
Human development index
(UNDP ranking out of 174 countries) 110.0 108.0 110.0 109.0 109.0 112.0
Source: Vietnam Economic Times
Power demand is growing at
almost 15% p.a., the high
reliance on hydro-generation is
a problem
The budget deficit of 4% should
be stabilized by better
tax collections

Asian Insights – 2 February 2006
18 Refer to important disclosures on page 52.
The Bank Sector
Vietnam’s credit system is only now beginning to emerge from the legacy of
policy and directed lending. Only an estimated 5% of the population use
banking services. The opportunity for the development of true retail banking
is considerable and foreign banks are beginning to position for this by taking
direct stakes. The realization of this potential will be determined by the path
of reform. Future bank IPO’s will be key to developing the embryonic equity
market, led by Vietcombank, ACB and Sacombank.
Mapping Out the Financial Landscape
� State Bank of Vietnam (Central Bank)
The first wave of financial sector reform and liberalization in Vietnam occurred in 1988-90. One of the most important developments that emerged was the creation of a two-tiered banking system consisting of the State Bank of Vietnam (SBV) as the central bank and supervisory institution (tier 1) and an operating system (tier 2). Similar to central banks in other markets, the SBV is responsible for monetary policy and regulation of the banking system. While legislation is in place attesting to the independence of the central bank from political influence, according to many multi-national agencies (i.e. World Bank, IMF, etc.) the central bank has little if any independence, with the general view being that the SBV is politically and operationally dependent on the support from government agencies.
Distribution of Vietnam Bank Sector Assets
Foreign Banks
10%
Local Joint
Stock Banks
20%
State Owned
Commerical
Banks
70%
Source: Various sources
� Policy Lending & State-Owned Commercial Banks
Similar to the situation in China, there are four large state-owned commercial banks (SOCBs) in Vietnam – the Foreign Trade Bank of Vietnam (Vietcombank); the Vietnam Bank for Agriculture and Rural Development (VBARD); the Industry and Commerce Bank of Vietnam (Incombank); and the Vietnamese Bank for Investment and Development (VBID). Prior to the reforms of 1988-90, the SOCBs were departments of the SBV, and thus primary vehicles of government policy lending decisions. These institutions dominate the banking space in Vietnam (estimate 70-75% market share of bank sector assets), with over 1,200 branches in aggregate across the country. As the names suggest, these four banks were focused on specific sectors and segments of the economy. Whilst these sector constraints have been abolished and directed lending reined in, the banks remain key players within their legacy business segments – though we believe this is also by design given the government and the party’s desire to retain control.
Central bank is widely
considered to be not
independent of government and
party pressures
SOCBs dominate the banking
space in Vietnam through a
network of over 1,200 branches
The Vietnamese banking sector
is dominated by four state-
owned commercial banks.
These banks were principally
policy lending banks

Asian Insights – 2 February 2006
Refer to important disclosures on page 52. 19
Historically the state-owned bank sector was used as an instrument of public policy and to promote social and political objectives as opposed to commercial objectives. While the four large SOCBs slowly began evolving from specialized policy lending vehicles to more commercially orientated financial intermediaries over the last 10-15 years, the legacy of policy lending has burdened them with high levels of non-performing loans. Although official numbers suggest a system NPL ratio in the mid-teens, it is widely believed that the level is closer to 30%, with the vast majority of the bad loans concentrated in the SOCBs.
In addition to the four main policy lenders, the Vietnam Bank for Social Policies (VBSP), previously know as the Vietnam Bank for the Poor, was established to provide loans to poor households especially in rural areas. The rural sector is also serviced by the People’s Credit Funds (PCFs); these were established in the early 1990s by the SBV following the collapse of a raft of rural credit co-operatives. There is approximately 1,000 PCFs now operating in Vietnam, and controlling around 1-2% of total bank sector loans & deposits.
� Joint-Stock Banks – Comparative ‘New Kids’ on the Block
Another important development that accompanied the initial liberalization of the financial sector was the establishment of joint-stock commercial banks (JSBs), of which there are 35-40 at present. JSBs offer the full suite of banking product and services to corporate and retail customers. The ownership structure of JSBs is mixed ranging from purely private organizations to being jointly owned by state owned enterprises (SOEs), private groups and individuals.
Structure of Vietnam Banking Sector
1990 1994 1999
State Owned Commercial Banks 4 4 5
Joint Stock Banks 0 36 48
Joint Venture Banks 0 3 4
Foreign Bank Branches & Rep. Offices 0 41 103
Source: World Bank
� Foreign Banks & Joint Venture Banks – Hamstrung by restrictions
The current legal and regulatory framework in Vietnam is heavily biased towards the local banks and financial institutions, with significant restrictions and limitations on market access, network expansion and scope of operations of foreign banks. The most obvious of these restrictions is that foreign banks cannot establish local subsidiaries, and thus most operate through branches and representative offices. According to recent press reports, there are presently 27 branches of foreign banks and four joint-venture banks operating in Vietnam (there are also >75 representative offices).
The Vietnamese authorities are understood to be working towards lifting the restrictions on foreign banks operating in Vietnam in order to comply with the requirements of the 2001 US-Vietnamese Bilateral Trade Agreement (BTA) and more importantly, the requirements for entry into the WTO. One area that the amendments to the existing legislation are being considered is to allow foreign banks to establish subsidiaries with the same legal status of the Vietnamese banks. However, no timeframe has been given as to when any or all of the proposed amendments will be accepted.
The issue of foreign ownership of local banks is expected to be one of the most hard fought. At present, the limit on individual share ownership by foreign banks is 10%, with a maximum of 30% for all foreign investors. With a number of recent high profile investments by foreign banks in the past 12mths, we would expect this topic to remain at the forefront of discussions.
The policy lending legacy of the
SOCBs is the key reason behind
their high NPL levels
VBSP provides loans to poor
and low income households,
especially in rural areas. Given
the highly subsidized nature of
the loans extended, it is
generally considered to be
insolvent
There are roughly 35-40 joint
stock banks operating
in Vietnam
The bank sector ‘playing field’
is heavily biased in favor of
local banks, with foreign banks
still limited to operating
as branches rather
than subsidiaries
The US-Vietnamese BTA and
the WTO are serving as positive
catalysts for accelerating the
pace of reform in the
banking sector
Foreign ownership limits are
10% for individual investors
and 30% in aggregate

Asian Insights – 2 February 2006
20 Refer to important disclosures on page 52.
Recent Investments by Foreign banks in Local JSBs
Date Acquirer Target Stake Size Consideration TAA*
Jun-05 StanChart ACB 8.56% US$22mn Yes
Aug-05 ANZ Sacombank 10.00% US$27mn Yes
Jan-06 HSBC Techcombank 10.00% US$17.3mn Yes
*TAA – Technical Assistance Agreement Source: Company reports
� Postal Savings Service – Mobilizing the Rural Deposit Base
One interesting aspect of the Vietnamese banking landscape is that although there are a number of state commercial and policy banks servicing the needs of the rural population (especially the low income households), these services are almost exclusively for loans only with no savings products offered. It is in part for this reason that the Vietnam Postal Savings Company (VPSC) was established in 1999 (under the authority of Vietnam Post and Telecom). The primary function of the VPSC is to provide basic savings products to the aforementioned market segments. Another key function was that it provided the means through which the government could mobilize the rural savings deposit base for development investments.
Review of Recent Banking Reforms
After over a decade of financial sector reforms, the Vietnamese banking sector is perceived as weak and inefficient by global standards; legislative issues are ambiguous and regulations poorly enforced; and the bank sector still suffers from a substantial amount of non-performing loans. However, on a more positive note, recent developments suggest that the reform process may be finally getting back on schedule. In this section we have taken a brief look at some key areas of reform and assess the level of progress made.
� Competition Remains Comparatively Subdued
Compared to other banking markets around the AsiaPac region, the level of competition within the Vietnamese banking sector is relatively low. This situation is largely attributable to the dominance of the four large SOCBs that between them control 75-80% of total bank sector assets (2004). While the growth of the joint-stock banks since the beginning of the 1990s has been rapid, their growth has been constrained by the segmentation of the market – the markets for SOCBs and JSBs are apparently separated in terms of deposits and borrowers. Another factor contributing to the lack of competition amongst financial institutions has been the difficultly in introducing new products and services, with the approval of new products by the central bank (SBV) taking anywhere from 3mth to over a year according to some bank management.
Constraints placed on the level of access and scope of operations of foreign banks has also impeded the level of financial sector competition in our opinion. However, the developments alluded to earlier on these fronts should have a positive impact on the level of competition and bank sector innovation. The recent investments made and technical assistance agreements signed by StanChart, ANZ and HSBC in joint-stock banks in the past 12 months should also accelerate the level of competition in the banking sector – albeit at a comparatively modest pace.
Raft of new investments by
foreign players in
the past 12 months
The VPSC was established to
provide the means to mobilize
the rural savings deposit base
After the initial round of
reforms in 1988-90, bank sector
reform slowed over the past
decade. Recent developments
suggest that the reform
program may be back on track
The dominance of the SOCBs
and slow pace of reform have
kept competition within the
banking sector relatively benign
compared to other AsiaPac
banking markets
Recent investments by foreign
banks in JSBs and reforms
linked to WTO and the US-
Vietnamese BTA should
boost competition

Asian Insights – 2 February 2006
Refer to important disclosures on page 52. 21
One area where reforms designed to improve competition are unlikely to change in the intermediate term is the Vietnamese rural financial sector – a key area given that approximately 80% of the population live in rural areas. As is the case in a number of emerging markets in Asia (ie China, India and Indonesia), SOCBs are the primary provider of financial services to the rural market. The absence of competition to VBARD/VBSP (the main SOCBs operating in the rural sector) in our view is primarily due to the very low profitability of this market as a result of the substantial state subsidies given to these banks to cover their operating and financial costs. In light of quasi-monopoly and razor thin margins of these banks, there is little incentive for innovation or for VBARD/VBSP to improve their performance. One final point worth noting, it is interesting to compare the experiences of the Agricultural Bank of China (ABC) and the VBARD/VBSP in terms of inefficiencies, asset quality and poor profitability, with Bank Rakyat Indonesia (BRI), as the latter is in a substantially stronger financial and operating position.
� De-regulation of Interest Rates – Form Over Function
Whilst the abolishment of government set interest rate ceilings (through the SBV) on lending rates in 2002 was a key milestone for bank sector reform in Vietnam, the changes have not yet flowed through to the banks as interest rates have remained quite inelastic and unresponsive to increased demand. We suspect the lack of movement in lending rates is due to the large SOCBs maintaining their rates at concessional levels. This situation should gradually change over time as the SOCBs become more accountable for their financial, not social or political, performance.
� Asset Quality Remains a Major Issue for the Banks
Resolving legacy and current asset quality problems is one of the major challenges confronting the bank sector in Vietnam. The combination of policy and directed lending by the state owned bank sector and related-party and high-risk lending by the JSBs has resulted in 13% of all outstanding bank loans being non-performing according to the SBV (2001) – given understatement by the banks and the timeliness of the data, we would not be surprised if the current level was closer to 30%. A significant portion of these NPLs were given to SOEs, with many of the loans extended on an unsecured basis.
Progress in the resolution of non-performing loans has been slow but steady according to some industry research papers, with the lack of reform of the SOE sector regularly cited as being one of the major hurdles. While most of the SOCBs have sufficient resources to partially address the problems following the first round of recapitalization (VND10.4trn/US$655mn injection over 2-3yrs starting in 2001), only Vietcombank has begun to implement a detailed restructuring program. There have also been discussions that the large SOCBs may establish specialized asset management companies (similar to the experience in China) to resolve their legacy NPL problems.
Whilst there appears to be modest progress being made with the bank sector’s legacy bad debt problems, the widespread adoption of a broad based credit culture where banks use market principles to assess credit risk does not appear have taken place. Given that most of the credit expansion in recent years has come from the SOCBs where NPLs are already high and credit risk assessment is generally viewed as weak, we would expect new NPL inflows to remain high for some time. On the positive side, the raft of technical assistance agreements signed between JSBs and foreign banks should begin to infuse better standards of credit risk management among the banks.
Arguably the most positive development on the asset quality front in recent years was the announcement by the governor of the SBV (April 2005) for all financial institutions to adopt international standards of loan classification (Decision 493). Interestingly, prior to 1999, loans were not by convention classified as non-performing until they were more than 360 days overdue – further, this referred to overdue installments, rather than principal repayment.
The substantial operating and
financial subsidies provided to
the Vietnam Bank for
Agriculture and Rural
Development (VBARD) make
competition in the rural sector
unpalatable for banks
conscious of the impact
on profitability
Liberalisation of interest rates
was a positive step forward –
now we just need to get the
SOCBs to adopt the
new approach
The combination of policy &
direct lending by the SOCBs
and related party lending by the
JSBs could have pushed the
sector NPL ratio to as high as
30% of total loans
While the SOCBs have been
partially recapitalized, only
Vietcombank has made progress
towards overall restructuring
As the SOCBs continue to be
the major providers of bank
credit, we suspect new NPL
inflows could remain high in
the near term. Significant work
still needs to be done to upgrade
credit risk management
skills at the banks
The new requirement for all
financial institutions to adopt
international standards of loan
classification is a positive step
forward in our view

Asian Insights – 2 February 2006
22 Refer to important disclosures on page 52.
This new requirement encompasses the classification of loans into 5 groups (Normal, Precautionary, Sub-Standard, Doubtful and Estimated Loss) and the use of specified reserving rates (group 1-5, 0%, 5%, 20%, 50% and 100%). Whilst no details are available at this stage as to how the banks’ loan books look under the new classification approach (or how rigorously the requirements are applied), we nonetheless view this as a positive step forward.
� Legal Infrastructure Is Still Developing
Generally speaking, the legal system in Vietnam has not been able to keep up with the pace of economic development. In terms of the banking sector, legal reform is particularly needed with respect to clarifying legal concepts and contractual rights such as ownership and transfer of land-use rights, collateral registration procedures, mortgage laws and title deeds. From our vantagepoint, the main issue for the bank centres on the difficulty that borrowers have in giving and lenders have in enforcing pledges and security. Collection on delinquent and non-performing loans is difficult, and in the case of the state owned enterprises (SOEs) largely untested. That said, given the lack of reform and restructuring within the SOE sector, we suspect that is it unlikely that a defaulting SOE would be forced into bankruptcy anyway.
Collective property ownership and the evolving legal infrastructure make recovery and realisation of security on collateralized loans difficult for both foreign and domestic lenders. The situation for the foreign banks is compounded by the restriction on foreign ownership of land and limitation of ‘land use rights’. Broadly similar to the situation in China, banks in Vietnam are not allowed to seize land from defaulting farmers, making it very difficult to liquidate the collateral.
While the government has recognized private lending as a legal business and given banks the right to seek recourse through the courts to recover their funds, in practice, private lenders rarely go to court to settle disputes. Apart from the perceived ‘borrower bias’ of the courts, our industry contacts suggest that the high recovery costs (ie time, legal costs, and taxes) makes using the courts unappealing and could potentially exacerbate losses on loans.
Reform of the current bank secrecy laws would also be a positive step forward for the banking system, particularly retail banking in our view. As the existing bank secrecy laws stand, it is the credit institution and not the customer that has the right to maintain confidentiality about a customer’s account. Thus the institution can give out such information about the customer if the institution chooses. Moreover, the institution must give out such information upon request of a ‘competent state authority’. Given the lack of definition of ‘competent state authority’, the institution could potentially pass out confidential banking information to hundreds of state agencies at any level (UNDP 19991)
1 “UNDP. Completion of Vietnam’s legal framework for economic development”. 1999. Hanoi, Vietnam, United Nations Development Program, UNDP Discussion Paper 2.
The legal infrastructure in
Vietnam is very weak by global
standards. The difficulties with
enforcing security and
foreclosing on loans is a major
impediment to the development
of the residential
mortgage market
Foreign banks have only
recently being allowed to accept
‘land-use rights’ as collateral
for loans – though enforcement
of this security has
not been tested Seeking recourse via the court
system is time consuming
and costly
Under the current bank secrecy
laws, it is up to the banks as to
whom confidential banking
information could be released

Asian Insights – 2 February 2006
Refer to important disclosures on page 52. 23
The Opportunity for the Banks
AsiaPac Loan Penetration (Loan to GDP, 2005E )
Bank Sector Loans & Deposits
0%
20%
40%
60%
80%
100%
120%
140%
160%
180%
200%
HK TW CN MY SG TH SK VN PH IN ID
0
100
200
300
400
500
600
2002 2003 2004 2005
VND'trn
Deposits
Loans
0
100
200
300
400
500
600
2002 2003 2004 2005
VND'trn
0
100
200
300
400
500
600
2002 2003 2004 2005
VND'trn
Deposits
Loans
Source: CEIC, SBV, Central Banks, Merrill Lynch estimates Source: Dragon Capital
Two comments made during our recent road trip to Vietnam encapsulate why we believe there are interesting growth opportunities for banks in Vietnam (i) Vietnam’s GDP growth over the past decade has been one the fastest in the region, closely following China, and (ii) less than 5% of the Vietnamese population use banking services. Whilst the first point is fairly self explanatory, it is the latter that requires further explanation in our view.
Despite loan growth in Vietnam averaging more than 25% p.a. over the last four years (based on data provided by Dragon Capital), credit penetration (loans to GDP) in Vietnam, stood at 63% at the end of 2005. Not only is this amongst the lowest in the AsiaPac region it is also less than half the developed market norm of 120-130% of GDP. Whilst already low, we believe this statistic understates the credit growth potential in Vietnam given that the majority of bank lending has been to questionably viable SOEs, not the more vibrant, fast growing SME sector.
� Factors Contributing to the Slow Development of SME &
Consumer Banking
From our vantagepoint, the limited development of consumer and SME banking in Vietnam over the past quarter of a century could be attributed to a combination of demand and supply side problems. First on the demand side:
• Lack of confidence in banking system – The widespread collapse of credit co-operatives in the 1980s has led to considerable doubt among retail bank customers as to the viability of the banking sector – and thus demand for banking services. This perception has not been helped by regular cash shortages for withdrawal at banks.
• Low income and rural households – With 80% of the population living in rural areas, it is not viable for profit orientated commercial banks to try and compete against the heavily subsidized policy banks (VBARD/VBSP). Furthermore, with roughly 50% of the population below the poverty line, there is also likely to be limited demand for credit related banking products, though we see significant scope for growth in savings and cash management products.
Robust GDP growth and low
usage of banking system bode
well for future growth in
financial services in Vietnam
Low consumer confidence in
the banking system
Combination of policy lending
and low income levels

Asian Insights – 2 February 2006
24 Refer to important disclosures on page 52.
• Unwillingness to disclose personal financials – One of the implications of the weak bank secrecy laws in Vietnam is that many consumers are unwilling to apply for residential mortgages as they would be required to disclose their personal financial position and all sources of income. This is particularly an issue for consumers given the endemic tax avoidance culture in Vietnam.
On the supply side, there are three main issues:
• Weak legal system – Virtually all lending in Vietnam is done on a collateralized basis, primarily physical property. However, given weaknesses in the legal infrastructure for banks seeking recourse for unpaid loans (both technical and practical), many banks have historically shied away from targeting the consumer and SME banking markets.
• Poor accounting and disclosure rules – Whilst Vietnam is not alone on this issue, given the relative size of the SME market and the general lack of reliable financial information produced, many commercial banks have found the risks in this sector too high to justify entering. The situation was also hampered up until 2002 by the interest rate ceiling on lending rates, as banks could not price for the higher risk levels.
• Absence of consumer credit bureau – The Credit Information Centre that was established to provide information on borrowers to creditors has become an important risk management tool for the banks. At this stage, no such centralized service exists within the consumer market. Sacombank, the IFC and a number of other interested parties are currently in discussion with the SBV to establish a national consumer credit bureau – target launch date, end of 2006.
� Further Bank Reforms Key to Realizing Bank Sector Potential
With a population of over 80mn and supposedly less the 5% currently using banking services, the potential for consumer and SME banking in Vietnam is considerable in our view. Recent investments by large foreign banks would tend to attest to this view. However, as highlighted above, the key to realizing this potential is further reform of the banking system and legal infrastructure.
Tax evasion is rife in Vietnam
Difficulty in recovering bad
debts via the courts
Lack of reliable financial
information to base
credit decisions
National consumer credit
bureau not expected to be up
and running until the
end of 2006
Further reform is crucial to the
development of the consumer &
SME banking markets
in Vietnam

Asian Insights – 2 February 2006
Refer to important disclosures on page 52. 25
Company Themes
Given the embryonic condition of the capital markets it comes as no surprise
that levels of disclosure vary enormously between companies. Quality research
analysis is largely non-existent, accounting rules are still being written and
there are stories of multiple sets of books depending on who is asking for them.
However, there were several key themes to come out from our meetings in
Hanoi and Ho Chi Minh :
• Balance sheets are generally under-stated, especially for state companies that are privatizing. Land assets and unlisted securities in particular are worth paying attention to.
• Credit demand is growing very rapidly. Companies sense opportunity to add capacity to capture demand, especially in domestic markets. The banks are only now beginning to orientate themselves to the private sector and the consumer. Sacom and ACB were amongst the most interesting banks - foreign banks have taken stakes in both.
• Infrastructure needs are considerable and both public and private sector capital is flowing to supply this. In common with larger markets such as China and India the focus will be ports, roads, power and water. Banks will benefit, so too will construction companies such as BT6. For a logistics play, including port, trucking and shipping facilities, GemAdept is well worth visiting.
• Consumption is booming as evidenced by the activity in retail sales, property, autos and tourist services. Vinamilk is geared to wealth creation as the population consumes more dairy products, coffee and ultimately beer.
� Banks Represent Exposure To The Growth of Vietnam Inc
From our perspective banks are one of the most interesting sectors, for two reasons :
• First, they represent an obvious play on the growth of Vietnam Inc as credit demand develops and more sophisticated products are developed to capture this. Loan growth is running at between 20% and 40% across the various players. Foreign banks are also becoming increasing active, taking minority stakes and providing wide-ranging technical assistance to upgrade risk and other systems.
• Second, this will be the area of major privatization activity over the next twelve months. During the second half of the year several larger scale listings are likely in the form of Vietcombank (the largest of the State Banks), Asia Commercial Bank (Standard Chartered has a 8.6% stake) and Sacombank (where ANZ has recently taken a 10% stake).
Company Highlights
� Vinamilk
• The largest dairy company in Vietnam, with sales of US$440mn , Vinamilk has one of the strongest domestic brands with a broad distribution network.
• VNM produces fresh and canned milk, yoghurt, soft drinks (Vi@qua is their leading bottled water brand). Locally sourced milk only accounts for 25% of the company’s needs, the remainder is imported in powdered milk form (US, Australia, NZ).

Asian Insights – 2 February 2006
26 Refer to important disclosures on page 52.
• In a move to diversify their product stream and exploit their distribution channels, the company has just signed a JV with SABMiller to produce beer under a new company brand. Profits are probably more than two years away, however, and the beer market remains highly competitive.
• A typical Vietnamese balance sheet – net cash with investment holdings in other state companies due to be privatized.
• Currently has a market cap of US$525m and trades the equivalent of US$240,000 per day. Post the IPO the Government holding has been reduced to 51% and the foreign shareholding is 15%.
• On consensus estimates the stock is trading on a PE of 10.5x FY06 earnings, with earnings growth of 17%, a dividend yield of 3% and an RoE of 31%.
� GemAdept
• This is a US$90m market capitalization logistics play has revenues of close to US$80m. It is also the second largest listed company after Vinamilk.
• Core services offered include container transport, port and liner agency, project cargo and freight forwarding. Current capacity is 450,000 TEUs – approx 17% of the total for Vietnam.
• One of the future growth drivers will be the completion of the US$200m deep water port at Vung Tau. 80% of the container traffic into Vietnam flows through the south and the only deep water port is in the north.
• Three ports are under construction to accommodate the 15%-20% annual growth in container traffic.
• Annual sales growth of above 20% is generating earnings growth of 25% this year, according to management. The stock is trading on a PE multiple of 9x consensus earnings, with a 3.5% dividend yield and a 27% RoE.
� BT6 (Concrete 620)
• An interesting infrastructure play this company produces pre-cast cement, girders and beams, then designs and undertakes projects that range from road building to bridge construction.
• 45% held by foreign investors (one of the highest in the index) this US$12m market capitalization company will see the government sell down another 20% stake over the next couple of months.
• Management reports that they have a 50% market share in the southern half of the country and despite having built three new factories in the past year they are unable to keep pace with demand.
• Furthermore, management believes that it can generate 20%-30% sales growth over each of the next two year. The pace of infrastructure development taking place would, from our perspective, support this view.
• Consensus earnings forecast for this year is 55%, putting the stock on a PE of 5.8x. The dividend yield is 4.8% and RoE 27%.

Asian Insights – 2 February 2006
Refer to important disclosures on page 52. 27
� Asia Commercial Bank
Asia Commercial Joint Stock Bank (ACB) was established in 1993 and is the largest private bank in terms of assets (VND24.4trn/US$1.6bn), loans (VND6.1trn/US$384mn) and deposits (VND20.0trn/US$1.3bn). ACB is widely viewed as a leader in the areas of SME and consumer banking. As at the end of 2005, the bank’s physical distribution network consisted of 61 branches and transaction offices in developed regions (36 in HCMC, 12 in northern economic hubs, 6 in the central provinces, 3 in the Mekong-delta and 4 in the eastern region), and has 5,584 agents for card payments and 360 agents for cash remittances.
In June 2005, StanChart took an 8.56% stake in the bank for a total consideration of US$22mn in cash– a detailed technical assistance agreement was also signed between the banks. ACB is expected to be one of the first JSBs to list on the Ho Chin Minh Stock Exchange.
Asia Commercial Bank – Financial Snapshot
Summary Financial Data 2002A 2003A 2004A 2005A
Net Profit (VND'bn) 123.0 132.1 211.7 294.1
EPS 1,449 1,556 2,493 3,272
EPS % Chg. 36.6% 7.4% 60.2% 31.2%
PER 35.9x 33.4x 20.9x 15.9x
DPS 1,500 1,200 1,200 1,200
Yield 2.9% 2.3% 2.3% 2.3%
Supplementary Data
Net interest margin 2.55% 2.97% 2.84% 2.97%
Other income/total income 17.0% 16.8% 18.4% 15.3%
Cost/income ratio 35.2% 37.3% 39.7% 41.8%
Total assets 9,350 10,855 15,417 24,421
Net advances to customers 2,406 2,255 3,907 6,108
Deposits from customers 8,297 8,970 12,581 19,996
Gross Loan/deposit ratio 46.0% 55.0% 48.0% 43.0%
NPLs as % of advances 0.8% 0.7% 0.7% 0.4%
Coverage of NPLs 18% 87% 33% 35%
Equity/assets ratio 5.2% 5.2% 4.6% 5.9%
Capital adequacy ratio 8.3% 8.7% 8.5% 9.4%
RoA 1.32% 1.31% 1.61% 1.48%
RoE 26.8% 25.1% 33.4% 27.4%
NB: Shares outstanding 948.32mn, Mkt. Cap US$309mn, Share price VND5.2mn Source: ACB, Dragon Capital
• Key Growth Initiatives – While ACB’s key initiatives for driving growth through the group over the next 12mths are hardly unique – a combination of (i.) market share gains, and (ii.) increased cross-sell of new products into its existing client base, it is one of the few Vietnamese banks to publicly articulate its strategic objectives.
• Biggest changes observed over the past decade – Management cited four main areas where they have observed the greatest degree of change in the past 10yrs – corporate governance, formulation & execution of business strategies, expanded role of risk management, and the growth and development of financial products and instruments offered to customers.
• Key Near-Term Focus Issues – Improving the bank’s understanding of risk management and the building robust control systems is viewed as a key priority for the group by management. The technical assistance agreement signed with StanChart is viewed as a central to this development. Management is also seeking to foster a stronger corporate culture and upgrade the skills of its staff. And lastly, the bank aims to maintain its current loan growth and profitability momentum.
Shareholding Structure
Shareholder Stake
Management >30%
StanChart 8.56%
IFC 7.50%
Dragon Financial .Holdings 7.00%
Jardine Matheson Group. 7.00%
Source: Dragon Capital
ABC is quite a profitable bank.
It posted a net interest margin
of nearly 3%, RoA >1.5% and
RoE close to 30% in 2005. With
a loan deposit ratio of only 43%
Key framework for growing
and developing the
bank’s bottom line
Corporate governance and risk
management have experienced
the largest changes
Risk management and working
with StanChart to enhance its
business platforms

Asian Insights – 2 February 2006
28 Refer to important disclosures on page 52.
Overall impression
Our overall impression of ACB was that it was a solid, well run bank, particularly within the context of the Vietnamese banks. Interestingly, this view was shared by many of the industry contacts we met during our ‘road trip’. Management appeared cognizant of the major challenges and risks confronting the bank and the broader banking market over the next couple of years, as well as being able to articulate a balanced strategy for taking the business forward especially in the SME and consumer banking markets. We were particularly impressed by management’s understanding of ‘why’ we asked certain questions as it demonstrated a strong grasp of the issues in our opinion. We believe StanChart’s decision to take a stake in the bank is a reflection of the quality of the franchise and its position in key growth markets. The detailed technical assistance agreement signed between the two banks should also accelerate ACB’s internal reform and restructuring.
� Sacombank
Saigon Thong Tin Commercial Joint Stock Bank (Sacombank) was founded in 1991 through the consolidation of four credit institutions in Ho Chi Minh City. Sacombank has one of the largest physical distribution networks among the private banks with over 100 outlets, covering all key cities and towns across the country. In terms of balance sheet size, it is one of the larger private joint-stock banks, with estimated 2005 assets (VND15.3trn/US$961mn), net loans (VND1.8trn/ US$113mn) and deposits (VND11.9trn/US$748mn). Sacombank is viewed in the market as a dynamic and successful private bank, and was the first bank in Vietnam to receive investment from the IFC.
In August 2005, ANZ took a 10% stake in the bank for a total consideration of US$27mn – there was also a detailed technical services agreement signed between the banks. Sacombank is expected to be one of the first JSBs to list on the Ho Chin Minh Stock Exchange.
Sacombank – Financial Snapshot
Summary Financial Data 2001A 2002A 2003A 2004A 2005F
Net Profit (VND'bn) 26.9 53.9 90.2 151.2 217.1
EPS 1,733 2,553 2,454 2,677 2,048
EPS % Chg. NA 47.3% -3.9% 9.1% -23.5%
PER 24.2x 16.5x 17.1x 15.7x 20.5x
DPS NA 1,200 1,300 1,400 1,400
Yield NA 2.9% 3.1% 3.3% 3.3%
Supplementary Data
Net interest margin 3.22% 4.12% 3.56% 3.65% 3.63%
Other income/total income 25.3% 17.0% 22.3% 20.1% 21.0%
Cost/income ratio 41.6% 45.8% 49.4% 47.8% 44.1%
Total assets 3,134 4,296 7,304 10,395 15,260
Net advances to customers 392 376 538 899 1,798
Deposits from customers 2,514 3,647 5,484 8,299 11,880
Gross Loan/deposit ratio 85.0% 88.0% 74.0% 67.0% 64.0%
NPLs as % of advances 0.9% 0.6% 0.6% 1.1% 1.0%
Coverage of NPLs 175% 84% 43% 19% 20%
Equity/assets ratio 7.5% 8.2% 8.8% 9.3% 12.1%
Capital adequacy ratio 8.4% 8.3% 10.7% 11.6% 13.8%
RoA 0.86% 1.45% 1.55% 1.71% 1.69%
RoE 12.3% 18.3% 18.1% 18.8% 15.4%
NB: Shares outstanding 1,125mn, Mkt. Cap US$296mn, Share price VND42,000 Source: Sacombank, Dragon Capital
We came away from the
meeting with ACB management
quite impressed given the
context of the broader
banking market
Shareholding Structure
Shareholder Stake
Management >20%
ANZ 10.0%
Dragon Financial .Holdings 8.0%
IFC 7.0%
REE Corp. 7.0%
Source: Dragon Capital
According to Dragon Capital
forecasts, Sacombank is
expected to post a substantial
rise in net profit in 2005,
principally on the back of the
banks significant growth in net
loans (close to 100%
rise forecast)

Asian Insights – 2 February 2006
Refer to important disclosures on page 52. 29
Key Takeaways:
• Next Leg of Growth – Liability or deposit mobilization has been the primary thrust of the bank over the last couple of years. The next leg of growth for the bank is expected to come through the expansion of its card and residential mortgage product offering. Sacombank is also targeting the SME segment as it is viewed as the primary driver and fastest growing segment of the economy – and is the largest employer.
• Changes within the card market – Whist Vietnam is still largely a cash economy, there has been a substantial rise in the level of debit cards over the past couple of years. The number of debit cards has risen from around 2,000 in 2000 to close to 2 million now. Conversely the credit card market is only in its infancy with only 100,000-200,000 credit cards believed to be in issue. Management indicated that there are presently high level discussions going on with the SBV, IFC and Sacombank regarding the development of a consumer credit bureau to complement the existing corporate credit bureau. Interestingly, nearly 100% of credit cards are secured by deposits.
• Absence of credit culture to change – One of the most interesting observations we made during our road-trip was the apparent absence of a consumer credit culture. Sacombank management believes that the combination of government reforms and more innovative product offerings by the banks should reignite the latent consumer credit culture in Vietnam.
Overall Impression
As our Sacombank meeting was with ANZ’s senior management appointee to the bank (previous ANZ country head for Vietnam), the tone of the meeting tended to gravitate towards initial impressions of Sacombank and where ANZ believed it could add value to the franchise. Nevertheless, we came away quite positively disposed towards the bank and with a greater appreciation of the difficulties and challenges within the banking infrastructure in Vietnam, particularly with respect to the credit card market. Similar to our impression of ACB, we believe the involvement of ANZ in enhancing Sacombank’s product offering (especially credit cards) and risk management systems should enable the bank to maintain its strong growth momentum and leading position among the JSBs.
Sacombank has been a leading
deposit gathering bank in
recent years
Strong take-up in debit cards,
but the credit card market is
only in its infancy
New products and government
reforms should reignite the
consumer credit culture
in Vietnam
ANZ’s active involvement in
enhancing Sacombank’s
product offering and risk
management systems should
enable it to maintain its strong
growth momentum

Asian Insights – 2 February 2006
30 Refer to important disclosures on page 52.
Risks For Vietnam
There are several major risks that we see for investors in Vietnam. Limited
capacity is the most obvious – especially in terms of the equity market.
Government policy makers could also reverse the path of current reforms,
and if growth falls below 7% there could be social unrest given the high
numbers entering the workforce each year. Corporate governance and
transparency is improving, albeit off a very low base, which poses micro-level
risks to investors.
Capacity, Policy and Growth
Capacity constraints – for investors the most obvious risk faced is the lack of capital market capacity to absorb investment flows. Whilst the current round of fund raising by many of the local investment managers is encouraging, the equity market is at risk of lagging this surge of interest. Already the Vietnamese Sovereign trades at a tighter spread than either the Philippines or Indonesian Soverign.
Change in policy - a sustained switch in government policy that either crimped growth or cut off the supply of new equity would destabilize the outlook. And certainly a large proportion of overseas investors will likely remain distrustful of the Communist Party rule. The levels of corruption being reported in recent surveys as well as anecdotally during our visit would suggest employing a healthy degree of emerging market cynicism. However, Party coffers are swelling as a result of this economic growth and the absence of any social unrest suggests that a compromise of these goals is unlikely.
Decelerating growth – Vietnam needs to grow at circa 7% p.a. to be able to absorb the estimated 1.4m people entering the workforce every year. Power shortages, sustained drought or economic sanctions from a major trading partner pose the greatest risks to this largely agricultural economy. Utilisation rates at some of the hydro plants fell as low as 20% this year as water levels dropped.
Delayed entry to WTO - the U.S. negotiators were back in Hanoi during our trip and optimism seemed high on both sides that the remaining kinks in the bilateral talks could be overcome. Whilst Vietnam has fought hard for this, the benefits do not compellingly outweigh the costs, from our perspective. Our sense is that FDI flows would not be dramatically under-mined – Vietnamese costs of production are too cheap to ignore, especially as China continues to become a relatively more expensive place to produce.
Corporate governance – this remains a key micro concerns. Disclosure levels are highly variable, although the new Securities Law will help to address this. The IFC notes that improvements are extremely slow and major shareholders are often unwilling to give up control – arguably a parallel with investor experience in China. Multiple sets of accounting books add to the uncertainty.
Property market pressures – the recent surge in prices in Vietnam has been remarkable, even by Asian standards. Parts of Hanoi and HCMC are claimed to have risen by close to 10x over the past seven years. Home ownership levels are now very high and much of the new demand feels more speculative in nature. However, our sense is that this while prices may see little absolute gains in the short term the risk of a collapse is very low. Financing levels are modest so the risks of a pronounced market collapse (as we have seen over the years in the likes of Thailand or Hong Kong) appears to below, even if rates were to spike sharply. Increasing supply is one of the key factors that will keep prices subdued. One additional factor to consider is the development of the equity market. Inevitably this will offer an alternative mechanism for expressing risk appetite.

Asian Insights – 2 February 2006
Refer to important disclosures on page 52. 31
Trading Vital Statistics
Set Up
Account set-up estimated to take two weeks. A securities trading code needs to be gained from the Securities Trading Centre (STC) in HCMC – this is similar to the I.D. system in Korea.
After that foreign investors may only establish one securities account with one broking entity. No multiple accounts are allowed.
A VND account also needs to be established that can only be used for securities transactions.
This is available to both foreign institutions and individuals.
Execution
Key exchanges – Ho Chi Minh City and Hanoi. Companies are listed on one or the other, not both. HCMC is the most liquid. Hanoi only operates on Monday, Wednesday and Friday.
Settlement : Equities T+3 (HCMC Exchange), T+2 (Hanoi)
T+1 for bonds
Commission rates : Listed securities up to 0.5%, unlisted 5%-20%
Delivery versus payment, 100% pre-funded (can be in USD)
There is no lock-up or minimum holding period for securities purchased.
No short selling is allowed
Daily Trading
There is no real time trading. Exchange hours are as follows :
09:00 – 09:20 Matched Orders
10:00 – 10:30 Matched Orders
10:30 – 11:00 Block Trades (crossing minimum 10,000 shares)
Daily price fluctuations limited to 5% of the close on previous trading day
Face value of equity shares is VND10,000. Confusingly dividend yields are often quoted against this par value.
Minimum par value for bonds is VND100,000.
Investment Restrictions & Taxes
Foreign ownership restricted to 49% for all listed companies, 30% for OTC listings. These shares have full voting rights, however.
Dividends are subject to a 20% withholding tax
Income tax of 0.1% charged for institutions against sale proceeds. Although the 5% repatriation tax has been abolished, it is still collected by the Tax Bureau. This is under review.
IPOs
Dutch-auction, set floor price. Application broker or local trading centre. 10% deposit required. Allocations 30 minutes post the close.

Asian
Insig
hts –
2 F
ebru
ary 2
006
32
Refe
r to im
po
rtan
t dis
clo
su
res o
n p
ag
e 5
2.
Vietnam Stock Valuations
Mkt Cap EPS growth (%) PE (x) PB (x) DY (%) RoE (%) Debt/ Equity Foreign Ownership
Symbol Name Price (US$mn) 2005F 2006F 2007F 2005F 2006F 2007F 2005F 2006F 2007F 2005F 2006F 2005F 2006F 2007F 2005F 2006F 2007F Total shares (m) % left
AGF Agifish 39.5 10.4 27.2 28.4 21.6 7.4 5.7 4.7 1.7 1.5 1.2 4.3 4.3 24.7 27.6 28.3 2.3 1.9 1.9 4.2 14
BBC Bibica 22.8 8 18.8 28.5 35.8 10.5 8.2 6 1.4 1.3 1.1 5.5 5.5 13.8 16.2 19.8 1 1 1.2 5.6 27.9
BBT Bach Tuyet Cotton 10.7 4.6 -160.3 565 5 58.8 8.8 8.4 1 0.9 0.9 9.1 9.1 1.6 10.6 10.4 0.7 0.9 0.8 6.8 46.1
BPC Bim Son Packaging 16.1 3.6 4.3 7.1 6.2 7.9 7.4 7 1 0.9 0.8 9.3 9.3 12.8 12.7 12.5 0.4 0.4 0.5 3.8 48.6
BT6 Concrete 620 31.8 11.8 6.1 55.2 9.7 9 5.8 5.3 1.7 1.4 1.2 4.8 4.8 19.7 26.6 25 1.9 1.9 1.8 5.9 4.4
BTC Binh Trieu Construction 8 0.6 -69.6 -126.5 9.1 -6.7 25.3 23.2 1.7 1.6 1.6 - 6.2 -23.8 6.6 6.9 4.6 4.9 5.6 1.3 40.9
CAN Halong Canning 17.5 3.8 138.8 14.1 21.4 9.2 8 6.6 1.3 1.2 1.1 5.8 7 14.5 15.1 16.7 1 0.9 1 3.5 22.1
DHA Hoa An Stone 44.1 10.7 25.1 -22.3 12 5.9 7.6 6.8 2.1 1.8 1.6 4.7 4.7 39.8 25.5 24.6 0.2 0 -0.1 3.8 28.6
DPC Danang Plastics 12.4 1.2 -0.7 -9.6 8.7 63.9 70.7 65.1 1.1 1.1 1.1 4.1 6.6 1.7 1.5 1.6 0.4 0.4 0.4 1.6 41
GIL Gilimex 33.2 9.5 -25.3 -19.5 -1.2 8.7 10.8 11 2.1 1.9 1.7 5 5 25.9 18.3 16.3 0.8 0.6 0.6 4.6 9.5
GMD Gemadept 69.5 90.4 7.6 26.8 24 11.9 9.4 7.5 2.7 2.3 2 3.5 3.5 24.9 27 28.3 0.4 0.4 0.5 21 29.6
HAP Haiphong Paper 24 4.9 2.4 7.3 9.9 6 5.6 5.1 1.1 1 0.9 6.1 7 19.8 18.9 18.6 1.1 0.7 0.7 3.3 43.7
HAS Hacisco 36 3.6 19.1 18.7 16.9 6.2 5.2 4.4 1.3 1.1 1 4.7 4.7 22 22.8 23.3 2.2 1.7 1.7 1.6 33
KDC South Kinh Do 53 83.2 0.2 29.5 22 13.3 10.3 8.4 4.1 3.3 2.7 3 3 31.9 35.5 35 1.1 0.9 0.9 25 24.9
KHA Khahomex 19.8 3.9 92.8 22.7 9.5 4.5 3.6 3.3 1.4 1.1 0.9 9.4 9.4 33.6 33.7 30.5 4 3 2.7 3.1 34.2
LAF Lafooco 20 4.8 22.8 67.5 43.9 2.5 1.5 1 1 0.8 0.5 8.9 8.9 46.4 58.3 60.4 1.9 1.7 1.7 3.8 21.3
MHC Marina Hanoi 22.8 9.6 38.4 17.7 8.2 7 6 5.5 1.4 1.3 1.1 7.7 7.7 21.8 22.5 21.3 1.1 1 1.2 6.7 41.2
NHC Nhi Hiep Brick 24.7 2.1 -39.8 47.5 10.6 13.7 9.3 8.4 2.1 1.8 1.6 6.5 6.5 15.7 20.5 19.8 0 0 0 1.3 48.9
NKD North Kinh Do 54 23.7 18.9 22.4 13.5 9.6 7.8 6.9 3.9 3 2.4 3.3 3.3 38.9 43.3 38.5 0.7 0.7 0.8 7 31.9
PMS Petrolimex Mechanical 14.1 2.8 19.6 35.3 30.3 6.4 4.7 3.6 1.1 1 0.8 8.3 8.3 18.4 22 24.9 1.2 1.5 1.9 3.2 47.8
PNC Phuong Nam Cultural 18.7 3.5 25.1 16.7 30.7 9.1 7.8 6 1.3 1.7 1.4 10.8 10.8 16.1 22.9 25.9 5.1 4 3.8 3 32.5
REE REE 35.6 63 11.3 21.6 28.7 13 10.7 8.3 2.8 2.4 2.1 4.1 4.1 22.2 24.5 27 0.4 0.5 0.6 28.2 10.8
SAM Sacom Cable 42 61.7 62.7 -8.7 -9.2 6.4 7 7.7 2.3 2.4 2 3.4 3.4 40.6 34.1 29 0.7 1 0.9 23.4 15
SAV Savimex 29.5 8.1 -3.3 14 -3.2 7.7 6.7 7 1.5 1.3 1.2 5.2 5.2 20.6 20.7 17.9 1.8 1.7 1.6 4.5 18.8
SFC Saigon Fuel 27.5 2.9 37.6 24.8 12.8 6 4.8 4.3 1.5 1.3 1.1 5.3 5.3 26.7 28.2 27 0.8 0.9 1.1 1.7 46.6
SGH Saigon Hotel 18 2 24.7 31.1 33.7 10.4 7.9 5.9 1.3 1.2 1 5.6 5.6 12.8 15.4 18.6 0.1 0.2 0.5 1.8 44
SSC Southern Seed 43.8 16.5 12.9 19.5 -11.3 8.2 6.9 7.7 2.4 2 1.7 4.5 4.5 32.1 31.7 23.8 0.2 0.2 0.2 6 29.9
TMS Transimex 44 11.9 40.7 7.6 11.9 10.6 9.8 8.7 2.8 2.4 2 3.5 3.5 28.3 26 24.9 0.3 0.1 0.1 4.3 8.7
TNA Tenimex 28.1 2.3 35.1 56.1 15.9 10.8 6.9 6 2.3 1.9 1.6 5.8 5.8 21.6 29.8 28.9 0.9 0.9 0.9 1.3 46.3
TRI Tribeco 27.4 7.8 -10.1 5.9 8.6 15.7 14.8 13.7 1.9 1.8 1.6 5.4 5.4 12.6 12.3 12.4 1.3 1.3 1.5 4.5 35.4
TS4 Seapriexco 25.4 2.4 -8.6 16.6 23.2 10 8.6 7 1.5 1.4 1.2 4.6 4.6 16.2 17.1 18.9 1 0.9 1 1.5 21.1
VNM Vinamilk 52.5 524.4 37.9 16.8 13.4 12.2 10.5 9.2 3.5 2.9 2.5 3 3 31.3 30.6 29 0.4 0.4 0.3 159 34.1
VTC VTC Telecoms 32.9 3.7 -16.4 27.7 22.8 6.1 4.8 3.9 1.4 1.5 3.5 3.6 3.6 24 30.5 55.3 0.5 0.9 4 1.8 29.8
Weighted Avg 1,003.4 27.5 20.2 14.4 11.6 9.7 8.5 3.1 2.6 2.2 3.6 3.6 29.7 29.8 28.7 0.6 0.6 0.6 358.1 29.1
Source: IBES, Thomson Financial DataStream

Asian Insights – 2 February 2006
Refer to important disclosures on page 52. 33
The Big Picture - Current Equity Strategy for Asia ex-Japan The growth outlook for the region continues to be robust, with diverse export
drivers. Currencies should continue to strengthen against the USD. By mid-
year we expect export momentum to ebb and there will be a more profound
bias towards domestic-demand related sectors and stocks. The capex cycle we
expect also to revive, creating the next incremental driver to the credit cycle as
well as offering the opportunity for selective re-leveraging of balance sheets.
Amongst the major markets we see a potential inflection point looming for
Taiwan by the end of 1Q06 at a time when there is almost universally positive
sentiment towards this market. Amongst the Asian markets we continue to be
most overweight Thailand and Indonesia. We also continue to like frontier
markets such as Pakistan, where recent earnings revisions have been very
encouraging. Vietnam is our long term play as the privatization program
drives the IPO activity.
Key Assumptions For Non-Japan Asia
The growth outlook for the region remains intact. Economies such as Korea,
Thailand and Indonesia should all experience accelerating growth over the course
of 2006, whilst absolute growth rates remain high in the mega economies of China
and India. Vietnam is forecast to deliver the second highest growth in the region of
close to 7.5%.
For the region the leading sources of growth continue to be China, Japan and
Europe. Furthermore, as export momentum ebbs by mid-2006 the lead will be
taken by domestic-demand related-drivers. This should be highlighted by the
switch in relative performance between our export and domestic demand basket.
As the chart on the left highlights, exports have out performed since the second
half of last year. We would expect that not only will interest rates be modestly
higher over the course of the year (between 50bps and 75bps) but regional
currencies will continue to edge higher against the USD as the U.S. Fed goes on
hold from 1Q06 onwards.
The capex cycle is also expected to begin to recover this year. This should
underpin RoEs if some leverage is re-introduced, which in turn will help to drive
credit growth for select banks. We explored this in some detail in 2006 Pacific
Rim Year Ahead, dated 09 January 2006. Furthermore the healthy free cash flow,
and existing cash balances, will serve as a strong driver to M&A once again,
especially within technology and telecoms.
� North Asia Most Vulnerable To Air Pocket In Short Term
The sharp moves in regional currencies in the last three months have, however,
started to raise concerns about export earnings when earnings are released early in
the second quarter. Combined with the performance of North Asian markets in
particular and the more cautious tone coming from our global semiconductor team,
our sense is that markets will face a pull back before we reach the end of 1Q06.
The TAIEX is up 20% in USD terms since the end of October and the tax season
looms. At the upper end of the range Korean exporters have been forecasting an
exchange rate of KRW950:USD for the whole year and we are already about to
break that level. At the same time the KRW has also sharply out run the Yen. Over
the same period there has been a near 22% run in the KOSPI, and the latest
economic data highlighting a sharp slow down in export growth will compound
existing worries. Chinese share have also rallied very hard, with the H share index
up 32% since the end of October. Although earnings certainty appears to be
Non-Japan Exporters Are Out Performing Their Domestic Peers – For Now
J F M A M J J A S O N D J F M A M J J A S O N D J
0.95
1.00
1.05
1.10
1.15
1.20
Asia Pac x JP Exports rel Asia Pac x JP Domestic Demand
Source: DATASTREAM Source: Thomson Financial DataStream
Capital Goods Imports Will Revive With An Upturn in Capex, Creating The Next Leg To The Credit Cycle
-40.0
-30.0
-20.0
-10.0
0.0
10.0
20.0
30.0
40.0
50.0
60.0
Jan-91 Jan-92 Jan-93 Jan-94 Jan-95 Jan-96 Jan-97 Jan-98 Jan-99 Jan-00 Jan-01 Jan-02 Jan-03 Jan-04 Jan-05
(%)
-30.0
-20.0
-10.0
0.0
10.0
20.0
30.0
40.0
(%)
Regional loan growth (x Aus & China) YoY (%) (RHS) Regional imports capital goods (x Aus & China) YoY (%)
Source: Merrill Lynch Asia Pac Equity Strategy Group
Asian Currencies Are Still
Rallying Against The USD
Ex-rate to U$ 1M (%) 3M (%)
Thailand 38.9 5.3 4.9
Indonesia 9,386.5 4.8 6.8
South Korea 964.7 4.8 8.1
Australia 1.3 3.2 1.5
Taiwan 32.0 2.7 5.0
Singapore 1.6 2.5 4.5
India 44.1 2.0 2.2
Philippines 52.2 1.7 5.7
Japan 117.1 0.8 (0.3)
Malaysia 3.8 0.8 0.7
China 8.1 0.1 0.3
Hong Kong 7.8 (0.0) (0.1)
Pakistan 59.9 (0.3) (0.3)
Source: Thomson Financial DataStream

Asian Insights – 2 February 2006
34 Refer to important disclosures on page 52.
modestly higher the China stocks are likely to be as vulnerable to a short term
deterioration in risk appetite as the other North Asian markets.
Elsewhere in the region we continue to like frontier markets, notably Vietnam and
Pakistan, and we have significant over weights in two of the ASEAN markets –
Indonesia and Thailand.
Sub-Regions
� North Asia
Korea suffered a sharp bout of market volatility during January but we see this as
having been a fairly healthy shake-out after a stunning performance over the
previous six months. From our perspective Korea continues to have decent
domestic momentum, a robust credit cycle and the valuation discount to the region
will, in our opinion, continue to narrow. The strength of the KRW has failed to
dent sentiment so far. As Namuh Rhee noted in his South Korea Strategy, dated 12
January, 2006, a 1% change in the KRW:USD rate reduces EPS by a relatively
modest 0.8%. Most of the major exporters have assumed a KRW950-980 : USD
rate for 2006 so we are already approaching the upper end of this range. Our sense
is that there may be heightened concerns regarding export earnings ahead of the
1Q06 results. This is the next trigger that we see for a correction in the KOSPI.
For Taiwan, the technology sector will likely carry momentum further into late
1Q04, but after that positions should be re-assessed. Foreign portfolio flows have
been nothing short of spectacular since late October when the TAIEX troughed at
5,600 points. Over the last three months net foreign portfolio inflows have
amounted to more than USD13bn, which accounts for almost two-thirds of total
inflows into emerging Asia over that period. Given the more than 20% capital gain
in USD terms from the index, we are mindful of the seasonal contraction of
liquidity that occurs as the tax season approaches in April to May. Outside of the
technology sector we see only a handful of interesting opportunities and at best the
bank sector will only be defensive in any sell off. There is very little growth on
offer from the sector in FY06.
The Hang Seng Actually Does Better When U.S. Rates Are Rising, Not Falling
Without Tech There Is Not Much Left To Hold In Taiwan, Banks Are No Growth And Defensive At Best
91 92 93 94 95 96 97 98 99 00 01 02 03 04 05 06
000'S
2
4
6
8
10
12
14
16
18
0
1
2
3
4
5
6
7
8
Hang Seng IndexUS Federal Funds Target Rate (RHS)
Source: DATASTREAM
1998 1999 2000 2001 2002 2003 2004 2005 2006
x10-2
0.90
1.00
1.10
1.20
1.30
1.40
1.50
1.60 0.09
0.10
0.11
0.12
0.13
0.14
0.15
0.16
0.17
0.18
0.19
0.20
Taiwan Electronics rel TWSE Taiwan Banks rel TWSE, inverted (RHS)
Source: DATASTREAM
Source: Thomson Financial DataStream Source: Thomson Financial DataStream
From our perspective Hong Kong will continue to be eclipsed by China-related
issuance and this remains a profound under weight in our asset allocation for Asia.
Over the last three months it has already severely lagged the key regional
benchmarks (the Hang Seng is up 6% versus 15% for Asia Pac). The economy
will continue to lose momentum over the course of the year and cost pressures will
continue to manifest through rental revisions. The Hang Seng Index is currently
trading in line with the regional PE multiple but has the lowest forecast earnings
Korean Won vs Japanese Yen
F M A M J J A S O N D J F M A M J J A S O N D J F
800
850
900
950
1000
1050
1100
1150
SOUTH KOREAN WON TO 100 JAPAN.YEN
Source: DATASTREAM
Source: Thomson Financial DataStream

Asian Insights – 2 February 2006
Refer to important disclosures on page 52. 35
growth in the region at just over 1%. As the chart above details, the direction of
Fed Funds rates is actually more positively correlated with Hong Kong equities
than investors often assume. In the past eight years equities have made positive
returns when U.S. rates have risen and losses when they have declined. Our U.S.
Economics team believes that the Fed will begin to ease rates in the fourth quarter
of this year.
Equities in China have been so strong in the past three months that we feel that a
correction, albeit a healthy one, lies ahead. The H-share index was up 19% in
January alone, led by growth sensitive sectors such as raw materials, petrochemicals
and financials. A number of laggards in areas such as tech and telecommunication
equipment have also had stunning runs. For the ML China universe valuations still
look reasonable, with the aggregate PE sub-11x and earnings growth (ex the energy
stocks) a fairly healthy 13%. We would be inclined to be adding into any correction
that unravels. Our sense is that this is a greater risk for North Asia over the next
three months than for the rest of the region.
� ASEAN
Within South East Asia we continue to be major fans of two markets – Thailand
and Indonesia. Both markets experienced a difficult 2005 but investors have been
returning in some size and performance has improved sharply with USD gains of
13% and 11% respectively in the past month alone.
The key to both is domestic demand. With the peak in the interest rate cycle
within view for both economies, Our target is still 880 on the SET and despite
recent performance it remains one of the cheapest markets in the region (9x FY06
PE). For Indonesia the domestic economy will also be in recovery mode in 2006.
We continue to like the banks and consumer discretionary stocks like Astra.
At the emerging frontier of ASEAN we have a 3%, off index, weighting in
Vietnam. The economy is growing at more than 7% a year under pinned by very
robust FDI, supportive government policy, infrastructure spending and booming
domestic confidence. Consumption is already increasing at more than 20% p.a.
and the development of the banking system will add further fuel to the growth
profile. The embryonic equity market has developed slowly over the past five
years but the pace is now accelerating with larger-scale IPO’s from SoE sector.
Malaysia and Singapore are both under weight recommendations. The former has
de-rated significantly in the past twenty-four months but better value can still be
found elsewhere. However the almost total lack of investor interest in this market
suggests that it could yet surprise. We watch and wait.
In Singapore our sense is that the attention will remain with the REITs, select
banks and regional infrastructure plays. Economic data remains very positive, as
evidenced by the recent data on both consumption and unemployment which bode
well for the real estate market this year. However, the overall index will probably
perform best against a backdrop of weaker regional markets.
H-share rel Hang Seng
F M A M J J A S O N D J F
x10-2
10.50
11.00
11.50
12.00
12.50
13.00
13.50
14.00
H-share rel Hang Seng Index
Source: DATASTREAM
Source: Thomson Financial DataStream

Asian Insights – 2 February 2006
36 Refer to important disclosures on page 52.
Malaysia Has De-Rated Sharply But Under Performance Alone In Not Enough Of A Catalyst
Both The Peso & The Sovereign Bond Have Rallied Hard Since Mid-2005
2.9
3.1
3.3
3.5
3.7
3.9
4.1
Jan-04 Apr-04 Jul-04 Oct-04 Jan-05 Apr-05 Jul-05 Oct-05 Jan-06
0.80
0.85
0.90
0.95
1.00
1.05
1.10
1.15
1.20
1.25
1.30
KLCI rel MSCI Asia Pac x JP Malaysia PE rel MSCI Asia Pac x JP PE (RHS)
0.0
100.0
200.0
300.0
400.0
500.0
600.0
Jan-03 Apr-03 Jul-03 Oct-03 Jan-04 Apr-04 Jul-04 Oct-04 Jan-05 Apr-05 Jul-05 Oct-05 Jan-06
51.0
52.0
53.0
54.0
55.0
56.0
57.0
Philip Sov Spread 08 Peso to US$ (RHS)
Source: Merrill Lynch Asia Pacific Equity Strategy Group Source: Thomson Financial DataStream
After a decent pick up in 3Q05 Philippine equity performance has been more
muted in recent months. The policy tone has been encouraging but politics will
matter more and will likely sideline investors so we maintain our market weight.
The final phase of the VAT implementation coming through as we go to publication
which bodes well for the fiscal position over the coming year. At the same time
earnings momentum is actually accelerating, from 8% in FY05 to a forecast 14% in
FY06. Going forward, however, the tone will shift to the political debate over
constitutional reform and that is likely to overshadow micro fundamentals.
� Indian Subcontinent
The Indian subcontinent is proving to be a challenge for fundamental value
investors and a haven for those with an outright preference for momentum. Our
sense is that India will probably sustain its valuation premium to the region
throughout 2006. Currently the PE premium remains a relatively modest 5%.
Whilst high relative to recent history (the Sensex traded at a 50% discount to Asia
in mid-2002) many other markets have sustained much higher premiums in the
past with decidedly weaker return outlooks. The full set of relative PE and PB
charts are included in the latter part of this report.
Underpinned by one of the highest economic growth rates in Asia in FY06 (7.6%)
earnings growth is forecast to be 18% - the highest in Asia. Any post-result weakness
over the next couple of months will likely be treated as a buying opportunity.

Asian Insights – 2 February 2006
Refer to important disclosures on page 52. 37
Net Foreign Buying of India and Sensex Performance
KSE100 Performance and Daily Volumes
-150.0
-100.0
-50.0
0.0
50.0
100.0
150.0
200.0
250.0
300.0
Jan-04 Mar-04 Jun-04 Sep-04 Dec-04 Mar-05 Jun-05 Sep-05 Dec-05
(US$mn)
4500.0
5000.0
5500.0
6000.0
6500.0
7000.0
7500.0
8000.0
8500.0
9000.0
9500.0
10000.0
India weekly average net buying & selling (US$mn) India Sensex (RHS)
100.0
300.0
500.0
700.0
900.0
1100.0
1300.0
1500.0
1700.0
Jan-05 Mar-05 Jun-05 Sep-05 Dec-05
(US$mn)
6000.0
7000.0
8000.0
9000.0
10000.0
11000.0
Pakistan - mthly avg daily turnover (US$mn) Karachi 100 (RHS)
Source: Bloomberg, Thomson Financial DataStream Source: Thomson Financial DataStream
Pakistan’s stock market continues to surprise on the upside. The KSE100 has
decisively pushed up to a new record high of 10,500 level and current indications
are that earnings will be revised up again for the banks, E&P and cement
companies. Regulatory risk also appears to have significantly receded. The
replacement of the Commissioner at the Securities and Exchange Commission of
Pakistan (SECP) suggests that the planned reform of the Badla financing system.
Privatization activity will likely carry the index higher and our overweight from
August, 2005 remains in place.
� Australia
A reasonable performer last year as the AUD weakened and the domestic
economy slowed, the tone switches to the quality of earnings for 2006. Expect the
absolute level of earnings growth to still be reasonable (+11% YoY according to
the ML universe) although this will be half the growth seen in 2005 due to the loss
of earnings momentum in the energy and resource sector.
The near-term cyclical slow-down warrants a more cautious stance towards asset
allocation. However, economic growth will continue to grow above its long-term
trend, while inflation remains muted. We believe this combination will lend itself
to higher equity multiples underpinning our ASX target of 4,950 by 2H06.
Tactically (and in view of near-term caution on cyclicals), we believe it best to
build positions in higher yielding and unloved industrials and utilities into the
reporting season, including Bluescope Steel, Telstra and Coca Cola Amatil.
Longer-term we maintain a bar-bell strategy with key overweight positions in the
resources and in the banks.

Asian Insights – 2 February 2006
38 Refer to important disclosures on page 52.
Current Asset Allocation
Asia Pacific ex-Japan Country Asset Allocation & Valuations
2006F
Country ML Weight (%) Asset Allocation Recent Changes EPS Growth (%) PE (x) PB (x) RoE (%) DY (%)
South Korea 20.0 OW = 9.4 10.2 1.5 16.0 1.6
Taiwan 16.0 OW = 11.0 12.0 2.1 17.1 4.2
Hong Kong 4.0 UW - 0.9 13.7 1.7 12.6 3.9
China 6.0 UW = 6.8 11.6 1.9 16.8 2.8
Singapore 3.5 UW = 9.6 14.5 1.8 12.8 3.4
Malaysia 1.0 UW = 10.8 13.0 1.8 14.9 4.2
Thailand 5.0 OW = 3.8 9.6 2.9 19.9 4.4
Indonesia 4.5 OW = 13.9 12.7 2.6 20.4 3.4
Philippines 0.5 MW = 15.0 10.8 1.4 12.9 1.8
Vietnam 3.0 OW + 20.2 9.7 2.6 29.8 3.6
Australasia 28.5 UW - 10.8 14.5 2.6 18.0 3.8
India 5.0 MW = 18.5 14.7 3.3 24.2 1.8
Pakistan 3.0 OW = 7.6 10.5 2.8 27.3 5.8
Total 100.0
Source: Merrill Lynch Asia Pacific Equity Strategy Group estimates
• Indonesia has turned the corner. The market is
leading the economy but both inflationary and rate
pressures are easing. It is a domestic story for FY06,
add to banks and consumer discretionary names. OW
• Economic momentum in Thailand is improving
which should feed through to better earnings. OW.
Re-gearing of balance sheets could boost returns,
valuations remain amongst most compelling.
• Korea has further upside potential over the next 12
months as the domestic economy picks up, credit growth
accelerates and fund flows provide liquidity. OW
• Pakistan OW. Capital inflows continue to be
strong, recent company results healthy, especially
from the banks and E&P sector. Expect more
M&A and privatizations ahead. Prefer to India at
current levels.
• Hong Kong still faces headwinds from
currencies and rates. More downside likely in
property sector whilst forward earnings growth is
most anemic in the region for 2006. UW.
• Malaysia remains UW. Market has de-rated but is
still expensive relative to the region and the
growth on offer.
Asia Pacific ex-Japan Sector Asset Allocation & Valuations
2006F
Sector ML Weight (%) Asset Allocation Last Change EPS Growth (%) PE (x) PB (x) RoE (%) DY (%)
Banks 19.0 MW + 9.0 12.1 2.0 16.4 4.4
Non-Banks 16.5 OW = -0.8 15.2 1.8 11.8 3.3
Materials 13.5 OW = 16.7 8.0 2.1 26.4 3.9
Industrials 12.0 OW + -4.0 14.6 1.5 11.4 3.5
Consumer Discretionary 7.0 MW = 18.5 14.8 2.3 15.6 2.2
IT – Semis 9.5 OW = 40.9 11.8 2.2 18.3 1.5
IT - Non-Semis 6.0 MW = 37.7 17.7 3.3 18.7 1.7
Telecom 3.0 UW = 4.6 12.9 2.1 16.3 4.2
Consumer Staples & Health Care 6.0 MW - 16.8 20.8 3.5 16.7 2.9
Utilities 2.5 UW = 10.0 12.4 1.5 11.5 3.3
Energy 5.0 MW - 0.9 10.0 2.2 22.7 3.8
Total 100.0
Source: Merrill Lynch Asia Pacific Equity Strategy Group estimates
• Recently raised the Banks allocation to reflect our
preference for domestic cyclical names. Consumer
Staples finances this after strong relative performance
so moved down to MW.
• Industrial OW. Strongest preference is for the
regional infrastructure plays. We have turned positive
on the airlines post our downgrade to WTI oil price.
Energy is cut to MW.

Asian
Insig
hts –
2F
ebru
ary20
06
R
efer to im
po
rtant d
isclosu
res on
pag
e 52.3
9
Thematic Model Portfolio
Mkt Cap 2006E
Country Company Ticker Rating Price (US$mn) PE (x) EPS Growth (%) PB (x) DY (%) RoE (%) Comments
Australia Brambles BRMBF B-1-7 9.9 7,299 23.9 16.7 3.5 2.5 65.3 Re-rating potential from concentration on CHEP and Recall
Australia Coles Myer CMYRF B-1-7 10.5 9,856 16.2 26.3 3.2 3.9 19.8 Re-rating story. Management looking to sell cyclical retail portfolio - South African retailers and DJS in acquisition mode.
Australia St. George Bank STGKF B-2-7 30.3 12,110 15.4 9.2 3.7 4.9 23.6 Favoured bank exposure thanks to its superior franchise and core deposit gathering. Likely to generate superior net interest income growth due to gaining market share in SME lending.
Australia BHP Billiton BHPLF B-1-7 25.8 69,957 13.0 43.1 4.8 1.5 37.7 News flow remains positive - commodity prices have further to run. BHP also controls around 40% to 50% of global uranium supply (Asia needs to diversify its power generation capacity)
Australia CSL CMXHF B-1-7 43.5 5,948 24.0 21.0 4.0 1.2 14.9 Upside EPS risk from new Vivaglobin pricing premium, strong fundamentals in IVIG as well as the Herpes vaccine. DCF valuation of A$49.51.
Australia Westfield Group WEFIF A-2-7 17.7 23,389 17.4 6.4 1.6 6.4 9.1 Interest rate sensitive that has returned to good value.
Australia ASX YASXF B-1-7 34.9 2,699 27.6 17.0 11.3 3.2 2.8 Continuing strong operational performance. Merger with SFE a positive.
PRC Chalco ALMMF C-1-7 7.2 10,185 8.8 20.4 2.1 3.4 23.3 Chalco has the monopoly position in PRC, a market naturally short of Chalco's major products, aluminium and alumina. Increased confidence in our forecasts given ASP strength.
PRC Sinopec SNPMF B-1-8 4.7 53,412 8.8 17.4 1.6 2.4 18.5 Refined oil price caps have held share price and returns back hindering capacity expansion and ultimately the secure supply of refined oil products to the market.
Hong Kong Wheelock & Co WHLKF B-1-7 14.1 3,680 11.4 -39.7 0.7 1.3 6.5 Wheelock Props offers an interesting restructuring wildcard. In the meantime positive fundamentals of HK office and retail rental market should support high cash flows to dividends.
Hong Kong Hysan Development HYSNF B-1-7 19.7 2,675 7.8 -14.3 0.9 2.4 11.4 Decentralisation of office and retail tenants theme within HK. Hysan benefits through its Causeway Bay investment portfolio. PBV of 0.8x.
Hong Kong Citic Int’l Financial CIIEF B-1-7 3.1 1,288 10.1 -11.3 1.1 5.4 10.5 Stock has under performed the local index, remains overlooked, restructuring benefits not priced and dividend yield comfortably in excess of market.
India IDBI XDBIF C-1-7 90.2 1,479 12.6 68.0 1.0 1.7 8.2 Inexpensive government bank - markets has yet to value change in loan mix, recovery in SASF NPLs and new low cost deposit base.
India Bharat Heavy Electricals
BHRVF C-1-7 1,797.5 9,971 30.2 50.8 6.1 0.6 20.3 Top Indian engineering play seeing strong order growth for power equipment across the region. Tie up with Alstom very positive for larger projects. High barriers to entry too.
India Associated Cement Companies
ADCLF C-1-7 573.0 2,396 17.4 38.2 4.5 2.0 25.5 Most leveraged to rising cement prices in India.
Indonesia Bank Rakyat Indonesia
BKRKF C-1-7 3,400.0 4,376 9.4 14.6 2.5 5.3 27.1 One of our top picks in the APR banking sector - trading on undemanding valuation multiples.
Indonesia Mitra Adiperkasa PMDKF C-1-7 1,100.0 195 10.8 25.3 1.4 1.7 13.4 Attractive small cap consumer discretionary stock with high barriers to entry and unique business model. Manages portfolio of international brands such as Starbucks.
Korea Kumho KWWCF C-1-7 69,400.0 434 8.6 115.0 2.1 1.2 24.6 Tightness in Kumho's main product LCD TV CCFL is likely to persist throughout 2006 - demand is stronger than expected while supply is restricted to a few proven players such as Kumho.
Korea Samsung F&M SZVZF C-1-7 127,000.0 6,333 16.4 24.6 2.2 1.4 13.4 Rising interest rates will lift SF&M's investment yield. Deregulation in the sector will help sustain growth.
Korea Samsung Heavy Industries
SMSHF C-1-7 15,500.0 3,722 9.4 401.3 1.4 2.1 15.2 Lucrative deepwater drillers injects new life into the Korean shipbuilding cycle. Recent EPS upgrades with 72% upside to our PO
Korea SK Corp SKCXF C-1-7 59,500.0 7,923 5.9 11.2 0.9 3.1 15.4 Acquisition of Inchon refinery is EPS accretive while also affords SK Corp a majority share of market now. Share overhangs form Sovereign and Wellington are behind us now.
Korea Samsung Electronics
SSNLF C-1-7 740,000.0 112,385 12.3 33.8 2.7 0.7 21.8 DRAM and NAND regaining their growth trajectories while NAND bit costs are declining boosting margins. SEC to post sequential earnings growth through to 4Q06.

Asian
Insig
hts –
2 F
ebru
ary 2
006
40
Refer to
imp
ortan
t disclo
sures o
n p
age 52.
Model Portfolio
Mkt Cap 2006E
Country Company Ticker Rating Price (US$mn) PE (x) EPS Growth (%) PB (x) DY (%) RoE (%) Comments
Malaysia Air Asia AIABF C-1-9 1.7 1,062 22.3 44.3 3.6 0.0 14.8 Structural growth in discount airlines.
Pakistan ICI Pakistan ICPKF B-1-7 144.2 334 10.0 16.7 1.8 4.9 18.2 CSF cycle to remain in deficit through to 2008. Investors have failed to appreciate company restructuring given steep valuation discount to market PE.
Singapore Singapore Air SPAAF B-1-8 14.2 10,678 14.4 7.4 1.3 2.8 9.1 Operationally strong currently given seasonal high in PAX loads while cargo loads v strong as well. Too cheap with positive EPS revisions ahead of it as jet keep falls
Singapore Ascendas REIT ACDSF B-1-7 2.2 1,716 19.7 27.0 1.6 5.4 7.8 Higher gearing ceiling and earnings accretive acquisitions will continue to re-rate A-REIT.
Taiwan Sunplus SNPLF C-1-8 37.7 1,116 12.4 18.5 1.9 5.1 15.6 We believe the restructuring story / spin off of the LCD business. Growth momentum is forecast to accelerate into 2H06.
Taiwan EVA Air EVABF C-2-8 13.5 1,577 22.2 151.8 1.0 2.4 4.6 50% of revenues stem from tech exports which are inflecting. Seasonal rally ahead of Chinese New Year and direct air links.
Taiwan Powerchip PWSMF C-1-9 20.6 3,591 13.3 31.0 1.2 0.0 11.1 Korean capacity constraints have allowed Powerchip to gain market share in low-end DRAM. Growth trajectory in DRAM recently upgraded.
Taiwan TSMC TSMWF C-1-7 63.5 49,092 12.6 34.2 3.0 3.1 23.7 Valuation hit historic low but resumption in growth momentum in 2H05 due to gateway processors and gigabit Ethernet chips.
Taiwan Coretronic CCOCF C-1-7 50.9 829 9.7 7.8 2.0 2.1 20.5 Good momentum in LCD backlight businesses. Is well diversified in sales mix, and valuation remains compelling relative to forecast earnings growth.
Thailand Asia Property XPPKF C-1-7 4.0 231 7.6 32.5 1.8 5.4 24.0 Residential supply is forecast to contract in 2006 while demand is stabilising and beginning to rise. Interest rates are close to their peak. Valuations are undemanding
Thailand Bangkok Bank BKKLF C-1-7 114.0 5,590 10.9 -5.9 1.6 3.6 15.3 Top bank exposure in Thailand due to improving NIM and improving asset quality (post TPI debt work-out).
Source: Merrill Lynch Asia Pacific Equity Strategy Group, Thomson Financial DataStream

Asian Insights – 2 February 2006
Refer to important disclosures on page 52. 41
� Foreign Net Buying & Selling
Korea
Taiwan
-0.5
-0.4
-0.3
-0.2
-0.1
0.0
0.1
0.2
0.3
0.4
0.5
Jan-04 Mar-04 May-04 Jul-04 Sep-04 Nov-04 Jan-05 Mar-05 May-05 Jul-05 Sep-05 Nov-05 Jan-06
US$bn
700.0
800.0
900.0
1000.0
1100.0
1200.0
1300.0
1400.0
1500.0
Korea net buying & selling weekly avg (US$ bn) KOSPI (RHS)
-600.0
-400.0
-200.0
0.0
200.0
400.0
600.0
800.0
1000.0
Jan-04 Apr-04 Jun-04 Sep-04 Dec-04 Mar-05 Jun-05 Sep-05 Dec-05
(US$mn)
5000.0
5500.0
6000.0
6500.0
7000.0
7500.0
net buying & selling weekly avg in Taiwan (US$mn) TAIEX (RHS)
Source: Bloomberg, Thomson Financial DataStream Source: Bloomberg, Thomson Financial DataStream
Thailand
Indonesia
-150.0
-100.0
-50.0
0.0
50.0
100.0
150.0
200.0
250.0
300.0
Jan-04 Feb-04 Apr-04 Jun-04 Jul-04 Sep-04 Nov-04 Jan-05 Feb-05 Apr-05 Jun-05 Aug-05 Sep-05 Nov-05 Jan-06
US$mn
550.0
600.0
650.0
700.0
750.0
800.0
Thailand weekly average net buying & selling (US$mn) Bangkok SET (RHS)
(2,500.0)
(2,000.0)
(1,500.0)
(1,000.0)
(500.0)
-
500.0
Jan-04 Mar-04 May-04 Aug-04 Oct-04 Jan-05 Mar-05 Jun-05
(US$mn)
650.0
750.0
850.0
950.0
1050.0
1150.0
1250.0
net buying & selling weekly rolling (US$mn) JCI (RHS)
Source: Bloomberg, Thomson Financial DataStream Source: Bloomberg, Thomson Financial DataStream
India
Philippines
-150.0
-100.0
-50.0
0.0
50.0
100.0
150.0
200.0
250.0
300.0
Jan-
04
Mar-
04
Apr-
04
Jun-
04
Aug-
04
Oct-
04
Dec-
04
Feb-
05
Apr-
05
Jun-
05
Aug-
05
Oct-
05
Dec-
05
Jan-
06
(US$mn)
4500.0
5000.0
5500.0
6000.0
6500.0
7000.0
7500.0
8000.0
8500.0
9000.0
9500.0
10000.0
India weekly average net buying & selling (US$mn) India Sensex (RHS)
-20.0
-10.0
0.0
10.0
20.0
30.0
40.0
Jan-04 Mar-04 Jun-04 Sep-04 Dec-04 Mar-05 Jun-05 Sep-05 Dec-05
(US$mn)
1300.0
1400.0
1500.0
1600.0
1700.0
1800.0
1900.0
2000.0
2100.0
2200.0
2300.0
Philippines net buying/selling weekly average (US$mn) PSE Index (RHS)
Source: Bloomberg, Thomson Financial DataStream Source: Bloomberg, Thomson Financial DataStream

Asian Insights – 2 February 2006
42 Refer to important disclosures on page 52.
Foreign Net Buying & Selling as of Jan 26, 06
Foreign Net Buying & Selling (US$mn) Abs. Performance (%)
1wk 1mth 3mth 6mth 1wk 1mth 3mth 6mth
India (21) 733 3,612 3,896 2.5 6.6 21.5 28.2
Indonesia 52 242 862 1,356 (0.3) 5.9 15.5 4.1
Korea 1,885 1,640 1,104 (2,153) (0.6) (1.1) 14.7 24.0
Philippines 3 23 70 156 0.4 0.3 9.5 8.1
Taiwan (663) 5,422 13,409 12,459 0.3 (0.0) 14.6 2.6
Thailand 292 1,788 2,306 1,913 2.2 8.5 11.1 15.9
MSCI Far East F x JP 1.2 5.3 18.7 13.4
Source: Bloomberg
� Asian Markets Turnover
Asia Pacific x JP Market Turnover
6.0
7.0
8.0
9.0
10.0
11.0
12.0
13.0
14.0
15.0
Sep-03 Nov-03 Feb-04 May-04 Aug-04 Oct-04 Jan-05 Apr-05 Jul-05 Sep-05 Dec-05
(US$bn)
190.0
210.0
230.0
250.0
270.0
290.0
310.0
330.0
350.0
Asia Pac x Jp - mthly avg daily turnover (US$bn) MSCI AC Asia Pac x JP (RHS)
Source: Thomson Financial DataStream
Asian Markets Turnover as of Jan 26, 06
% of Mkt Share
Country Mthly Avg Turnover (US$mn) 1mth 3mth 6mth
Hong Kong 3,659 18.4 18.8 20.1
South Korea 5,015 27.1 23.3 20.6
Taiwan 3,938 18.8 17.3 19.2
Indonesia 168 0.9 1.3 1.4
Malaysia 121 1.1 1.1 1.1
Philippines 19 0.2 0.1 0.2
Singapore 424 2.6 3.0 3.2
Thailand 414 1.4 1.9 2.0
Australia 2,408 21.4 22.7 22.4
India 463 3.3 3.1 3.1
Pakistan 545 4.2 4.2 3.4
Source: Merrill Lynch Asia Pacific Equity Strategy Group

Asian Insights – 2 February 2006
Refer to important disclosures on page 52. 43
� North Asia, Australia & India Turnover
China – H-Share Index
Korea
0.0
0.1
0.2
0.3
0.4
0.5
0.6
0.7
Jan-03 Mar-03 Jun-03 Sep-03 Dec-03 Mar-04 Jun-04 Sep-04 Dec-04 Mar-05 Jun-05 Sep-05
(US$bn)
2000.0
3000.0
4000.0
5000.0
6000.0
H shares - mthly avg daily turnover (US$bn) H-Index (RHS)
1.0
1.5
2.0
2.5
3.0
3.5
4.0
4.5
5.0
5.5
Jan-04 Mar-04 Jun-04 Sep-04 Dec-04 Feb-05 May-05 Aug-05 Nov-05 Jan-06
(US$bn)
650.0
750.0
850.0
950.0
1050.0
1150.0
1250.0
1350.0
1450.0
1550.0
Korea - mthly avg daily turnover (US$bn) KOSPI (RHS)
Source: Thomson Financial DataStream Source: Thomson Financial DataStream
Hong Kong
Taiwan
1.2
1.7
2.2
2.7
3.2
3.7
4.2
Sep-03 Nov-03 Feb-04 May-04 Aug-04 Oct-04 Jan-05 Apr-05 Jul-05 Sep-05 Dec-05
(US$bn)
10500.0
11500.0
12500.0
13500.0
14500.0
15500.0
16500.0
HK - mthly avg daily turnover (US$bn) Hang Seng (RHS)
1.0
1.5
2.0
2.5
3.0
3.5
4.0
4.5
5.0
May-04 Jul-04 Oct-04 Jan-05 Apr-05 Jun-05 Sep-05 Dec-05
(US$bn)
5200.0
5400.0
5600.0
5800.0
6000.0
6200.0
6400.0
6600.0
6800.0
7000.0
Taiwan - mthly avg daily turnover (US$bn) TWSE (RHS)
Source: Thomson Financial DataStream Source: Thomson Financial DataStream
Australia
India
1.0
1.5
2.0
2.5
3.0
3.5
Sep-03 Nov-03 Feb-04 May-04 Aug-04 Oct-04 Jan-05 Apr-05 Jul-05 Sep-05 Dec-05
(US$bn)
3150.0
3350.0
3550.0
3750.0
3950.0
4150.0
4350.0
4550.0
4750.0
4950.0
5150.0
Australia - mthly avg daily turnover (US$bn) ASX (RHS)
0.1
0.2
0.3
0.4
0.5
0.6
0.7
0.8
0.9
1.0
1.1
Sep-03 Nov-03 Feb-04 May-04 Aug-04 Oct-04 Jan-05 Apr-05 Jul-05 Sep-05 Dec-05
(US$bn)
4000.0
5000.0
6000.0
7000.0
8000.0
9000.0
10000.0
11000.0
India trading value (US$bn) India Sensex (RHS)
Source: Thomson Financial DataStream Source: Thomson Financial DataStream

Asian Insights – 2 February 2006
44 Refer to important disclosures on page 52.
� South East Asia Markets Turnover
Indonesia
Philippines
20.0
70.0
120.0
170.0
220.0
270.0
320.0
370.0
420.0
470.0
Sep-03 Nov-03 Feb-04 May-04 Aug-04 Oct-04 Jan-05 Apr-05 Jul-05 Sep-05 Dec-05
(US$mn)
500.0
600.0
700.0
800.0
900.0
1000.0
1100.0
1200.0
1300.0
Indonesia - mthly avg daily turnover (US$mn) Jakarta Composite (RHS)
5.0
10.0
15.0
20.0
25.0
30.0
35.0
Sep-03 Nov-03 Feb-04 May-04 Aug-04 Oct-04 Jan-05 Apr-05 Jul-05 Sep-05 Dec-05
(US$mn)
1100.0
1300.0
1500.0
1700.0
1900.0
2100.0
2300.0
Philippines - mthly avg daily turnover (US$mn) PSE Composite (RHS)
Source: Thomson Financial DataStream Source: Thomson Financial DataStream
Malaysia
Singapore
75.0
95.0
115.0
135.0
155.0
175.0
195.0
215.0
235.0
255.0
275.0
Sep-03 Nov-03 Feb-04 May-04 Aug-04 Oct-04 Jan-05 Apr-05 Jul-05 Sep-05 Dec-05
(US$mn)
720.0
760.0
800.0
840.0
880.0
920.0
960.0
1000.0
Malaysia - mthly avg daily turnover (US$mn) KLCI (RHS)
0.15
0.20
0.25
0.30
0.35
0.40
0.45
0.50
0.55
0.60
Sep-03 Nov-03 Feb-04 May-04 Aug-04 Oct-04 Jan-05 Apr-05 Jul-05 Sep-05 Dec-05
(US$bn)
1500.0
1600.0
1700.0
1800.0
1900.0
2000.0
2100.0
2200.0
2300.0
2400.0
2500.0
Singapore - mthly avg daily turnover (US$bn) STI (RHS)
Source: Thomson Financial DataStream Source: Thomson Financial DataStream
Thailand
Pakistan
100.0
200.0
300.0
400.0
500.0
600.0
700.0
Sep-03 Nov-03 Feb-04 May-04 Aug-04 Oct-04 Jan-05 Apr-05 Jul-05 Sep-05 Dec-05
(US$mn)
500
550
600
650
700
750
800
850
Thailand - mthly avg daily turnover (US$mn) Bangkok SET (RHS)
100.0
300.0
500.0
700.0
900.0
1100.0
1300.0
1500.0
1700.0
Jan-05 Mar-05 Jun-05 Sep-05 Dec-05
(US$mn)
6000.0
7000.0
8000.0
9000.0
10000.0
11000.0
Pakistan - mthly avg daily turnover (US$mn) Karachi 100 (RHS)
Source: Thomson Financial DataStream Source: Thomson Financial DataStream

Asian Insights – 2 February 2006
Refer to important disclosures on page 52. 45
� North Asia, Australia & India PE & PB relative to Asia Pac x JP
China
Korea
0.2
0.3
0.4
0.5
0.6
0.7
0.8
0.9
1.0
1.1
1.2
Jan-98 Jan-99 Jan-00 Jan-01 Jan-02 Jan-03 Jan-04 Jan-05 Jan-06
(x)
China PB rel MSCI Asia Pac f ex Jp PB China forward PE rel MSCI Asia Pac f ex Jp forward PE
0.5
0.6
0.7
0.8
0.9
1.0
1.1
1.2
Jan-00 Jan-01 Jan-02 Jan-03 Jan-04 Jan-05 Jan-06
(x)
Korea PB rel MSCI Asia Pac f ex Jp PB Korea PE rel MSCI Asia Pac f ex Jp PE
Source: Merrill Lynch Asia Pacific Equity Strategy Group Source: Merrill Lynch Asia Pacific Equity Strategy Group
Hong Kong
Taiwan
0.4
0.6
0.8
1.0
1.2
1.4
1.6
Jan-98 Jan-99 Jan-00 Jan-01 Jan-02 Jan-03 Jan-04 Jan-05 Jan-06
(x)
HK PB rel MSCI Asia Pac f ex Jp PB HK PE rel MSCI Asia Pac f ex Jp PE
0.5
1.0
1.5
2.0
2.5
3.0
Jan-98 Jan-99 Jan-00 Jan-01 Jan-02 Jan-03 Jan-04 Jan-05 Jan-06
(x)
Taiwan PB rel MSCI Asia Pac f ex Jp PB Taiwan PE rel MSCI Asia Pac f ex Jp PE
Source: Merrill Lynch Asia Pacific Equity Strategy Group Source: Merrill Lynch Asia Pacific Equity Strategy Group
Australia
India
0.5
0.7
0.9
1.1
1.3
1.5
1.7
1.9
2.1
2.3
2.5
Jan-98 Jan-99 Jan-00 Jan-01 Jan-02 Jan-03 Jan-04 Jan-05 Jan-06
(x)
Australia PB rel MSCI Asia Pac f ex Jp PB Australia PE rel MSCI Asia Pac f ex Jp PE
0.5
1.0
1.5
2.0
2.5
3.0
Jan-98 Jan-99 Jan-00 Jan-01 Jan-02 Jan-03 Jan-04 Jan-05 Jan-06
(x)
0.5
0.7
0.9
1.1
1.3
1.5
1.7
(x)
India PB rel MSCI Asia Pac f ex Jp PB India PE rel MSCI Asia Pac f ex Jp PE (RHS)
Source: Merrill Lynch Asia Pacific Equity Strategy Group Source: Merrill Lynch Asia Pacific Equity Strategy Group
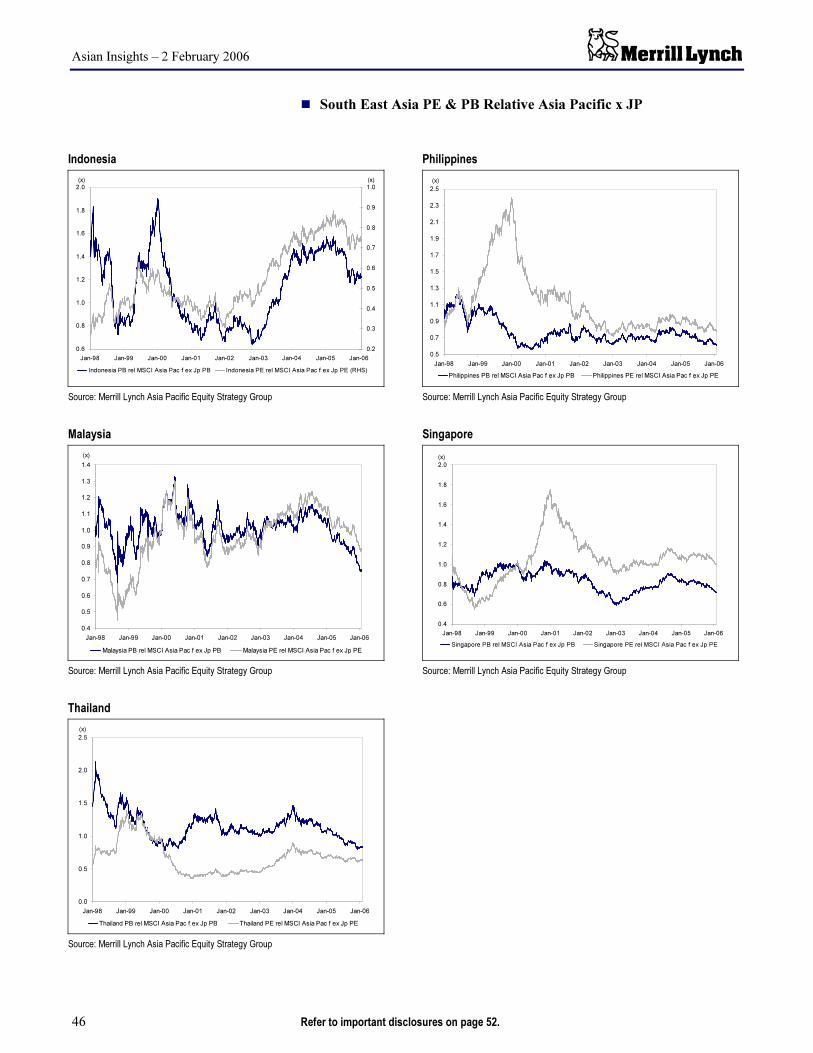
Asian Insights – 2 February 2006
46 Refer to important disclosures on page 52.
� South East Asia PE & PB Relative Asia Pacific x JP
Indonesia
Philippines
0.6
0.8
1.0
1.2
1.4
1.6
1.8
2.0
Jan-98 Jan-99 Jan-00 Jan-01 Jan-02 Jan-03 Jan-04 Jan-05 Jan-06
(x)
0.2
0.3
0.4
0.5
0.6
0.7
0.8
0.9
1.0(x)
Indonesia PB rel MSCI Asia Pac f ex Jp PB Indonesia PE rel MSCI Asia Pac f ex Jp PE (RHS)
0.5
0.7
0.9
1.1
1.3
1.5
1.7
1.9
2.1
2.3
2.5
Jan-98 Jan-99 Jan-00 Jan-01 Jan-02 Jan-03 Jan-04 Jan-05 Jan-06
(x)
Philippines PB rel MSCI Asia Pac f ex Jp PB Philippines PE rel MSCI Asia Pac f ex Jp PE
Source: Merrill Lynch Asia Pacific Equity Strategy Group Source: Merrill Lynch Asia Pacific Equity Strategy Group
Malaysia
Singapore
0.4
0.5
0.6
0.7
0.8
0.9
1.0
1.1
1.2
1.3
1.4
Jan-98 Jan-99 Jan-00 Jan-01 Jan-02 Jan-03 Jan-04 Jan-05 Jan-06
(x)
Malaysia PB rel MSCI Asia Pac f ex Jp PB Malaysia PE rel MSCI Asia Pac f ex Jp PE
0.4
0.6
0.8
1.0
1.2
1.4
1.6
1.8
2.0
Jan-98 Jan-99 Jan-00 Jan-01 Jan-02 Jan-03 Jan-04 Jan-05 Jan-06
(x)
Singapore PB rel MSCI Asia Pac f ex Jp PB Singapore PE rel MSCI Asia Pac f ex Jp PE
Source: Merrill Lynch Asia Pacific Equity Strategy Group Source: Merrill Lynch Asia Pacific Equity Strategy Group
Thailand
0.0
0.5
1.0
1.5
2.0
2.5
Jan-98 Jan-99 Jan-00 Jan-01 Jan-02 Jan-03 Jan-04 Jan-05 Jan-06
(x)
Thailand PB rel MSCI Asia Pac f ex Jp PB Thailand PE rel MSCI Asia Pac f ex Jp PE
Source: Merrill Lynch Asia Pacific Equity Strategy Group
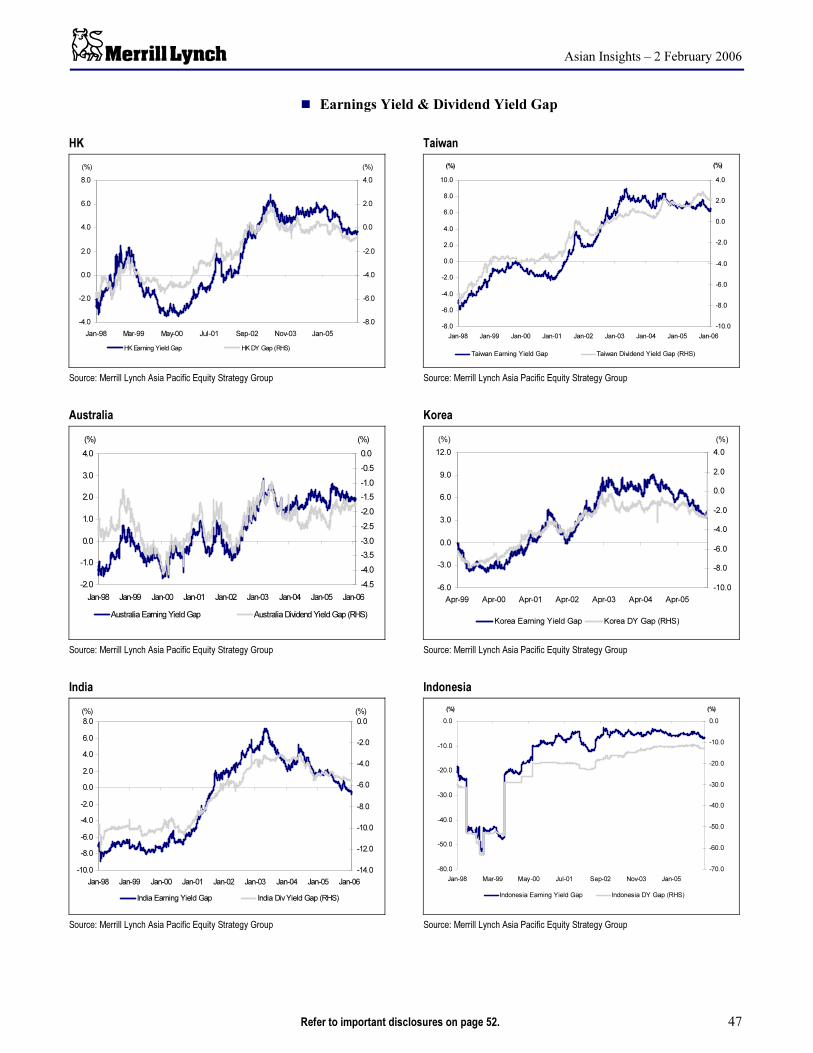
Asian Insights – 2 February 2006
Refer to important disclosures on page 52. 47
� Earnings Yield & Dividend Yield Gap
HK
Taiwan
-4.0
-2.0
0.0
2.0
4.0
6.0
8.0
Jan-98 Mar-99 May-00 Jul-01 Sep-02 Nov-03 Jan-05
(%)
-8.0
-6.0
-4.0
-2.0
0.0
2.0
4.0
(%)
HK Earning Yield Gap HK DY Gap (RHS)
-8.0
-6.0
-4.0
-2.0
0.0
2.0
4.0
6.0
8.0
10.0
Jan-98 Jan-99 Jan-00 Jan-01 Jan-02 Jan-03 Jan-04 Jan-05 Jan-06
(%)
-10.0
-8.0
-6.0
-4.0
-2.0
0.0
2.0
4.0
(%)
Taiwan Earning Yield Gap Taiwan Dividend Yield Gap (RHS)
Source: Merrill Lynch Asia Pacific Equity Strategy Group Source: Merrill Lynch Asia Pacific Equity Strategy Group
Australia
Korea
-2.0
-1.0
0.0
1.0
2.0
3.0
4.0
Jan-98 Jan-99 Jan-00 Jan-01 Jan-02 Jan-03 Jan-04 Jan-05 Jan-06
(%)
-4.5
-4.0
-3.5
-3.0
-2.5
-2.0
-1.5
-1.0
-0.5
0.0
(%)
Australia Earning Yield Gap Australia Dividend Yield Gap (RHS)
-6.0
-3.0
0.0
3.0
6.0
9.0
12.0
Apr-99 Apr-00 Apr-01 Apr-02 Apr-03 Apr-04 Apr-05
(%)
-10.0
-8.0
-6.0
-4.0
-2.0
0.0
2.0
4.0
(%)
Korea Earning Yield Gap Korea DY Gap (RHS)
Source: Merrill Lynch Asia Pacific Equity Strategy Group Source: Merrill Lynch Asia Pacific Equity Strategy Group
India
Indonesia
-10.0
-8.0
-6.0
-4.0
-2.0
0.0
2.0
4.0
6.0
8.0
Jan-98 Jan-99 Jan-00 Jan-01 Jan-02 Jan-03 Jan-04 Jan-05 Jan-06
(%)
-14.0
-12.0
-10.0
-8.0
-6.0
-4.0
-2.0
0.0
(%)
India Earning Yield Gap India Div Yield Gap (RHS)
-60.0
-50.0
-40.0
-30.0
-20.0
-10.0
0.0
Jan-98 Mar-99 May-00 Jul-01 Sep-02 Nov-03 Jan-05
(%)
-70.0
-60.0
-50.0
-40.0
-30.0
-20.0
-10.0
0.0
(%)
Indonesia Earning Yield Gap Indonesia DY Gap (RHS)
Source: Merrill Lynch Asia Pacific Equity Strategy Group Source: Merrill Lynch Asia Pacific Equity Strategy Group

Asian Insights – 2 February 2006
48 Refer to important disclosures on page 52.
� Earnings Yield & Dividend Yield Gap
Malaysia
Singapore
-2.0
-1.0
0.0
1.0
2.0
3.0
4.0
5.0
Jul-01 Jan-02 Jul-02 Jan-03 Jul-03 Jan-04 Jul-04 Jan-05 Jul-05 Jan-06
(%)
-6.0
-5.0
-4.0
-3.0
-2.0
-1.0
0.0
1.0
2.0
3.0
4.0
(%)
Malaysia Earning Yield Gap Malaysia DY Gap (RHS)
-2.0
0.0
2.0
4.0
6.0
8.0
10.0
Jan-98 Jan-99 Jan-00 Jan-01 Jan-02 Jan-03 Jan-04 Jan-05 Jan-06
(%)
-3.0
-2.0
-1.0
0.0
1.0
2.0
3.0
(%)
Singapore Earning Yield Gap Singapore DY Gap (RHS)
Source: Merrill Lynch Asia Pacific Equity Strategy Group Source: Merrill Lynch Asia Pacific Equity Strategy Group
Philippines
Thailand
-10.0
-8.0
-6.0
-4.0
-2.0
0.0
2.0
4.0
6.0
Jul-98 Jul-99 Jul-00 Jul-01 Jul-02 Jul-03 Jul-04 Jul-05
(%)
-18.0
-16.0
-14.0
-12.0
-10.0
-8.0
-6.0
-4.0
-2.0
0.0
(%)
Philippines Earning Yield Gap Philippines DY Gap (RHS)
-10.0
-5.0
0.0
5.0
10.0
15.0
Mar-99 Mar-00 Mar-01 Mar-02 Mar-03 Mar-04 Mar-05
(%)
-10.0
-8.0
-6.0
-4.0
-2.0
0.0
2.0
(%)
Thailand Earning Yield Gap Thailand DY Gap (RHS)
Source: Merrill Lynch Asia Pacific Equity Strategy Group Source: Merrill Lynch Asia Pacific Equity Strategy Group

Asian Insights – 2 February 2006
Refer to important disclosures on page 52. 49
Country Correlation Table – Correlation since Jan 1, 2002 (weekly return)
Aust China HK India Indon Korea Mal Pak Philip Sing Taiwan Thailand US-DJ US-Nasdaq US-S&P500 Japan
Australia 1.00 0.36 0.51 0.33 0.30 0.51 0.32 0.10 0.26 0.46 0.42 0.32 0.48 0.50 0.51 0.51
China 0.36 1.00 0.65 0.52 0.35 0.45 0.31 0.10 0.15 0.47 0.44 0.52 0.29 0.30 0.30 0.32
HK 0.51 0.65 1.00 0.46 0.32 0.59 0.40 0.04 0.18 0.63 0.58 0.38 0.46 0.52 0.48 0.55
India 0.33 0.52 0.46 1.00 0.32 0.45 0.23 0.13 0.18 0.43 0.37 0.34 0.27 0.32 0.28 0.36
Indonesia 0.30 0.35 0.32 0.32 1.00 0.41 0.39 0.13 0.30 0.39 0.35 0.39 0.14 0.20 0.15 0.33
Korea 0.51 0.45 0.59 0.45 0.41 1.00 0.35 0.10 0.23 0.58 0.60 0.40 0.43 0.45 0.45 0.60
Malaysia 0.32 0.31 0.40 0.23 0.39 0.35 1.00 0.08 0.26 0.46 0.42 0.37 0.22 0.24 0.21 0.32
Pakistan 0.10 0.10 0.04 0.13 0.13 0.10 0.08 1.00 0.06 0.17 0.16 0.10 0.03 0.00 0.01 0.08
Philippines 0.26 0.15 0.18 0.18 0.30 0.23 0.26 0.06 1.00 0.31 0.21 0.32 0.09 0.13 0.10 0.22
Singapore 0.46 0.47 0.63 0.43 0.39 0.58 0.46 0.17 0.31 1.00 0.57 0.46 0.41 0.45 0.41 0.53
Taiwan 0.42 0.44 0.58 0.37 0.35 0.60 0.42 0.16 0.21 0.57 1.00 0.42 0.41 0.51 0.44 0.52
Thailand 0.32 0.52 0.38 0.34 0.39 0.40 0.37 0.10 0.32 0.46 0.42 1.00 0.23 0.25 0.22 0.32
US – DJ 0.48 0.29 0.46 0.27 0.14 0.43 0.22 0.03 0.09 0.41 0.41 0.23 1.00 0.83 0.97 0.34
US - Nasdaq 0.50 0.30 0.52 0.32 0.20 0.45 0.24 0.00 0.13 0.45 0.51 0.25 0.83 1.00 0.89 0.40
US - S&P500 0.51 0.30 0.48 0.28 0.15 0.45 0.21 0.01 0.10 0.41 0.44 0.22 0.97 0.89 1.00 0.35
Japan 0.51 0.32 0.55 0.36 0.33 0.60 0.32 0.08 0.22 0.53 0.52 0.32 0.34 0.40 0.35 1.00
Source: Thomson Financial DataStream, Merrill Lynch Asia Pacific Equity Strategy Group

Asian Insights – 2 February 2006
50 Refer to important disclosures on page 52.
Recent Strategy Research
For background here are some of our most recently published views on equity
strategy for Asia.
Recently published strategy views :
Asian Model Portfolio – Four Themes, Thirty Two Stocks 10 January, 06
Pac Rim Year Ahead 09 January , 06
Market Momentum and Inflection Points 20 Dec ember, 05
Taiwan – More Promise, More Delivery 06 December, 05
Source: Merrill Lynch Asia Pacific Equity Strategy Group
HK’s Performance Relative to Singapore
Korea’s Performance Relative to Taiwan
2000 2001 2002 2003 2004 2005 2006
5.50
6.00
6.50
7.00
7.50
8.00
8.50
9.00
HK Hang Seng rel Singapore STI
Source: DATASTREAM
2000 2001 2002 2003 2004 2005 2006
0.06
0.08
0.10
0.12
0.14
0.16
0.18
0.20
0.22
KORCOMP/TAIWGHT
HIGH 0.21 27/1/06,LOW 0.08 26/5/00,LAST 0.21 27/1/06Source: DATASTREAM
Source: Thomson Financial DataStream Source: Thomson Financial DataStream
China’s Performance Relative to India
IT’s Performance Relative to Utilities
2000 2001 2002 2003 2004 2005 2006
0.20
0.30
0.40
0.50
0.60
0.70
0.80
0.90
1.00
HK H-Shares rel India SENSEX
Source: DATASTREAM
2000 2001 2002 2003 2004 2005 2006
1.00
1.50
2.00
2.50
3.00
3.50
MSCI Asia Pac x JP IT rel MSCI Asia Pac x JP Utilities
Source: DATASTREAM
Source: Thomson Financial DataStream Source: Thomson Financial DataStream

Asian Insights – 2 February 2006
Refer to important disclosures on page 52. 51
Analyst Certification
I, Spencer White, Alistair Scarff, Stephen Corry & Willie Chan, hereby certify
that the views expressed in this research report accurately reflect my personal
views about the subject securities and issuers. I also certify that no part of my
compensation was, is, or will be, directly or indirectly, related to the specific
recommendations or view expressed in this research report.
Note to Readers
Due to the nature of strategic analysis, the issuers or securities recommended or
discussed in this report are not continuously followed. Accordingly, investors
must regard this report as providing stand-alone analysis and should not expect
continuing analysis or additional reports relating to such issuers and/or securities.
Merrill Lynch makes no representation or warranties whatsoever as to the data and
information provided in any referenced website and shall have no liability or
responsibility arising out of or in connection with any referenced website.

Asian Insights – 2 February 2006
52 Refer to important disclosures on page 52.
Important Disclosures
Investment Rating Distribution: Global Group (as of 31 December 2005) Coverage Universe Count Percent Inv. Banking Relationships* Count Percent
Buy 1119 40.44% Buy 376 33.60%
Neutral 1429 51.64% Neutral 401 28.06% Sell 219 7.91% Sell 44 20.09%
* Companies in respect of which MLPF&S or an affiliate has received compensation for investment banking services within the past 12 months.
FUNDAMENTAL EQUITY OPINION KEY: Opinions include a Volatility Risk Rating, an Investment Rating and an Income Rating. VOLATILITY RISK RATINGS, indicators of potential price fluctuation, are: A - Low, B - Medium, and C - High. INVESTMENT RATINGS, indicators of expected total return (price appreciation plus yield) within the 12-month period from the date of the initial rating, are: 1 - Buy (10% or more for Low and Medium Volatility Risk Securities - 20% or more for High Volatility Risk securities); 2 - Neutral (0-10% for Low and Medium Volatility Risk securities - 0-20% for High Volatility Risk securities); 3 - Sell (negative return); and 6 - No Rating. INCOME RATINGS, indicators of potential cash dividends, are: 7 - same/higher (dividend considered to be secure); 8 - same/lower (dividend not considered to be secure); and 9 - pays no cash dividend.
The analyst(s) responsible for covering the securities in this report receive compensation based upon, among other factors, the overall profitability of Merrill
Lynch, including profits derived from investment banking revenues.
Other Important Disclosures
Copyright, User Agreement and other general information related to this report: Copyright 2006 Merrill Lynch, Pierce, Fenner & Smith Incorporated. All rights reserved. This research report is prepared for the use of Merrill Lynch clients and may not be redistributed, retransmitted or disclosed, in whole or in part, or in any form or manner, without the express written consent of Merrill Lynch. Merrill Lynch research reports are distributed simultaneously to internal and client websites eligible to receive such research prior to any public dissemination by Merrill Lynch of the research report or information or opinion contained therein. Any unauthorized use or disclosure is prohibited. Receipt and review of this research report constitutes your agreement not to redistribute, retransmit, or disclose to others the contents, opinions, conclusion, or information contained in this report (including any investment recommendations, estimates or price targets) prior to Merrill Lynch's public disclosure of such information. The information herein (other than disclosure information relating to Merrill Lynch and its affiliates) was obtained from various sources and we do not guarantee its accuracy.
This research report provides general information only. Neither the information nor any opinion expressed constitutes an offer, or an invitation to make an offer, to buy or sell any securities or other investment or any options, futures or derivatives related to securities or investments. It is not intended to provide personal investment advice and it does not take into account the specific investment objectives, financial situation and the particular needs of any specific person who may receive this report. Investors should seek financial advice regarding the appropriateness of investing in any securities, other investment or investment strategies discussed or recommended in this report and should understand that statements regarding future prospects may not be realized. Investors should note that income from such securities or other investments, if any, may fluctuate and that price or value such securities and investments may rise or fall. Accordingly, investors may receive back less than originally invested. Past performance is not necessarily a guide to future performance.
Neither the information nor any opinion expressed constitutes an offer to buy or sell any securities or options or futures contracts. Foreign currency rates of exchange may adversely affect the value, price or income of any security or related investment mentioned in this report. In addition, investors in
securities such as ADRs, whose values are influenced by the currency of the underlying security, effectively assume currency risk. UK readers: MLPFS or an affiliate is a liquidity provider for the securities discussed in this report. Merrill Lynch Research policies relating to conflicts of interest are
described at http://www.ml.com/media/43347.pdf. Information relating to Non-US affiliates of Merrill Lynch, Pierce, Fenner & Smith Incorporated (MLPF&S): MLPF&S distributes research reports of the following non-US
affiliates in the US (short name: legal name): Merrill Lynch (France): Merrill Lynch Capital Markets (France) SAS; Merrill Lynch Dublin (Frankfurt Branch): Merrill Lynch CMB Ltd, Dublin, Frankfurt Branch; Merrill Lynch (South Africa): Merrill Lynch South Africa (Pty) Ltd; Merrill Lynch (Milan): Merrill Lynch Capital Markets Bank Limited; MLPF&S (UK): Merrill Lynch, Pierce, Fenner & Smith Limited; Merrill Lynch (Australia): Merrill Lynch Equities (Australia) Limited; Merrill Lynch (Hong Kong): Merrill Lynch (Asia Pacific) Limited; Merrill Lynch (Singapore): Merrill Lynch (Singapore) Pte Ltd; Merrill Lynch (Canada): Merrill Lynch Canada Inc; Merrill Lynch (Mexico): Merrill Lynch Mexico, SA de CV, Casa de Bolsa; Merrill Lynch (Argentina): Merrill Lynch Argentina SA; Merrill Lynch (Brazil): Banco Merrill Lynch de Investimentos SA; Merrill Lynch (Japan): Merrill Lynch Japan Securities Co, Ltd; Merrill Lynch (Seoul): Merrill Lynch International Incorporated (Seoul Branch); Merrill Lynch (Taiwan): Merrill Lynch Taiwan Limited; DSP Merrill Lynch (India): DSP Merrill Lynch Limited; PT Merrill Lynch (Indonesia): PT Merrill Lynch Indonesia; Merrill Lynch (Israel): Merrill Lynch Israel Limited.
Fundamental equity reports are produced on a regular basis as necessary to keep the investment recommendation current. This research report has been prepared and issued by MLPF&S and/or one or more of its non-US affiliates. MLPF&S is the distributor of this research report in the US
and accepts full responsibility for research reports of its non-US affiliates distributed in the US. Any US person receiving this research report and wishing to effect any transaction in any security discussed in the report should do so through MLPF&S and not such foreign affiliates.
This research report has been approved for publication in the United Kingdom by Merrill Lynch, Pierce, Fenner & Smith Limited, which is authorized and regulated by the Financial Services Authority; has been considered and distributed in Japan by Merrill Lynch Japan Securities Co, Ltd, a registered securities dealer under the Securities and Exchange Law in Japan; is distributed in Hong Kong by Merrill Lynch (Asia Pacific) Limited, which is regulated by the Hong Kong SFC; and is issued and distributed in Singapore by Merrill Lynch International Bank Limited (Merchant Bank) and Merrill Lynch (Singapore) Pte Ltd (Company Registration No. 198602883D). Merill Lynch International Bank Limited and Merrill Lynch (Singapore) Pte Ltd. are regulated by the Monetary Authority of Singapore. Merrill Lynch Equities (Australia) Limited, (ABN 65 006 276 795), AFS License 235132, provides this report in Australia. No approval is required for publication or distribution of this report in Brazil.