Embed Size (px)
Citation preview
Fall 2011 Duration and Term Structure Prof. Page
BUSM 411: Derivatives and Fixed Income
6. Duration and Convexity
6.1. Interest rate sensitivity
• Bond prices and yields are inversely related: as yields increase, bond prices fall and
vice versa
• An increase in a bond’s yield to maturity results in a smaller price change than a equal
decrease in yield (convexity)
• Prices of long-term bonds tend to be more sensitive to interest rate changes than prices
of short-term bonds
• The sensitivity of bond prices to changes in yields increases at a decreasing rate as
maturity increases
• Interest rate risk is inversely related to the bond’s coupon rate: high-coupon bonds are
less sensitive to changes in interest rates than low-coupon bonds
• The sensitivity of a bond’s price to yield changes is inversely related to the yield at
which the bond currently sells
1
Fall 2011 Duration and Term Structure Prof. Page
6.2. Duration
• Maturity is the key determinant of a bond’s interest rate risk
• Even the relation between coupon rates and interest rate sensitivity really boils down
to maturity:
– Bonds with higher coupons have more of their cash flows occurring at shorter
horizons relative to low or zero coupon bonds
– Hence, high coupon bonds have a lower effective maturity
• Duration is a measure of the effective maturity of a bond or portfolio of bonds
• Duration combines the effects of coupon rates and actual maturity into a summary
measure of interest rate risk
• Macaulay duration is simply a weighted average of the horizons of each of the bonds
cash flows, weighted by their present value:
D =T∑t=1
t
(CFt/(1 + y)t
Bond price
)
where CFt is the cash flow in period t.
• Duration tells us how much a bond’s price changes for a given change in (gross) yields:
∆B
B= −D
[∆(1 + y)
(1 + y)
]
• Practitioners often express this in a simpler, more intuitive form by defining modified
duration, D∗ = D/(1 + y), so that
∆B
B= −D∗∆y
2
Fall 2011 Duration and Term Structure Prof. Page
6.3. Properties of duration
• The duration of a zero coupon bond equals its time to maturity
• Holding maturity constant,a bond’s duration is lower when the coupon rate is higher
• Holding coupon rate constant, duration increases with maturity
• Holding other factors constant, duration of a coupon bond is higher when yield to
maturity is lower
• Duration of perpetual bond is 1+yy
3
Fall 2011 Duration and Term Structure Prof. Page
6.4. Duration and convexity
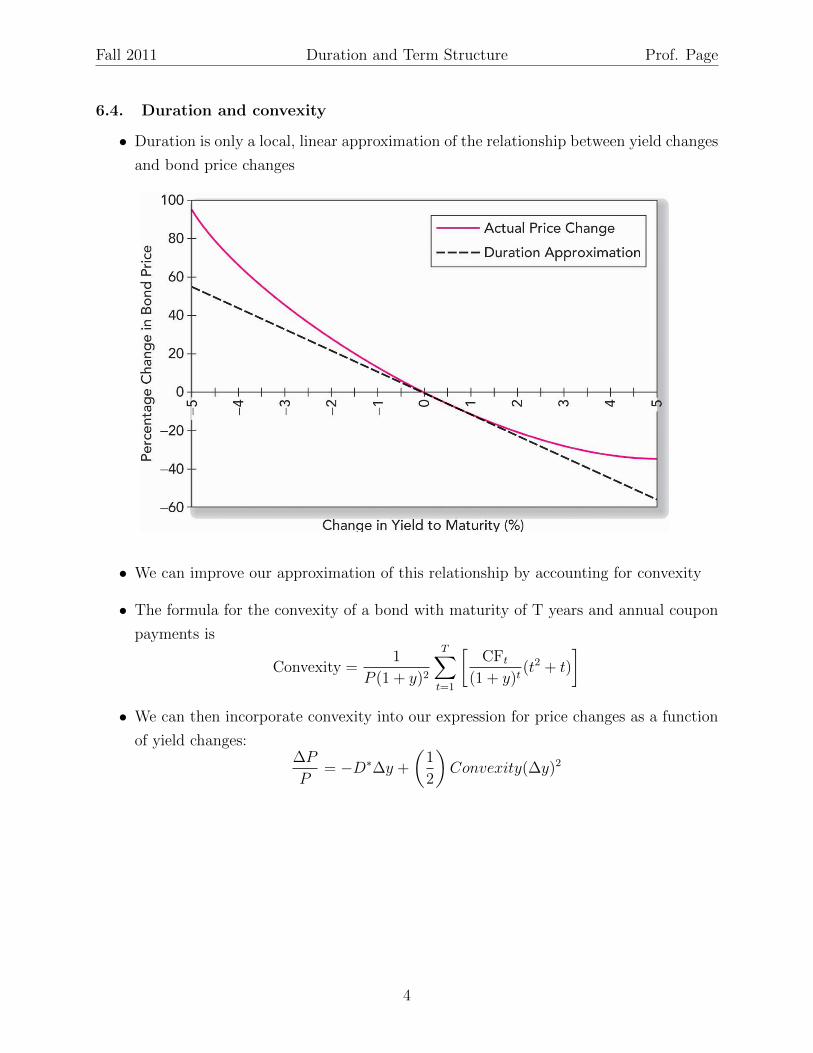
• Duration is only a local, linear approximation of the relationship between yield changes
and bond price changes
• We can improve our approximation of this relationship by accounting for convexity
• The formula for the convexity of a bond with maturity of T years and annual coupon
payments is
Convexity =1
P (1 + y)2
T∑t=1
[CFt
(1 + y)t(t2 + t)
]• We can then incorporate convexity into our expression for price changes as a function
of yield changes:∆P
P= −D∗∆y +
(1
2
)Convexity(∆y)2
4

Fall 2011 Duration and Term Structure Prof. Page
• Example:
– 30-year bond with 8% coupon, selling at initial yield to maturity of 8%
– Macaulay duration:
D =3∑
0t=1t
(CFt/(1 + y)t
$1000
)= 12.16
– Modified duration:
D∗ = D/(1 + .08) = 11.26
– Convexity:
Convexity =1
$1000(1.08)2
30∑t=1
[CFt
(1.08)t(t2 + t)
]= 212.4
– Suppose the yield increases from 8% to 10%:
Price =$80
.10
[1− 1
(1.10)30
]+
$1000
(1.10)30= $811.46
a decline of 18.85%
– The linear duration rules predicts a price change of
∆P
P= −D∗∆y = −11.26× .02 = −.2252 or − 22.52%
– Accounting for convexity gives
∆P
P= −D∗∆y+(
1
2)Convexity(∆y)2 = −11.26×.02+(
1
2)212.4(.02)2 = −.1827 or −18.27%
a much more accurate prediction.
5
Fall 2011 Duration and Term Structure Prof. Page
6.5. The Term-Structure of Interest Rates
6.5.1 The yield curve
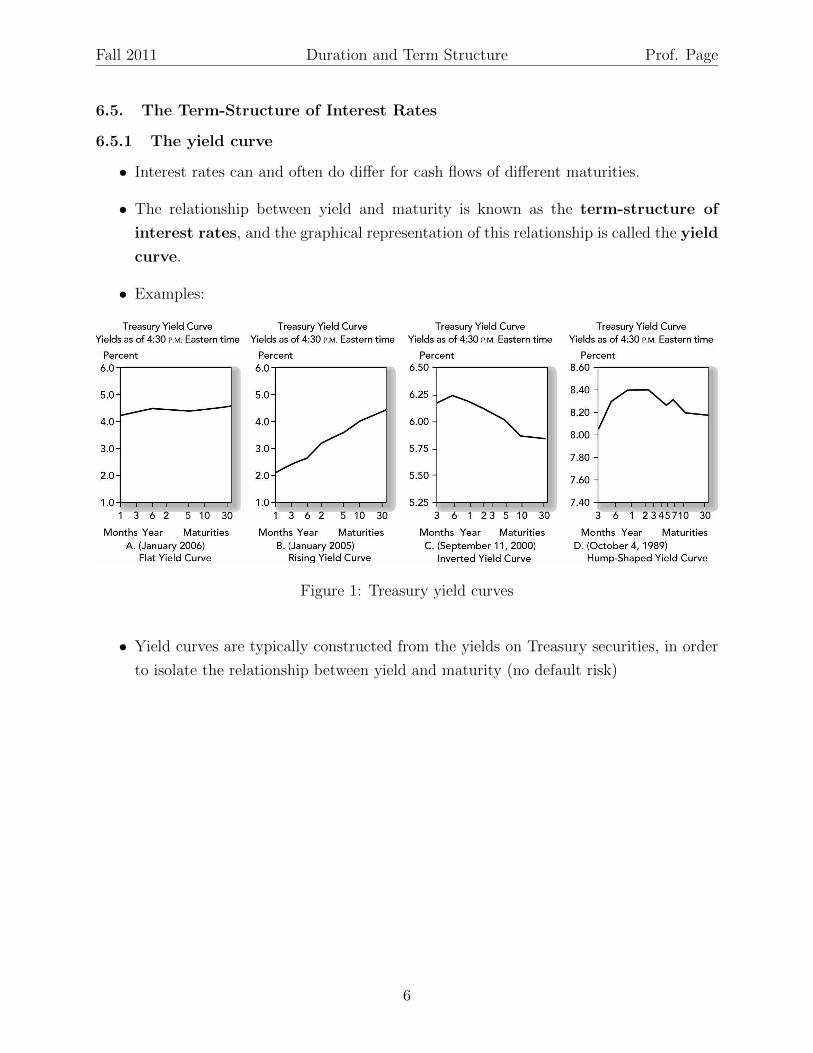
• Interest rates can and often do differ for cash flows of different maturities.
• The relationship between yield and maturity is known as the term-structure of
interest rates, and the graphical representation of this relationship is called the yield
curve.
• Examples:
Figure 1: Treasury yield curves
• Yield curves are typically constructed from the yields on Treasury securities, in order
to isolate the relationship between yield and maturity (no default risk)
6

Fall 2011 Duration and Term Structure Prof. Page
6.5.2 The yield curve and future interest rates
Where does the shape of the yield come from?
• Interest rate certainty (we know what the future path of interest rates will be):
– Suppose the yield curve is upward sloping as in the example above: the 1-year
yield is 5% and the 2-year yield is 6%.
– Consider two strategies: (i) buy a 2-year zero-coupon bond, or (ii) buy a 1-year
zero coupon bond and “roll it over” next year into another 1-year bond.
– If we invest the same initial amount (say $100) in both strategies, they must offer
the same return (or else we’d have an arbitrage opportunity, since neither strategy
involves any risk):
Buy & hold 2-year zero = Roll over 1-year bonds
$100× (1.06)2 = $100× (1.05)× (1 + r2)
– Solve for r2:
r2 =(1.06)2
(1.05)− 1 = .0701 or 7.01% > 5%
– Upward sloping yield curve means interest rates will rise!
– Spot rate: the current yield on a zero coupon bond of a given maturity. In the
example above, the 1-year spot rate is 5% and the 2-year spot rate is 6%.
– Short rate: the yield for a given time interval (say a year) at different points in
time. In the example above, today’s short rate is 5% and next year’s short rate
is 7.01%.
– More generally, we can find the short rate for n periods ahead using the formula:
(1 + rn) =(1 + yn)n
(1 + yn−1)n−1
• In reality, we don’t know future interest rates with certainty, so we refer to the interest
rate backed out in this manner the “forward rate.” The forward rate need not equal
the actual future short rate or even the expected future short rate if investors require
some sort of liquidity premium.
• Forward rates and interest rate risk:
7

Fall 2011 Duration and Term Structure Prof. Page
– Investors with short horizons prefer to “lock in” an interest rate by investing in
short-term bonds, rather than long-term bonds to be sold for an uncertain price
in the future.
– Short-term investors would require a “liquidity premium” to invest longer-term
bonds ⇒ forward rate is higher than expected future short rate
– Long-term investors would prefer to lock in long-term interest rates, rather than
subjecting themselves to interest rate risk by rolling over
– Forward rate is lower than expected short rate!
8
Fall 2011 Duration and Term Structure Prof. Page
6.5.3 Theories of the term structure
• Expectations hypothesis
– Slope of the yield curve is due to expectations of changes in short-term interest
rates
– Under this hypothesis, forward rate equals the market consensus expectation of
future short rate
– This can lead to either upward or downward sloping yield curves depending on
what the expectations of future short rates are
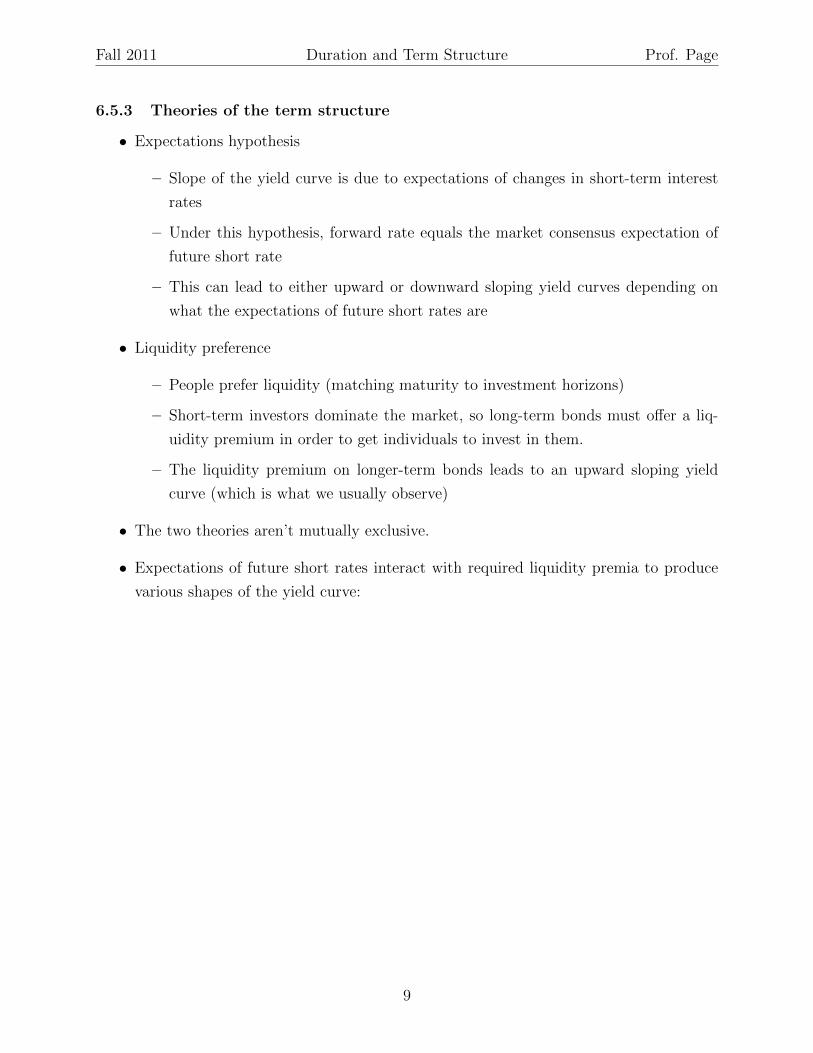
• Liquidity preference
– People prefer liquidity (matching maturity to investment horizons)
– Short-term investors dominate the market, so long-term bonds must offer a liq-
uidity premium in order to get individuals to invest in them.
– The liquidity premium on longer-term bonds leads to an upward sloping yield
curve (which is what we usually observe)
• The two theories aren’t mutually exclusive.
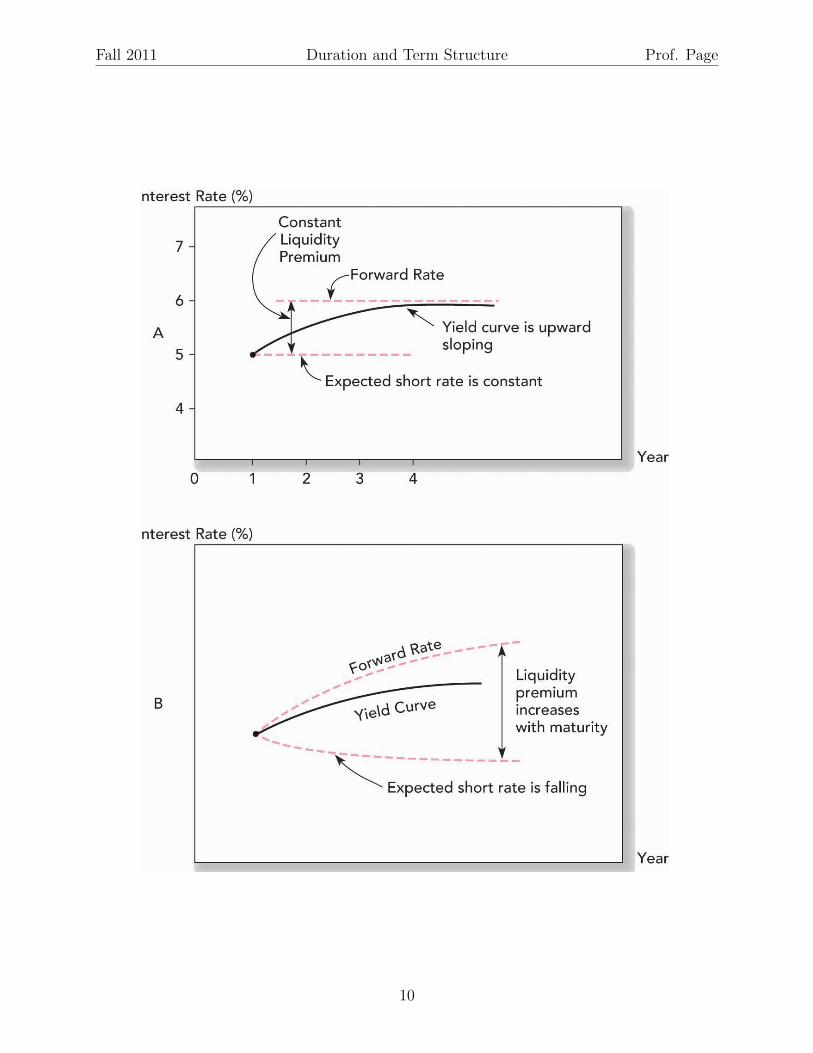
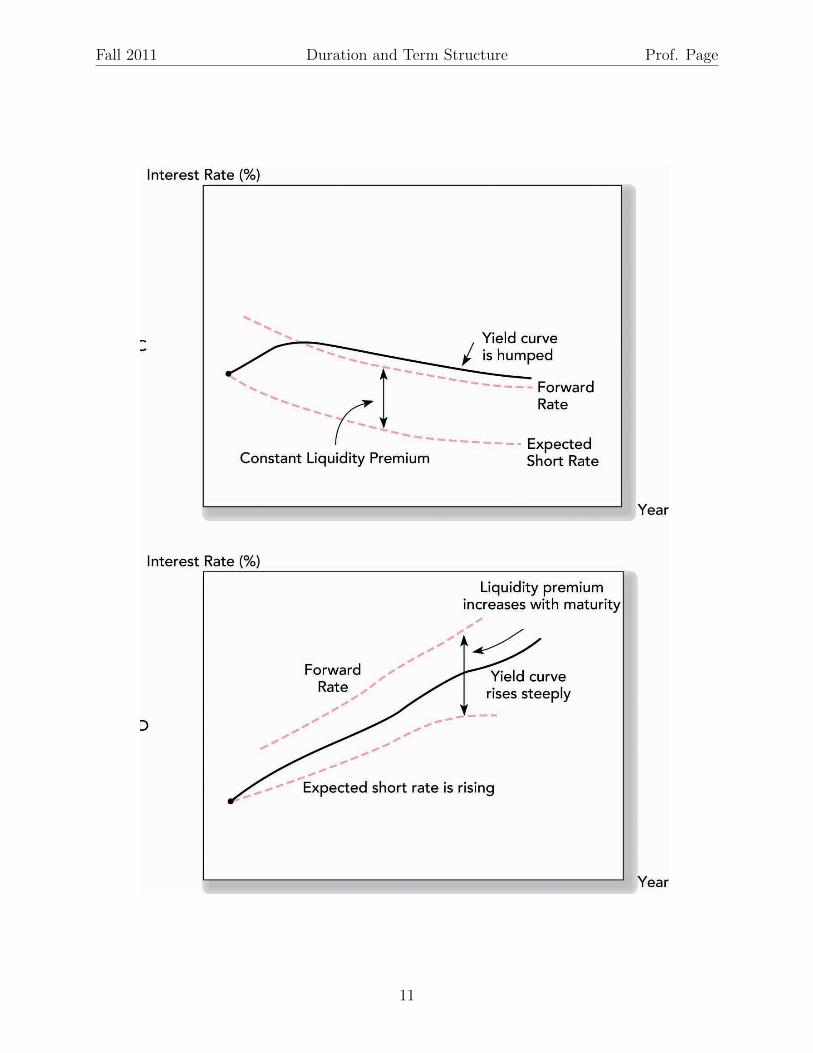
• Expectations of future short rates interact with required liquidity premia to produce
various shapes of the yield curve:
9
Fall 2011 Duration and Term Structure Prof. Page
10
Fall 2011 Duration and Term Structure Prof. Page
11

Fall 2011 Duration and Term Structure Prof. Page
6.5.4 Interpreting the term structure
• If term structure reflects market expectations of future interest rates, we can use the
term structure to infer the market’s expectations
• This expectation can serve as a benchmark for our own analysis and help guide our
investment decisions
• Problem: we cannot tell how much an upward sloping yield curve is due to expectations
of interest rate increases and how much is dues to a liquidity premium
fn = E[rn] + Liquidity premium
• Still, very steep yield curves are typically taken as an indicator of interest rate increases
• We can more safely interpret a downward sloping yield curve as evidence that interest
rates are expected to decline
12