Embed Size (px)
Citation preview
and the Head Start Bureau
Commissioner’s Office of Research and Evaluation
Administration on Children, Youth & Families
Administration for Children & Families
U.S. DEPARTMENT OF HEALTH & HUMAN SERVICES
®
EAR
LYHEAD
STARTE
AR
LYHEAD
START
R E S E A R C HR E S E A R C H
Building Their Futures:
How Early Head Start Programs
Are Enhancing the Lives of
Infants and Toddlers in Low-
Income Families
Summary Report
Building Their Futures: How Early Head Start Programs
Are Enhancing the Lives of Infants and Toddlers in Low-Income Families
Summary Report
January 2001
The Commissioner’s Office of Research and EvaluationAnd the Head Start Bureau
Administration on Children, Youth and FamiliesDepartment of Health and Human Services

ii
Early Head Start Evaluation Reports
Leading the Way: Describes the characteristics and implementation levels of 17 Early Head Start programs in fall
1997, soon after they began serving families.
Executive Summary (December 2000): Summarizes Volumes I, II, and III. Volume I (December 1999): Cross-Site Perspectives—Describes the characteristics of Early Head Start research
programs in fall 1997, across 17 sites. Volume II (December 1999): Program Profiles—Presents the stories of each of the Early Head Start research
programs. Volume III (December 2000): Program Implementation—Describes and analyzes the extent to which the programs
fully implemented, as specified in the Revised Head Start Program Performance Standards, as of fall 1997. Pathways to Quality and Full Implementation (winter 2001): Describes and analyzes the characteristics, levels of
implementation, and levels of quality of the 17 Early Head Start programs in fall 1999, three years into serving families. Presents an analysis of the pathways programs followed to achieve full implementation and high quality.
Building Their Futures: How Early Head Start Programs Are Enhancing the Lives of Infants and Toddlers in Low-
Income Families: Presents analysis of the impacts that the research programs have had on children’s development, parenting, and family development through 2 years of age.
Summary Report (January 2001): Synopsis of the major findings. Technical Report (June 2001): Detailed findings and report on methodology and analytic approaches. Special Policy Report on Child Care in Early Head Start (fall 2001): Describes the nature, types, and quality of child
care arrangements in which Early Head Start and control group children enrolled, and presents implication for public policy.
Special Policy Report on Health and Disabilities in Early Head Start (fall 2001): Describes health services received by
Early Head Start and control group families, and analyzes services for infants and toddlers with disabilities. Final Report on the Early Head Start Evaluation (June 2002): Presents analysis of the impacts that the research
programs have had on children’s development, parenting, and family development through the children’s third birthday (including two to three years of program participation).
iii
ABSTRACT
Growing out of the recommendations of the 1993 Advisory Committee on Head Start
Quality and Expansion and the 1994 Advisory Committee on services for Families with Infants and Toddlers, and building on the bipartisan mandate embodied in the 1994 Head Start reauthorizing legislation, Early Head Start began with 68 new programs in 1995. Today, with impetus added by the 1998 reauthorization, more than 600 programs serve some 45,000 low-income families with infants and toddlers. This two-generation program provides high-quality child and family development services, a focus on staff development, and a commitment to community partnerships. A rigorous national evaluation, including about 3,000 children and families in 17 sites, also began in 1995. This summary report highlights the first main impact findings emerging from the analysis of child and family outcomes through the first two years of the children’s lives.
The national evaluation, conducted by Mathematica Policy Research, Inc., of Princeton,
New Jersey, and Columbia University’s Center for Children and Families at Teachers College, in collaboration with the Early Head Start Research Consortium, finds that after a year or more of program services, when compared with a randomly assigned control group, 2-year-old Early Head Start children performed significantly better on a range of measures of cognitive, language, and social-emotional development. Their parents scored significantly higher than control group parents on many of the measures of the home environment, parenting behavior, and knowledge of infant-toddler development. Early Head Start families were more likely to attend school or job training and experienced reductions in parenting stress and family conflict. Although these impacts are generally modest in size, the pattern of positive findings across a wide range of key domains important for children’s well-being and future development is promising. For example:
• Early Head Start children, at 2 years of age, scored higher on a standardized assessment of infant cognitive development than the control children and were reported by their parents to have larger vocabularies and to use more grammatically complex sentences. On the assessment of cognitive development, Early Head Start children were less likely to score in the at-risk range of developmental functioning; Early Head Start is moving some children out of the lowest-functioning group, perhaps reducing their risk of poor cognitive outcomes later on.
• Early Head Start 2-year-olds lived in home environments that were more likely to support and stimulate cognitive development, language, and literacy, based on researchers’ observations using a standard scale. Their parents were more likely to read to children daily and at bedtime.
• Early Head Start mothers were more supportive, more sensitive, less detached, and were more likely to extend play to stimulate cognitive and language development, based on researchers’ observations of semi-structured parent-child interactions.
• Early Head Start mothers were less likely than control mothers to report spanking their child in the past week and described milder discipline techniques.
iv
The Early Head Start programs provided child development and parenting services to nearly all program families. Programs also provided families with a greater intensity of services than the control group families obtained in their communities. Data from the implementation study show that the child development services provided by the Early Head Start programs were usually of good quality and improved over time.
Earlier attainment of full implementation of key elements of the revised Head Start Program Performance Standards was associated with larger impacts on service use and a larger number of significant positive impacts on children’s development and parenting behaviors. While other differences among programs and communities may be contributing to these associations, it appears that full implementation of the standards contributes to better outcomes.
Programs choosing different approaches to providing services, to meet the unique needs of
children and families in particular communities, achieved different patterns of success. Center-based programs produced significant improvements in children’s cognitive development, as well as some improvements in parenting behaviors, while home-based and mixed-approach programs produced a greater number of positive impacts on parenting behaviors and language development. These differences reflect variations in the services provided under each approach and other differences among programs and communities choosing each approach. The early impacts reported here are promising because the pattern of positive findings is consistent across multiple domains of child and family functioning known to be associated with later child outcomes, including social abilities, literacy, and school readiness. Future reports from the Early Head Start evaluation will provide considerable additional detail, including impacts for different subgroups of low-income families and children. Future reports will also assess whether these effects are sustained as children grow and have additional exposure to the program.
For more information about the programs or the research, see Appendix A, which lists allthe institutions participating in the Early Head Start Research and Evaluation Project, alongwith contact persons.
1
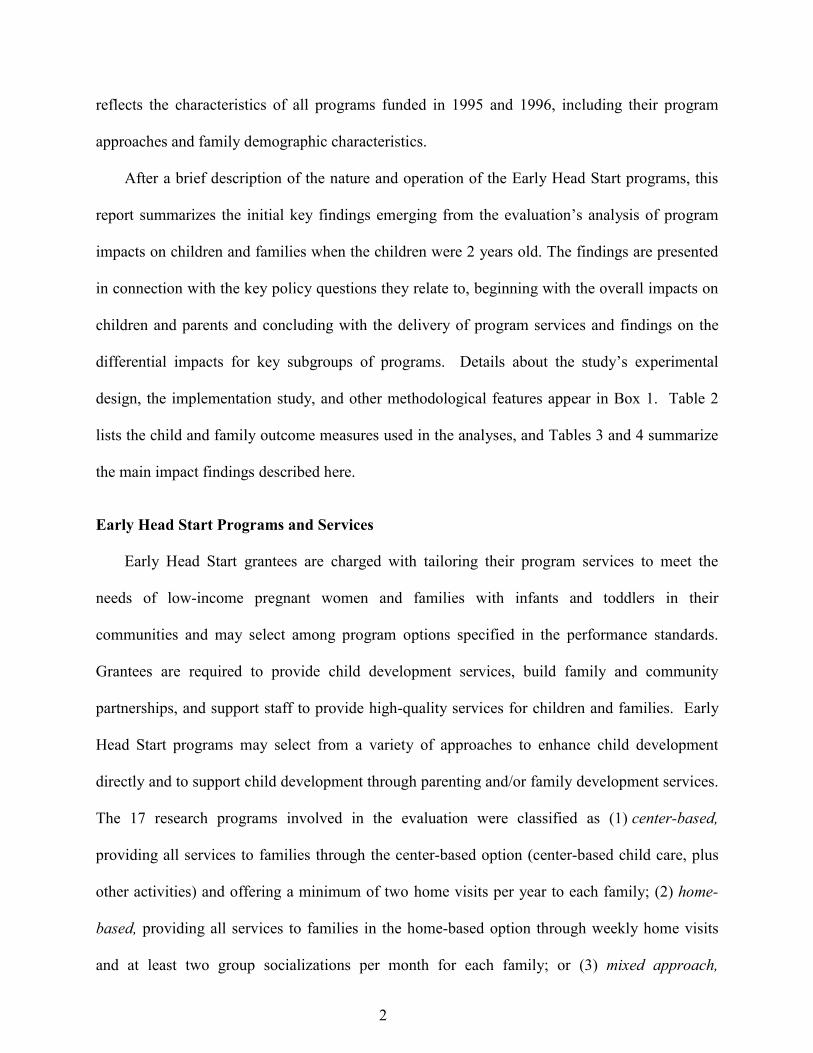
The Early Head Start Program and Its Early Development
Following the recommendations of the Secretary’s Advisory Committee on Services for
Families with Infants and Toddlers in 1994, the Administration on Children, Youth and Families
(ACYF) designed Early Head Start programs to enhance children’s development and health,
strengthen family and community partnerships, and support the staff delivering new services to
low-income families with pregnant women, infants, or toddlers. In 1995 and 1996, ACYF
funded the first 143 programs, revised the Head Start Program Performance Standards to bring
Early Head Start under the Head Start umbrella, created an ongoing national system of training
and technical assistance (provided by the Early Head Start National Resource Center in
coordination with ACYF’s regional offices and training centers), and began conducting regular
program monitoring to ensure compliance with the performance standards. 1
At the same time, ACYF selected 17 programs from across the country to participate in a
rigorous, large-scale, random-assignment evaluation.2 The Early Head Start evaluation was
designed to carry out the recommendation of the Advisory Committee on Services for Families
with Infants and Toddlers for a strong research and evaluation component to support continuous
improvement within the Early Head Start program and to meet the requirement in the 1994
reauthorization (continued in the 1998 reauthorization) for a national evaluation of the new
infant-toddler program. The 17 research programs include all the major program approaches and
are located in all regions of the country and in urban and rural settings. The families they serve
are highly diverse (see Table 1). Their purposeful selection resulted in a research sample that
1The revised Head Start Program Performance Standards were published in the Federal Register for public
comment in November 1996 and became effective in January 1998. 2From among 41 Early Head Start programs that applied with local research partners to be research sites,
ACYF selected 15 based on the quality of the proposed local research and an effort to achieve a balance of rural and urban locations, racial/ethnic composition, and program approaches. Subsequently, ACYF added two sites to provide the desired balance of approaches.
2
reflects the characteristics of all programs funded in 1995 and 1996, including their program
approaches and family demographic characteristics.
After a brief description of the nature and operation of the Early Head Start programs, this
report summarizes the initial key findings emerging from the evaluation’s analysis of program
impacts on children and families when the children were 2 years old. The findings are presented
in connection with the key policy questions they relate to, beginning with the overall impacts on
children and parents and concluding with the delivery of program services and findings on the
differential impacts for key subgroups of programs. Details about the study’s experimental
design, the implementation study, and other methodological features appear in Box 1. Table 2
lists the child and family outcome measures used in the analyses, and Tables 3 and 4 summarize
the main impact findings described here.
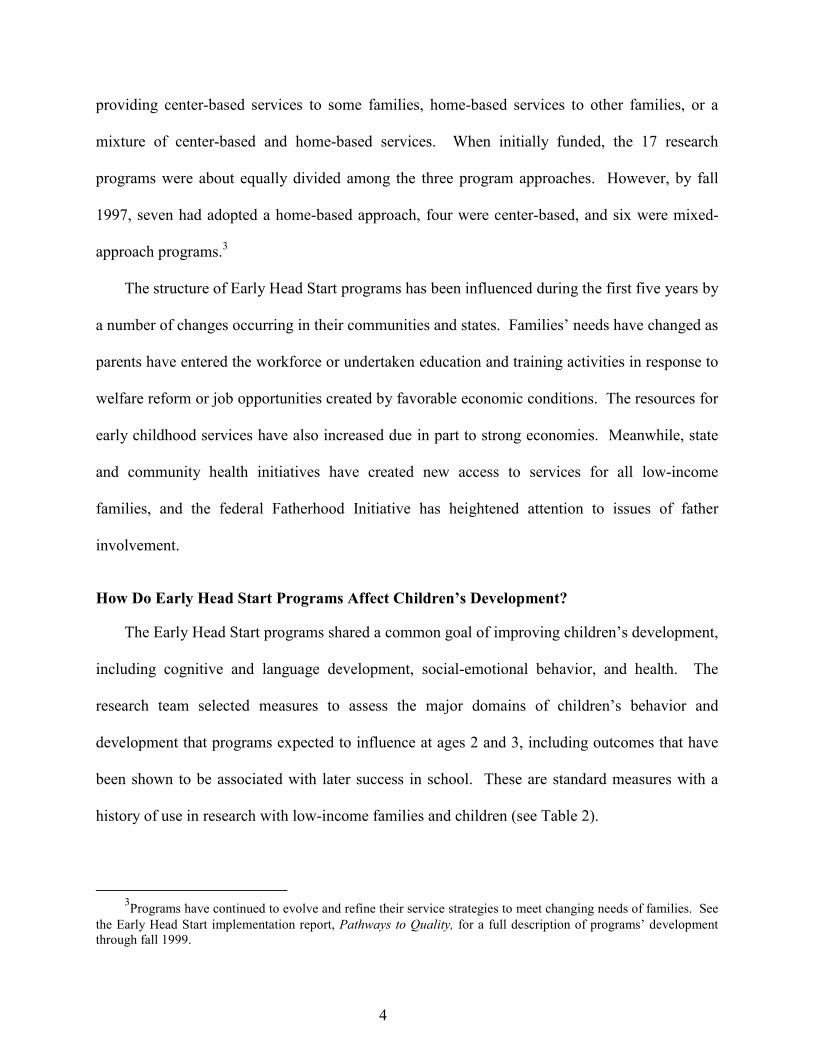
Early Head Start Programs and Services
Early Head Start grantees are charged with tailoring their program services to meet the
needs of low-income pregnant women and families with infants and toddlers in their
communities and may select among program options specified in the performance standards.
Grantees are required to provide child development services, build family and community
partnerships, and support staff to provide high-quality services for children and families. Early
Head Start programs may select from a variety of approaches to enhance child development
directly and to support child development through parenting and/or family development services.
The 17 research programs involved in the evaluation were classified as (1) center-based,
providing all services to families through the center-based option (center-based child care, plus
other activities) and offering a minimum of two home visits per year to each family; (2) home-
based, providing all services to families in the home-based option through weekly home visits
and at least two group socializations per month for each family; or (3) mixed approach,

3
Box 1: Features of the Evaluation
To meet multiple purposes, the Early Head Start Research and Evaluation project includes an implementation study, a study of program impacts through the children’s second and third birthdays, local research, and special policy studies (on such topics as fathers, child care, health and disabilities, and welfare reform). In addition, longitudinal followup is under way as the children leave Early Head Start and enter Head Start and other prekindergarten programs. The evaluation has the following key features:
• A randomized impact evaluation design in 17 sites selected to include programs in all regions, both
urban and rural locations, all program approaches, and families that reflect the diversity of families served by all Early Head Start programs that were funded in 1995 and 1996. Random assignment was conducted within each site between July 1996 and September 1998. To be eligible for the research, Early Head Start applicants had to be either pregnant women or families with a child 12 months of age or younger.
• Comprehensive longitudinal data collected from approximately 3,000 families in the 17 sites. Data for this evaluation are being collected in parent services follow-up interviews (PSIs) completed approximately 6, 15, and 26 months after enrollment and in parent interviews, direct child assessments, and videotaped parent-child interactions when children were 14, 24, and 36 months old. Data for this report come from the 6 and 15-month PSIs and the 14- and 24-month parent interviews and assessments. Approximately 75 percent of sample families completed the 15-month PSI. When children were 2 years old, 70 percent of families completed the parent interview and 58 percent of children completed the Bayley and videotaped assessments. Nonrespondents to the surveys and assessments tend to be somewhat more disadvantaged than respondents on a few dimensions, according to analyses of baseline characteristics. Very few program-control group differences appeared at baseline, and, according to analysis of baseline characteristics, nonresponse was similar across program and control groups. Thus, biases in impact estimates due to differential nonresponse do not appear to be a problem.
• Global and targeted impact analyses in which regression procedures were used to estimate program impacts. The regressions adjusted for 28 baseline child and family characteristics to control for any differences that remained after random assignment and improve the precision of the impact estimates. Each site was given equal weight in the analysis. For child and family outcomes, the estimated impacts per eligible applicant were converted to impacts per participant by dividing by the program group participation rate. Targeted impact analyses were conducted to determine how program impacts differed for programs with different approaches and characteristics, for families with different characteristics, and for families with different program experiences. Because the impact analyses generated impact estimates for a large number of outcomes and many subgroups, we identified program effects primarily by examining the pattern of impacts that were statistically significant at the 10 percent level or higher and focusing on impacts that were similar for related outcome variables and subgroups.
• In-depth implementation study in which detailed information about the research programs was gathered during site visits in fall 1997 and fall 1999. The implementation study is particularly important for informing policymakers and program staff about the dynamic process of bringing the Early Head Start concept to life. The study has documented approaches taken and services provided, rated the levels achieved in implementing key requirements of the performance standards, and highlighted the challenges faced—and met—in striving to meet the diverse needs of low-income pregnant women and families with infants and toddlers. The evaluation team created implementation rating scales and used information collected in site visits to rate (through a consensus-based process involving site visitors and outside experts) the degree to which each program implemented key elements of the performance standards, as well as the degree to which they implemented the standards in key areas and overall.
• Local research studies (not included here but described in the full technical report) focusing on families’ engagement in program services, mediators and moderators of child and family outcomes, and other topics.
4
providing center-based services to some families, home-based services to other families, or a
mixture of center-based and home-based services. When initially funded, the 17 research
programs were about equally divided among the three program approaches. However, by fall
1997, seven had adopted a home-based approach, four were center-based, and six were mixed-
approach programs.3
The structure of Early Head Start programs has been influenced during the first five years by
a number of changes occurring in their communities and states. Families’ needs have changed as
parents have entered the workforce or undertaken education and training activities in response to
welfare reform or job opportunities created by favorable economic conditions. The resources for
early childhood services have also increased due in part to strong economies. Meanwhile, state
and community health initiatives have created new access to services for all low-income
families, and the federal Fatherhood Initiative has heightened attention to issues of father
involvement.
How Do Early Head Start Programs Affect Children’s Development?
The Early Head Start programs shared a common goal of improving children’s development,
including cognitive and language development, social-emotional behavior, and health. The
research team selected measures to assess the major domains of children’s behavior and
development that programs expected to influence at ages 2 and 3, including outcomes that have
been shown to be associated with later success in school. These are standard measures with a
history of use in research with low-income families and children (see Table 2).
3Programs have continued to evolve and refine their service strategies to meet changing needs of families. See
the Early Head Start implementation report, Pathways to Quality, for a full description of programs’ development through fall 1999.
5
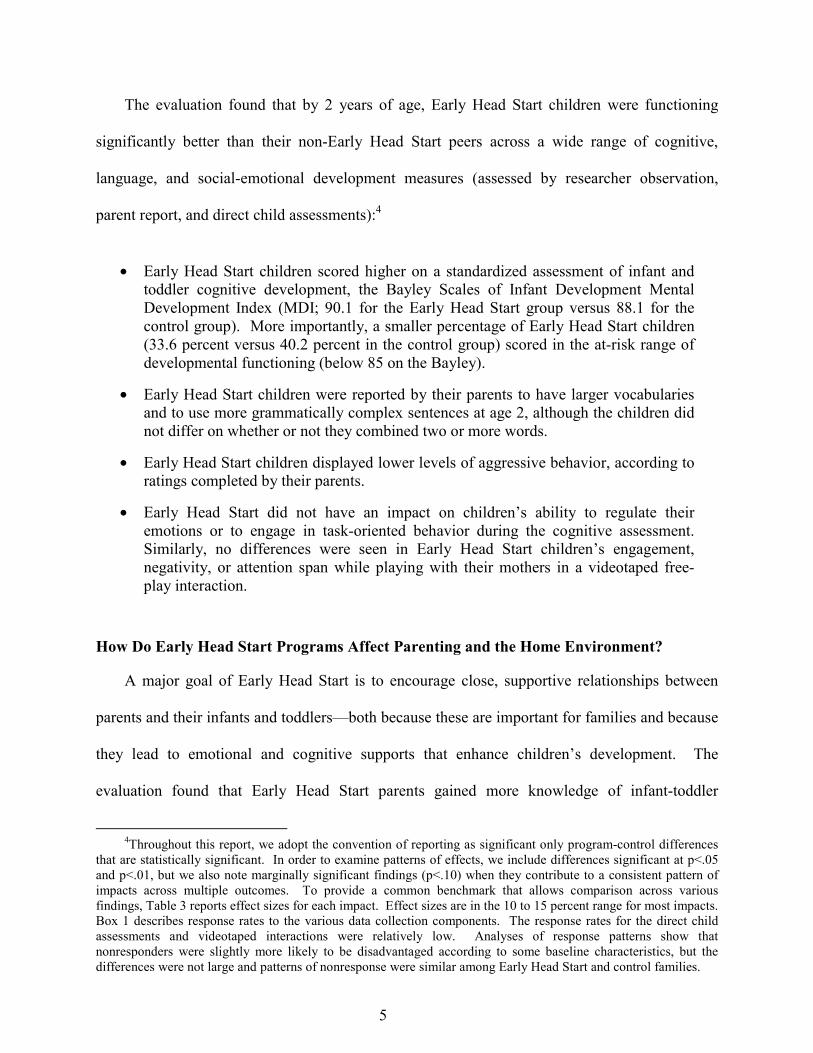
The evaluation found that by 2 years of age, Early Head Start children were functioning
significantly better than their non-Early Head Start peers across a wide range of cognitive,
language, and social-emotional development measures (assessed by researcher observation,
parent report, and direct child assessments):4
• Early Head Start children scored higher on a standardized assessment of infant and
toddler cognitive development, the Bayley Scales of Infant Development Mental Development Index (MDI; 90.1 for the Early Head Start group versus 88.1 for the control group). More importantly, a smaller percentage of Early Head Start children (33.6 percent versus 40.2 percent in the control group) scored in the at-risk range of developmental functioning (below 85 on the Bayley).
• Early Head Start children were reported by their parents to have larger vocabularies and to use more grammatically complex sentences at age 2, although the children did not differ on whether or not they combined two or more words.
• Early Head Start children displayed lower levels of aggressive behavior, according to ratings completed by their parents.
• Early Head Start did not have an impact on children’s ability to regulate their emotions or to engage in task-oriented behavior during the cognitive assessment. Similarly, no differences were seen in Early Head Start children’s engagement, negativity, or attention span while playing with their mothers in a videotaped free-play interaction.
How Do Early Head Start Programs Affect Parenting and the Home Environment?
A major goal of Early Head Start is to encourage close, supportive relationships between
parents and their infants and toddlers—both because these are important for families and because
they lead to emotional and cognitive supports that enhance children’s development. The
evaluation found that Early Head Start parents gained more knowledge of infant-toddler
4Throughout this report, we adopt the convention of reporting as significant only program-control differences
that are statistically significant. In order to examine patterns of effects, we include differences significant at p<.05 and p<.01, but we also note marginally significant findings (p<.10) when they contribute to a consistent pattern of impacts across multiple outcomes. To provide a common benchmark that allows comparison across various findings, Table 3 reports effect sizes for each impact. Effect sizes are in the 10 to 15 percent range for most impacts. Box 1 describes response rates to the various data collection components. The response rates for the direct child assessments and videotaped interactions were relatively low. Analyses of response patterns show that nonresponders were slightly more likely to be disadvantaged according to some baseline characteristics, but the differences were not large and patterns of nonresponse were similar among Early Head Start and control families.
6
development and were more likely to provide experiences and environments known to support
the early cognitive and social development of children than did control group parents. Findings
also suggest that Early Head Start had reduced the stress of parenting. These findings were
consistent across measures obtained from both parent reports and researcher observations.
• The home environments of Early Head Start 2-year-olds were more supportive and
stimulating of cognitive development, language, and literacy than control children’s homes, based on a standard scale that measured, for example, the presence of stimulating toys and books in the home, and parents reading and talking to their children. Early Head Start parents were more likely to read to children daily and at bedtime. Early Head Start parents also engaged in important activities with their children more frequently than control group parents, for example, singing songs and nursery rhymes, dancing, and playing outside. Together, these differences show that Early Head Start families are creating a richer literacy environment for their children.
• Early Head Start mothers displayed more-supportive parenting behaviors (in videotaped free-play interactions). They showed greater enjoyment, greater sensitivity and less detachment, created more structure, and extended play to stimulate cognitive and language development. However, there were no differences in levels of maternal intrusiveness or negative regard of the child.
• Early Head Start mothers were more emotionally responsive, displaying greater warmth, praise, and affection toward their children, according to direct observations made during the interview process.
• Early Head Start increased mothers’ knowledge of infant-toddler development and developmental milestones.
• Early Head Start parents created more structure in their children’s day by setting a regular bedtime.
• Early Head Start mothers were less likely to report having spanked their child in the past week than control group mothers. In addition, when presented with hypothetical parent-child conflict situations, they were more likely to suggest using a positive discipline strategy, such as distracting the child or explaining to the child. In conflict situations, Early Head Start mothers were more likely to suggest only mild responses.
• Early Head Start parents reported lower levels of family conflict and parenting stress.
How Do Early Head Start Programs Affect Family Health and Self-Sufficiency?
In addition to directly addressing child development and parenting outcomes, Early Head
Start programs support their families’ efforts to become healthier and more economically self-
sufficient. Such support contributes to parents attaining the resources needed to provide a
7
healthy environment for their children, and over the long term could support parents’ ability to
sustain the developmental advances made by their children.
• Early Head Start parents were more likely than control group parents to participate in
an education or job-training program. They also spent more time in an education program during their first 15 months in the program.
• During the first 15 months, Early Head Start had no impact on the percentage of parents employed, hours per week employed in all jobs, receipt of welfare benefits, family income, or levels of family resources (as rated by the parents). However, during this period employment levels increased among both Early Head Start and control families. Similarly, after the first 9 months, welfare receipt declined among both Early Head Start and control families.
• Few overall effects on family health emerged, consistent with the few overall differences between program and control groups in the receipt of health services (see next section). Early Head Start and control group children did not differ in their health status as reported by parents.5 Similarly, Early Head Start parents did not differ from control group parents in their self-reported health status when their children were 2 years old. Early Head Start did not substantially improve reported safety practices within families’ homes.
Did Early Head Start Programs Deliver the Intended Services to the Families They Served?
Early Head Start provided child development/parenting services to nearly all families who
enrolled and, more important, provided them with more-intensive child development/parenting
services than control group families received from other sources in their communities. The
implementation study found that the child development services provided by the Early Head
Start programs were usually of relatively high quality.6
5When children were 14 months old, program parents reported poorer health status for themselves and their
children than control parents. These differences disappeared by the time the children were 2 years old. Additional analyses are under way to explore the patterns of impacts on health-related outcomes in the full sample and in key subgroups over time and will be presented in a policy report focusing on health issues.
6Although the evaluation did not collect information on the quality of all child development services control
group families received, center and family child care quality was measured when possible; this will be the subject of a forthcoming special policy report.
8
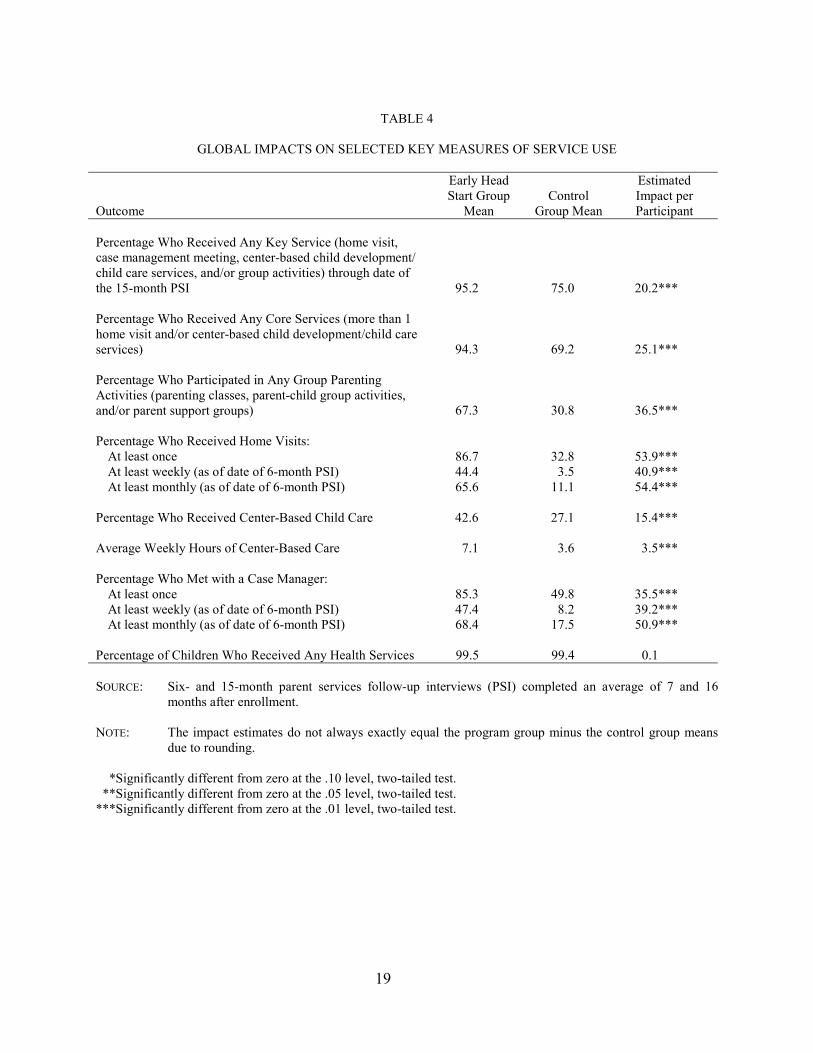
Program impacts on the receipt of key Early Head Start services were large and statistically
significant (see Table 4 for more details on the magnitude of the impacts). Highlights of the
findings related to service use include:
• The research programs succeeded in implementing and delivering home visits, center-
based care, case management, and/or group parenting activities—to a very high proportion of families. Thus, even though three-quarters of control group families received some key services from other community sources during the first 16 months after enrollment, program families were significantly more likely than control families to receive any key services.7
• Early Head Start families were much more likely than control families to receive the core child development or parenting-focused services. (Most home visits were at least an hour in length and focused entirely or in part on child development.) In addition, Early Head Start families were more than twice as likely as control families to participate in parent education, parent-child, or parent support group activities.
• The Early Head Start programs increased the receipt of intensive child development/parenting services even more dramatically. During the first follow-up period, the majority of Early Head Start families received home visits at least monthly, and nearly half received them at least weekly (an intensity of child development services generally regarded as necessary to produce child or parenting effects). In contrast, very few control families received monthly and weekly home visits. In home-based programs, the majority of Early Head Start families received weekly home visits, while very few control families did so. During the first 16 months after enrollment, children who enrolled in center-based Early Head Start programs were in center-based care for almost twice as many hours, on average, as control children.
• The quality of Early Head Start services was generally good. The implementation study rated program factors related to service quality and found that the quality of factors believed to influence home visiting effectiveness was high in most of the Early Head Start programs that provided home-based services (see Pathways to Quality 2001).8 Factors such as home visitor hiring, training, and supervision; planning and frequency of home visits; staff reports of child development emphasis during home visits; and integration with other services were rated as “good” or “high” quality in 9 of the 13 programs that provided home-based services in 1997. The number of programs with factors rated as “good” or “high” quality increased to 11 in 1999. The implementation study also found that Early Head Start centers provided
7The 15-month parent services follow-up interviews were completed on average 16 months after random
assignment. 8No information is available about the quality of factors affecting home visiting effectiveness in the control
group.
9
good-quality care during their first two years of serving families. On average, the centers maintained teacher-child ratios and group sizes that met the Head Start Program Performance Standards, and the average score on the Infant-Toddler Environment Rating Scale was 5.4 (in the good-to-excellent range of the 1-to-7 scale).
• The Early Head Start programs also increased families’ receipt of case management and their use of services in the community such as education and employment-related services and transportation assistance.
• Medicaid and State Children’s Health Insurance Programs have made health care services widely accessible to low-income families, and nearly all program and control group families reported receiving basic health services.
How Did Variations in Levels of Implementation and Program Designs Affect the Impacts of Early Head Start?
The Early Head Start programs participating in the evaluation varied in their approach to
serving families and in their pattern of progress in implementing key elements of the revised
Head Start Program Performance Standards. Accordingly, the evaluation explored how impacts
vary by program approach and implementation level. Variations in impacts across groups of
programs using particular approaches may provide useful insights into differences in impacts that
could be expected when communities choose these approaches to meet the needs of their
families. Similarly, variations in impacts across programs that achieved different levels of
implementation may provide insights into the importance of fully implementing key program
services. However, in assessing variations in impacts by program approach and implementation
level, it is important to keep in mind that other program or community characteristics of the
programs that selected particular approaches or were able to reach full implementation may also
be contributing to differences in impacts by program approach or level of implementation.9
9To remove the possibility that other factors could be contributing to variations in impacts across these
subgroups of programs, it would have been necessary to randomly assign programs to use particular approaches or implement services in particular ways, which was not feasible.
10
The overall impacts of Early Head Start varied by the timing of programs’ achievement of
“full implementation.”10 Based on systematic ratings completed as part of the implementation
study, we classified programs as early implementers (if they achieved an overall rating of “fully
implemented” by fall 1997—six programs), later implementers (achieved rating of “fully
implemented” by fall 1999—six programs), or incomplete implementers (never rated as “fully
implemented” overall, but demonstrated a number of strengths and were continuing to
progress—five programs). As already described, as of fall 1997, programs had adopted three
basic service delivery approaches—four were center-based, seven were home-based, and six
adopted a mixed approach.
Programs that were early implementers generally had larger impacts on families’ service use
and child and family outcomes than later implementers or incomplete implementers. Underlying
this overall pattern of findings is a particularly strong association, among mixed-approach
programs, between early implementation and stronger impacts. Among the other types of
programs no similar association between early implementation and strong impacts exists,
although the small number of programs in some categories limits the analysis. While other
program characteristics or contextual factors could be contributing to these differences, it
appears that full implementation of key elements of the performance standards facilitated
families’ participation in services and enhanced their outcomes in key areas.11
10Programs were rated as “fully implemented” if they substantially met all or most of the key program
requirements in the revised Head Start Program Performance Standards (see Box 1 and the Pathways to Quality implementation report).
11The relatively small number of programs participating in the evaluation limits the degree to which patterns of
impacts by implementation and program approach (or other program characteristics) can be examined simultaneously. The pattern of stronger impacts among early implementers holds true within the group of programs that took a mixed approach in 1997, the only program approach for which there were sufficient numbers of programs in both the early-implemented and not early-implemented categories for this analysis. In that group, only the early implementers (three out of six programs) had significant impacts on a range of key child and family outcomes.
11
All three program approaches (center-based, home-based, and mixed-approach) produced
positive impacts on children, but in different areas. The Early Head Start impact on Bayley MDI
scores was significant only for children in center-based programs. In center-based sites, Early
Head Start children were 28 percent less likely than children without Early Head Start to score in
the at-risk range (below 85) on the Bayley MDI at age 2. On the other hand, only in home-based
and mixed-approach programs did Early Head Start significantly enhance language development,
with more impacts found in the mixed-approach sites.12 All program approaches produced
significant positive social-emotional impacts, although more of these behaviors were affected in
mixed-approach programs. With some exceptions, Early Head Start impacts on parenting and
the home environment were concentrated in the home-based and mixed-approach programs (the
exceptions were the findings that center-based programs increased reading to children at bedtime
and increased parents’ repertoire of positive discipline practices). Parent participation in
education or job-training programs increased for those families in home-based and mixed-
approach programs. These patterns of impacts are consistent with the differences in services
provided under each approach, but they may not be due entirely to differences in approach. As
was the case with differences in impacts by program implementation, other program
characteristics or contextual factors could be contributing to these differences in impacts by
program approach.
12The absence of positive impacts on language development in center-based programs may be due to the
limitations of the measures for assessing language development of children who are learning two languages. The evaluation assessed language development in one language. In two of the four center-based programs, however, children from Spanish-speaking families are exposed to English at the centers and are learning two languages. Earlier research suggests that children reared in bilingual environments score below average when only one language is assessed.
12
Conclusions
The initial impacts emerging from the evaluation of the new Early Head Start programs are
promising. The pattern of modest but significant impacts across a wide range of child and parent
outcomes at a point about two-thirds of the way through children’s Early Head Start program
experience suggests that the programs are reducing the risk that children will experience poor
outcomes later on. The evaluation will continue to follow children and families as those in the
program complete their final year in Early Head Start. Analyses of program impacts when
children are 3 years old will provide a more complete picture of the benefits of participation in
Early Head Start. Because children’s experiences after Early Head Start are expected to vary and
because little is known about the range of low-income children’s early childhood program
experiences from birth through school entry, the Early Head Start research sample children will
also be assessed immediately prior to school entry to determine whether the promising patterns
identified at age 2 are maintained throughout the preschool years.
The initial findings emerging from the Early Head Start evaluation show:
• The Early Head Start programs in this study had modest positive impacts on a range
of child development outcomes when children were 2 years old. The pattern of findings is promising because it includes impacts in domains—such as cognitive and language development, as well as problem behaviors—identified by previous research as important for literacy and school readiness. If sustained, these impacts could lead to greater school readiness among Early Head Start children.
• The Early Head Start programs had modest positive impacts across a range of parenting outcomes when children were 2 years old. This pattern is promising because it includes impacts in areas such as literacy environments, parental supportiveness for learning, parental knowledge of child development, and discipline strategies that are also associated with enhanced child development and school readiness.
• The significant reductions in parenting stress and family conflict, along with improvements in parents’ strategies for coping with conflict and increases in supportive parenting behaviors, suggest that the Early Head Start programs may be helping to break a cycle of stress, conflict, poor coping strategies and punitive discipline sometimes reported in studies of low-income families. These findings are
13
promising because they are based both on parents’ reports of conflict and on researchers’ observations of parent-child interactions.
• The Early Head Start programs achieved high levels of participation among enrolled families. The programs substantially increased the extent of child development and parenting services that families received. Although services were available in the communities where the research programs were located, and many control families received some services, the Early Head Start programs served nearly all families who enrolled, provided much more intensive services, and provided intensive services focused on child development and parenting to a majority of enrolled families.
• Impacts seem to be greatest among programs that were able to fully implement key elements of the revised Head Start Program Performance Standards early. Thus, full implementation of key elements of the performance standards appears to support families’ receipt of services and to strengthen child and family outcomes. This finding underscores the importance of meeting the performance standards.
• Different program approaches, which are chosen to meet the unique needs of children and families in particular communities, produced different patterns of impacts. Center-based programs produced significant improvements in child cognitive outcomes at age 2 and in some parenting behaviors. Home-based programs tended to have more positive impacts on parenting behaviors and produced significant impacts on language development as well as increases in parents’ participation in education and job training. Mixed-approach programs—which provided home and/or center-based services depending on family needs—produced a pattern of impacts similar to home-based programs but had more impacts on children’s social and language development.
The overall pattern of findings suggests that the programs may be tilting the balance of risk
and protective factors within the low-income families that Early Head Start serves, possibly
creating or enhancing protective factors for Early Head Start children in the very early years of
their development. While families struggle to balance work, education, and parenting, Early
Head Start programs appear to be helping families maintain their focus on their children’s
development.

14
TABLE 1
KEY CHARACTERISTICS OF FAMILIES ENTERING THE EARLY HEAD START RESEARCH PROGRAMS
All Research Programs Combined (Percent)
Range Across Research Programs (Percent)
Primary Caregiver (Applicant) Is Female
94
88 to 99
Primary Caregiver Is a Teenager (under 20)
35
12 to 84
Primary Caregiver Is Married
28
2 to 70
Family Is a Two-Parent Family
40
9 to 74
Primary Caregiver’s Race/Ethnicity
African American Hispanic White Other
33 24 37
6
0 to 89 0 to 89 2 to 91 0 to 16
Primary Caregiver’s Main Language Is Not English
21
0 to 81
Primary Caregiver Lacks a High School Diploma
48
24 to 88
Primary Caregiver’s Main Activity
Employed In school or training Unemployed Other
23 22 29 26
11 to 44 4 to 64
13 to 43 2 to 55
Family Receives Welfare Cash Assistance 34 11 to 64 Child’s Age Unborn 0 to 6 months 6 to 12 months
25 42 33
7 to 67 12 to 57 1 to 75
Number of Applicants/Programs 1,514 17 SOURCE: Preliminary Head Start Family Information System application and enrollment data. Data are for the program group only.
15
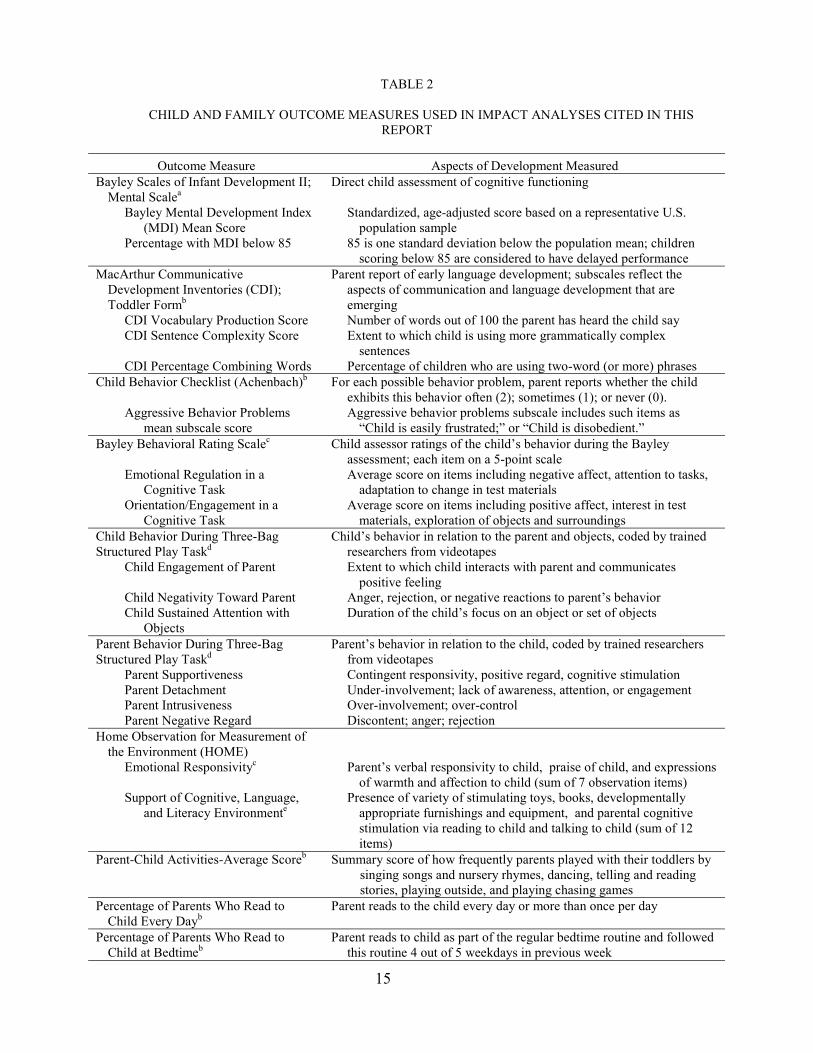
TABLE 2
CHILD AND FAMILY OUTCOME MEASURES USED IN IMPACT ANALYSES CITED IN THIS REPORT
Outcome Measure Aspects of Development Measured Bayley Scales of Infant Development II;
Mental Scalea Direct child assessment of cognitive functioning
Bayley Mental Development Index (MDI) Mean Score
Standardized, age-adjusted score based on a representative U.S. population sample
Percentage with MDI below 85 85 is one standard deviation below the population mean; children scoring below 85 are considered to have delayed performance
MacArthur Communicative Development Inventories (CDI); Toddler Formb
Parent report of early language development; subscales reflect the aspects of communication and language development that are emerging
CDI Vocabulary Production Score Number of words out of 100 the parent has heard the child say CDI Sentence Complexity Score Extent to which child is using more grammatically complex
sentences CDI Percentage Combining Words Percentage of children who are using two-word (or more) phrases
Child Behavior Checklist (Achenbach)b
For each possible behavior problem, parent reports whether the child exhibits this behavior often (2); sometimes (1); or never (0).
Aggressive Behavior Problems mean subscale score
Aggressive behavior problems subscale includes such items as “Child is easily frustrated;” or “Child is disobedient.”
Bayley Behavioral Rating Scalec Child assessor ratings of the child’s behavior during the Bayley assessment; each item on a 5-point scale
Emotional Regulation in a Cognitive Task
Average score on items including negative affect, attention to tasks, adaptation to change in test materials
Orientation/Engagement in a Cognitive Task
Average score on items including positive affect, interest in test materials, exploration of objects and surroundings
Child Behavior During Three-Bag Structured Play Taskd
Child’s behavior in relation to the parent and objects, coded by trained researchers from videotapes
Child Engagement of Parent Extent to which child interacts with parent and communicates positive feeling
Child Negativity Toward Parent Anger, rejection, or negative reactions to parent’s behavior Child Sustained Attention with
Objects Duration of the child’s focus on an object or set of objects
Parent Behavior During Three-Bag Structured Play Taskd
Parent’s behavior in relation to the child, coded by trained researchers from videotapes
Parent Supportiveness Contingent responsivity, positive regard, cognitive stimulation Parent Detachment Under-involvement; lack of awareness, attention, or engagement Parent Intrusiveness Over-involvement; over-control Parent Negative Regard Discontent; anger; rejection
Home Observation for Measurement of the Environment (HOME)
Emotional Responsivityc Parent’s verbal responsivity to child, praise of child, and expressions of warmth and affection to child (sum of 7 observation items)
Support of Cognitive, Language, and Literacy Environmente
Presence of variety of stimulating toys, books, developmentally appropriate furnishings and equipment, and parental cognitive stimulation via reading to child and talking to child (sum of 12 items)
Parent-Child Activities-Average Scoreb Summary score of how frequently parents played with their toddlers by singing songs and nursery rhymes, dancing, telling and reading stories, playing outside, and playing chasing games
Percentage of Parents Who Read to Child Every Dayb
Parent reads to the child every day or more than once per day
Percentage of Parents Who Read to Child at Bedtimeb
Parent reads to child as part of the regular bedtime routine and followed this routine 4 out of 5 weekdays in previous week
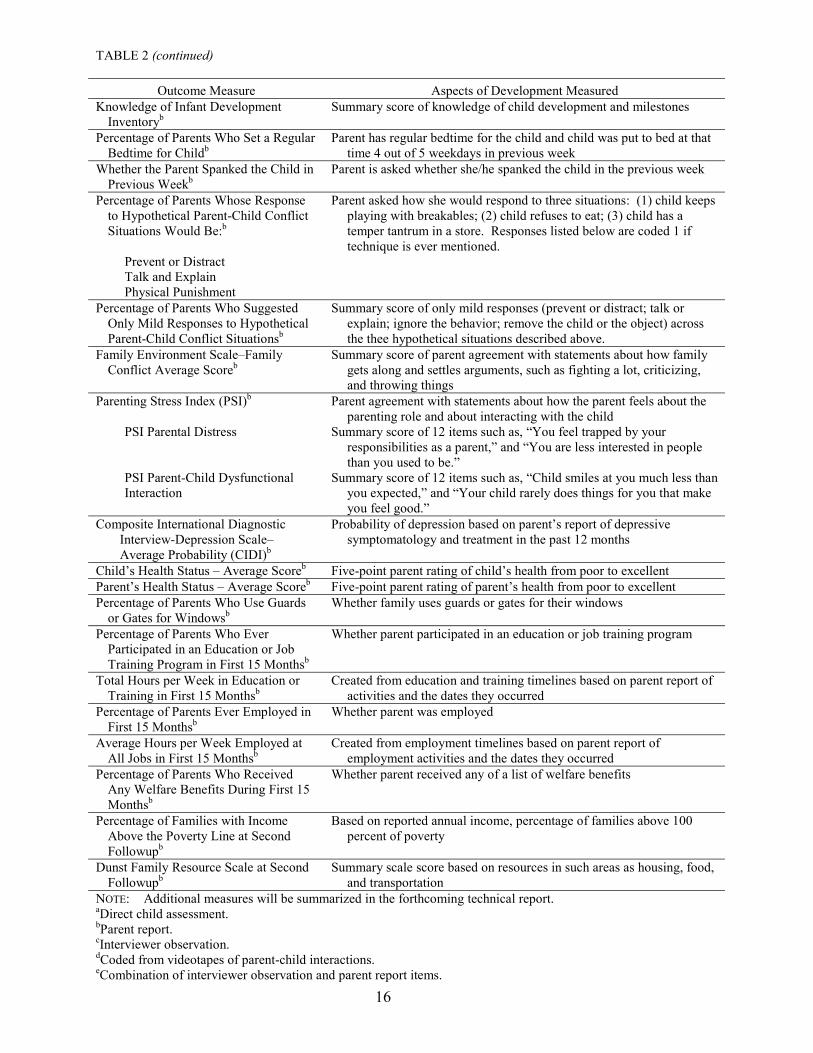
TABLE 2 (continued)
16
Outcome Measure Aspects of Development Measured Knowledge of Infant Development
Inventoryb Summary score of knowledge of child development and milestones
Percentage of Parents Who Set a Regular Bedtime for Childb
Parent has regular bedtime for the child and child was put to bed at that time 4 out of 5 weekdays in previous week
Whether the Parent Spanked the Child in Previous Weekb
Parent is asked whether she/he spanked the child in the previous week
Percentage of Parents Whose Response to Hypothetical Parent-Child Conflict Situations Would Be:b
Parent asked how she would respond to three situations: (1) child keeps playing with breakables; (2) child refuses to eat; (3) child has a temper tantrum in a store. Responses listed below are coded 1 if technique is ever mentioned.
Prevent or Distract Talk and Explain Physical Punishment
Percentage of Parents Who Suggested Only Mild Responses to Hypothetical Parent-Child Conflict Situationsb
Summary score of only mild responses (prevent or distract; talk or explain; ignore the behavior; remove the child or the object) across the thee hypothetical situations described above.
Family Environment Scale–Family Conflict Average Scoreb
Summary score of parent agreement with statements about how family gets along and settles arguments, such as fighting a lot, criticizing, and throwing things
Parenting Stress Index (PSI)b Parent agreement with statements about how the parent feels about the parenting role and about interacting with the child
PSI Parental Distress Summary score of 12 items such as, “You feel trapped by your responsibilities as a parent,” and “You are less interested in people than you used to be.”
PSI Parent-Child Dysfunctional Interaction
Summary score of 12 items such as, “Child smiles at you much less than you expected,” and “Your child rarely does things for you that make you feel good.”
Composite International Diagnostic Interview-Depression Scale–Average Probability (CIDI)b
Probability of depression based on parent’s report of depressive symptomatology and treatment in the past 12 months
Child’s Health Status – Average Scoreb Five-point parent rating of child’s health from poor to excellent Parent’s Health Status – Average Scoreb Five-point parent rating of parent’s health from poor to excellent Percentage of Parents Who Use Guards
or Gates for Windowsb Whether family uses guards or gates for their windows
Percentage of Parents Who Ever Participated in an Education or Job Training Program in First 15 Monthsb
Whether parent participated in an education or job training program
Total Hours per Week in Education or Training in First 15 Monthsb
Created from education and training timelines based on parent report of activities and the dates they occurred
Percentage of Parents Ever Employed in First 15 Monthsb
Whether parent was employed
Average Hours per Week Employed at All Jobs in First 15 Monthsb
Created from employment timelines based on parent report of employment activities and the dates they occurred
Percentage of Parents Who Received Any Welfare Benefits During First 15 Monthsb
Whether parent received any of a list of welfare benefits
Percentage of Families with Income Above the Poverty Line at Second Followupb
Based on reported annual income, percentage of families above 100 percent of poverty
Dunst Family Resource Scale at Second Followupb
Summary scale score based on resources in such areas as housing, food, and transportation
NOTE: Additional measures will be summarized in the forthcoming technical report. aDirect child assessment. bParent report. cInterviewer observation. dCoded from videotapes of parent-child interactions. eCombination of interviewer observation and parent report items.
17
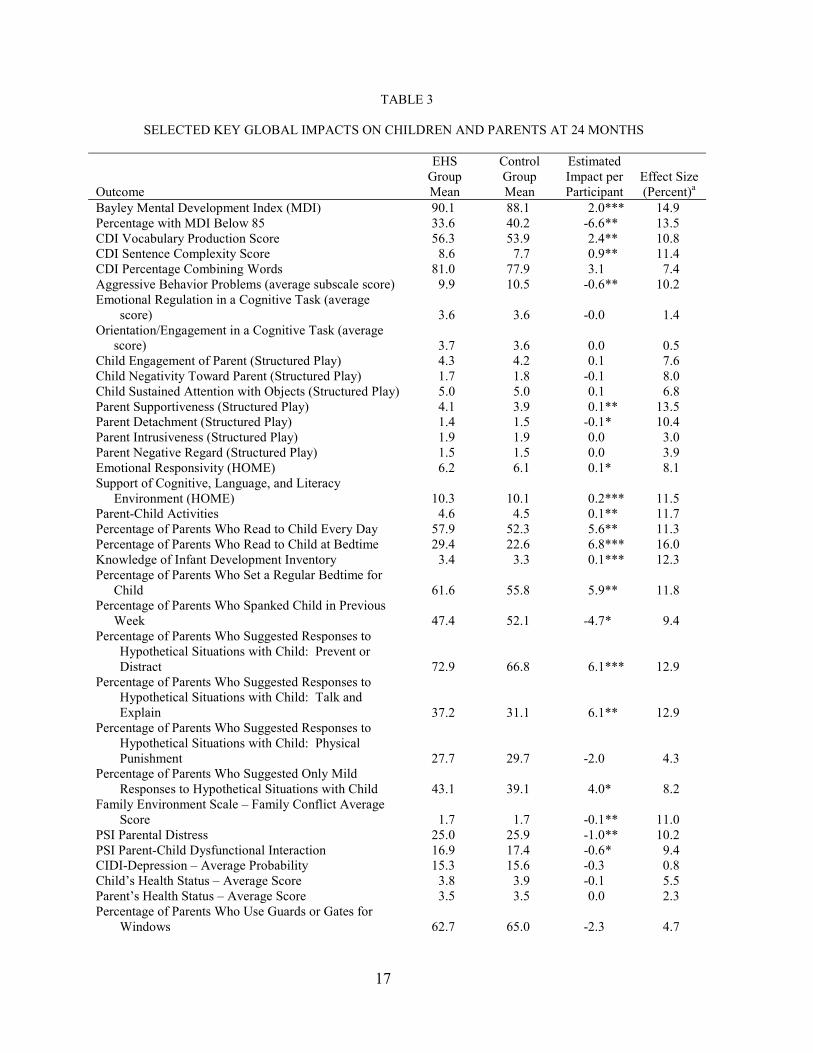
TABLE 3
SELECTED KEY GLOBAL IMPACTS ON CHILDREN AND PARENTS AT 24 MONTHS
Outcome
EHS Group Mean
Control Group Mean
Estimated Impact per Participant
Effect Size (Percent)a
Bayley Mental Development Index (MDI) 90.1 88.1 2.0*** 14.9 Percentage with MDI Below 85 33.6 40.2 -6.6** 13.5 CDI Vocabulary Production Score 56.3 53.9 2.4** 10.8 CDI Sentence Complexity Score 8.6 7.7 0.9** 11.4 CDI Percentage Combining Words 81.0 77.9 3.1 7.4 Aggressive Behavior Problems (average subscale score) 9.9 10.5 -0.6** 10.2 Emotional Regulation in a Cognitive Task (average
score) 3.6 3.6 -0.0 1.4 Orientation/Engagement in a Cognitive Task (average score) 3.7 3.6 0.0 0.5 Child Engagement of Parent (Structured Play) 4.3 4.2 0.1 7.6 Child Negativity Toward Parent (Structured Play) 1.7 1.8 -0.1 8.0 Child Sustained Attention with Objects (Structured Play) 5.0 5.0 0.1 6.8 Parent Supportiveness (Structured Play) 4.1 3.9 0.1** 13.5 Parent Detachment (Structured Play) 1.4 1.5 -0.1* 10.4 Parent Intrusiveness (Structured Play) 1.9 1.9 0.0 3.0 Parent Negative Regard (Structured Play) 1.5 1.5 0.0 3.9 Emotional Responsivity (HOME) 6.2 6.1 0.1* 8.1 Support of Cognitive, Language, and Literacy Environment (HOME) 10.3 10.1 0.2*** 11.5 Parent-Child Activities 4.6 4.5 0.1** 11.7 Percentage of Parents Who Read to Child Every Day 57.9 52.3 5.6** 11.3 Percentage of Parents Who Read to Child at Bedtime 29.4 22.6 6.8*** 16.0 Knowledge of Infant Development Inventory 3.4 3.3 0.1*** 12.3 Percentage of Parents Who Set a Regular Bedtime for Child 61.6 55.8 5.9** 11.8 Percentage of Parents Who Spanked Child in Previous Week 47.4 52.1 -4.7* 9.4 Percentage of Parents Who Suggested Responses to
Hypothetical Situations with Child: Prevent or Distract 72.9 66.8 6.1*** 12.9
Percentage of Parents Who Suggested Responses to Hypothetical Situations with Child: Talk and Explain 37.2 31.1 6.1** 12.9
Percentage of Parents Who Suggested Responses to Hypothetical Situations with Child: Physical Punishment 27.7 29.7 -2.0 4.3
Percentage of Parents Who Suggested Only Mild Responses to Hypothetical Situations with Child 43.1 39.1 4.0* 8.2
Family Environment Scale – Family Conflict Average Score 1.7 1.7 -0.1** 11.0
PSI Parental Distress 25.0 25.9 -1.0** 10.2 PSI Parent-Child Dysfunctional Interaction 16.9 17.4 -0.6* 9.4 CIDI-Depression – Average Probability 15.3 15.6 -0.3 0.8 Child’s Health Status – Average Score 3.8 3.9 -0.1 5.5 Parent’s Health Status – Average Score 3.5 3.5 0.0 2.3 Percentage of Parents Who Use Guards or Gates for
Windows 62.7 65.0 -2.3 4.7
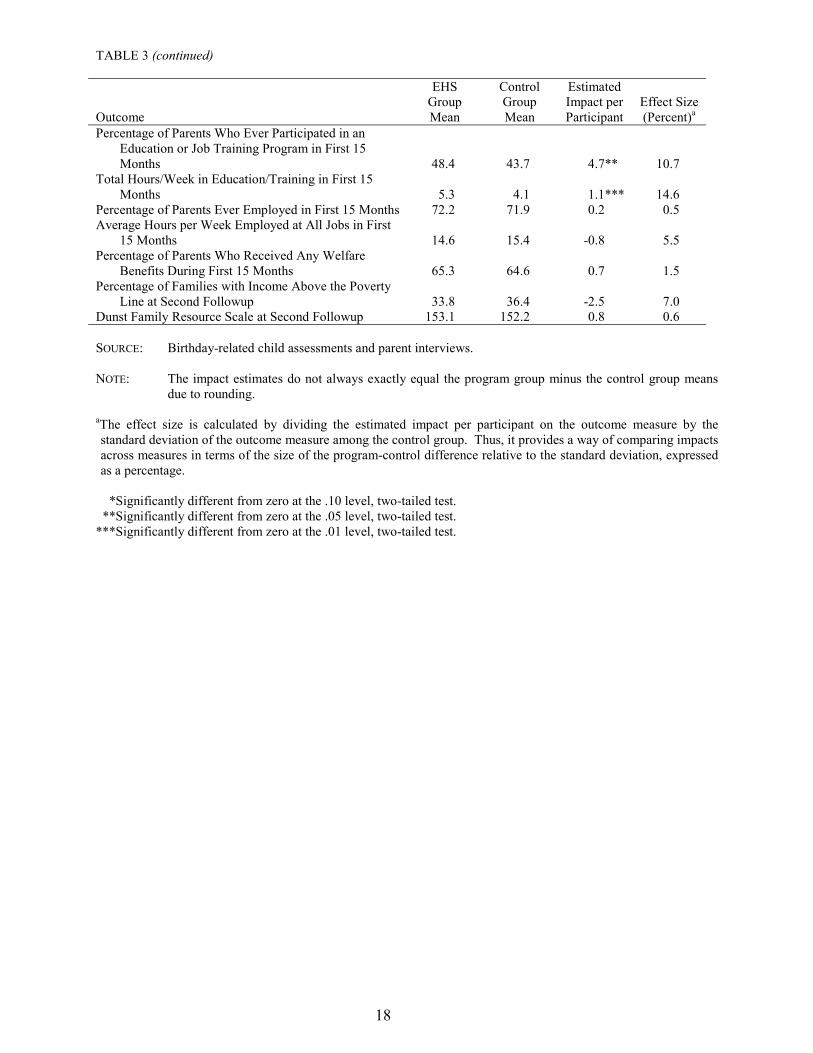
TABLE 3 (continued)
18
Outcome
EHS Group Mean
Control Group Mean
Estimated Impact per Participant
Effect Size (Percent)a
Percentage of Parents Who Ever Participated in an Education or Job Training Program in First 15 Months 48.4 43.7 4.7** 10.7
Total Hours/Week in Education/Training in First 15 Months 5.3 4.1 1.1*** 14.6
Percentage of Parents Ever Employed in First 15 Months 72.2 71.9 0.2 0.5 Average Hours per Week Employed at All Jobs in First
15 Months 14.6 15.4 -0.8 5.5 Percentage of Parents Who Received Any Welfare
Benefits During First 15 Months 65.3 64.6 0.7 1.5 Percentage of Families with Income Above the Poverty
Line at Second Followup 33.8 36.4 -2.5 7.0 Dunst Family Resource Scale at Second Followup 153.1 152.2 0.8 0.6 SOURCE: Birthday-related child assessments and parent interviews. NOTE: The impact estimates do not always exactly equal the program group minus the control group means
due to rounding. aThe effect size is calculated by dividing the estimated impact per participant on the outcome measure by the standard deviation of the outcome measure among the control group. Thus, it provides a way of comparing impacts across measures in terms of the size of the program-control difference relative to the standard deviation, expressed as a percentage.
*Significantly different from zero at the .10 level, two-tailed test. **Significantly different from zero at the .05 level, two-tailed test. ***Significantly different from zero at the .01 level, two-tailed test.
19
TABLE 4
GLOBAL IMPACTS ON SELECTED KEY MEASURES OF SERVICE USE
Outcome
Early Head Start Group
Mean
Control
Group Mean
Estimated Impact per Participant
Percentage Who Received Any Key Service (home visit, case management meeting, center-based child development/ child care services, and/or group activities) through date of the 15-month PSI 95.2 75.0 20.2*** Percentage Who Received Any Core Services (more than 1 home visit and/or center-based child development/child care services) 94.3 69.2 25.1*** Percentage Who Participated in Any Group Parenting Activities (parenting classes, parent-child group activities, and/or parent support groups) 67.3 30.8 36.5*** Percentage Who Received Home Visits:
At least once 86.7 32.8 53.9*** At least weekly (as of date of 6-month PSI) 44.4 3.5 40.9*** At least monthly (as of date of 6-month PSI) 65.6 11.1 54.4***
Percentage Who Received Center-Based Child Care 42.6 27.1 15.4*** Average Weekly Hours of Center-Based Care 7.1 3.6 3.5*** Percentage Who Met with a Case Manager:
At least once 85.3 49.8 35.5*** At least weekly (as of date of 6-month PSI) 47.4 8.2 39.2*** At least monthly (as of date of 6-month PSI) 68.4 17.5 50.9***
Percentage of Children Who Received Any Health Services 99.5 99.4 0.1 SOURCE: Six- and 15-month parent services follow-up interviews (PSI) completed an average of 7 and 16
months after enrollment. NOTE: The impact estimates do not always exactly equal the program group minus the control group means
due to rounding. *Significantly different from zero at the .10 level, two-tailed test. **Significantly different from zero at the .05 level, two-tailed test. ***Significantly different from zero at the .01 level, two-tailed test.
A.1
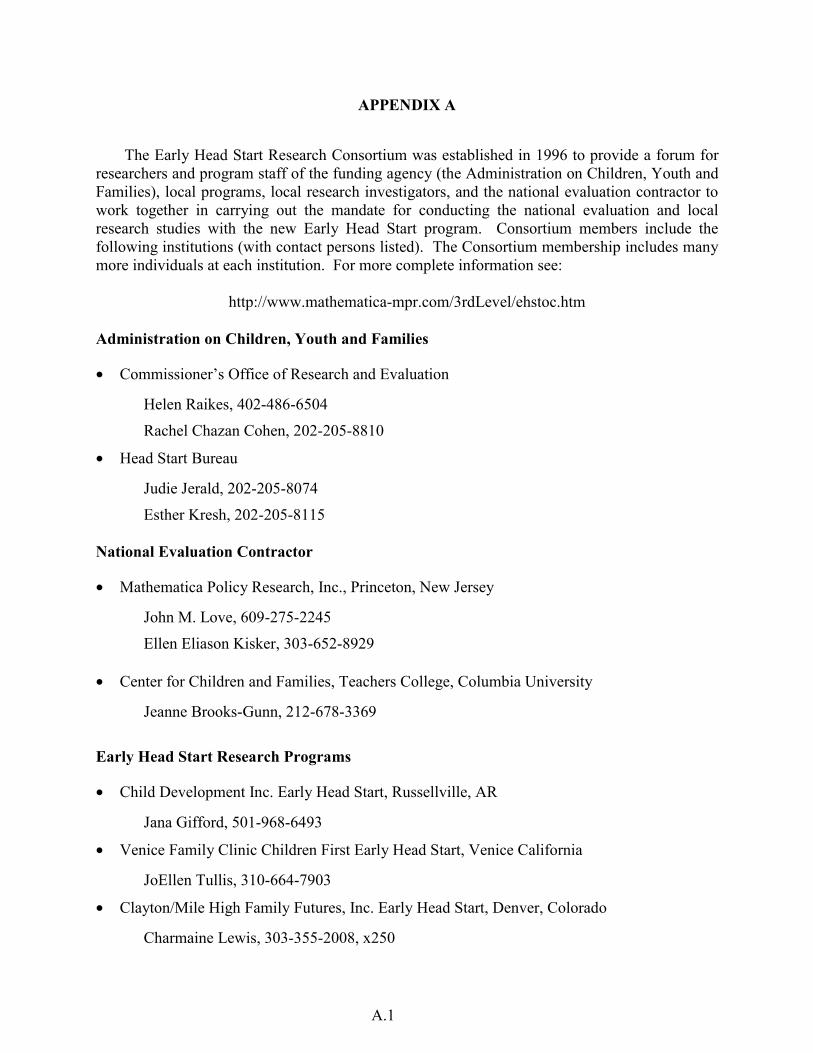
APPENDIX A
The Early Head Start Research Consortium was established in 1996 to provide a forum for researchers and program staff of the funding agency (the Administration on Children, Youth and Families), local programs, local research investigators, and the national evaluation contractor to work together in carrying out the mandate for conducting the national evaluation and local research studies with the new Early Head Start program. Consortium members include the following institutions (with contact persons listed). The Consortium membership includes many more individuals at each institution. For more complete information see:
http://www.mathematica-mpr.com/3rdLevel/ehstoc.htm
Administration on Children, Youth and Families
• Commissioner’s Office of Research and Evaluation
Helen Raikes, 402-486-6504
Rachel Chazan Cohen, 202-205-8810
• Head Start Bureau
Judie Jerald, 202-205-8074
Esther Kresh, 202-205-8115
National Evaluation Contractor
• Mathematica Policy Research, Inc., Princeton, New Jersey
John M. Love, 609-275-2245
Ellen Eliason Kisker, 303-652-8929
• Center for Children and Families, Teachers College, Columbia University
Jeanne Brooks-Gunn, 212-678-3369
Early Head Start Research Programs
• Child Development Inc. Early Head Start, Russellville, AR
Jana Gifford, 501-968-6493
• Venice Family Clinic Children First Early Head Start, Venice California
JoEllen Tullis, 310-664-7903
• Clayton/Mile High Family Futures, Inc. Early Head Start, Denver, Colorado
Charmaine Lewis, 303-355-2008, x250

A.2
• Family Star Early Head Start, Denver, Colorado
Lereen Castellano, 303-477-7827
• Mid-Iowa Community Action, Inc. Early Head Start, Marshalltown, Iowa
Kathie Readout, 515-752-7162, x152
• Project EAGLE Early Head Start, Kansas City, Kansas
Martha Staker, 913-281-2648
• Community Action Agency Early Head Start, Jackson, Michigan
Mary Cunningham DeLuca, 517-784-4800
• KCMC Early Head Start, Kansas City, Missouri
Mary K. Ross-Harper, 816-241-4240, x137
• Educational Alliance Early Head Start, New York, New York
Audrey Neuhaus, 212-780-2300, x427
• Family Foundations Early Head Start, Pittsburgh, Pennsylvania
Laurie Mulvey, 412-661-9280
• School District 17 Early Head Start, Sumter, South Carolina
Anita E. Kieslich, 803-775-0539
• Northwest Tennessee Head Start, MacKenzie, Tennessee
Pam Castleman, 901-364-3228
• Bear River Early Head Start, Logan, Utah
Sarah Thurgood, 435-755-0081
• Early Education Services Early Head Start, Brattleboro, Vermont
Mary Moran, 802-254-3742
• United Cerebral Palsy Early Head Start, Fairfax County, Virginia
Denise Mitchell, 703-360-2060, x225
• The Children’s Home Society of Washington Families First Early Head Start, South King County, Washington
Carolyn Marsh, 253-850-2556
• Washington State Migrant Council Early Head Start, Yakima Valley, Washington
Enrique Garza, 509-837-8909

A.3
Local Research Universities
• Catholic University of America, Washington, DC
Shavaun Wall, 202-319-5800
• Iowa State University, Ames, IA
Carla Peterson, 515-294-4898
• Harvard University, Cambridge, MA
Catherine Snow, 617-495-3563
• Medical University of South Carolina
Richard Faldowski, 843-876-1247
• Michigan State University
Rachel F. Schiffman, 517-353-5072
• New York University
Mark Spellmann, 212-998-5968
• University Affiliated Programs of Arkansas, Little Rock, AR
Mark Swanson, 501-682-9900
• University of California, Los Angeles
Carollee Howes, 310-825-8336
• University of Colorado Health Sciences Center
Robert N. Emde, 303-315-7114
• University of Kansas, Kansas City, KS
Judith J. Carta, 913-321-3143
• University of Missouri at Columbia, Columbia, MO
Kathy Thornburg, 573-884-5550
• University of Pittsburgh
Carol McAllister, 412-624-7778
• University of Washington, College of Education
Joseph Stowitschek, 206-543-4011
• University of Washington, School of Nursing
Susan Spieker, 206-543-8453
• Utah State University
Lori A. Roggman, 435-797-1545