Embed Size (px)
Citation preview

Erno Kiiski & Wilhelm Voutilainen
Building a Customer Value Proposition for a Game Analytics Company
Helsinki Metropolia University of Applied Sciences
Bachelor of Engineering
Industrial Engineering and Management
Thesis
12th May 2017

Abstract
Authors Title Number of Pages Date
Erno Kiiski & Wilhelm Voutilainen Building a Customer Value Proposition for a Game Analytics Company 61 pages + 2 appendices 12th May 2017
Degree Bachelor of Engineering
Degree Programme Industrial Engineering and Management
Specialisation option International ICT-business
Instructor
Anna Sperryn, Senior Lecturer
This thesis was carried out for a game analytics company to improve their customer value proposition by identifying the needs of different user segments of their service and finding out how the service can provide value to fulfill these needs. The first objective of the thesis was to identify the needs of the user segments inside the game developer companies; de-signers, analysts and management. The second objective was to find out compatibility be-tween the service and user segments’ needs. Third objective was to visualize the different user segments’ needs, relevance of each need and the compatibility between the case com-pany’s service and customer needs. The research was carried out through individual interviews and a workshop. The core of the knowledge base for this thesis consists of theories about segmentation, targeting, position-ing (STP) and value propositions. As a support for the core theories, more specific theories about the context were studied. The outputs for this thesis were Value Proposition Canvases and tables for each user seg-ment visualizing 1) what their needs inside a typical game development company are, 2) how the case company’s service fulfills those needs and 3) which of them are important to tackle based on their relevancies. Canvases and the tables acted as a proposal which the case company can use in support for sales as they give clearly visualized points to be used as sales hooks to point out the value in the service for different segments. It describes what gain creators and pain relievers should be emphasized when selling the service to specific segments. Proposal can also be used to support the development of the service to meet the customers’ needs even better.
Keywords Value Proposition, SaaS, analytics, games industry

Abstract
Tekijät Otsikko Sivumäärä Aika
Erno Kiiski & Wilhelm Voutilainen Building a Customer Value Proposition for a Game Analytics Company 61 sivua + 2 liitettä 12.5.2017
Tutkinto Insinööri (AMK)
Koulutusohjelma Tuotantotalous
Suuntautumisvaihtoehto Kansainvälinen ICT-liiketoiminta
Ohjaaja
Lehtori Anna Sperryn
Insinöörityö tehtiin pelianalytiikkayritykselle parantamaan sen arvolupausta asiakkailleen. Työssä identifioitiin eri asiakassegmenttien tarpeet pelianalytiikkapalveluja kohtaan sekä selvitettiin, kuinka juuri tämä palvelu voi tarjota arvoa eri asiakkaille. Insinöörityön ensim-mäinen tavoite oli kartoittaa eri käyttäjäsegmenttien tarpeet pelinkehittäjäyritysten sisällä. Näihin sisäisiin segmentteihin kuuluivat pelisuunnittelijat, analyytikot sekä johtotason henki-löt. Toinen tavoite oli löytää ja kartoittaa, miten nämä tarpeet sekä kohdeyrityksen palvelun tuoma arvo kohtaavat. Kolmantena tavoitteena oli visualisoida eri käyttäjäsegmenttien tar-peet tärkeysjärjestyksessä, sekä se, miten kohdeyrityksen palvelu kohtaa nämä tarpeet. Tutkimus toteutettiin tekemällä yksittäisiä haastatteluita ja työpaja kohdeyrityksen johdon kanssa. Insinöörityön teoriapohjan ydin muodostui STP-teoriasta (segmentation, targeting, positioning) sekä arvolupausteoriasta. Näitä teorioita tukemaan tutkittiin myös tähän kon-tekstiin liittyvää teoriaa. Insinöörityön lopputuotoksena olivat Value Proposition Canvas sekä taulukko jokaiselle seg-mentille, jotka visualisoivat 1) mitä tyypillisessä pelinkehitysyrityksessä olevien käyttäjäseg-menttien tarpeet ovat, 2) miten hyvin kohdeyrityksen palvelu täyttää nämä tarpeet sekä 3) mitkä tarpeista ovat tärkeimpiä taklata. Kohdeyritys voi hyödyntää lopputuotoksessa visualisoituja faktoja myynnin tukena. Loppu-tuotoksesta voidaan nähdä, mitä eri palvelun arvoa tuottavia asioita on hyvä painottaa, kun palvelua myydään eri segmenteille. Lopputuotosta voidaan myös käyttää kehitettäessä pal-velua vastaamaan paremmin asiakkaan tarpeita.
Avainsanat arvolupaus, SaaS, analytiikka, peliala

Contents
1 Introduction 1
1.1 Key Concepts 1
1.2 Case Company Background 2
1.3 Business Challenge 3
1.4 Objective and Scope 3
1.5 Benefits 4
1.6 Structure of the Thesis 4
2 Method and Material 5
2.1 Research Approach 5
2.2 Knowledge Base and Research Design 6
2.3 Data Collection 8
2.4 Data Analysis 8
3 Current State Analysis 10
3.1 Case Company’s Product 10
3.2 Current Segmentation 10
3.3 Current Sales Strategy 11
3.3.1 Current Sales Process 13
3.4 Conclusion: Strengths and Weaknesses of the Current Segmentation 15
4 Literature Review and Best Practices 18
4.1 Segmentation, Targeting, Positioning 18
4.1.1 Segmentation 19
4.1.2 Targeting 21
4.1.3 Positioning 22
4.2 Personas 23
4.2.1 Constructing Personas 23
4.3 Customer Value Proposition 24
4.3.1 Definition of Customer Value Proposition 24
4.3.2 Building Customer Value Proposition Using Value Proposition Canvas 25
4.4 Game Designers 30
4.4.1 Role of Game Designer 30
4.4.2 Design Process 30

4.5 Software as a Service 31
4.5.1 What is Software as a Service? 31
4.5.2 SaaS Business Model 33
4.6 Mobile Game Industry and the Role of Analytics 33
4.6.1 History of the Industry 33
4.6.2 Analytics in the Mobile Games Industry 35
4.7 Conceptual Framework 35
4.7.1 Core Theories 36
4.7.2 Supporting Theories 37
5 Building Proposal for the Case Company 40
5.1 Forming the Proposal 40
5.2 Proposal 43
5.2.1 Lead Designer 43
5.2.2 Game Designer 46
5.2.3 Analyst 49
5.2.4 Management 52
5.3 Conclusions and Recommendations 55
6 Discussion and Conclusions 57
6.1 Summary 57
6.2 Evaluation of the Thesis 59
6.2.1 Fulfilling the Goals 59
6.2.2 Value for the Case Company 60
6.3 Challenges 60
6.4 Learnings 61
References 62
Appendices
Appendix 1: CSA Interview Questions and Answers
Appendix 2: Summary of Customer Company and Case Company Manager Interviews

List of Tables
Table 1. Different Phases of the Research .................................................................. 6
Table 2. Strengths and Weaknesses of the Current Segmentation ........................... 16
Table 3. User segment interviews ............................................................................. 40
Table 4. Fit Between Customer Profile and Value Map for Lead Designer Segment . 45
Table 5. Fit Between Customer Profile and Value Map for Game Designer Segment 48
Table 6. Fit Between Customer Profile and Value Map for Analyst Segment ............ 51
Table 7. Fit Between Customer Profile and Value Map for Management Segment ... 54
Table 8. Review of the Alleviated Weaknesses ......................................................... 59
List of Figures
Figure 1. Research Design......................................................................................... 7
Figure 2. Sales Process ........................................................................................... 14
Figure 3. STP Model (Hanlon 2016). ........................................................................ 18
Figure 4. Building Blocks Used for Value Proposition Canvas (Osterwalder et.al. 2014)
26
Figure 5. Value Proposition Canvas (Osterwalder et.al. 2014) ................................. 26
Figure 6. Achieving Fit with Value Proposition Canvas (Osterwalder et.al. 2014) ..... 29
Figure 7. Conceptual Framework ............................................................................. 36
Figure 8. Value Proposition Canvas Template ......................................................... 42
Figure 9. Value Proposition Canvas for Lead Designer Segment ............................. 44
Figure 10. Value Proposition Canvas for Game Designer Segment ........................ 47
Figure 11. Value Proposition Canvas for Analyst Segment ..................................... 50
Figure 12. Value Proposition Canvas for Management Segment ............................ 53

1
1 Introduction
To be successful in business, products and services have to meet specific customer
needs and give some specific value to customers. If a company can offer enough value
to the customers through their products and services, they are willing to buy what it is
offered. This act of offering value to the customer through the product or service is called
value proposition. It can be referred to as the heart of strategic marketing plan for busi-
ness. (McDonald, et al. 2011) Value propositions are basically a summary of what prod-
ucts or services the company offers and what value they are creating and why these
should be bought more preferably than the possible alternatives. (McDivitt and Wilkinson
2012).
Comprehensive view of customers and their needs and pains is the core for creating an
effective value proposition. There are few different models and tools that can be utilized
to create an effective customer value proposition. In this study, Alex Osterwalder’s Value
Proposition Canvas (2014) is used.
1.1 Key Concepts
The key concepts in the thesis are the following:
Value proposition is a statement of how company’s product or service would give value
to customers and why they should buy it. Value proposition tells how some particular
product or service will add more value to the customers than other similar products or
services.
SaaS (Software as a Service) is the service model of the case company’s product.
SaaS is a whole application that is delivered as a service in the cloud via Internet for the
customer. The most common way SaaS providers deliver the service to the customer is
a web browser-based user interface that can be accessed on any device that is con-
nected to the Internet.

2
KPI (key performance indicator) is one type of performance measurement. KPIs are
used to measure some particular activity that organization is engaging in. It demonstrates
how a company is performing in achieving some key business objectives.
IAP (In app purchases) are purchases that are made inside a mobile application using
real money. This could mean, for example, virtual currency or items that are used in a
mobile game and purchased with real money. Usually mobile games that have IAP’s in
them use the free-to-play business model.
Free-to-play (F2P) business model is nowadays the most commonly used business
model in successful mobile games. Players can download and play the game’s core for
free. The idea of the business model centers around players’ willingness to use money
to purchase, for example, in-game items once they have tried the game and its mechan-
ics out. Monetization is made usually through advertisement or in-game purchases.
Game analytics is way of using different data of games to maximize its success in the
game market. Nowadays analytics is used more and more commonly in the game indus-
try, and it has become crucial part to ensuring games’ commercial success. It allows
game developers to understand in real-time why users are abandoning a game and to
identify other players at risk of leaving the game so that they can develop player retention
strategies before those players quit. Analytics can help the developers to tweak the game
and increase retention and engagement metrics significantly through user data. Analytics
can also be used already in the production phase of a game to get fact-based data to
support the design process.
Feature implementation means putting new features into a game. New features that
are implemented into a game could be, for example, new game modes or social features
such as playing with or against friends and other players. Even when a mobile game is
launched, they must be kept up-to-date by balancing the game and adding new features
in order to remain competitive and attract players because the mobile game market is
constantly evolving.
1.2 Case Company Background
The case company of this thesis operates in the mobile games industry. It offers data
analytics services mainly to game companies, publishers and investors. Company was

3
founded in early 2014 in Helsinki, Finland. Its customer base already spans all over the
world, so it can be said that the company was born global. The main service the company
offers is an online service (SaaS) that gives insights on the current mobile game market
and helps the customers optimize their games to increase their commercial potential. In
addition to the online service, it also offers consulting services for its customers.
1.3 Business Challenge
Currently the case company has identified the three main customer segments; game
developers, publishers and investors. The actual business challenge is related to the
game developer segment. Inside game developer companies, the case company has
identified distinct roles and users and has separated them into three main user seg-
ments; designers, analysts and management. These user segments all have various
kinds of needs for the service, and this also means that same sales strategy does not
work for every user segment.
The business challenge is that it has been noticed that the different needs of the user
segments are not identified well enough leading to mediocre value propositions that
could be improved. It is hoped that a further identification of the needs would help in the
sales process when approaching the potential customers, improving the service’s value
proposition to fit the customers’ needs better and give tools to offer even better targeted
services for the different user segments inside the game developer companies.
1.4 Objective and Scope
The first objective of the thesis was to identify the needs of the user segments inside the
game developer companies; designers, analysts and management. The second objec-
tive was to find out the compatibility between the service and the different user segments’
needs. The third objective was to visualize the different user segments’ needs, relevance
of each need and compatibility between the case company’s service and those needs.
The outcome of this thesis is a Value Proposition Canvas and table for each user seg-
ment, visualizing the different user segments’ needs inside a typical mobile game devel-
opment company. The table also shows how the different features of the case company’s

4
service fulfill these specific customer needs and which of them are the most important to
tackle based on their relevance.
1.5 Benefits
The value proposition canvases and the tables visualize the needs of the different user
segments and the compatibility between the different features of the case company’s
service. This enables the case company to form a comprehensive view about the state
of their current value proposition.
The case company can use the tables as a support for developing the service and posi-
tioning it for different segments. It can also be used for developing sales strategies, to
offer even better targeted services and as a general support for sales personnel.
This support and knowledge gained will help in approaching customers, which can con-
tribute to increasing sales and conversion rates for sales meetings. It can also help in
product development since case company’s view on what customers really want could
possibly strengthen so that it can focus on developing the product that covers exactly
these needs.
1.6 Structure of the Thesis
This thesis is written in 6 sections. The first section provides the introduction to this thesis
and focuses on creating a clear picture about why this thesis is done and what the ben-
efits of it will be for the case company. The second section describes the methods and
materials used in this study, focusing on how the research was designed and conducted.
The third section focuses on describing the current state of the case company’s value
propositions to different segments. The fourth section is the theory part which focuses
on segmentation, targeting, positioning (STP) and value proposition theories and addi-
tionally supporting theories that include personas, SaaS theory, mobile game industry
and the role of analytics and the game designer segment. The fifth section presents the
proposal for the case company, which covers outputs of the thesis and how they were
formed. The sixth section is the conclusion part where the whole thesis is summarized
and its process and outcome evaluated.

5
2 Method and Material
This section explains the methods and materials used in the research of this study. The
research focuses on mapping and improving value propositions, so the research meth-
ods are defined based on that context.
2.1 Research Approach
The research approach used in the study is qualitative, meaning that the research is
carried out through individual interviews. The questions asked are specific and open
ended, which lets individual opinions be spoken out and allows the research team to dive
deeper into the problem. Interviews were split into two phases; case company interviews
and the user segment interviews.
In the first phase, case company managers were interviewed to form the current state
analysis. Questions were about the level of current customer segmentation, the current
identification of the needs of the different segments, how current value propositions are
communicated to different segments and the state of the sales process. The questions
were open ended to get all the information needed and to let opinions stand out. All the
case company interview questions and answers are presented in the Appendix 1.
The second phase of the interviews was conducted after the current state analysis and
conceptual framework were done, to gather data for forming the proposal of this thesis.
This part focused on interviewing the customer companies’ user segments; designers,
analysts and management. Personnel inside these segments were interviewed individu-
ally either on Skype or in person. Each user segment had similar questions; for example,
about their normal workday, their aspirations in their work and the pains and risks they
encounter. Customers were also interviewed on what benefits they get from the case
company’s service and on what kind of expectations they have for analytics services in
general. As a support, these same questions were presented for the case company’s
managers also to get their view from the service’s side, hear their experiences working
with these segments and because customers do not always recognize all of their pains
and needs. These interviews were crucial for forming the proposal, since knowing cus-

6
tomers’ pains and needs comprehensively is the core for creating effective value propo-
sition. All the user segment interview questions and answers are presented in Appendix
2.
Additionally, a workshop with the case company’s managers was conducted after all the
other data for the proposal was gathered and analyzed from the current state analysis,
conceptual framework and the user segment interviews. The main objectives for the
workshop were to validate and finalize Value Proposition Canvases, to create tables to
visualize the fit between different user segments’ needs and the service and to ensure
that the proposal meets the needs of the case company.
Table 1 below summarizes the different phases of the research:
Table 1. Different Phases of the Research
Research phase
Target Topic Ideal results
CSA Interviews Case com-pany’s ma-nagers
Current state analysis Data about current state of the case company’s segmentation, customer need evaluation, value propositions and state of the sales process
User segment interviews
Customer companies
Identifying customer pains and needs
Comprehensive data about differ-ent segments’ pains and needs
Case com-pany’s ma-nagers
Identifying customer pains and needs from the service’s view
Supporting data about different segments’ pains and needs that did not come out in the user seg-ment interviews
Workshop Case com-pany’s ma-nagers
Validating and finaliz-ing the proposal and the fit between cus-tomers’ needs and the service
Validated and finalized value proposition canvases and tables for each segment visualizing the fit between customers’ needs and the service
2.2 Knowledge Base and Research Design
The core of the knowledge base for the thesis consists of theories about segmentation,
targeting, positioning (STP) and value propositions. As a support for the core theories,
more specific theories about personas, SaaS theory, mobile game industry and the role
of analytics and the game designer segment were studied to understand the specific
context of this thesis. Research design for this thesis is visualized in Figure 1 below:

7
Figure 1. Research Design
The research phases of the study as shown in the Figure 1 are described in more detail
below:
Firstly, the objectives of the study were defined in co-operation with the case company’s
managers. The goal was to create as clear definition as possible since it is the foundation
of the study.
Secondly, current state analysis of the case company’s current level of segmentation
and the identification of the needs of the different user segments, the way the current
value propositions are communicated to different segments and the state of the sales
process were studied. Interviews that were conducted with the case company’s manag-
ers and the case company documentation worked as a material for this research.

8
Thirdly, conceptual framework study was done, where core theories Segmentation, Tar-
geting, Positioning Theory (STP) and Customer Value Proposition Theory (CVP) were
studied thoroughly to get an understanding of the best practices. To create fitting value
propositions for this context, supporting theories, such as personas, SaaS theory, mobile
game industry and the role of analytics, and the game designer segment, needed to be
studied.
Fourthly, a comparison based on the conceptual framework study, current state analysis
and the user segment interviews was done so that the Value Proposition Canvases could
be created.
Fifthly, Value Proposition Canvases were created to illustrate how the service and the
different needs of the user segments meet. Material for these canvases consists of con-
ceptual framework, current state analysis and the user segment interviews.
Finally, a workshop was held with the case company’s managers. The main objectives
of the workshop were to validate and finalize the Value Proposition Canvases and to
create tables to visualize the fit between different user segments’ needs and the service
and to ensure that the proposal is fitting for the needs of the case company.
2.3 Data Collection
As shown in Figure 1, theoretical data and knowledge about the context was gathered
from literature covering segmentation, targeting, positioning (STP), customer value prop-
ositions and specific supporting theories. The data used to conduct this thesis has been
collected through the case company’s documentation, case company manager and user
segment interviews. All the data collected have been integrated in a workshop with the
case company’s managers to form a Value Proposition Canvas for all different segments,
which then was used to form the final proposition tables.
2.4 Data Analysis
The data analysis was mainly done by comparing theoretical data to practice. First, the
theories were studied, and then, a conceptual framework for the context of this thesis

9
was built on the basis of these theories. The practical part of the data was gathered from
the interviews and from the documentation provided by the company.
10
3 Current State Analysis
This section describes the current state analysis of this thesis to get a view of the case
company’s current level of user segmentation, the identification of the needs of the dif-
ferent user segments, the way the value propositions are communicated to different seg-
ments and the state of the sales process. The data for this section was gathered by
interviewing the case company’s managers and from the case company documentation.
3.1 Case Company’s Product
The case company operates in the video game industry especially focusing on the mobile
game market. Its main product is an online service (SaaS), which offers processed data
of the current market situation with easily accessible graphs, trends and other insights
instead of just raw data. The whole service is based on hundreds of game analyses in
which around 150 distinctive features are tracked. Then there is a statistical model which
is used to calculate a KPI which indicates the game’s feature set’s potential to be finan-
cially successful in the current market. Besides just getting the market data, the service
can also be used to measure customers’ own games’ feature sets all the way from con-
cept phase to post launch phase, for example, to determine which concepts seem to be
solid and have good chances to be profitable. Market is evolving all the time and trends
change over time, so the service provides help for the companies to track where their
games are going and what should perhaps be implemented in the upcoming updates to
stay relevant.
The service offers a lot of customization options for the customer to choose which tools
and features they want to use in their service. They can get choose for example to get
the market data, own games’ analyzer, data about soft launched games or implementa-
tion picture service which can help you figure out how to implement some exact feature.
Customers can customize their own packet by choosing the tools they want.
3.2 Current Segmentation
Case company’s customer base consists of game developer companies, investors and
publishers. This study focuses on the segments inside the game developer companies,
so the first interview round with the case company’s managers focused on that area.

11
Currently, the case company has identified three different segments inside the game
developer companies; game designers, data analysts and management. The personnel
of the company have experience in the mobile games industry, so the identification
comes mainly through the company’s knowledge and by working with the customers.
The case company’s managers think that the level of segment identification is moderate
and improving that would help on value proposition communication. Lately, the company
has started to focus more on the subject; for example, partner organizations’ have been
used to test features of the service to find out opinions and preferences of different user
segments before launching them into the actual product.
Documentation level of how to communicate value propositions for different user seg-
ments is low as currently only an internal company feedback channel has been used to
gather and document feedback from the customers. The case company’s managers
think there could be a more centralized place for all the documents, which could help in
giving a clearer picture for approaching customers in every case. Low level of documen-
tation leads to weaknesses in the sales strategy, which will be discussed more below in
the next section.
3.3 Current Sales Strategy
During the first interview with the case company’s managers it was found out that cur-
rently they have specific personnel responsible for approaching each segment. This is
done because the blockers are different for different segments. For example, when the
company has a client where the contact point will be an analyst they use the person
responsible for the statistical model. This is because they have found out that analysts
trust data and numbers. If that data is proven to be trustworthy and right, then it is fairly
easy to convince them about the value proposition the service offers when approached
with the data and statistical model in front. The service really helps analysts in many pain
points as well. Their job mainly revolves around making reports from the data to help
decision making of designers and management. From the service, they can get, for ex-
ample, csv-files straight away and lots of data to help them in their daily work.
Management level has probably been the easiest segment to approach in the case com-
pany manager’s opinion. Managers are usually not constant users of the service. They

12
use it more rarely to get a good overview of the company’s game portfolio and to get
support for their decision making on questions such as which game concepts to approve.
They are also usually the persons who are most interested in the money and the profits
the games make so that is why this kind of service has been fairly easy to sell to them.
They usually see the value in the service quickly and they usually would like to get it for
their teams to use even though they are more rare users themselves. They get quick and
clear overview with metrics and KPIs on their own games which helps them to follow
games’ performance and supports big picture decision making.
The common way in the industry has been before that the management just have to trust
designers’ opinions on what concepts are good and what are not. With the service, they
can get transparency already on the concept phase with respect to which projects really
have chances to become successful and profitable and which ones are most likely big
risks. The problem has been that often even when the managers like the service, they
are not the primary daily user group, so they do not make the purchase decision alone.
They ask designers’ and analysts’ opinions because they would be the daily users, so in
the end designers and analysts are the segments that always have to be won over.
On the basis of the interview, at the moment the clearly hardest and the most problematic
segment to approach and sell to has been the designers. Case company’s managers
described them often to be “artistic personalities”. They treat their games “like their ba-
bies”. Designers might see this kind of optimization analytics service as a threat to their
creativity, and they do not see the value the service would provide to them since it is
basically a mathematical model. Therefore, they would need more introduction to the
service and to be assured that it is just one tool to support the decision making. It is not
some machine that tells you exactly how to design your game. Many designers focus
often on small details and on day-to-day tasks. They try to find answers for these from
the service, but it is not meant for answering to those tiny details. The case company’s
managers told that designers often think about just the needs of that exact day and that
is why they overlook the big picture benefits.
According to the case company’s managers, designers often have also a shorter atten-
tion span than analysts and designers are very often not bothered to go through the
instructions. This has led to misunderstandings since they have used the service wrong
or have not found a way to solve their problems and thought that the whole service does
not work and therefore is not worth the money. If this point is reached, it is hard to go
13
back anymore to the “starting point” and still make the sale happen. Mobile games in-
dustry is still fairly young and that is why a lot of decisions are made on a “hunch feeling”.
Designers like to often trust more just on their own feelings than using numbers and
statistics to help them. When approaching designers, they need to be assured that the
person selling is someone who knows a lot about games and the game industry. The
trust comes from them seeing that the person doing the sales actually understands
games and how they work.
One big problem with designers also is that they are not so homogeneous a group as,
for example, analysts often are. Some of the designers are more data-oriented than oth-
ers and some are guided more by gut feeling. But it is hard to know what kind of designer
there is on the other end before the actual sales meeting or call. If this could be somehow
identified beforehand it would help in choosing the right approach to communicate the
value proposition properly.
Another problem has also been that commonly people working as data analysts, who
understand the service the best, have had problems to convince the ones making the
feature level development choices (designers) to change their approach. This trend has
been changing though as the market is maturing and the competition is getting tighter all
the time. More and more companies have been changing their development processes
to more data-driven approaches.
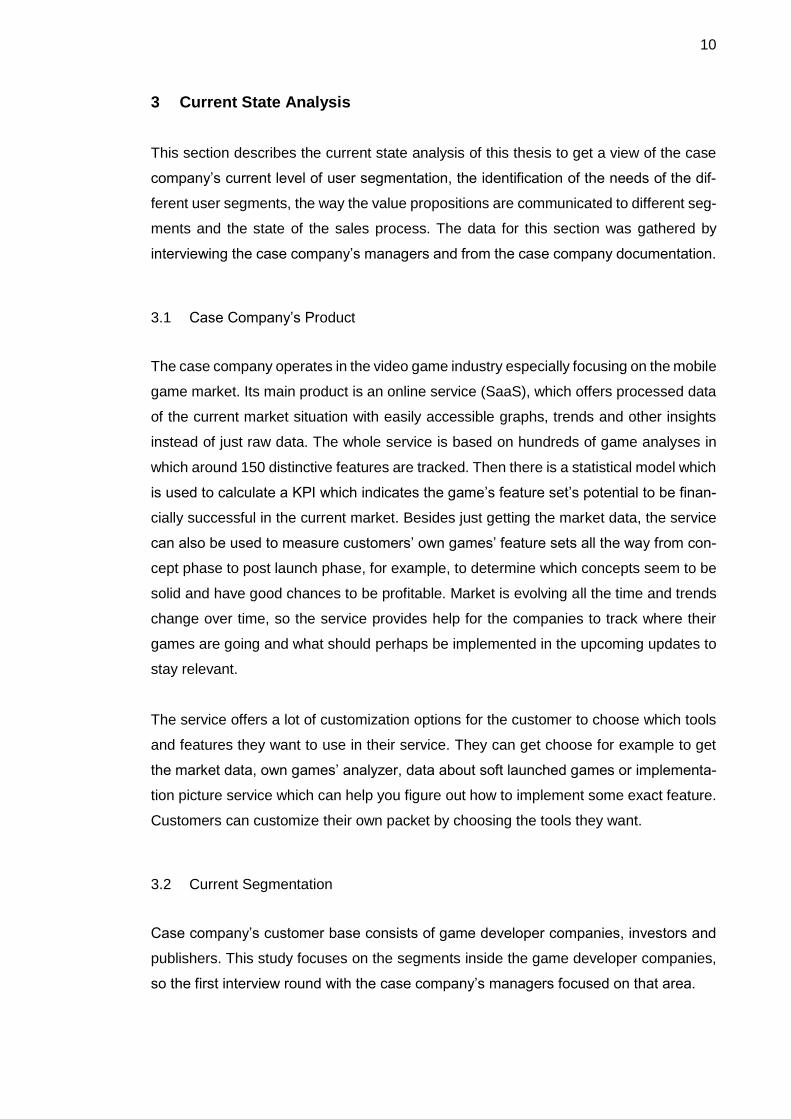
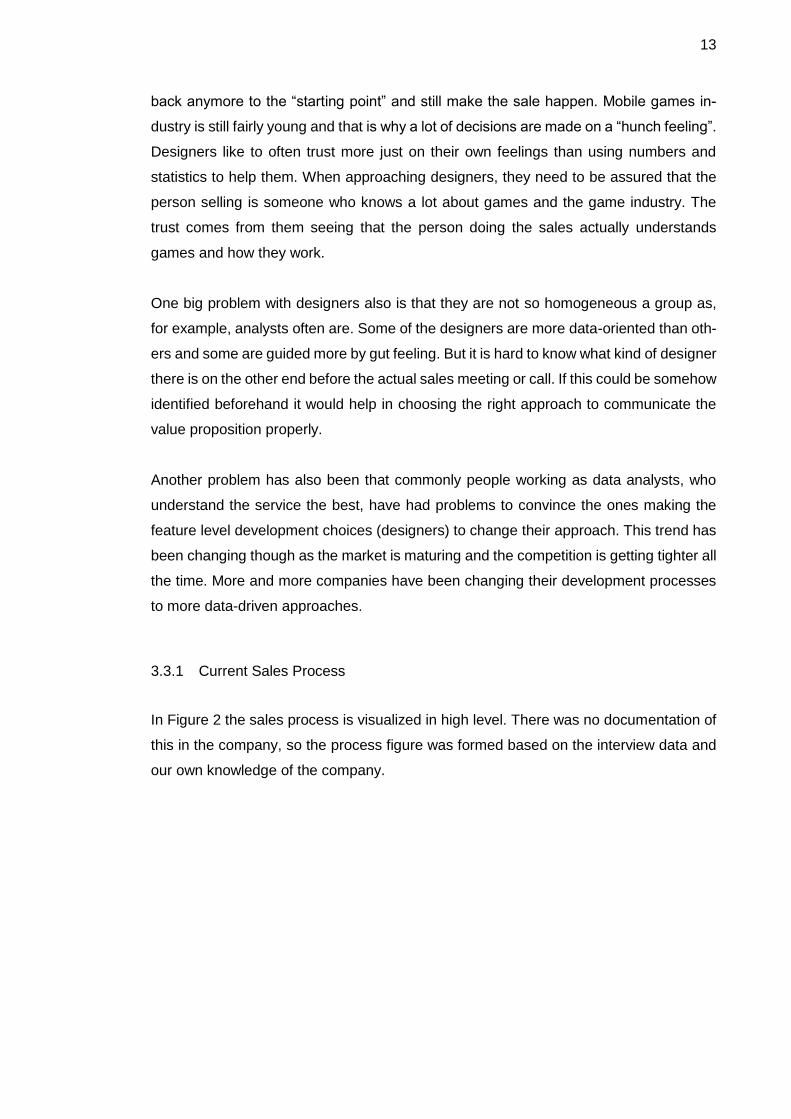
3.3.1 Current Sales Process
In Figure 2 the sales process is visualized in high level. There was no documentation of
this in the company, so the process figure was formed based on the interview data and
our own knowledge of the company.
14
Figure 2. Sales Process
Figure 2 shows that the sales process always starts in the same way. The company is
contacted in some way. After that, the initial meeting or the call is planned. During this

15
phase and after that the company tries to determine what user segment the person com-
ing to the sales meeting represents. The company has made three different sales ap-
proaches for all the segments. The sales hooks differ for different segments based on
the previous experiences of these segments, but there is no documentation for this. Next,
the initial sales meeting or the call is held. If the customer is impressed, then a training
session for them is held next. There a person from the company goes through the service
with a customer and trains them on how to use it properly. When the, customer knows
how to use the service right, a trial version of the service is opened to them so that they
can try it on their own. A task list with the service is also sent with common use case
tasks in order to train them in using the service even better and to minimize misconcep-
tions. After customers have tried the service, it is time to have another meeting. If they
are still interested, then it is negotiated that what features from the service they want to
have and what kind of total package they are willing to get. In the end the service is
opened with the chosen package, and customer relationship management takes over.
If the customer is not interested in the service in any phase of the process, feedback is
gathered on what could make them interested. If the service can be updated towards the
customer’s needs, the customer is contacted again when the requested features are
available. If the value proposition contradicts highly with what customer would want, the
customer relationship is usually ended. The information of all the customers stay in the
CRM-tool the company is using for possible retries in the future.
3.4 Conclusion: Strengths and Weaknesses of the Current Segmentation
The current state of the segmentation is rather mixed, different user segments are iden-
tified, but the needs and pain points are not completely defined and the documentation
of it is lacking. Lacking definition and documentation leads to problems in the sales pro-
cess, for example, in using the right approach and the right way to communicate the
value proposition for each customer.
Sometimes the recognition of the type of the customer before the first sales meeting has
been lacking, which has led to using the wrong approach for the particular customer.
This weakness could possibly be minimized even more through better documentation of
segmentation, which allows easier segment recognition.
16
The sales strategy when approaching the analyst and management segments is proven
to be working, and they have been fairly easy to convince of the value proposition, due
to analysts trusting the data-driven analytical service and management seeing the ben-
efits of the service quickly. Although approaching the management segment has been
working, they often do not make the buy decision alone, but let analysts’ and designers’
opinions influence heavily on the decision, since they would be the frequent users of the
service.
For the designer segment, which has proven to be the most important to win over due to
their high influence on the buy decision, the sales strategy is not working as well as it
should. Problems have lain, for example, in them misunderstanding the product which
then leads to a bad user experience and, in the end, to missed sales opportunity.
One of the weaknesses has also been addressing especially the designers’ pains with
the tools of the service. Additionally, even though the service would address their pains,
assuring the customers of the benefits that the service gives has been problematical due
to the difficult nature of the designer segment. Designers easily see a service that is
based on a mathematical model as a threat to their creativity when designing a game.
Addressing analyst and management segments’ pains seems to be a strength compared
to the designer segment, since approaching these segments have been working fairly
well, although improvements could be made.
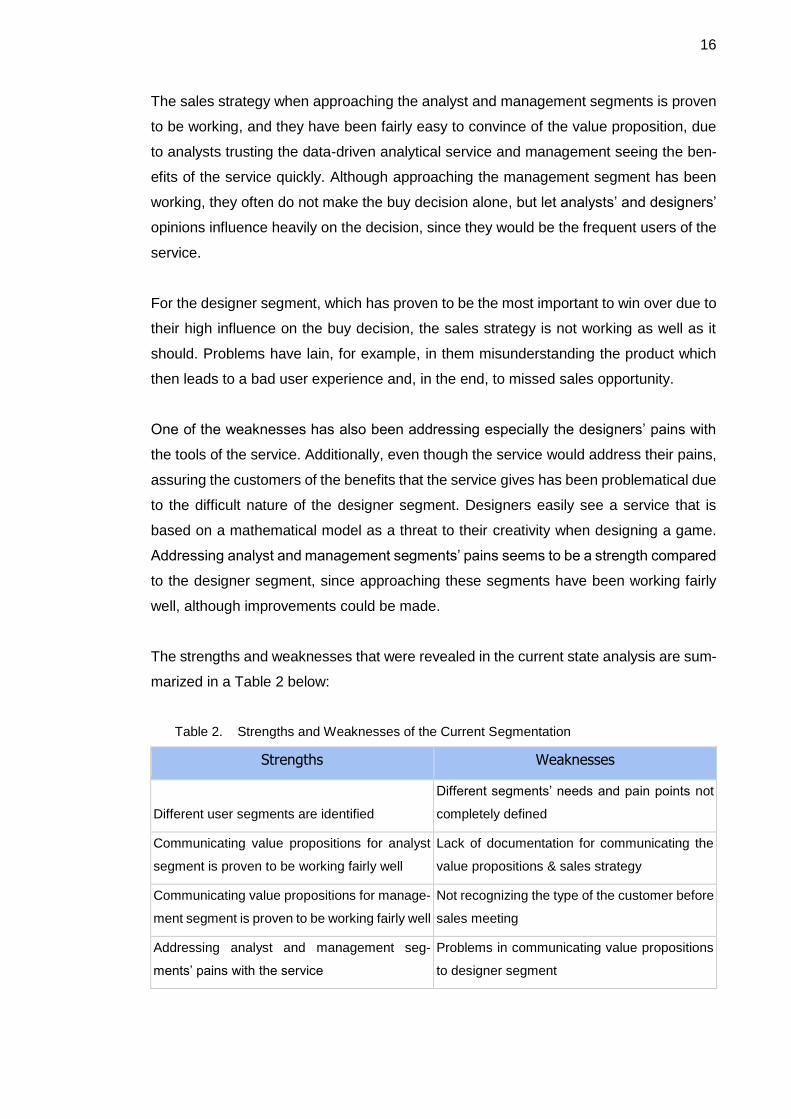
The strengths and weaknesses that were revealed in the current state analysis are sum-
marized in a Table 2 below:
Table 2. Strengths and Weaknesses of the Current Segmentation
Strengths Weaknesses
Different user segments are identified
Different segments’ needs and pain points not
completely defined
Communicating value propositions for analyst
segment is proven to be working fairly well
Lack of documentation for communicating the
value propositions & sales strategy
Communicating value propositions for manage-
ment segment is proven to be working fairly well
Not recognizing the type of the customer before
sales meeting
Addressing analyst and management seg-
ments’ pains with the service
Problems in communicating value propositions
to designer segment

17
User testing of features of the service before
launching them into the product (to ensure qual-
ity and fit for the users’ needs)
Addressing designer segment’s pains with the
service
Designer segment sometimes sees the service
as a threat to their game rather than benefit
Assuring users of the benefits of the service
Alleviating the weaknesses of defining different segments’ needs and pain points and
the lacking documentation for communicating the value propositions and sales strategy
is the focus of this thesis, as they were included in the objectives. Fixing these two weak-
nesses also mitigates the other weaknesses mentioned in the table above.
As can be seen from the table, many weaknesses are related to the designer segment.
It has proven to be difficult to convince this non-homogenous segment about the value
of the service. Designers often having high influence on the buy decision increases these
weaknesses. It is also good to notice the weakness of assuring users of the benefits of
the service, which means that the problem might not be that the service does not offer
value but that it is just not communicated in the right way. Fixing the lacking documenta-
tion would support the communication of the value propositions for each segment, and
this could lead to increase in sales conversion rates.
The strengths are related to the analyst and management segment as sales for these
segments is working fairly well, due to the strength of addressing analyst and manage-
ment segments’ pains with the service. Also, the value propositions of the service have
been able to be communicated better than for the designer segment, but there still could
be improvements to be made.
It is worth to mention that the attitude towards analytics is changing in the industry, mean-
ing that all the segments and the whole game development process is moving towards
a data-driven analytical approach. This can be seen as a significant opportunity for the
service and for the whole business of the company.

18
4 Literature Review and Best Practices
As for the theoretical background of this thesis, the focus is on segmentation, targeting,
positioning (STP) and value proposition theories because they support the objectives of
this thesis. In addition, supporting theories were researched because they are needed
to understand the context of this specific case. These include personas, SaaS theory,
mobile game industry and the role of analytics and the game designer segment.
4.1 Segmentation, Targeting, Positioning
Segmentation, targeting, positioning (STP) is a three-step model for building a marketing
plan and is one of the most common marketing models used today. Popularity of this
model is rather new and it differs from older models in a way that it focuses more on the
customer than on the product. For example, 1950s marketing strategies were more prod-
uct focused. Figure 3 below illustrates the STP model and how customer segments are
considered first before the product positioning. (Hanlon 2016)
Figure 3. STP Model (Hanlon 2016).

19
As shown in the Figure 3, there are three different stages in STP. The first stage is seg-
menting the market into groups or segments, based on different factors such as custom-
ers age, gender or geographic area. (Gilligan & Wilson 2009). The second stage is tar-
geting, which means evaluating the market segments and choosing which of the seg-
ments to focus the marketing strategies on. (Dibb & Simkin 1996). The third and final
stage of STP is positioning the product, brand or organization so that it meets the needs
of the customer. (Gilligan & Wilson 2009). In the next subsections, the three stages are
explained in more detail.
4.1.1 Segmentation
Market segmentation means dividing the market into groups or segments. It can be di-
vided based on many different factors and these factors can be split into four main meth-
ods; demographic, geographic and geodemographic, behavioral and psychographic seg-
mentation. To segment a market effectively, often more than one of these methods have
to be used. (Gilligan & Wilson 2009)
In demographic segmentation, markets can be divided in many different demographic
groups, for example, age, family life cycle, sex, income, education, occupation, religion,
race, and family size. Demographic segmentation is rather easy to use and reliable
method, due to its data being available and easy to interpret, and purchasing behavior
often corresponding with it. (Gilligan & Wilson 2009)
Geographic segmentation divides markets into different groups based on geographical
areas like countries, regions or cities. It can be chosen to target one or even all of the
geographical areas. If many geographic areas are chosen, the company must be aware
that some modifications are often needed to be made to the marketing mix for the differ-
ent geographical areas to address the differences of their preferences. (Gilligan & Wilson
2009) Geographic segmentation becomes useful when the locations of the marketing of
a product vary because purchasing behavior is different for customers based on where
they live or work. (Gunter & Adrian 1992). Though geographic segmentation does have
its limitations since it does not give a complete view of customers’ buying motives as it
is only location based. (Gilligan & Wilson 2009). Because of this, geographic segmenta-
tion has been combined with demographic segmentation, which is called geodemo-

20
graphic segmentation, to enhance the view of customers’ buying motives. Geodemo-
graphic segmentation divides markets based on comparison of the customer's geo-
graphic area and their occupation to more efficiently predict its behavior. (Gunter &
Adrian 1992)
Behavioral segmentation is based on behavioral measures such as attitudes,
knowledge, benefits the buyer is looking for, loyalty and usage rates. Most important of
these is probably the benefit segmentation, as it is the most known and used. Benefit
segmentation divides the market based on benefits that the customers are looking for in
a product. (Gilligan & Wilson 2009) One way of conducting behavioral segmentation is
creating user personas, which is discussed more in section 4.2.
Psychographic segmentation divides markets based on factors such as attitudes, values,
opinions, interests and lifestyles. (Pickton & Broderick 2005). Psychographic segmenta-
tion is often used when demographic and geographic segmentation do not provide view
on customer behavior efficiently enough. Psychological profiles enhance the view about
of the behavior of the targeted markets, in addition to the more general factors such as
age or area. (Gunter & Adrian 1992)
4.1.1.1 Segmentation in B2B Markets
Segmentation in B2B markets is different when compared to segmenting consumer mar-
kets, since businesses behave differently to consumers. Some of the main differences
that are needed to be taken into account are listed below:
- B2B markets’ purchase decision making is more complicated; as for consumers,
the purchase decisions are often made by just one or few persons while in busi-
nesses there can be many different stakeholders influencing on it.
- Consumers make the purchase decision easier due to the fact that they usually
purchase what they want when businesses purchase more based on the actual
need for the product.
- B2B products are more complex as they are often tailored for the customer’s
needs, while consumer products are not so often.
- There are fever number of customers in B2B market, so the importance of a sin-
gle customer and the customer relationship rises. (Hague & Harrison 2017)
21
The most common approach for segmentation in B2B markets is democratic segmenta-
tion, which when used in B2B context is sometimes referred to as firmographic segmen-
tation. It divides the market based on, for example, the customer company size or on the
importance of the customer for the future of the business. Company size, for example,
is a quite reliable segmentation method since customer behavior between small and
large companies is so much different no matter the business area. However, this kind of
general democratic approach may not offer a competitive advantage, so, for example, a
need based segmentation can be used. Need-based segmentation can, nevertheless,
be more challenging to use since it is not as easy to track. Need-based segmentation is
useful because for example in services, some customers might want all the features of
the service while others just part of it at a low cost. Both types of customer cannot be
treated the same way to fully satisfy them. (Hague & Harrison 2017)
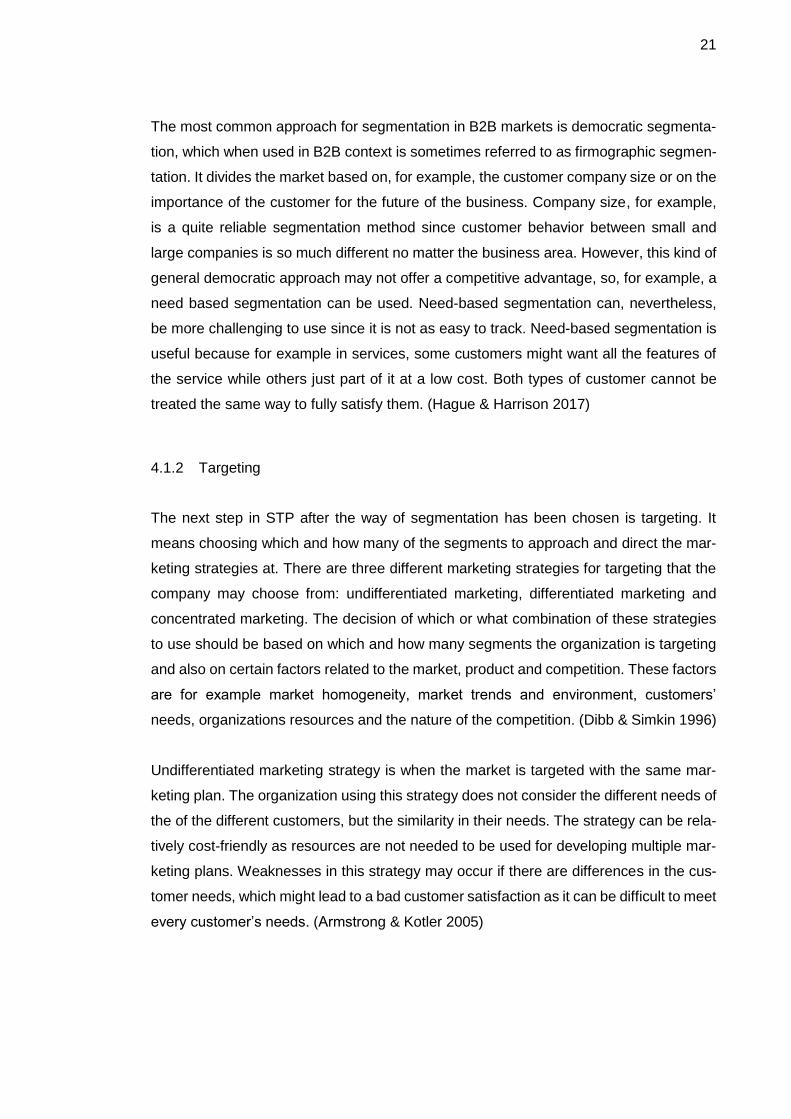
4.1.2 Targeting
The next step in STP after the way of segmentation has been chosen is targeting. It
means choosing which and how many of the segments to approach and direct the mar-
keting strategies at. There are three different marketing strategies for targeting that the
company may choose from: undifferentiated marketing, differentiated marketing and
concentrated marketing. The decision of which or what combination of these strategies
to use should be based on which and how many segments the organization is targeting
and also on certain factors related to the market, product and competition. These factors
are for example market homogeneity, market trends and environment, customers’
needs, organizations resources and the nature of the competition. (Dibb & Simkin 1996)
Undifferentiated marketing strategy is when the market is targeted with the same mar-
keting plan. The organization using this strategy does not consider the different needs of
the of the different customers, but the similarity in their needs. The strategy can be rela-
tively cost-friendly as resources are not needed to be used for developing multiple mar-
keting plans. Weaknesses in this strategy may occur if there are differences in the cus-
tomer needs, which might lead to a bad customer satisfaction as it can be difficult to meet
every customer’s needs. (Armstrong & Kotler 2005)

22
Differentiated marketing strategy is an opposite to the strategy mentioned above, as in
this strategy, a different marketing plan is tailored for each segment. Obviously, this strat-
egy works better when there is notable differences in customer needs, but this strategy
also comes with higher costs, as resources are needed to be used for developing these
different marketing plans. (Armstrong & Kotler 2005)
Concentrated marketing strategy means putting the marketing focus on few or just one
of the segments. This strategy is beneficial when the customers’ needs are clearly known
and when there is knowledge of which segments are the most important ones for the
business. This is a more riskier strategy due to the fact that it can be noticeably profitable
when done right, but also dangerous for the business if the focus is on the less beneficial
segment. (Armstrong & Kotler 2005)
4.1.3 Positioning
When the organization has identified the segments, and chosen which to target, it is time
for the third step in the STP process, which is positioning the product, brand or organi-
zation. Goal of positioning is to stand out from the competition and give the customer
segment a reason why they should buy the product or choose the brand, by positioning
it so it meets their needs and expectations. (Gilligan & Wilson 2009)
Positioning approach gives guidance about locating the organization's brand in the cus-
tomer’s mind. It is about communicating with the customer about what the product is,
how the product differs from other similar products and why they should choose the prod-
uct. Positioning is done based on the organization’s or the products’ strengths and weak-
nesses, and also on the strengths and weaknesses of the competitors. For example, if
the organization notices that the competitors have a weakness that no one of them is
filling a certain need of the customer, which would be a hole in the market, the organiza-
tion could position the product that way that it would fill this need. (Ries & Trout 2001)
In other words, positioning is about identifying the competitive advantage in the organi-
zation's product or brand and communicating this to the customer in the right way. Often
organizations are capable of identifying the competitive advantage but fail on the com-
munication part. There are three different positioning errors causing organizations to fail
on communication with the customer: over-positioning, under-positioning and confused

23
positioning. Over-positioning means that the organization is over-promising and under-
delivering its product to the customer, which leads to many hindrances such as customer
unsatisfactory and customers seeing the product as expensive and invaluable. Under-
positioning means that the message communicated to the customer is too undefined, so
the benefits and difference from similar products are not seen even though it might be
there. Confused-positioning is somewhat similar to under-positioning, but it is more about
giving the wrong message to the customer, which leads them not having clear idea about
the product or what the organization or brand stands for. (Gilligan & Wilson 2009)
4.2 Personas
In the current state analysis, it was found out that the designer segment might not be
that homogenous a group. To tackle this problem, theory about personas was chosen to
be researched to diversify the segment.
Personas are one way of doing behavioral segmentation, which was discussed in chap-
ter 4.1.1. It helps in understanding how the users behave, think and what they are trying
to achieve. They are not real people, but composite archetypes based on the behavioral
research on the real people and their goals. (Cooper 2003)
When creating a product, it is of course important to satisfy your target audience. Logic
might tell you to widen the features as much as possible to accommodate as much peo-
ple as possible, but this way of thinking is actually flawed. The best way is to design for
specific types of individuals with specific needs. Many products are designed to satisfy
too broad audience which leads to lower satisfaction overall. The key is to choose the
right, the most important individuals and their goals and needs first. These individuals
need to be prioritized so that their needs are met without compromising the ability to
meet the needs of secondary users. Cooper gives a good simplified example in his book
on how personas are useful. By designing different products for different people with
different needs, the satisfaction of the users will get better. Personas help to determine
what a product should be and how it should work. Persona goals are the foundation on
what the product design should be based on. (Cooper 2003)
4.2.1 Constructing Personas

24
Creating personas can be divided to seven steps. The first step is identifying distinct
behavioral variables that came up during the research. Usually these can be, for exam-
ple, activities, motivations, attitudes and skills. The next step is to map the wanted us-
ers/subjects to different behavioral variables. After mapping, a clear behavioral pattern
should be identified. Users that cluster in multiple behavioral variables represents a be-
havioral pattern. This form the basis of a persona. Next, the data for all the behavioral
patterns needs to be synthesized. The most important detail to synthesize are the goals.
Identifying the logical connection between different personas and users helps in figuring
out the goals that lead to those behaviors. The next few steps are basically tweaking the
descriptions of the personas and expanding the descriptions. The last step is designating
the persona types and prioritizing them. (Cooper 2003)
Personas can be utilized in creating customer value propositions, which are studied in
the next section.
4.3 Customer Value Proposition
This section gives an overview on what customer value proposition means and how ef-
ficient value propositions can be created. In this study, Osterwalder’s Value Proposition
Design (2014) and its canvas are used as a base, and it will be expanded with other
literature areas
4.3.1 Definition of Customer Value Proposition
There are several different definitions for customer value proposition to be found from
the literature. Osterwalder et.al’s (2014) state value proposition simply as a description
of the benefits customers can expect from your products and services: what value does
your products or services give the customer so they want to pay a certain amount in
exchange for them? According to Barnes et.al’s (2012) value proposition is “a clear, com-
pelling and credible expression of the experience that a customer will receive from a
supplier´s measurable value-creating offering.”
Michael Skok (2013) defines value proposition as “a positioning statement that explains
what benefit you provide for who and how you do it uniquely well. It describes your target
buyer, the problem you solve, and why you’re distinctly better than the alternatives”.

25
4.3.1.1 Definition of value
Value can mean very different things to different people. Some people value for example
the price of some specific product over some other features. For example, someone
wants just simple, easy to use mobile phone. They usually value the price over the wide
feature set that the phone can do. They choose cheap basic phone because it is more
valuable solution to their problem than expensive high-end mobile phone. Mullins et. al
describe value as “a function of intrinsic product features, service and price, and it means
different things to different people”.
Grönroos & Helle (2010) have taken a bit different and broader view. He says that the
customer is actually a co-creator of value as, instead of the value being just something
concerning products or services, value is ultimately formed when the customer is con-
suming them.
4.3.2 Building Customer Value Proposition Using Value Proposition Canvas
Building a customer value proposition is an effort to create explanation on why a cus-
tomer should buy exactly your solution instead of some other competitor’s solution. What
value you can bring to the customer in return of their investment. There are few different
models that can be utilized in order to create an effective customer value proposition. In
this study, Value Proposition Canvas (2014) is used.
Osterwalder’s Value Proposition Canvas is expanding the basic business model canvas
value proposition to gain even better understanding of the customers and the prod-
ucts/services they want. The primary objective of the Value Proposition Canvas is to
assist in developing a value proposition that sees customers’ pain points and tells what
kind of pain relievers company can offer to solve them and what needs to be done in
orders to achieve them. It helps companies to understand the patterns of value creation,
to leverage the experience and skills of the workforce and helps avoiding wasted time
with ideas that won’t work in the end. It zooms into the details of two of the building
blocks of the business model canvas: value propositions and customer segments as
Figure 4 shows. (Osterwalder et. al. 2014)

26
Figure 4. Building Blocks Used for Value Proposition Canvas (Osterwalder et.al. 2014)
Figure 5. Value Proposition Canvas (Osterwalder et.al. 2014)
As can be seen from Figure 5, Osterwalder’s Value Proposition Canvas forms from two
different building blocks: value map and customer profiles. The idea of the canvas comes
from matching these two blocks together. You have to observe customers in order to find
out customer profiles. It describes a specific customer segment in more described way.
27
After mapping the customer profile, a value map is created to figure out how your com-
pany can create value for the customer in the detailed way. The ultimate goal is to find a
fit between these two blocks. (Osterwalder et.al. 2014)
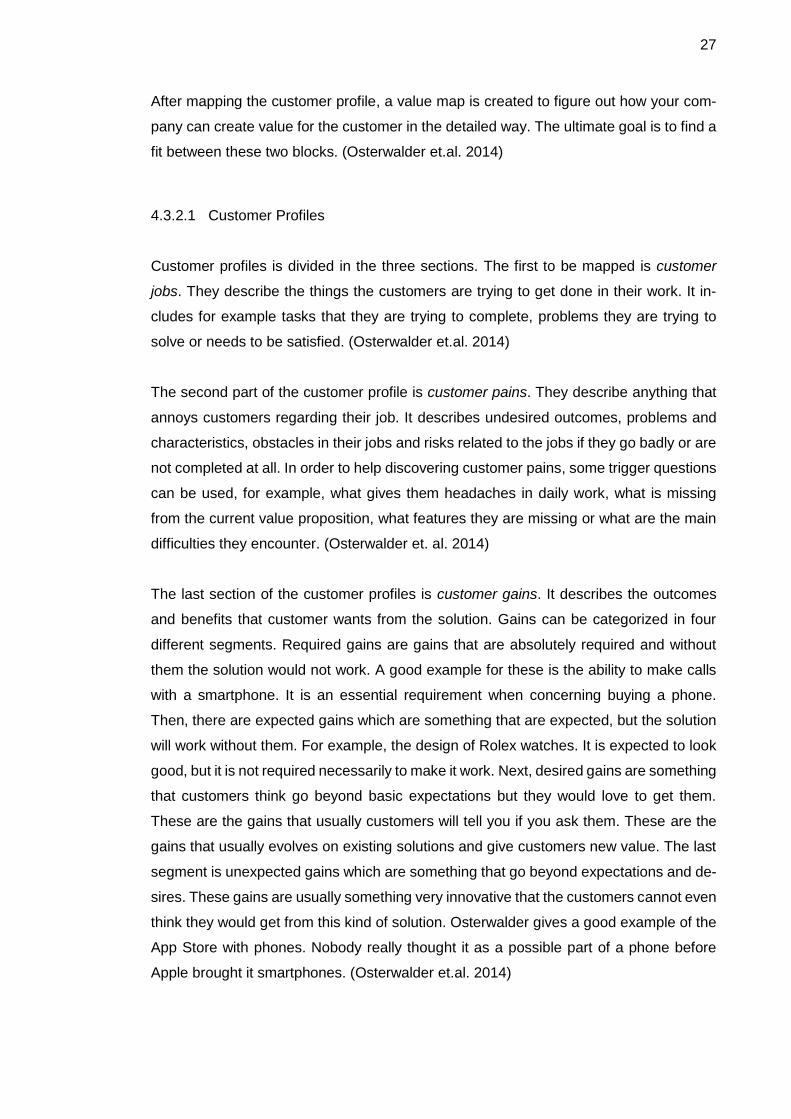
4.3.2.1 Customer Profiles
Customer profiles is divided in the three sections. The first to be mapped is customer
jobs. They describe the things the customers are trying to get done in their work. It in-
cludes for example tasks that they are trying to complete, problems they are trying to
solve or needs to be satisfied. (Osterwalder et.al. 2014)
The second part of the customer profile is customer pains. They describe anything that
annoys customers regarding their job. It describes undesired outcomes, problems and
characteristics, obstacles in their jobs and risks related to the jobs if they go badly or are
not completed at all. In order to help discovering customer pains, some trigger questions
can be used, for example, what gives them headaches in daily work, what is missing
from the current value proposition, what features they are missing or what are the main
difficulties they encounter. (Osterwalder et. al. 2014)
The last section of the customer profiles is customer gains. It describes the outcomes
and benefits that customer wants from the solution. Gains can be categorized in four
different segments. Required gains are gains that are absolutely required and without
them the solution would not work. A good example for these is the ability to make calls
with a smartphone. It is an essential requirement when concerning buying a phone.
Then, there are expected gains which are something that are expected, but the solution
will work without them. For example, the design of Rolex watches. It is expected to look
good, but it is not required necessarily to make it work. Next, desired gains are something
that customers think go beyond basic expectations but they would love to get them.
These are the gains that usually customers will tell you if you ask them. These are the
gains that usually evolves on existing solutions and give customers new value. The last
segment is unexpected gains which are something that go beyond expectations and de-
sires. These gains are usually something very innovative that the customers cannot even
think they would get from this kind of solution. Osterwalder gives a good example of the
App Store with phones. Nobody really thought it as a possible part of a phone before
Apple brought it smartphones. (Osterwalder et.al. 2014)

28
According to the model, it is also very important to rank the customer preferences based
on their importance. Jobs need to be investigated to determine which of them the cus-
tomer considers important or insignificant, what pains are the biggest and which ones
more moderate, and which gains are the essentials and which are just nice to have fea-
tures. This helps to understand the priorities in which to concentrate the most. It is crucial
when designing value proposition that really addresses the thing that customer cares
about. (Osterwalder et.al. 2014)
4.3.2.2 Value Map
Value Map is also divided in three different segments. The first one is products and ser-
vices. It is simply a list of what the company offers. It can be thought in a way as the
company’s shop window. It is all the products and services that company offers and on
what the value proposition is built on. (Osterwalder et.al. 2014)
Second segment is pain relievers. They are formed based on the customer pains that
have been mapped before. Pain relievers describe how your products and services can
help customers tackle specific pains. They outline explicitly how the company’s offering
can help to ease or remove the pain altogether. It is important to remember that it is not
necessary to come up with pain relievers to all possible customer pains, because it is
usually nearly impossible. Focus should be only on few pains that are handled and taken
care of well. (Osterwalder et.al. 2014)
The last segment for the value map is called gain creators. It is basically the counterpart
of the customer gains segment from the customer profiles. Gain creators describe how
your products and services create customer gains. It tells how the company intends to
produce those outcomes and benefits that the customers are expecting, desiring or
would even be surprised of. Each of the gain creators have address at least one or even
more pains or gains from the rest of the figure. (Osterwalder et.al. 2014)
4.3.2.3 Fit
What you want to achieve from the Value Proposition Canvas is fit. It means basically
that customers get excited about the value your products or services are offering. The

29
value map must address pains and gains from the customer profile. This is visualized in
Figure 6. However, it is good to remember that all the pains and gains are usually pretty
impossible to reach. That’s why rating the relevance/importance for all the pains and
gains is crucial. In the end, it is the customer who is the judge of that will your products
or services offer enough value to justify the costs for them. (Osterwalder et.al. 2014)
Figure 6. Achieving Fit with Value Proposition Canvas (Osterwalder et.al. 2014)
There are three stages in achieving fit. The first stage happens on paper at early phase
while prototyping different value propositions and trying to find the one fitting the cus-
tomer profile the best. It is called problem-solution fit. At this phase, there is not yet any
hard evidence on does the customer really care about your value proposition. The fit
exists still only in paper and the next step will be to provide evidence for that this exact
value proposition works in action. This stage is called product-market fit. In this stage,
different value offered is being validated. Some of the ideas may not be giving value to
the customer after all. This phase is a long iterative process, and the value proposition
may need to be designed multiple times again. The last stage is business model fit. In
this phase, you have to find a way to fit your proven value proposition into a profitable
business model. No matter how good your value proposition is, it needs a solid business
model to provide value for the organization itself. When your value proposition is embed-
ded into a profitable and scalable business model, both customer and the organization
itself are gaining value for making the transactions between them. That is the end-goal
that organizations try to reach with their value propositions. (Osterwalder et.al. 2014)
30
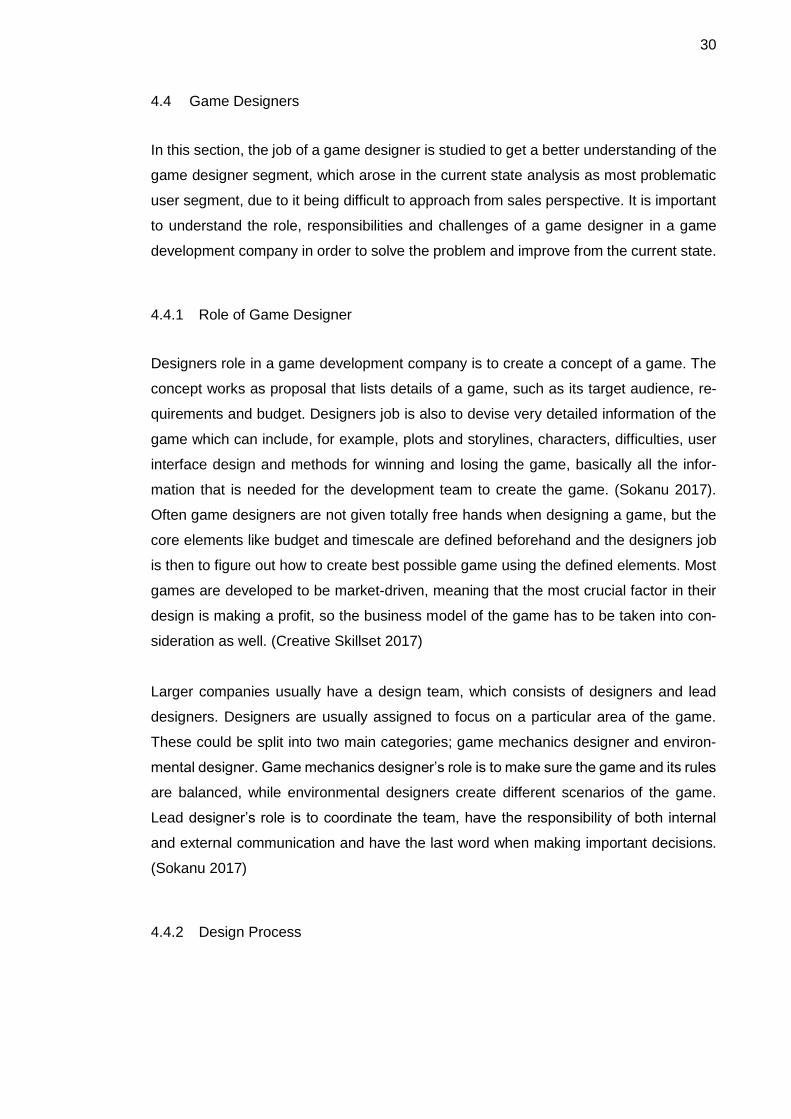
4.4 Game Designers
In this section, the job of a game designer is studied to get a better understanding of the
game designer segment, which arose in the current state analysis as most problematic
user segment, due to it being difficult to approach from sales perspective. It is important
to understand the role, responsibilities and challenges of a game designer in a game
development company in order to solve the problem and improve from the current state.
4.4.1 Role of Game Designer
Designers role in a game development company is to create a concept of a game. The
concept works as proposal that lists details of a game, such as its target audience, re-
quirements and budget. Designers job is also to devise very detailed information of the
game which can include, for example, plots and storylines, characters, difficulties, user
interface design and methods for winning and losing the game, basically all the infor-
mation that is needed for the development team to create the game. (Sokanu 2017).
Often game designers are not given totally free hands when designing a game, but the
core elements like budget and timescale are defined beforehand and the designers job
is then to figure out how to create best possible game using the defined elements. Most
games are developed to be market-driven, meaning that the most crucial factor in their
design is making a profit, so the business model of the game has to be taken into con-
sideration as well. (Creative Skillset 2017)
Larger companies usually have a design team, which consists of designers and lead
designers. Designers are usually assigned to focus on a particular area of the game.
These could be split into two main categories; game mechanics designer and environ-
mental designer. Game mechanics designer’s role is to make sure the game and its rules
are balanced, while environmental designers create different scenarios of the game.
Lead designer’s role is to coordinate the team, have the responsibility of both internal
and external communication and have the last word when making important decisions.
(Sokanu 2017)
4.4.2 Design Process

31
Even if the designer is not given totally free hands on the design for the game, he or she
will still usually have to come up with an idea to begin the designing process. Coming up
with a good innovative idea of a game can be difficult, as there is no fast rule about how
to come up with one. It is recommended that when having difficulties coming up with a
truly original idea, to look at already existing and working games and adding something
new to them. Designers often play and test extensive amounts of games, both successful
and unsuccessful, to see what works and what does not. (Lecky-Thompson 2008)
When the idea is clear, it needs to be made more concrete by refining the idea and
turning it into an initial design. Designers do this by setting the basic rules for the game
and enhancing the core gameplay. This initial design defines key areas for the game
such as level design, game characters, game environment, game dynamics, narrative
elements and backstory and unlockable items or objects. (Lecky-Thompson 2008)
The initial design is then used to convince the game development team or the game
development organization that the game is worth taking forward into development. If the
design is accepted, the game designer will create a design document. Design document
covers the elements and ingredients needed to develop the game, for example it defines
all the game’s functionality, art and animation assets. Design document is referred by
the whole development team throughout the process of developing the game. After the
design document is created, the designer will continue working in the project by instruct-
ing the team and keeping the document updated. Design documents commonly require
updating during the development process due to technical and production decisions and
changes made during the development process. (Creative Skillset 2017)
4.5 Software as a Service
In this section, the concept of software as a service (SaaS) is studied in general, its
benefits for the customers and its business model. It is important to understand SaaS
and SaaS products that provide analytics because it is the main product that the case
company of this study is providing for its user segments.
4.5.1 What is Software as a Service?
32
Software as a service (SaaS) is one of the three cloud service models, which also include
Platform as a service (PaaS) and Infrastructure as a service (IaaS). (Kavis 2014). SaaS
represents the largest cloud market in this category and is still growing. (Apprenda 2017).
Software as a service is basically a whole application that is delivered as a service in the
cloud via Internet for the customer. The SaaS provider handles everything concerning
the delivery of the service or the product, including infrastructure, application logic and
deployments, performance, security, scalability and privacy. All that the customer has to
do is to configure some parameters depending on the SaaS application and manage the
users. (Kavis 2014)
The most common way SaaS providers deliver the service to the customer is a web
browser-based user interface that can be accessed on any device that is connected to
the Internet. Some providers also offer a second delivery method, which is providing
APIs (Application Programming Interface) for the customer which makes integrating fea-
tures to other SaaS solutions they are using or to their existing applications possible.
(Kavis 2014)
Different SaaS solutions can be split into four main categories:
- Enterprise business applications like customer resource management (CRM)
and enterprise resource planning (ERP)
- IT infrastructure solutions for dealing with for example security and monitoring
- Productivity applications that includes tools like collaboration, development and
surveys
- Data applications that include business intelligence, data visualization, dash-
boards and data mining (Kavis 2014).
Biggest benefit of SaaS is that it allows the customer to outsource all applications, fea-
tures and services outside of their core business. Buying these applications and running
them locally is expensive compared to the SaaS applications and would require the cus-
tomer to do many non-value-adding tasks in order to keep the service running, such as
managing the servers and the security. All the resources spent on running these appli-
cations locally could be spent on developing the actual products inside the core business
of the customer and for other value-adding projects. (Kavis 2014)

33
4.5.2 SaaS Business Model
Business model for SaaS providers is usually that they generate revenue through the
customers paying for subscription fees that renew on a monthly or yearly basis. Many
SaaS providers have a tiered model for the service, where the amount of the monthly or
yearly subscription fee depends on the subscription package the customer chooses.
These different subscription packages have different rights for the service, for example,
the minor packages might not have all the features of the service unlocked. There can
also be differences in user capacities and other usage limitations like number of custom-
ers in customer relationship management tool. (Croll & Yoskovitz 2013)
SaaS providers often offer a free version of the service, which is more of a limited trial
version. For example, Dropbox gives its users some storage for free and then encour-
ages users to pay for a paid subscription when the free capacity is used. This is done by
many SaaS providers because adding customer to their SaaS adds almost no incremen-
tal cost for them. (Croll & Yoskovitz 2013)
Some SaaS providers charge the customers for bandwidth, compute cycles or consump-
tion and storage basis, but nowadays these are mostly limited to the two other cloud
service models, Platform as a Service (PaaS) and Infrastructure as a Service (IaaS).
(Croll & Yoskovitz 2013).
4.6 Mobile Game Industry and the Role of Analytics
In this section, a quick overlook to the mobile game industry is taken, how it was born
and what it looks like today. The role of analytics and it’s rise in importance in the industry
is also studied.
4.6.1 History of the Industry
Mobile games as an industry is relatively young compared to many other industries and
even to a traditional game industry. It can be tracked down all the way to the invention
of the mobile phones, but traditionally the birth of the mobile games is considered to be
Snake, which was launched by Nokia for their mobile phones in 1997. (Wright 2016)

34
Back then the market was totally different from the market what it is today. There was no
Internet for mobile phones and the games were not that widely available. Games came
pre-installed with the phones and there was not really a way to sell new games. Then
something called Wireless Application Protocol (WAP) came around. It was the first big-
ger revolution on how new mobile games could be sold for the consumers. WAP enabled
consumers to have a connection to Internet with their mobile phones. It was basically a
small web browser that enabled phones to connect to a server and download data to the
devices over Internet. WAP essentially created the early ecosystem that allowed game
developers to sell their games over Internet to the customers. It was a revelation that
would eventually help mobile game industry to grow into a billion-dollar business. (Wright
2016)
The innovation that really kicked off the mobile game industry in a big way was of course
the smartphones. The first iPhone was released in 2008 and with it came also the revo-
lutionary App Store. It changed the business model of purchasing mobile games through
online stores. App Store was a much more advanced version of WAP’s game selling and
providing capabilities. It made publishing and buying mobile games so much easier. Of
course, the devices got also much more powerful which allowed game developers to
make more graphically visual and better games as well. (Alex I. 2011)
The most used and successful business model also changed with smartphones. Free-
to-play model became the most successful business model. Game developers adopted
SaaS approach familiar from other industries to the mobile game market. GaaS (Games
as a service) model was born. (Loureiro 2016). Players can download and play the
game’s core for free. The idea of the business model centers around players’ willingness
to use money to purchase for example in game items once they have tried the game and
its mechanics out. Monetization is made usually through advertisement or in-game pur-
chases. (Techopedia 2017)
As smartphones brought constant Internet connection to mobile devices, it enabled game
developers to collect enormous amounts of data as well. Data analytics started to grow
in importance in mobile game development. As games became free to download, it be-
came increasingly more important to know how to handle the user data in order to be
successful. (Loureiro 2016)

35
4.6.2 Analytics in the Mobile Games Industry
As the industry is maturing the role of the analytics become all the time more important.
As smartphone based free-to-play mobile games have been around for a while, it has
become increasingly difficult for the game developers to get the attention and revenues
they are heading for. A lot of things have changed since the first smartphone games
came out. Free-to-play model allows users to download as many games as they want
without paying any money and device memory is not usually such a concern anymore
so downloading new games without a second thought is common. The application mar-
ket is also very oversaturated nowadays. There are thousands and thousands of appli-
cations to choose from so it has become increasingly difficult to stand out from the
masses. (Herman 2017) Competition is tougher than ever, and that is why analytics is
more and more important way for finding competitive advantage.
It is said that the most important metric concerning free-to-play mobile games is reten-
tion. It is crucial to build a relationship to the players and keep them returning to your
game. The most successful free-to-play games create long-term relationships with the
players. When players get invested in the game, they are also more willing to make in-
game purchases to gain some advantages. After all repeat purchasers generate most of
the average free-to-play mobile games’ revenue. (McCalmont 2015) Analytics allows
game developers to understand in real-time why users are abandoning a game and iden-
tify other players at risk of leaving the game so they can develop player retention strate-
gies before those players quit. (Chulis 2012). Analytics can help the developers to tweak
the game and increase retention and engagement metrics significantly by following user
data and making data-driven decisions based on them. (DeYoung 2016). Analytics can
also be used already in the production phase of a game to get fact-based data to support
the design process.
4.7 Conceptual Framework
In order to reach the objective of this thesis, it is important to study and understand the
existing theory and best practices that support it. It was chosen to focus on segmentation,
targeting, positioning (STP) and value proposition theories and make them a core theory
of this study, since they support the objectives of this thesis. In addition, to understand
the context of this specific case supporting theories were studied. All of this theory
formed a conceptual framework for this thesis, which is illustrated in a figure below:

36
Figure 7. Conceptual Framework
4.7.1 Core Theories
Creation of conceptual framework was started with studying of segmentation, targeting,
positioning (STP) theory. It gave good insight about segmentation and its different
phases, which was important to understand due to the business challenge revolving
around segmentation. It was found out in the current state analysis that the case com-
pany had problems in approaching some of the customers, due to them not realizing
value of the service. According to theory about STP, this could be because of not being
able to communicate the product's value well enough to the user segments. Additionally,
STP gave insight on positioning approach, which gives guidance for example about com-
municating with the customer about the benefits of the product, how the product differs
37
from competition and why they should choose it. Customers not realizing value of a prod-
uct could be also linked to under-positioning, which is according to the STP theory, a
common error in positioning caused by too undefined communication about the product
to the customer so they do not see the benefits, value and differences to similar products.
It was also found out in the current state analysis, that the user segments were known,
but the segments’ needs and pain points were not completely defined and the documen-
tation of that was lacking. Value proposition theory was selected in order to get useful
insight about mapping customer needs and pain points and creating fitting value propo-
sitions. Studying value propositions was started with basic theory and definitions, which
gave understanding of the concept and guidance on creating effective value proposi-
tions.
Because the case company’s documentation was lacking and one of the objectives of
this thesis was to create a visualization covering the different user segments’ needs and
how the service fits to those needs, it was discovered that Osterwalder’s Value Proposi-
tion Canvas would be perfect solution. Alex Osterwalder’s Value Proposition Canvas is
basically an expansion for the business model canvas. The primary objective for the
Value Proposition Canvas is to assist in developing a value proposition that sees cus-
tomers’ pain points and what pain relievers the company’s product/service could offer
them. It is formed from two building blocks: value map and customer profiles. First, the
company has to track the customer segments’ jobs, pains and gains, and after that, they
have to map their own products/services and the value/gains they would give to the cus-
tomers. Due to nature of the problems that company has had in impressing some seg-
ments, it was figured that creating Value Proposition Canvases for each one of them
would help the company to find new angles to the sales process. As the case company
is operating in B2B-market, it is also important to remember that there are always several
stakeholders that have influences on the company’s decision making. Company should
be aware of all of the stakeholders and how they should be accounted for in creating
process of the value propositions.
4.7.2 Supporting Theories
In order to create a fitting value propositions for this specific context, some more theories
related exactly to this case had to be researched to support the core theories. These

38
supporting theories consisted of game designers, personas, SaaS products and mobile
game industry and role of analytics in it.
Current state analysis revealed that the most problematic user segment was game de-
signers. There were problems in communicating the value of the product for this seg-
ment, due to its difficult nature. Game designers are often seen as artistic personalities
that see analytics as a threat to their creativity in designing games and overall the whole
segment is quite non-homogeneous. Because of this the game designer segment was
researched more thoroughly by studying the role, responsibilities and challenges of
game designers in a game development company. This theory will help creating the
value proposition and mapping the customer profile for this specific segment.
To address the possible challenges in creating value proposition for the designer seg-
ment caused by the segments’ non-homogeneity, theory about personas was chosen to
be studied. Personas are one way of doing behavioral segmentation which helps in un-
derstanding how the users behave, think and what they are trying to achieve. As the
game designer segment is fragmented, personas will help in finding behavioral patterns
inside the segment. With the personas, multiple value propositions for one segment can
be created to tackle the differences inside it.
As the main product that the case company is providing for its customers is a Software
as a Service (SaaS) product, it plays important part in this study to understand the con-
cept of SaaS. SaaS was studied for its benefits for the customers and how its business
model works. SaaS theory that was studied supports especially the creation of value
map, which is the other half of the Value Proposition Canvas that is the output of this
thesis. Understanding the concept of the company’s product that the value proposition
is created for is crucial as the objective of value map is to describe explicitly how the
product or service creates value, as it came out in the value proposition canvas theory.
Because the case company’s SaaS product is targeted towards mobile game developers
and it provides them with analytical tools, the industry and the role of analytics had to be
studied more closely. When the smartphones, app stores and the free-to-play model
came around, they revolutionized the mobile game market. New easy way to access
games and also publish them gave perfect platform for the industry to grow. Competition
in the market has got tougher and tougher all the time. Application markets have become
oversaturated and standing out from the masses is harder than ever. To find competitive

39
advantage, the role of analytics has risen. During the current state analysis, it was found
out that utilizing analytics is actually pretty recent phenomenon in the relatively young
mobile game industry. Data-driven game development is becoming a trend and utilizing
analytics have become more necessary in order to achieve success. As these trends
have also been noticed in the companies and the attitudes towards game development
are also changing to more data-driven, this helps the case company to sell their product.

40
5 Building Proposal for the Case Company
This section covers the outputs of the project, which were the results from the compari-
son of the current state analysis, conceptual framework, user segment interviews and
the workshop.
5.1 Forming the Proposal
The proposal was formed by first creating Value Proposition Canvases with the data from
the current state analysis, conceptual framework and user segment interviews. The user
segment interviews were split into two parts: customer company interviews and case
company's manager interviews. Below is a table illustrating how the interviews were held:
Table 3. User segment interviews
Part Company Interviewee Date
1.
Customer company 1
Lead Designer 1 22.2.2017
Game Designer 1 23.2.2017
Analyst 1 27.2.2017
Management 1 28.2.2017
Customer company 2
Game Designer 2 1.3.2017
Game Designer 3 1.3.2017
Analyst 2 3.3.2017
Management 2 6.3.2017
Customer company 3
Lead Designer 2 8.3.2017
Analyst 3 10.3.2017
2.
Case company
Case company manager 1 13.3.2017
Case company manager 2 17.3.2017
In the part one, three different customer companies were interviewed. Inside the compa-
nies, different personnel belonging to the segments based on the segmentation were
interviewed about their normal workday, their aspirations in their work and the pains and
risks they encounter. Customers were also interviewed on what benefits they get from
the case company’s service what kind of expectations they have for analytics services in

41
general. In the second part of the interviews the same question were presented to the
case company’s managers to get their view from the service’s side, hear their experi-
ences working with these segments and because customers do not always recognize all
of their pains and needs.
After the interviews the Value Proposition Canvases were created for all the chosen seg-
ments: designer, analyst and management. Additionally, as it can be seen in the Table
3, the designer segment is split into two personas, lead designer and game designer,
because differentiating patterns inside the designer segment were found when going
through the gathered information. Lead designers had similar patterns in their answers,
which differentiated from the answers of the game designers.
Next, the Value Proposition Canvases were validated and finalized in a workshop to-
gether with the case company’s managers. The fit between customer profiles’ pains and
gain expectations with the case company’s service’s value map’s pain relievers and gain
creators were discussed, linked and ranked based on their relevance.
Below is a template of Value Proposition Canvas with the descriptions of what each sec-
tion is supposed to contain, which was used in creating the proposal. Upper part is cus-
tomer profiles containing customer jobs, pains and gains and the lower part is the value
map which contains products and services, pain relievers and gain creators. Value Pro-
position Canvas was explained more thoroughly in chapter 4.3.3.

42
Figure 8. Value Proposition Canvas Template
Based on the results of the workshop, a proposal was formed which consists of the fol-
lowing parts:
- Value Proposition Canvases for two personas identified inside the designer seg-
ment (lead designer, game designer) and for the other segments (analyst and
management).
- Tables illustrating specific user segment’s pains and gain expectations, their rel-
evance and the fit between pains and gain expectations and the service’s value
map’s pain relievers and gain creators.

43
5.2 Proposal
This section contains the proposal of this thesis. It consists of Value Proposition Can-
vases and tables to support the communication of value propositions for different seg-
ments.
5.2.1 Lead Designer
Lead designers usually have a bigger picture of the game development projects than the
normal game designers. They are the team leaders and do not focus on the tinier details
that much. Lead designers have a lot of team/project management jobs to do as well,
which differs them from normal game designers. As team leaders, lead designers also
must make a lot of decisions and choices regarding the projects which gives them a great
deal of responsibilities. Below is the Value Proposition Canvas for this segment, which
was created based on the interview results of Lead designer 1, Lead designer 2 and
Case company manager 1. Summary of these interview results can be found in Appendix
2.

44
Figure 9. Value Proposition Canvas for Lead Designer Segment
Table 4 below illustrates the segment’s pains and gain expectations and the case com-
pany’s service’s pain relievers and gain creators from the Value Proposition Canvas.
Customer pains and gain expectations are ranked for their relevancies and the fit be-
tween customer profile and value map is shown. The relevance ranking and the fit were
done based on interview results of Lead designer 1, Lead designer 2, Case company
manager 1 and the workshop with case company managers. Summary of the interview

45
results can be found in Appendix 2. It is important to remember that the relevancies are
generalizations of the specific segment and the actual preferences may vary between
different people inside the segment.
Table 4. Fit Between Customer Profile and Value Map for Lead Designer Segment
Customer profile Lead designer segment Value map
Rele-vance
Customer pain Fit Pain reliever
1. Pressure for making right decisions
Lead designers can get information about trends and dif-ferent features’ effects on the commercial potential of the game and support for deciding what features should be implemented next
Supports fact based decision making through real data
2. Wasting time with ideas that do not work
Lead designers can get valuable information about differ-ent game features and which features would be wise to implement to their own games in order to improve com-mercial potential
Helps choosing right features for game
3. No clear path for de-signing
Different feature sets can be tested with game analyzer and useful information can be acquired for building a roadmap for the development process
Helps in planning roadmap / Find differentiating features between successful and un-successful games
4. Uniqueness vs com-mercialism
There are no tools that directly help in balancing between uniqueness and commercialism
5. Lack of time/resources Concepts can be tested to see if they have feature sets that have high potential to be commercially successful. Service also reduces time that has to be used in market research. These help in choosing where resources should be allocated
See where resources should be spent in game develop-ment
6. Lack of knowledge about entering different geographical markets
At the moment, there is only data from one certain market available
6. Dealing with risks/un-certainty
Fact based data can be acquired, which reduces risks/uncertainty when implementing new features
Minimizes risks/uncertainty when implementing new fea-tures
7. Bad communication Service is not meant for improving communication
Rele-vance
Customer gain ex-pectation
Fit Gain creator
1. Get support for deci-sion making
Lead designers can get information about trends and dif-ferent features’ effects on the commercial potential of the game and support for deciding what features should be implemented next
Gives fact-based data to help make decisions
2. Helps in planning road-map
Different concepts can be tested in game analyzer to find out most potential ones
Analyze concepts to see sug-gestions for development pro-cess
3. Get data about what could be done to im-prove game’s commer-cial potential
Analyze games and see what features could be imple-mented to them to improve commercial potential
Optimize games pre-launch / post-launch to maximize po-tential revenue
4.. Get the same data for At the moment, there is only data from one certain market available

46
all different geograph-ical markets
5. Team management tools
There are no team management tools in the service
6. Get information about competitors
Find out closest competitors in the market and see the feature sets of their games
Learn about competitors
7. Make time/resource management efficient
Access already processed data about market trends and competitors’ games. Game features that differentiate suc-cessful/unsuccessful games can be found from the ser-vice also
Save time on choosing fea-tures for games / Save time in doing market research
8. Get good ideas Get suggestions of what features could be added to a specific game to increase its commercial potential and ideas how those could be implemented into the game
Gives feature ideas on what to implement next
9. Qualitative analysis data about the overall quality of the specific games
This service does not offer qualitative research or opin-ions about games
10. Find relevant data easily
Access data about game features that is not available an-ywhere else, which saves resources from finding the data manually
Easily accessible unique data
11. Accessible The service is SaaS with browser-based user interface that is accessible on any device that is connected to the Internet
Access easily through web-site
As can be seen from the Table 4, the service can help in most of the pains and gain
expectations of lead designers. The most relevant pain that is not met is the balancing
between uniqueness and commercialism. The service’s core business idea is to offer
tools to make games commercially potential so there are any directly alleviating factors
for this pain point. Another relevant aspect that is not met with the service is the need for
the data from different geographical markets as well. This information is something that
is good to notice in the development of the service by the case company. The last factors
that the service cannot help with are team management tools and qualitative analysis.
These are not that suitable for this exact service. The output of this table shows there is
value for lead designers so the major problem found out in the current state analysis is
not that the service would not offer any value to this segment.
5.2.2 Game Designer
Game designer’s role in the company is usually to create concepts for games. They are
usually focusing on more specific things than lead designers. They usually are assigned
to focus on particular areas or specific features. In the current state analysis, it was men-
tioned that some of the designers might be “artistic personalities” and more commonly

47
they are normal game designers not lead designers. Below is the Value Proposition Can-
vas for this segment, which was created based on the interview results of Game designer
1, Game designer 2, Game designer 3 and Case company manager 1. Summary of
these interview results can be found in Appendix 2.
Figure 10. Value Proposition Canvas for Game Designer Segment

48
Table 5 below illustrates the segment’s pains and gain expectations and the case com-
pany’s service’s pain relievers and gain creators from the Value Proposition Canvas.
Customer pains and gain expectations are ranked for their relevancies and the fit be-
tween customer profile and value map is shown. The relevance ranking and the fit were
done based on interview results of Game designer 1, Game designer 2, Game designer
3, Case company manager 1 and the workshop with case company managers. Summary
of the interview results can be found in Appendix 2. It is important to remember that the
relevancies are generalizations of the specific segment and the actual preferences may
vary between different people inside the segment.
Table 5. Fit Between Customer Profile and Value Map for Game Designer Segment
Customer profile Game designer segment Value Map
Rele-vance
Customer pain Fit Pain reliever
1. Hard to know what fea-tures should be imple-mented
Service provides data about what features have the biggest effect on the specific games’ commercial potential
Find the differentiating fea-tures between successful and unsuccessful games
2. Team does not approve own ideas
Fact based data can be used to rationalize why certain con-cepts would be potential
Helps proving own con-cepts to others with facts/real data
3. Uniqueness vs commer-cialism
There are no tools that directly help in balancing between uniqueness and commercialism
4. Lack of creativity
Competitor data and the implementation examples of differ-ent features can help in getting ideas and inspiration for de-signing games
Get ideas through exam-ples and competitor data
5. Wasting time with ideas that do not work
Saves time as ideas that won’t work can be identified early in the development
Helps choosing right fea-tures for game
6. Lack of time/resources Designing process becomes more efficient as the service gives insights on what features are actually wise to imple-ment without wasting resources
Helps choosing right fea-tures for game
7. Visual preferences of certain user segments not known
There is some visual data available, but there is no data about different segments’ preferences
8. Bad communication Service is not meant for improving communication
Rele-vance
Customer gain ex-pectation
Fit Gain creator
1. Get help in the develop-ment process
Make sure that your games’ feature sets have potential to be commercially successful using the service’s statistical model
Helps creating commer-cially potential games
2. Get good ideas Get suggestions of what features could be added to a spe-cific game to increase its commercial potential and ideas how those could be implemented into the game
Gives feature ideas on what to implement next

49
3. Get data about what could be done to im-prove game’s commer-cial potential
Analyze games and see what features could be imple-mented to them to improve commercial potential
Optimize games pre-launch / post-launch to maximize potential reve-nue
4. Get information about competitors
Find out closest competitors in the market and see the fea-ture sets of their games
Learn about competitors
5. Find relevant data easily Access data about game features that is not available any-where else, which saves resources from finding the data manually
Easily accessible unique data
6. Make time management efficient
Access already processed data about the market trends and competitors’ games
Save time in doing market research
7. Deep visual data about different themes and genres
There is some visual data available, but it is not as deep as some customers would like to have
8. Accessible The service is SaaS with browser-based user interface that is accessible on any device that is connected to the Internet
Access easily through website
As can be seen from the Table 5, most of the relevant game designer segment’s pains
and gain expectations can be met with the service. The most relevant pain that is not
met is identical to the lead designer segment: balancing between uniqueness and com-
mercialism. The service’s core business idea is to offer tools to make games commer-
cially potential so there are any directly alleviating factors for this pain point. Other pains
and gain expectations that are not met relate to the visual data. This might be useful
information when concerning what to develop next in the service to meet the customer
expectations even better in the future. The output of this table shows that there is clearly
value in the service also for game designers, so it is not the biggest issue from the weak-
nesses found in the current state analysis.
5.2.3 Analyst
Analysts’ job in the game development company is to provide data and conclusions to
game designers so that they can make better games. The data can be, for example, user
data from the game, market data or competitor data. Below is the Value Proposition
Canvas for this segment, which was created based on the interview results of Analyst 1,
Analyst 2, Analyst 3 and Aase company manager 2. Summary of these interview results
can be found in Appendix 2.

50
Figure 11. Value Proposition Canvas for Analyst Segment
Table 6 below illustrates the segment’s pains and gain expectations and the case com-
pany’s service’s pain relievers and gain creators from the Value Proposition Canvas.
Customer pains and gain expectations are ranked for their relevancies, and the fit be-
tween customer profile and value map is shown. The relevance ranking and the fit were
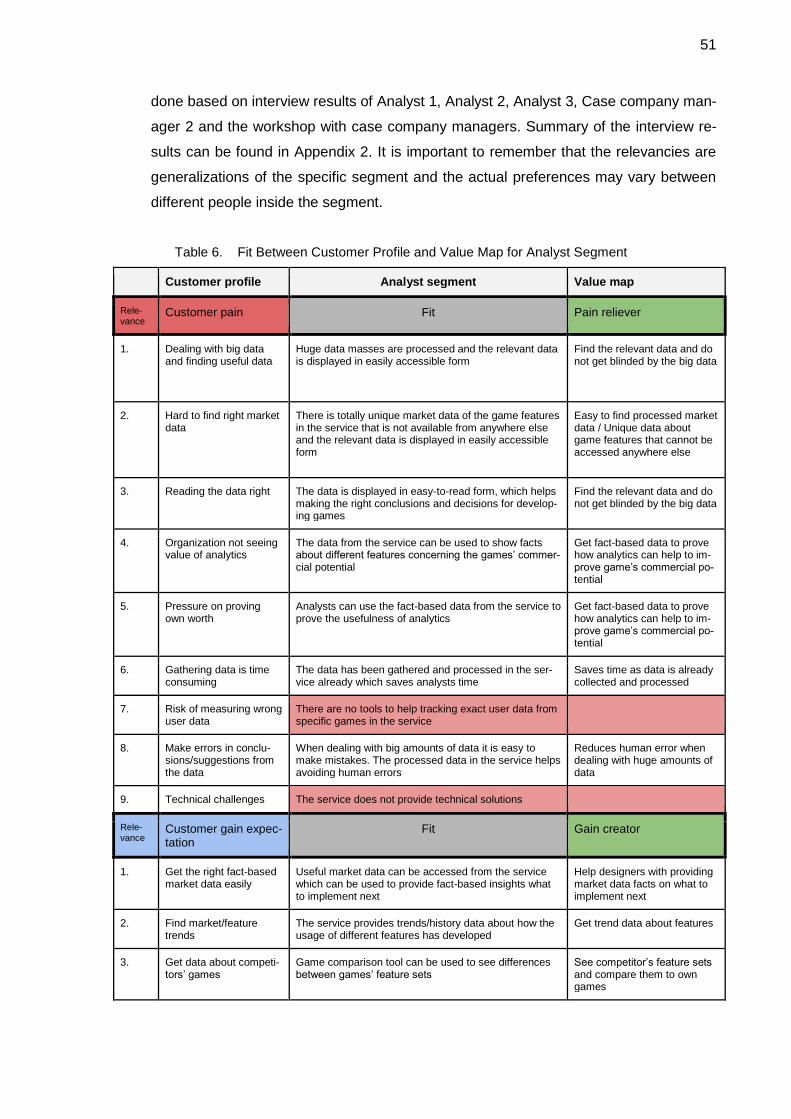
51
done based on interview results of Analyst 1, Analyst 2, Analyst 3, Case company man-
ager 2 and the workshop with case company managers. Summary of the interview re-
sults can be found in Appendix 2. It is important to remember that the relevancies are
generalizations of the specific segment and the actual preferences may vary between
different people inside the segment.
Table 6. Fit Between Customer Profile and Value Map for Analyst Segment
Customer profile Analyst segment Value map
Rele-vance
Customer pain Fit Pain reliever
1. Dealing with big data and finding useful data
Huge data masses are processed and the relevant data is displayed in easily accessible form
Find the relevant data and do not get blinded by the big data
2. Hard to find right market data
There is totally unique market data of the game features in the service that is not available from anywhere else and the relevant data is displayed in easily accessible form
Easy to find processed market data / Unique data about game features that cannot be accessed anywhere else
3. Reading the data right The data is displayed in easy-to-read form, which helps making the right conclusions and decisions for develop-ing games
Find the relevant data and do not get blinded by the big data
4. Organization not seeing value of analytics
The data from the service can be used to show facts about different features concerning the games’ commer-cial potential
Get fact-based data to prove how analytics can help to im-prove game’s commercial po-tential
5. Pressure on proving own worth
Analysts can use the fact-based data from the service to prove the usefulness of analytics
Get fact-based data to prove how analytics can help to im-prove game’s commercial po-tential
6. Gathering data is time consuming
The data has been gathered and processed in the ser-vice already which saves analysts time
Saves time as data is already collected and processed
7. Risk of measuring wrong user data
There are no tools to help tracking exact user data from specific games in the service
8. Make errors in conclu-sions/suggestions from the data
When dealing with big amounts of data it is easy to make mistakes. The processed data in the service helps avoiding human errors
Reduces human error when dealing with huge amounts of data
9. Technical challenges The service does not provide technical solutions
Rele-vance
Customer gain expec-tation
Fit Gain creator
1. Get the right fact-based market data easily
Useful market data can be accessed from the service which can be used to provide fact-based insights what to implement next
Help designers with providing market data facts on what to implement next
2. Find market/feature trends
The service provides trends/history data about how the usage of different features has developed
Get trend data about features
3. Get data about competi-tors’ games
Game comparison tool can be used to see differences between games’ feature sets
See competitor’s feature sets and compare them to own games

52
4. Get recognized by or-ganization
Analyst gets recognized when he/she is able to provide useful insights that lead to commercially potential games
Get fact-based data to support making commercially potential games through analytics
5. Saves time The data has been gathered and processed in the ser-vice already which saves analysts time
Saves time as the data is al-ready collected and pro-cessed
6. Helps in forming reports about market data
Data from the service can be imported to csv-files which can be used in forming own reports
Get csv-files of data to help form reports
7. Helps in forming reports about own game’s met-rics
The service is not meant to measure user data
8. Get examples of how different features could be implemented to sup-port the data in reports
Implementation examples from different features can be used to support the data and form even better reports
Find implementation examples to support the data in the re-ports
9. Get help choosing the right metrics to collect user data
The service is not meant to measure user data
10. Accessible The service is SaaS with browser-based user interface that is accessible on any device that is connected to the Internet
Access easily through website
As can be seen from the Table 6, the most relevant analyst segment’s pains and gain
expectations can be met with the service. The only relevant pains and gain expectations
that are not met are related to measuring user data in games and technical challenges,
which the service is not meant for. The output of this table confirms the strengths found
in the current state analysis about meeting analyst segment’s pains with the service.
5.2.4 Management
The role of management in game development companies is quite self-explanatory. They
oversee the development teams and report to organization’s upper management about
the teams’ games and their performance. Management are looking the development pro-
ject mainly through financial aspects. Below is the Value Proposition Canvas for this
segment, which was created based on the interview results of Management 1, Manage-
ment 2 and Case company manager 1. Summary of these interview results can be found
in Appendix 2.

53
Figure 12. Value Proposition Canvas for Management Segment
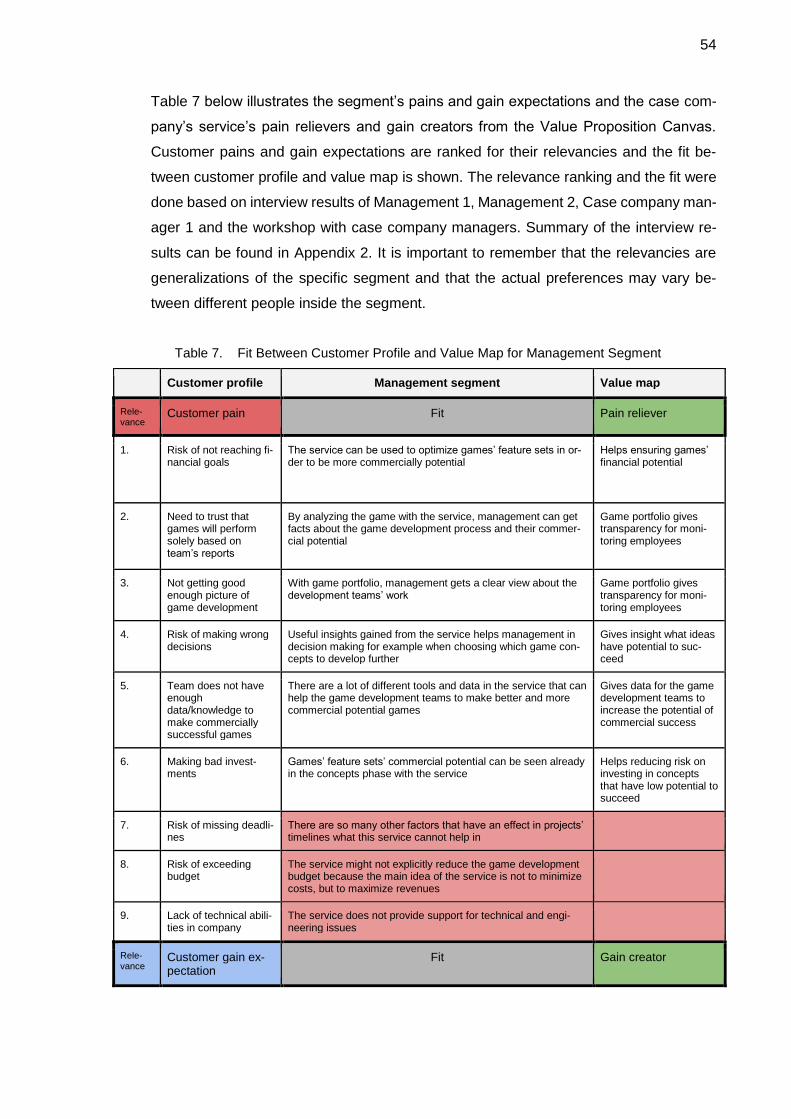
54
Table 7 below illustrates the segment’s pains and gain expectations and the case com-
pany’s service’s pain relievers and gain creators from the Value Proposition Canvas.
Customer pains and gain expectations are ranked for their relevancies and the fit be-
tween customer profile and value map is shown. The relevance ranking and the fit were
done based on interview results of Management 1, Management 2, Case company man-
ager 1 and the workshop with case company managers. Summary of the interview re-
sults can be found in Appendix 2. It is important to remember that the relevancies are
generalizations of the specific segment and that the actual preferences may vary be-
tween different people inside the segment.
Table 7. Fit Between Customer Profile and Value Map for Management Segment
Customer profile Management segment Value map
Rele-vance
Customer pain Fit Pain reliever
1. Risk of not reaching fi-nancial goals
The service can be used to optimize games’ feature sets in or-der to be more commercially potential
Helps ensuring games’ financial potential
2. Need to trust that games will perform solely based on team’s reports
By analyzing the game with the service, management can get facts about the game development process and their commer-cial potential
Game portfolio gives transparency for moni-toring employees
3. Not getting good enough picture of game development
With game portfolio, management gets a clear view about the development teams’ work
Game portfolio gives transparency for moni-toring employees
4. Risk of making wrong decisions
Useful insights gained from the service helps management in decision making for example when choosing which game con-cepts to develop further
Gives insight what ideas have potential to suc-ceed
5. Team does not have enough data/knowledge to make commercially successful games
There are a lot of different tools and data in the service that can help the game development teams to make better and more commercial potential games
Gives data for the game development teams to increase the potential of commercial success
6. Making bad invest-ments
Games’ feature sets’ commercial potential can be seen already in the concepts phase with the service
Helps reducing risk on investing in concepts that have low potential to succeed
7. Risk of missing deadli-nes
There are so many other factors that have an effect in projects’ timelines what this service cannot help in
8. Risk of exceeding budget
The service might not explicitly reduce the game development budget because the main idea of the service is not to minimize costs, but to maximize revenues
9. Lack of technical abili-ties in company
The service does not provide support for technical and engi-neering issues
Rele-vance
Customer gain ex-pectation
Fit Gain creator

55
1. Get fact-based sup-port for decision mak-ing
For example, the service provides help in showing which con-cepts have potential to be commercial successes. This infor-mation can be used when making decisions on what projects will be carried through
Gives fact-based data to help make decisions
2. Get informative over-view on games’ com-mercial potential
With game portfolio view it is possible to monitor the commer-cial potential of company’s all games from concept to post-pro-duction
Monitor own games’ commercial potential
3. Get transparency on teams’ work
By using the game portfolio, management gets transparency on the game development projects and their potential in every development phase
Monitor own games’ commercial potential
4. Team management tools
There are no team management tools in the service
5. Get the needed tools for the team
There are a lot of different tools in the service that the game development teams can use in order to make better and more commercial potential games
Gives tools for the team to make better games
6. Stay up to date on game market trends
News feed in service provides news about changes in different games’ feature sets
Gives news about changes and trends in the market
7. Accessible The service is SaaS with browser-based user interface that is accessible on any device that is connected to the Internet
Access easily through website
As can be seen from the Table 7, the most relevant management segment’s pains and
gain expectations can be met with the service. The ones that are not met are related
mostly to deadline, budget and technical risks which the service can not explicitly help in
because those risks are affected by so many different factors. The output of this table
matches with the strengths found in the current state analysis about meeting manage-
ment segment’s pains with the service.
5.3 Conclusions and Recommendations
In the current state analysis, it was found that assuring the users about the benefits of
the service has been a problem. As can be seen from the tables in the previous section,
the most of the different user segments’ pains and gain expectations found can actually
be met with the case company’s service, so the biggest problems may lie in assuring the
customers. Because of this, the canvases and tables are recommended to be used for
supporting sales in communicating the service’s value proposition to different segments.
It was found out in the current state analysis that sales do not have any proper docu-
mentation for this purpose. The tables in the proposal give clearly visualized points that
can be used as sales hooks to point out the value in the service for different segments.
It describes what gain creators and pain relievers should be emphasized when selling
the service to specific segments.

56
As an example, the case company could use the proposal as informational documents
for sales personnel. When they know the segment they have to sell to, they can use the
proposal to get an overview of what that specific segment’s work consists of, their pain
points and gain expectations for the service. They can see how the service they are
selling can deliver value for this segment’s customers and what sales hooks they can
use for attracting the customer. As the relevancies are listed, they can see what are the
most important pain relievers and gain creators that this service can offer to this specific
segment are. The most relevant pain relievers and gain creators in the tables can be
used as the most compelling sales hooks when approaching this segment.
Many of the problems found in the current state analysis concerned designer segment.
To alleviate these problems, the segment was split into two different personas in order
to map the needs and pains of this non-homogeneous segment in a better and wider
way. Value Proposition Canvases and the tables can be utilized to identify the type of
the designer faster and to see what sales hooks should be used for each type to get
better sales conversion rates.
Tables can also be used to get ideas on what to possibly develop and add next to the
service. For example, the unmet expectations of getting the same data from other geo-
graphical markets and about adding more visual theme data seem fitting additions to the
service to meet the customer needs even better.
It is worth noting that the role of analytics is becoming more important as this relatively
new industry is maturing as it came out in the current state analysis and the conceptual
framework. Application market is also nowadays very oversaturated; therefore, the com-
petition is now tougher than ever, which increases the importance of analytics for finding
a competitive advantage. This trend is an opportunity for the case company’s service as
game developers lean on the help of analytics increasingly more.

57
6 Discussion and Conclusions
6.1 Summary
This thesis’ objectives were divided in three parts. The first objective of the thesis was to
identify the needs of the different user segments inside the game developer companies;
designers, analysts and management. The second objective was to find out the compat-
ibility between the service and the different user segments’ needs. The third objective
was to visualize the different user segments’ needs, relevance of each need and the
compatibility between the case company’s service and customer needs. The purpose of
this analysis and visualization was to alleviate the business challenge of the case com-
pany, which is that the needs of the user segments are not identified well enough leading
to mediocre value propositions that could be improved. Further identification of the needs
would help in the sales process when approaching the potential customers, improving
the service’s value proposition to fit the customers’ needs better and to give tools to offer
even better targeted services for the different user segments.
In the current state analysis, the current level of customer segmentation, the identification
of the different user segments, how the value propositions are communicated to different
segments and the state of the sales process were studied. The information for the anal-
ysis came from the interviews with the case company’s managers and from the case
company’s documentation. The main insights that came out in the CSA were that the
designer user segment was clearly the most problematic segment concerning the sales
and that the main issue regarding value propositions may not be that the service would
not provide value, but that there are issues in assuring the user segments of the existing
value in the service. The strengths and weaknesses of the current state of the segmen-
tation are summarized in the Table 2 in chapter 3.4.
For the conceptual framework, the focus was on segmentation, targeting, positioning
(STP) and value proposition theories because they support the objectives of this thesis.
In addition, supporting theories were researched because they are needed to understand
the context of this specific case. These include personas, SaaS theory, mobile game
industry and the role of analytics and the game designer segment.

58
After the data from the current state analysis and conceptual framework were gathered,
interviews with the service’s user segments and case company’s managers were con-
ducted to get the required data for forming the proposal. The goal of these interviews
was to gather data for identifying different pains and gain expectations of each user seg-
ment.
Value proposition canvases were created based on comparison of data from current
state analysis, conceptual framework and the interviews. Canvases were created for
each user segment and additionally the designer segment was split into two personas to
illustrate the differences inside that user segment.
Value proposition canvases were validated and finalized in a workshop with the case
company’s managers, where also the fit between the customer’s pain and gain expecta-
tions with the case company’s service’s pain relievers and gain creators were discussed,
linked and ranked based on their relevancies. Based on the results of the workshop, a
proposal was formed which consists of the following:
- Value Proposition Canvases for two personas identified inside the designer seg-
ment (lead designer, game designer) and for the other segments (analyst and
management).
- Tables illustrating different user segments’ pains and gain expectations, their rel-
evancies and the fit between pains and gain expectations and the service’s value
map’s pain relievers and gain creators.
The proposal confirmed the insight that came out in the current state analysis that the
main issue regarding value propositions is not that the service would not provide value,
as most of the relevant pains and gain expectations were met with the service, so the
issue is assuring the customers about the existing value. This proposal can be used for
supporting sales and in communicating the service’s value proposition, which can allevi-
ate the weakness of assuring the customers about the existing value.
Below is a table reviewing the weaknesses of the CSA that can be alleviated with the
proposal:
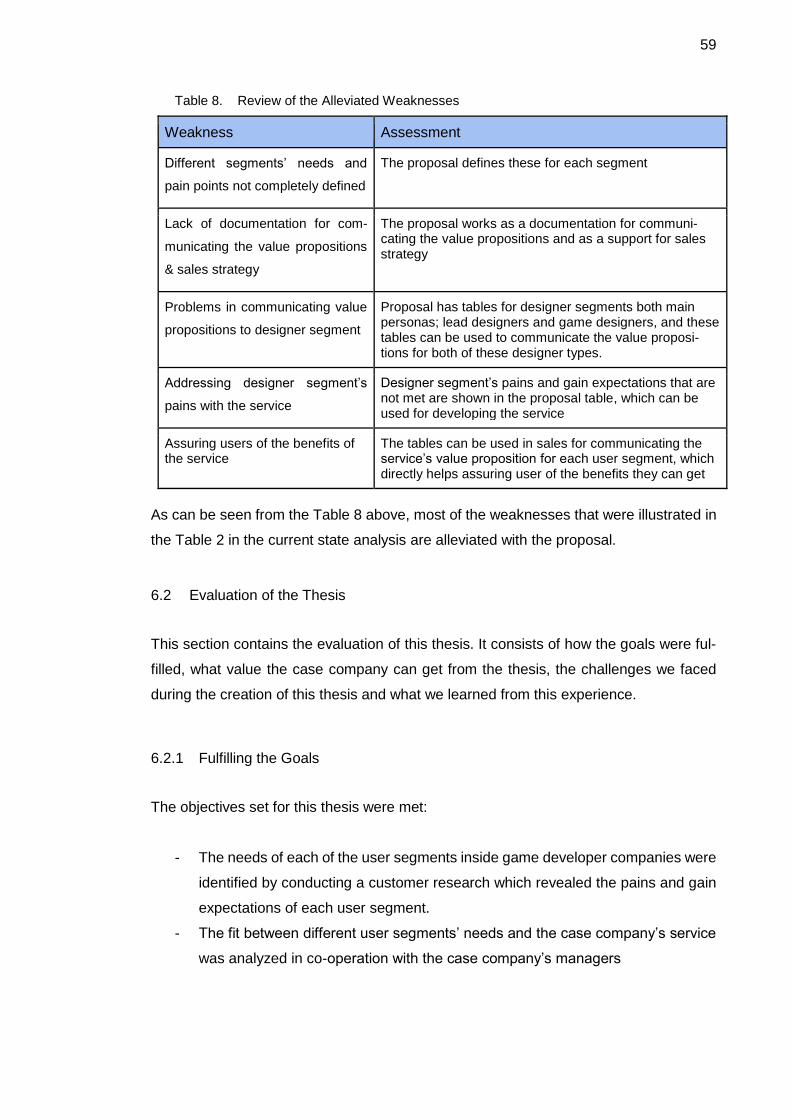
59
Table 8. Review of the Alleviated Weaknesses
Weakness Assessment
Different segments’ needs and
pain points not completely defined
The proposal defines these for each segment
Lack of documentation for com-
municating the value propositions
& sales strategy
The proposal works as a documentation for communi-cating the value propositions and as a support for sales strategy
Problems in communicating value
propositions to designer segment
Proposal has tables for designer segments both main personas; lead designers and game designers, and these tables can be used to communicate the value proposi-tions for both of these designer types.
Addressing designer segment’s
pains with the service
Designer segment’s pains and gain expectations that are not met are shown in the proposal table, which can be used for developing the service
Assuring users of the benefits of the service
The tables can be used in sales for communicating the service’s value proposition for each user segment, which directly helps assuring user of the benefits they can get
As can be seen from the Table 8 above, most of the weaknesses that were illustrated in
the Table 2 in the current state analysis are alleviated with the proposal.
6.2 Evaluation of the Thesis
This section contains the evaluation of this thesis. It consists of how the goals were ful-
filled, what value the case company can get from the thesis, the challenges we faced
during the creation of this thesis and what we learned from this experience.
6.2.1 Fulfilling the Goals
The objectives set for this thesis were met:
- The needs of each of the user segments inside game developer companies were
identified by conducting a customer research which revealed the pains and gain
expectations of each user segment.
- The fit between different user segments’ needs and the case company’s service
was analyzed in co-operation with the case company’s managers

60
- Visualization covering the different user segment’s needs, their relevance and
how the case company’s service fits to them was provided in a form of Value
Proposition Canvases and tables.
Crucial factor that helped meeting these objectives was the support and co-operation
with the case company, which resulted in a proposal fitting for their needs.
6.2.2 Value for the Case Company
The case company received the expected output of a Value Proposition Canvas and
table for each user segment. These outputs visualize the different user segment’s pains
and gain expectations, how the case company’s service meets them through their pain
relievers and gain creators and which of them are the most important to tackle based on
their relevance.
Gained value from the outputs is described below:
- Comprehensive view about the state of current value proposition
- Support for developing the service and positioning it for different segments by
knowing which of the customer pains and gain expectations are met and which
are not
- Support for developing sales strategies and general knowledge for sales person-
nel to use when communicating the value propositions to the customers
- View on what customers really want will strengthen so that the case company
can focus on developing the service exactly for these needs
- The support and knowledge helps in approaching customers, which can increase
the sales and lead to better conversion rate for sales meetings
6.3 Challenges
Defining the outcome of the thesis at start was quite challenging as the case company
had not clearly defined it. The concrete outcome had to be figured out as the study pro-
gressed, and a decision was needed on what the best way would be to present the so-
lution for the objectives. The outcome evolved throughout the process and in the CSA it
was decided that it would be a visualization that can be used to see the user different
segments and their needs.

61
Coming up with good questions for the customer segment interview proved to be a chal-
lenge as the goal of the interviews was to get data for possible customer pains and gain
expectations. These can be hard to map since the root causes for them are not easy to
find in short interviews.
The data that was gained from the customer segment interviews could have been more
diverse as many of the answers gained from the interviews were quite similar to each
other. Also, many of the interviewees were busy in their own work, so the number of
questions and the time used for interviews had to be relatively limited. With a larger
scope of interviews and more diverse answers, the identified customer pains and gain
expectations could have been even wider. Due to limited resources and time, the larger
scope of interviews was not possible. The conducted workshop with the case company’s
managers helped in this challenge to get the best possible results, since they have a lot
of previous experience and information from working with these user segments.
6.4 Learnings
Working in game analytics environment was a great experience since we are interested
in game industry and the analytics revolving around optimizing and developing games is
a fascinating subject. This gave us a possibility to see how the game development pro-
cesses actually go and how the analytics can be utilized in that in a real business context.
The context of the thesis being about customer segmentation and sales was also a great
opportunity to get practical experience about segmentation and value propositions,
which we had studied in school but had no real experience about. These learnings will
be beneficial for us in the future.
All in all, this was a positive experience for us as the value was delivered to the case
company, which is the most key factor in customer projects.

62
References
App Annie. (2017). [WWW document] About. https://www.appannie.com/en/tours/mar-
ket-data-intelligence/ (Accessed Feb 3, 2017).
App Annie. (2017). [WWW document] App Annie Intelligence helps Glu stay ahead of
the competition. https://www.appannie.com/about/glu/ (Accessed Feb 3, 2017)
Apprenda. (2017). [WWW document] IaaS, PaaS, SaaS (Explained and Compared).
https://apprenda.com/library/paas/iaas-paas-saas-explained-compared/ (Accessed Jan
25, 2017).
Armstrong, G & Kotler, P. (2005). Marketing: An Introduction Upper Saddle River.
Barnes, C., Blake, H. & Pinder, D. 2012. Creating & Delivering Your Value Proposition.
Chulis, Kimberly. (17th July 2012). [WWW document] Big data analytics for video, mo-
bile, and social game monetization. IBM. http://www.ibm.com/developerworks/li-
brary/ba-big-data-gaming/ (Accessed Jan 28, 2017).
Cooper, A. & Reimann, R. (2003). About face - goal directed design. 76-78, 97-104.
Creative Skillset. (2017). Game Designer. [WWW document] http://creativeskill-
set.org/job_roles/331_game_designer (Accessed Jan 22, 2017).
Croll, A & Yoskovitz, B. (2013). Lean Analytics: Use Data to Build a Better Startup Faster.
Dibb, S & Simkin, L. (1996). The market segmentation workbook: Target marketing for
marketing managers.
DeYoung, Joel. (17th November 2016). [WWW document] Creating a culture of analyt-
ics is key to your game’s success. Games Industry. http://www.gamesindustry.biz/arti-
cles/2016-11-07-creating-a-culture-of-analytics-is-key-to-your-games-success (Ac-
cessed Nov 28, 2017).
Gilligan, C & Wilson, R. (2009). Strategic Marketing Planning. 339-377.

63
Gunter, B & Adrian F. (1992). Consumer profiles: An introduction to psychographics.
Grönroos, C. & Helle, P. (October 2010). [WWW document] Adopting a Service Logic
in Manufacturing: Conceptual Foundation and Metrics for Mutual Value Creation. Re-
search Gate. https://www.researchgate.net/publication/215915810_Adopting_a_Ser-
vice_Logic_in_Manufacturing_Conceptual_Foundation_and_Metrics_for_Mu-
tual_Value_Creation (Accessed Jan 18, 2017).
Hague, P & Harrison, M. (2017). [WWW document] Market Segmentation in B2B Mar-
kets. B2B International. https://www.b2binternational.com/publications/b2b-segmenta-
tion-research/ (Accessed Jan 17, 2017).
Hanlon, Annmarie. (Nov 8th, 2016). [WWW document] The Segmentation, Targeting
and Positioning model. Smart Insights. http://www.smartinsights.com/digital-market-
ing-strategy/customer-segmentation-targeting/segmentation-targeting-and-positioning
(Accessed Jan 15, 2017).
Herman, Daniel. (11th February 2017). [WWW document] Mobile games lose their lus-
ter faster than ever. Venture Beat. http://venturebeat.com/2017/02/11/mobile-games-
lose-their-luster-faster-than-ever/ (Accessed Feb 11, 2017).
I, Alex. (7th April 2011). [WWW document] History of mobile gaming. Phone Arena.
http://www.phonearena.com/news/History-of-mobile-gaming_id17949 (Accessed Jan
25, 2017).
Kavis, Michael. (2014). Architecting the Cloud.
Lecky-Thompson, Guy W. (2008). Video Game Design Revealed.
Loureiro, Tiago. (10th Aug 2016). [WWW document] Analytics in Game Development:
Data-Driven What?. Loggly. https://www.loggly.com/blog/data-driven-game-develop-
ment-analytics/ (Accessed Jan 26, 2017).

64
McCalmont, Trevor. (8th July 2015). [WWW document] 15 Metrics All Developers
Should Know By Heart. Game Analytics. http://www.gameanalytics.com/blog/metrics-
all-game-developers-should-know.html (Accessed Jan 27, 2017).
McDivitt, H. & Wilkinson, M. (2012). Value-based Pricing.
McDonald, M., Frow, P. & Payne, A. (2011). Marketing Plans for Services.
Mullins, J., Walker, O. & Boyd, H. (2008). Marketing Management. 11.
Osterwalder, A., Pigneur, Y., Bernarda, G. & Smith, A. (2014). Value Proposition Design.
Pickton, D & Broderick, A. (2005). Integrated marketing communications. 371- 398.
Ries, A & Trout J. (2001). Positioning: The Battle For Your Mind.
Skok Michael. (13th July 2013). [WWW document] 4 Steps To Building A Compelling
Value Proposition. Forbes. http://www.forbes.com/sites/michaelskok/2013/06/14/4-
steps-to-building-a-compelling-value-proposition/#4c1368d91f2c (Accessed Jan 13,
2017).
Sokanu. (2017). What does a Video Game Designer do?. [WWW document]
https://www.sokanu.com/careers/video-game-designer/ (Accessed Jan 22, 2017).
Techopedia. (2017). [WWW document] Free To Play (F2P). https://www.techope-
dia.com/definition/27039/free-to-play-f2p (Accessed Jan 26, 2017).
Wright, Chris. (14th March 2016). [WWW document] A Brief History of Mobile Games: In
the beginning, there was Snake. Pocket Gamer. http://www.pocketgamer.biz/fea-
ture/10619/a-brief-history-of-mobile-games-in-the-beginning-there-was-snake/ (Ac-
cessed Jan 25, 2017).

Appendix 1
1 (1)
Appendix 1: CSA Interview Questions and Answers
This data has been removed for confidentiality reasons.

Appendix 2
1 (1)
Appendix 2: Summary of Customer Company and Case Company Manager
Interviews
This data has been removed for confidentiality reasons.