Embed Size (px)
Citation preview

Driving the Bottom Line with Performance Analytics

• Founded in 2003, Bottom-Line Analytics is a global analytics company with offices in the US, Europe and affiliates in India and Egypt. Collectively, our core team has more than 100 years of direct experience across a broad “portfolio” of analytics. We help clients expand their capabilities to realize high-return analytics efforts. Included in our portfolio:
– Media and Marketing ROI modeling: Econometric modeling to measure marketing ROI and optimize marketing investments
– Social Media ROI Measurement and Insights: We apply a unique and powerful social media metric calls the Semantic Engagement Index with proven 80 percent plus correlations to brand sales
– Pricing Analytics and Optimization: We are leading experts in doing price sensitivity modeling and helping clients make more effective pricing decisions
– Radial Perceptual Maps: Used to understand brand image and positioning, we can provide you with an accurate depiction of what differentiates yours and competitive brands in the market place
– Key Drivers Analysis: We can connect causal links from survey and tracking data to key behavior and KPI metrics
Destination: Analytics Portfolio

– CART Analysis: We employ advanced regression-tree tools to help clients score CRM data sets, maximize upsell/cross sell and reduce customer churn
– Perceptual Drivers using Structural Equation Modeling or SEM: This is a structured and advanced approach for capturing and measuring the impact of survey-based image and perceptual metrics on KPIs and behavior.
– Demand Forecasting: We can develop custom forecast and predictive models or help you set up a world-class forecasting capability
– Customer or Market-Segmentation: We can determine the key differentiators across your market and customer base in order to enable more effective targeting of marketing efforts
– Digital Dashboards: We design and construct online dashboards for reporting Key Performance Indicators (KPIs) and other key drivers of demand and brand health metrics across your brands.
Destination: Analytics Portfolio

Media Effectiveness (Econometrics)
Identify and quantify the key marketing drivers Calculate return on investment (ROI) for each marketing channel (including social media*) Optimise marketing spend to maximise sales.
* Pushing the boundaries with social media ROI via linguistic theory.
Contribution to Sales

Innovations in Marketing ROI Models
Marketing Synergies
Long Term Ad Effects
Message Mix
Social Media ROI
Determine the ROI of integrated multi-channel campaigns.
Rev
enu
e (£
)
Synergy
By applying copy test scores we can identify returns by message and creativity.
Incremental returns from Social Media (see next slide)
Long Term Effect
We can calculate the impact of media and marketing in the long term
Social Media ROI
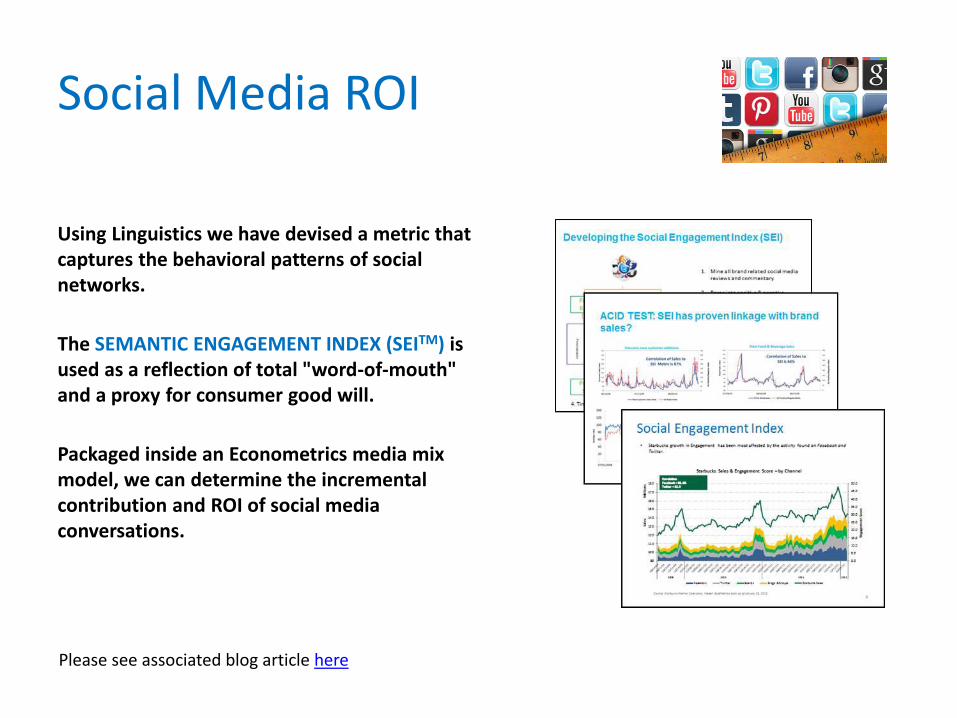
Using Linguistics we have devised a metric that captures the behavioral patterns of social networks.
The SEMANTIC ENGAGEMENT INDEX (SEITM) is used as a reflection of total "word-of-mouth" and a proxy for consumer good will.
Packaged inside an Econometrics media mix model, we can determine the incremental contribution and ROI of social media conversations.
Please see associated blog article here

Pricing Optimisation
Price is by far the key lever that could make or
break sales for any brand.
Getting product pricing right is a crucial step in
increasing brand growth and volume share.
At Bottom Line Analytics, we have developed a
method of optimising prices at the SKU level. We
also take into account competitive prices. This
gives pricing managers the confidence in making
the right strategic pricing decisions to increase
profitability.
Brand Profit & Demand Price Elasticity

Radial Perceptual Mapping (brand mapping)
Purpose
To visualise a measured battery of image attributes against a number of known competing brands.
Methodology
Adapted Statistical Correspondence Analysis.
Benefits
• To understand the relative position of brands
in a competitive space.
• To understand which brand image factors are
helping to differentiate your brand.
• Ultimately, the Radial Landscape Maps helps
in aligning marketing messages and content
to the image perceptions held by target
customer segments.
*Can also be applied to social media chatter

Gender
Staff Product
Knowledge
I love the brand
It’s a brand for
me
Authentic brand
Refreshing
Affordable
Query was dealt with
Courteous &
Respectful
Easy to get in touch
with
Age: 18-24
Degree holders
Key Performance
Indicators
Likelihood to become frequent
user
Good value
Social Media User
Likelihood to renew
subscription
Profile
Recent Experience
Brand Perception and Image statements
Purpose Using Logistic/Probit regression we can identify and quantify the factors driving key performance indicators (KPIs) or any other survey based behavioural outcome.
Likelihood to become a
donor
Likelihood to purchase
Overall Customer
Satisfaction
Likelihood to
recommend
Key Drivers Analysis
Benefits We can create a powerful what-if simulator which will allow you to play out different scenarios and build business cases.

Using CART to identify key drivers
Purpose
To identify and visualise which drivers are most likely to increase a given KPI of interest.
Methodology
Classification and Regression Trees (CART)
Benefits
• To understand the rank and strength of key
drivers.
• To devise strategy that will conform to the
key factors and by extension drive
performance.

Modelling perceptual metrics
Purpose
To identify and visualise the drivers and interlinking relationships that sit behind brand perceptual metrics of interest.
Methodology
Multivariate Structural Equation Modelling (SEM)
Benefits
• Understand the relative strength of key
drivers to brand perceptions.
• Formulate strategy that works to trigger the
latent drivers of brand perception and by
extension performance.

Demand forecasting with uncertainty
Forecast market size with best and
worst case scenarios.
Take into account recessionary
and wider market uncertainty.
Performance through segmentation
Identify specific attributes of key customer groups. ^ Target your marketing and communications messages to ensure they resonate with key groups in order to maximise response.
^ Segmentation analysis can be conducted as a preliminary analysis , stand alone or to support key deliverables within other areas.

Digital Performance Dashboards
Visualise all your key data sources in a single platform.
Accessibility and dissemination is made easy through online delivery.
Drive tactical refinements in marketing campaigns.

Michael Wolfe CEO, Bottom Line Analytics E: [email protected] M: 770.485.0270 www.bottomlineanalytics.com
Masood Akhtar Partner, Analytics (EMEA) E: [email protected] M: +44 7970 789 663 www.bottomlineanalytics.com
David Weinberger CMO Bottom-Line Analytics E: [email protected] M: 770.649.0472 www.bottomlineanalytics.com
Simon Brock VP Business Development E: [email protected] M: +44 (0) 7824 305325 www.bottomlineanalytics.com
London & EMEA USA


![BLa BLA · BLa Bla BLA bla bla Bla Bla — Je m’appelle... BLa BLA bla bla Bla 192 pages-:HSMHKA=ZUX\U]: Prix : 9,00 € Je cherche... BLa Bla BLA bla bla Bla ! Un guide de conversation](https://img.dokumen.tips/doc/110x75/5f0257507e708231d403caa4/bla-bla-bla-bla-bla-bla-bla-bla-bla-a-je-maappelle-bla-bla-bla-bla-bla-192.jpg)