Embed Size (px)
Citation preview

2016-17
BUDGET AT A GLANCE
USD 204 - Bonner Springs
School FinanceKansas State Department of EducationLandon State Office Building900 SW Jackson Street, Suite 356Topeka, Kansas 66612-1212
www.ksde.org
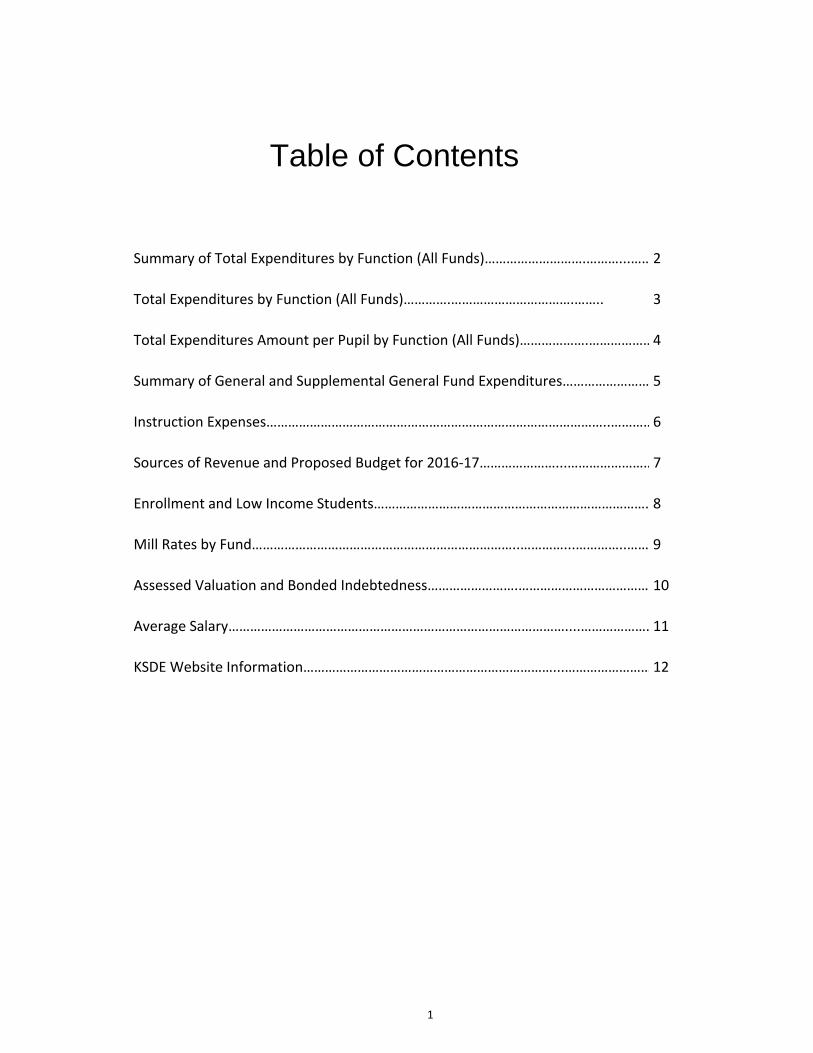
Table of Contents
Summary of Total Expenditures by Function (All Funds)……………………….………...……………………….……………………..2
Total Expenditures by Function (All Funds)………….…………………………….…….. 3
Total Expenditures Amount per Pupil by Function (All Funds)……………….………………………….…………………..4
Summary of General and Supplemental General Fund Expenditures…………………………………5
Instruction Expenses…………………………………………………………………………………..………………………..6
Sources of Revenue and Proposed Budget for 2016-17…………………...………………………..………..7
Enrollment and Low Income Students…………………………………………………………………...……………..8
Mill Rates by Fund………………………………………………………………..…………...…………..………………………9
Assessed Valuation and Bonded Indebtedness…………………….……………………………………………..10
Average Salary…………………………………………………………………………………....………………………………….11
KSDE Website Information……………………………………………………………...…………………………………….12
1
USD# 204
Summary of Total Expenditures By Function (All Funds)
% % % % %
2014-2015 of 2015-2016 of inc/ 2016-2017 of inc/
Actual Tot Actual Tot dec Budget Tot dec
Instruction 18,441,861 58% 16,701,245 50% -9% 21,173,092 53% 27%
Student Support Services 1,028,733 3% 1,177,383 4% 14% 1,234,080 3% 5%
Instructional Support Services 977,287 3% 1,056,568 3% 8% 1,344,965 3% 27%
Administration & Support 2,981,008 9% 3,063,008 9% 3% 3,476,478 9% 13%
Operations & Maintenance 2,018,710 6% 1,953,785 6% -3% 2,212,395 5% 13%
Transportation 902,916 3% 1,174,818 4% 30% 1,516,698 4% 29%
Food Services 1,821,367 6% 1,614,435 5% -11% 1,850,889 5% 15%
Capital Improvements 619,742 2% 483,286 1% -22% 1,103,028 3% 128%
Debt Services 3,136,685 10% 5,855,442 18% 87% 6,331,269 16% 8%
Other Costs 24,483 0% 49,445 0% 102% 38,354 0% -22%
Total Expenditures* 31,952,792 100% 33,129,415 100% 4% 40,281,248 100% 22%
Amount per Pupil $12,649 $12,599 0% $15,021 19%
Current Expenditures** 25,899,706 100% 26,352,291 100% 2% 30,006,407 100% 14%
Amount per Pupil $10,253 $10,021 -2% $11,189 12%
Instruction*** (Total Expenditures) 16,376,288 51% 16,411,317 50% -1% 18,817,591 47% -3%
Instruction*** (Current Expenditures) 16,376,288 63% 16,411,317 62% -1% 18,817,591 63% 1%
Note: Percentages on charts are within +-1% due to rounding used. Pie graph percentages may differ from charts for this reason also.
Further definition of what goes into each category:
Instruction - 1000 Transportation - 2700
Student Support Services - 2100 Food Service - 3100
Instructional Support Services - 2200 Other Costs - 2900 and 3300
Administration & Support - 2300, 2400 and 2500 Capital Improvements - 4000
Operations & Maintenance - 2600 Debt Services - 5100
Transfers - 5200
Percent of Expenditures
* The funds that are included in the categories above are: General, Supplemental General, Bilingual Education, At Risk(4yr Old), At Risk(K-12), Virtual Education, Capital
Outlay, Driver Education, Extraordinary School Program, Summer School, Special Education, Vocational Education, Professional Development, Bond & Interest #1, Bond &
Interest #2, No-Fund Warrant, Special Assessment, Parent Education, School Retirement, Student Materials Revolving & Textbook Rental, Tuition Reimbursement,
Gifts/Grants, KPERS Special Retirement Contribution, Contingency, Special Liability Expense, Federal Funds, Adult Education, Adult Supplemental Education, Activity Fund
and Special Education Coop Fund.
*** Instruction excludes Capital Outlay and Bond Debt expenditures (Code 16, Code 62, Code 63)
** Current Spending excludes Capital Outlay and Bond Debt expenditures (Code 16, Code 62, Code 63)
0
5,000,000
10,000,000
15,000,000
20,000,000
25,000,000 21,173,092
1,234,080 1,344,9653,476,478
2,212,395 1,516,698 1,850,889 1,103,028
6,331,269
38,354
Summary of Total Expenditures by Function (All Funds)
2014-2015
2015-2016
2016-2017
2

USD# 204
2014-2015 2015-2016 2016-2017
Actual Actual Budget
Instruction 18,441,861 16,701,245 21,173,092
Student Support 1,028,733 1,177,383 1,234,080
Instructional Support 977,287 1,056,568 1,344,965
Administration & Support 2,981,008 3,063,008 3,476,478
Operations & Maintenance 2,018,710 1,953,785 2,212,395
Transportation 902,916 1,174,818 1,516,698
Food Services 1,821,367 1,614,435 1,850,889
Capital Improvements 619,742 483,286 1,103,028
Debt Services 3,136,685 5,855,442 6,331,269
Other Costs 24,483 49,445 38,354
Total Expenditures* 31,952,792 33,129,415 40,281,248
*The funds that are included in the categories above are: General, Supplemental General, Bilingual Education, At Risk(4yr
Old), At Risk(K-12), Virtual Education, Capital Outlay, Driver Education, Extraordinary School Program, Summer School,
Special Education, Vocational Education, Professional Development, Bond & Interest #1, Bond & Interest #2, No-Fund
Warrant, Special Assessment, Parent Education, School Retirement, Student Materials Revolving & Textbook Rental, Tuition
Reimbursement, Gifts/Grants, KPERS Special Retirement Contribution, Contingency, Special Liability Expense, Federal
Funds, Adult Education, Adult Supplemental Education, Activity Fund and Special Education Coop Fund.
Total Expenditures By Function (All Funds)
0
5,000,000
10,000,000
15,000,000
20,000,000
25,000,000
30,000,000
35,000,000
40,000,000
45,000,000
21,1
73,0
92
1,23
4,08
0
1,34
4,96
5
3,47
6,47
8
2,21
2,39
5
1,51
6,69
8
1,85
0,88
9
1,10
3,02
8
6,33
1,26
9
38,3
54
40,2
81,2
48Total Expenditures By Function (All Funds)
2014-2015
2015-2016
2016-2017
3

USD# 204
2014-2015 2015-2016 2016-2017
Actual Actual Budget
Instruction 7,301 6,351 7,895
Student Support 407 448 460
Instructional Support 387 402 502
Administration & Support 1,180 1,165 1,296
Operations & Maintenance 799 743 825
Transportation 357 447 566
Food Services 721 614 690
Capital Improvements 245 184 411
Debt Services 1,242 2,227 2,361
Other Costs 10 19 14
Total Expenditures Per Pupil** 12,649 12,599 15,021
Enrollment (FTE)* 2,526.1 2,629.6 2,681.7
**The funds that are included in the categories above are: General, Supplemental General, Bilingual Education, At Risk(4yr
Old), At Risk(K-12), Virtual Education, Capital Outlay, Driver Education, Extraordinary School Program, Summer School,
Special Education, Vocational Education, Professional Development, Bond & Interest #1, Bond & Interest #2, No-Fund
Warrant, Special Assessment, Parent Education, School Retirement, Student Materials Revolving & Textbook Rental, Tuition
Reimbursement, Gifts/Grants, KPERS Special Retirement Contribution, Contingency, Special Liability Expense, Federal
Funds, Adult Education, Adult Supplemental Education, Activity Fund and Special Education Coop Fund.
Total Expenditures Amount Per Pupil By Function (All Funds)
*Enrollment (FTE) includes the current year enrollment on September 20, February 20, 4 yr old at-risk, and
virtual. It does not include non-funded preschool or full-day kindergarten not on an IEP.
0
2,000
4,000
6,000
8,000
10,000
12,000
14,000
16,000
7,89
5
460
502 1,29
6
825
566
690
411
2,36
1
14
15,0
21
Amount Per Pupil By Function (All Funds)
2014-2015
2015-2016
2016-2017
4

5
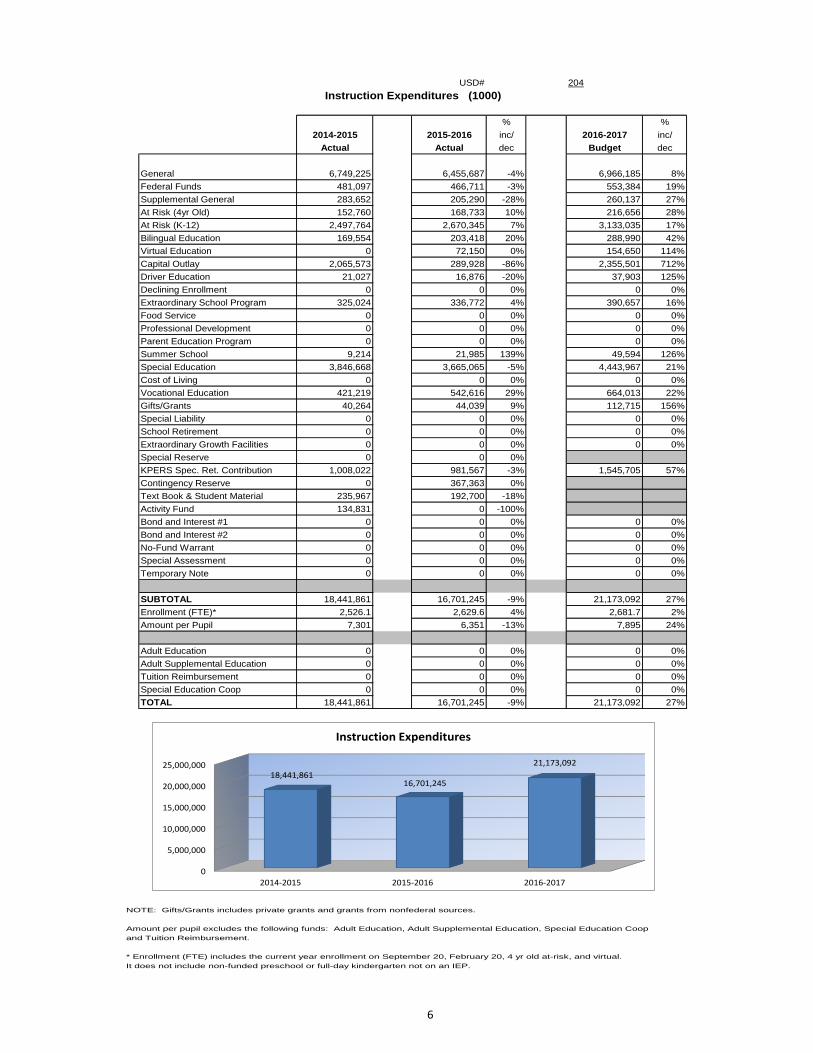
NOTE: Gifts/Grants includes private grants and grants from nonfederal sources.
Amount per pupil excludes the following funds: Adult Education, Adult Supplemental Education, Special Education Coop
and Tuition Reimbursement.
* Enrollment (FTE) includes the current year enrollment on September 20, February 20, 4 yr old at-risk, and virtual.
It does not include non-funded preschool or full-day kindergarten not on an IEP.
USD# 204
Instruction Expenditures (1000)
% %
2014-2015 2015-2016 inc/ 2016-2017 inc/
Actual Actual dec Budget dec
General 6,749,225 6,455,687 -4% 6,966,185 8%
Federal Funds 481,097 466,711 -3% 553,384 19%
Supplemental General 283,652 205,290 -28% 260,137 27%
At Risk (4yr Old) 152,760 168,733 10% 216,656 28%
At Risk (K-12) 2,497,764 2,670,345 7% 3,133,035 17%
Bilingual Education 169,554 203,418 20% 288,990 42%
Virtual Education 0 72,150 0% 154,650 114%
Capital Outlay 2,065,573 289,928 -86% 2,355,501 712%
Driver Education 21,027 16,876 -20% 37,903 125%
Declining Enrollment 0 0 0% 0 0%
Extraordinary School Program 325,024 336,772 4% 390,657 16%
Food Service 0 0 0% 0 0%
Professional Development 0 0 0% 0 0%
Parent Education Program 0 0 0% 0 0%
Summer School 9,214 21,985 139% 49,594 126%
Special Education 3,846,668 3,665,065 -5% 4,443,967 21%
Cost of Living 0 0 0% 0 0%
Vocational Education 421,219 542,616 29% 664,013 22%
Gifts/Grants 40,264 44,039 9% 112,715 156%
Special Liability 0 0 0% 0 0%
School Retirement 0 0 0% 0 0%
Extraordinary Growth Facilities 0 0 0% 0 0%
Special Reserve 0 0 0%
KPERS Spec. Ret. Contribution 1,008,022 981,567 -3% 1,545,705 57%
Contingency Reserve 0 367,363 0%
Text Book & Student Material 235,967 192,700 -18%
Activity Fund 134,831 0 -100%
Bond and Interest #1 0 0 0% 0 0%
Bond and Interest #2 0 0 0% 0 0%
No-Fund Warrant 0 0 0% 0 0%
Special Assessment 0 0 0% 0 0%
Temporary Note 0 0 0% 0 0%
SUBTOTAL 18,441,861 16,701,245 -9% 21,173,092 27%
Enrollment (FTE)* 2,526.1 2,629.6 4% 2,681.7 2%
Amount per Pupil 7,301 6,351 -13% 7,895 24%
Adult Education 0 0 0% 0 0%
Adult Supplemental Education 0 0 0% 0 0%
Tuition Reimbursement 0 0 0% 0 0%
Special Education Coop 0 0 0% 0 0%
TOTAL 18,441,861 16,701,245 -9% 21,173,092 27%
0
5,000,000
10,000,000
15,000,000
20,000,000
25,000,000
2014-2015 2015-2016 2016-2017
18,441,86116,701,245
21,173,092
Instruction Expenditures
6

USD 204
2016-17 Estimated Sources of Revenue--2016-17 Estimated
Amount July 1, 2016 State Federal Local July 1, 2017
Fund Budgeted Cash Balance Interest Transfers Other Cash Balance
General 19,089,013 1,891 19,087,122 0 0 0 0 0
Supplemental General 5,426,138 120,936 2,510,131 0 2,795,071 XXXXXXXX
Adult Education 0 0 0 0 xxxxxxxxxxxx 0 0 0
At Risk (4yr Old) 267,013 68,792 0 xxxxxxxxxxxx 198,221 0 0
Adult Supplemental Education 0 0 xxxxxxxxxxxx 0 0 0
At Risk (K-12) 3,133,799 935,005 0 xxxxxxxxxxxx 2,455,482 0 256,688
Bilingual Education 288,990 68,444 0 xxxxxxxxxxxx 190,546 30,000 0
Virtual Education 154,650 36,700 0 110,250 7,700 0
Capital Outlay 3,943,572 3,483,125 0 0 0 1,477,148 1,496,689
Driver Training 41,081 47,465 6,750 0 xxxxxxxxxxxx 0 16,815 29,949
Declining Enrollment 0 0 0 0 XXXXXXXX
Extraordinary School Program 390,657 107,612 0 xxxxxxxxxxxx 0 308,132 25,087
Food Service 1,703,992 200,970 14,000 1,134,925 158 48,144 406,564 100,769
Professional Development 79,458 53,184 0 xxxxxxxxxxxx 44,289 0 18,015
Parent Education Program 62,101 35,789 10,336 0 xxxxxxxxxxxx 30,547 0 14,571
Summer School 49,594 78,015 0 xxxxxxxxxxxx 0 0 28,421
Special Education 4,850,851 1,934,715 0 99,865 xxxxxxxxxxxx 3,775,671 13,373 972,773
Vocational Education 677,896 250,315 7,780 60,248 xxxxxxxxxxxx 404,756 0 45,203
Special Liability Expense Fund 0 0 0 0 0 0
Special Reserve Fund 68,932 XXXXXXXX
Gifts and Grants 112,715 17,650 102,543 7,478
Textbook & Student Materials Revolving 110,371 XXXXXXXX
School Retirement 0 0 xxxxxxxxxxxx 0 0
Extraordinary Growth Facilities 0 0 0 0 XXXXXXXXX
KPERS Special Retirement Contribution 2,262,335 0 2,262,335 XXXXXXXXX
Contingency Reserve 734,957 XXXXXXXXX
Activity Funds 63,732 XXXXXXXXX
Tuition Reimbursement 0 0 0 0 0
Bond and Interest #1 6,331,269 6,083,157 2,152,631 0 0 3,502,674 5,407,193
Bond and Interest #2 0 0 0 0 0 0 0
No Fund Warrant 0 0 0 0
Special Assessment 0 0 0 0
Temporary Note 0 0 xxxxxxxxxxxx 0 0
Coop Special Education 0 0 0 0 0 0 0
Federal Funds 936,365 28,535 xxxxxxxxxxx 930,247 xxxxxxxxxxxx xxxxxxxxxxxx xxxxxxxxxxx 22,417
Cost of Living 0 0 xxxxxxxxxxx xxxxxxxxxxx xxxxxxxxxxxx 0 0 XXXXXXXXX
SUBTOTAL 49,801,489 14,530,292 23,788,750 2,225,285 158 9,520,241 8,660,020 8,425,253
Less Transfers 9,520,241
TOTAL Budget Expenditures $40,281,248
2014-2015 2015-2016 2016-2017
State Revenues 20,749,116 22,229,694 23,788,750
Federal Revenues 1,916,797 2,081,944 2,225,285
Local Revenues* 8,998,975 8,958,159 8,660,178
Total Revenues 31,664,888 33,269,797 34,674,213
Revenues Per Pupil 12,535 12,652 12,930
*Excludes "Transfers" to avoid duplication of revenue.
Sources of Revenue and Proposed Budget for 2016-17
Sources of Revenue - - State, Federal, Local
Effective July 1, 2014 (2014-15 school year) KSA 72-6431 states proceeds from the
Ad Valorem taxes levied for the General Fund shall be remitted to the
State Treasurer. Such remittance shall be redistributed as state general aid.
7
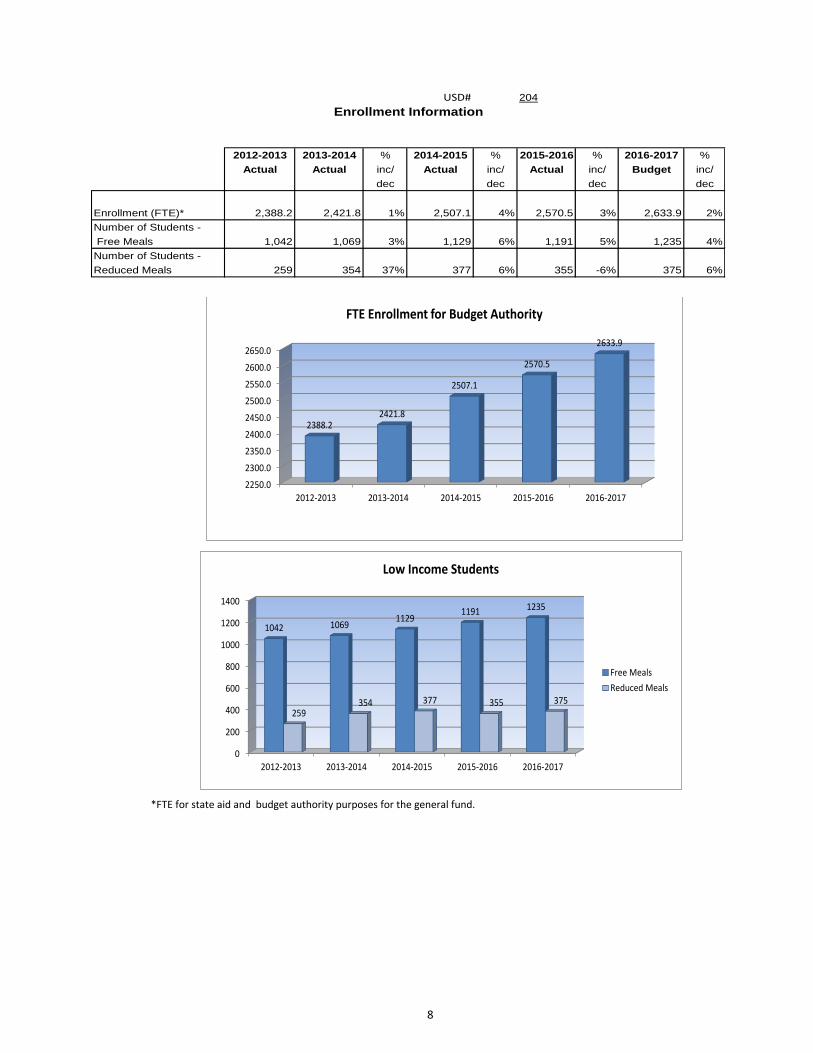
*FTE for state aid and budget authority purposes for the general fund.
2250.0
2300.0
2350.0
2400.0
2450.0
2500.0
2550.0
2600.0
2650.0
2012-2013 2013-2014 2014-2015 2015-2016 2016-2017
2388.22421.8
2507.1
2570.5
2633.9
FTE Enrollment for Budget Authority
0
200
400
600
800
1000
1200
1400
2012-2013 2013-2014 2014-2015 2015-2016 2016-2017
1042 10691129
1191 1235
259354 377 355 375
Low Income Students
Free Meals
Reduced Meals
USD# 204
2012-2013 2013-2014 % 2014-2015 % 2015-2016 % 2016-2017 %
Actual Actual inc/ Actual inc/ Actual inc/ Budget inc/
dec dec dec dec
Enrollment (FTE)* 2,388.2 2,421.8 1% 2,507.1 4% 2,570.5 3% 2,633.9 2%
Number of Students -
Free Meals 1,042 1,069 3% 1,129 6% 1,191 5% 1,235 4%
Number of Students -
Reduced Meals 259 354 37% 377 6% 355 -6% 375 6%
Enrollment Information
8

USD# 204
Miscellaneous Information
Mill Rates by Fund
2014-2015 2015-2016 2016-2017
Actual Actual Budget
General 20.000 20.000 20.000
Supplemental General 12.908 17.042 15.932
Adult Education 0.000 0.000 0.000
Capital Outlay 7.995 7.957 8.000
Declining Enrollment 0.000 0.000 0.000
Cost of Living 0.000 0.000 0.000
Special Liability 0.000 0.000 0.000
School Retirement 0.000 0.000 0.000
Extraordinary Growth Facilities 0.000 0.000 0.000
Bond and Interest #1 22.105 17.776 18.723
Bond and Interest #2 0.000 0.000 0.000
No Fund Warrant 0.000 0.000 0.000
Special Assessment 0.000 0.000 0.000
Temporary Note 0.000 0.000 0.000
TOTAL USD 63.008 62.775 62.655
Historical Museum 0.000 0.000 0.000
Public Library Board 0.000 0.000 0.000
Public Library Board & Employee Bnfts 0.000 0.000 0.000
Recreation Commission 0.000 0.000 0.000
Rec Comm Employee Bnfts 0.000 0.000 0.000
TOTAL OTHER 0.000 0.000 0.000
0.000
10.000
20.000
30.000
40.000
50.000
60.000
70.000
80.000
2014-2015 2015-2016 2016-2017
63.008 62.775 62.655
Total USD Mill Rates
9
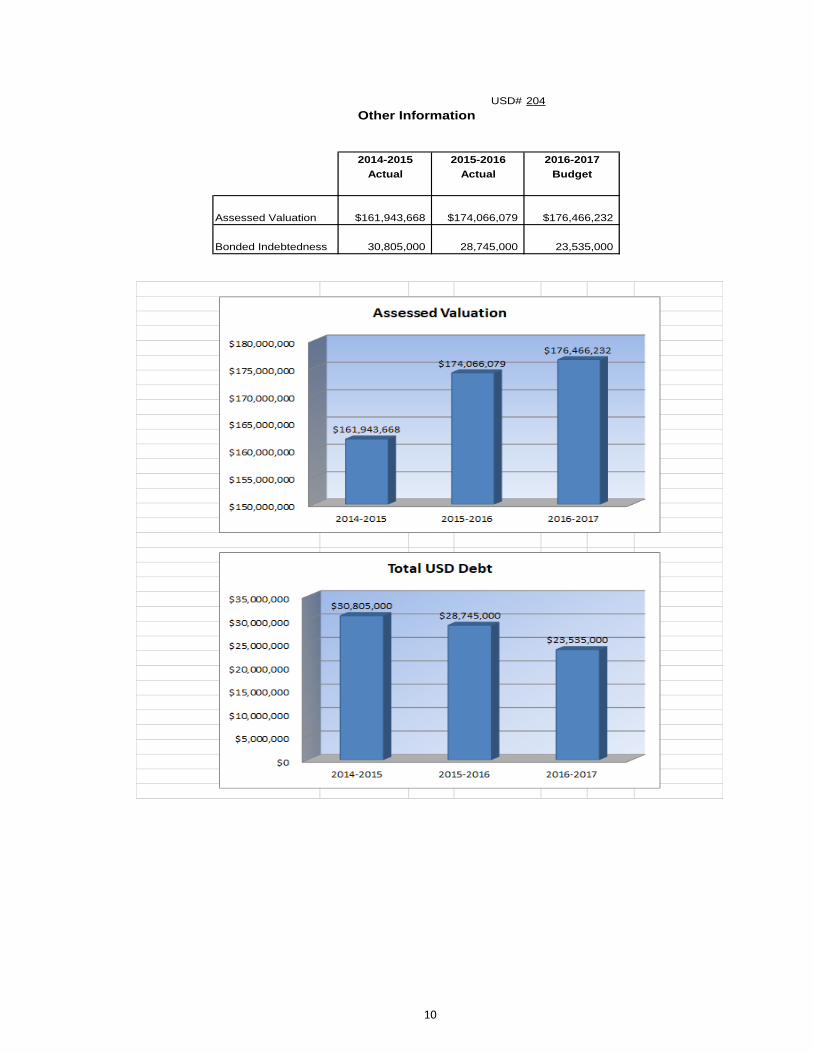
USD# 204
Other Information
2014-2015 2015-2016 2016-2017
Actual Actual Budget
Assessed Valuation $161,943,668 $174,066,079 $176,466,232
Bonded Indebtedness 30,805,000 28,745,000 23,535,000
10

USD# 204
FTE Total Salary Average Salary FTE Total Salary Average Salary FTE Total Salary Average Salary
Administrators (Certified/Non-Certified) 20.0 1,659,950 82,998 20.0 1,771,139 88,557 20.0 1,801,988 90,099
Teachers (Full Time) 190.0 9,701,735 51,062 198.0 10,654,266 53,809 200.0 11,073,894 55,369
Other Certified (Licensed) Personnel 5.0 263,385 52,677 5.0 272,045 54,409 5.0 279,366 55,873
Classified Personnel 100.0 3,179,165 31,792 110.0 3,594,540 32,678 115.0 3,862,376 33,586
Substitutes/Temporary Help XXXXX 447,330 XXXXXXXXX XXXXX 469,697 XXXXXXXXX XXXXX 493,182 XXXXXXXXX
DEFINITIONS
Administrators: *Certified (Licensed) - Superintendent; Assistant Superintendent; Administrative Assistants; Principals/ Assistant Principals;
Directors/Supervisors Special Education; Directors/Supervisors of Health; Directors/Supervisors of VocEd;
Instructional Coordinators/Supervisors; All Other Directors/Supervisors.
** Non-Certified - Assistant Superintendents; Business Managers; Business Services (Directors/Coordinators/Supervisors);
Food Service (Directors/Coordinators/Supervisors); Transportation (Directors/Coordinators/Supervisors); Custodial
Maintenance (Directors/Coordinators/Supervisors); Other (Directors/Coordinators/Supervisors).
Teachers (Full Time Only): *Practical Arts/Vocational Teachers; Special Education Teachers; Prekindergarten Teachers; Kindergarten Teachers;
Reading Specialists/Teachers; All Other Teachers.
Other Certified (Licensed) Personnel: Part-Time Teachers; Library Media Specialists; School Counselors; Clinical or School Psychologists; Speech Pathologists;
Audiologists; Nurses (RN); Social Workers.
Classified Personnel: **Attendance Services Staff; Library Media Aides; Security Officers; Regular Education Teacher Aides; Secretarial/Clerical;
Special Education Paraprofessionals; Nurses (LPN); Food Service Workers; Custodians; Bus Drivers.
Substitutes/Temporary: **Substitute Teachers, Coaching Assistants and other short term temporary help.
Total Salary: Report total salary including employee reduction plans***, supplemental and extra pay for summer school, and board
paid fringe benefits (employer paid)****.
*FTE for Certified Administrators, Teachers and Other Certified (Licensed) Personnel is defined by the local school board. Generally FTE for teachers with a 9-10 month
contract should be reported as 1.0; FTE for Principals with a 10-12 month contract should be reported as 1.0; FTE for Superintendents with a 12 month contract should be
reported as 1.0.
**FTE of 1.0 for Non-Certified Administrators, Classified Personnel and Substitutes/Temporary should be based upon 2,080 hours.
***Employee reduction plans include benefits received by employees under a Section 125 Salary Reduction Agreement. Does not include social security, workers'
compensation, and unemployment insurance.
****Board paid fringe benefits (employer paid) include group life, group health, disability income, accidental death and dismemberment, and hospital surgical, and/or medical
expense insurance. Does not include social security, workers' compensation, and unemployment insurance.
AVERAGE SALARY
2014-15 Actual 2015-16 Actual 2016-17 Contracted
0
20,000
40,000
60,000
80,000
100,000
Administrators(Certified/Non-Certified)
Teachers (Full Time) Other Certified (Licensed)Personnel
Classified Personnel
90,099
55,369 55,873
33,586
Average Salary
2014-2015
2015-2016
2016-2017
11

KSDE Website Information Available
K-12 Statistics (Building, District or State Totals) website below:
http://svapp15586.ksde.org/k12/k12.aspx
• Attendance / Enrollment Reports
• Staff Reports
• Graduates / Dropouts Reports
• Crime / Violence Reports
School Finance Reports and Publications website below:
http://www.ksde.org/Agency/Fiscal-and-Administrative-Services/School-Finance/Reports-and-Publications
• Assessed Valuation
• Cash Balances
• Headcount Enrollment
• Mill Levies
• Personnel (Certified/Non-Certified)
• Salary Reports
Kansas Building Report Card website below:
http://ksreportcard.ksde.org/
• Attendance Rate
• Graduation Rate
• Dropout Rate
• School Violence
• Assessments
• Reading
• Mathematics
• Writing
• Graduates Passing Adv. Science Courses
• Graduates Passing Adv. Math Courses
12