Embed Size (px)
Citation preview
PROFILE INFORMATION 2015-16
Paradise USD #399
School Finance Kansas State Department of Education Landon State Office Building 900 SW Jackson Street, Suite 356 Topeka, Kansas 66612-1212 www.ksde.org

i
• Budget General Information (characteristics of district)
• Supplemental Information for Tables in Summary of Expenditures
• KSDE Website Information Available
• Summary of Expenditures (Sumexpen.xlsx)

1
2015-16 Budget General Information USD #: 399
Introduction USD #399 Paradise-Natoma-Waldo is located in North Central Kansas. It contains 439 square miles and is in unique in that it encompasses parts of four counties: Russell, Osborne, Rooks, and Ellis. There are two attendance centers both located in Natoma. There is a K-6 building with a competition gymnasium and a 7-12 building. There is also a gymnasium in Paradise that is utilized for junior high practice and competition. Special Education services are provided through the North Central Kansas Special Education Cooperative Interlocal #636, Phillipsburg Kansas. USD #399 is also a member of the Smoky Hill Education Service Center. The Natoma High school is a member of the KSHSAA and Northern Plains League.
Board Members Mr. Jay Casey – President [email protected] Mr. Brad Murphy – Vice President [email protected] Mr. Justin Krug [email protected] Mr. Rick Pfortmiller [email protected] Mrs. Melissa Chrisler [email protected] Mrs. Debra Alexander [email protected] Mrs. Stephanie Dickerson [email protected]
Key Staff Superintendent: Mr. Aaron Homburg USD #399 Board Clerk: Mrs. Cambria Ellis K-12 Counselor: Ms. Rhonda Murphy K-6 Office: Mrs. Shawna Dunlap 7-12 Office: Mrs. Jonelle Custenborder
2015-2016 USD #399 Organization Chart K-6 Building Calee Wick – Preschool Annette Zeigler – Kindergarten Cody Dunlap – 1st Grade Karen Martin – 2nd Grade Holly Lang – 3rd/4th Grade Corinne Masters – 5th Grade Carmen Booth – 6th Grade Kristi Mettlen – Title I Felisha Bland – Special Ed Dale Eickhoff – Custodian Nyla Seaman –Library Aide Keshia Laffery – Para Carmen George – Para Audrey Maupin - Para Lorie Griffin – At Risk Para/Para
K-12 Staff Arla Homburg – Vocal Jennifer Feldkamp – Band Troy Ostmeyer – PE, 7-8 Middle Dale Eickhoff – Transportation Dir. Lois Lund – Bus Driver Marlene Murphy – Bus Driver Iva Maier – Bus Driver Richard Elliott – Bus Driver Ginger Dreiling – Cook Frank McManus – Cook Cathy Cameron – Cook
7-12 Building Shari Paget – English Bret Somers – Math Tom Ginther – Science Teresa Brandenburg – Science Kurt Grafel – Business James Edwards – Social Science Chris Broeckelman – Tech. Ed. Jeremy Long – Vo. Ag. Andrea Chambray – Special Ed Kevin Eickhoff – Custodian David Chambray – At Risk Para Mary Murphy – Library Aide July Bray – Para Tammy Chrisler – Para Jennifer Hays - Para
2
The District’s Accomplishments and Challenges
Accomplishments: K-6 Building: Recognized by the KSDE for achieving the Standard of Excellence in Math, Writing, and Science! Implemented Reading Street reading curriculum Fall 2012. Read Street is aligned with the Common Core Standards. 7-12 Building: Recognized by the KSDE for achieving the Standard of Excellence in Math, Writing, and Science! A 1-to-1 laptop initiative was organized in 2004 for all juniors and seniors within the district. Chrome books have been recently added to provide to freshman and sophomores. An I-pad initiative began in Fall 2012. Challenges: Rising cost of health care State budget funding

3
Supplemental Information for the Following Tables 1. Summary of Total Expenditures by Function (All Funds) 2. Summary of General Fund Expenditures by Function 3. Summary of Supplemental General Fund Expenditures by Function 4. Summary of General and Supplemental General Fund Expenditures by Function 5. Summary of Special Education Fund by Function 6. Instruction Expenditures (1000) 7. Student Support Expenditures (2100)
8. Instructional Support Expenditures (2200) 9. General Administration Expenditures (2300) 10. School Administration Expenditures (2400)
11. Central Services Expenditures (2500) 12. Operations and Maintenance Expenditures (2600)
13. Transportation Expenditures (2700) 14. Other Support Services Expenditures (2900)
15. Food Service Expenditures (3100)
16. Community Services Operations (3300) 17. Capital Improvements (4000) 18. Debt Services (5100)
19. Miscellaneous Information – Transfers (5200) 20. Miscellaneous Information Unencumbered Cash Balance by Fund 21. Reserve Funds Unencumbered Cash Balance 22. Other Information – Enrollment Information 23. Miscellaneous Information Mill Rates by Fund 24. Other Information – Assessed Valuation and Bonded Indebtedness
4
Note: The FTE (full time equivalency) used in this report to calculate the “Amount Per Pupil” is defined as follows: Enrollment (FTE) includes the current year enrollment on September 20, February 20, 4 yr old at-risk, and virtual. It does not include non-funded preschool or full-day kindergarten not on an IEP. KSDE Website Information Available K-12 Statistics (Building, District or State Totals) website below: http://svapp15586.ksde.org/k12/k12.aspx
• Attendance / Enrollment Reports • Staff Reports • Graduates / Dropouts Reports • Crime / Violence Reports
School Finance Reports and Publications website below: http://www.ksde.org/Agency/FiscalandAdministrativeServices/SchoolFinance/ReportsandPublications.aspx
• Assessed Valuation • Cash Balances • Headcount Enrollment • Mill Levies • Personnel (Certified/Non-Certified) • Salary Reports
Kansas Building Report Card website below: http://svapp15586.ksde.org/rcard/
• Attendance Rate • Graduation Rate • Dropout Rate • School Violence • Assessments
o Reading o Mathematics o Writing
• Graduates Passing Adv. Science Courses • Graduates Passing Adv. Math Courses

USD# 399
Summary of Total Expenditures By Function (All Funds)
% % % % %
2013-2014 of 2014-2015 of inc/ 2015-2016 of inc/
Actual Tot Actual Tot dec Budget Tot dec
Instruction 1,324,277 55% 1,318,219 60% 0% 1,451,108 49% 10%
Student Support Services 106,268 4% 78,464 4% -26% 90,247 3% 15%
Instructional Support Services 18,294 1% 13,696 1% -25% 18,041 1% 32%
Administration & Support 277,815 12% 269,520 12% -3% 279,593 9% 4%
Operations & Maintenance 278,480 12% 248,859 11% -11% 442,172 15% 78%
Transportation 224,061 9% 129,034 6% -42% 513,040 17% 298%
Food Services 142,792 6% 127,021 6% -11% 151,183 5% 19%
Capital Improvements 0 0% 5,650 0% 0% 10,000 0% 77%
Debt Services 0 0% 0 0% 0% 0 0% 0%
Other Costs 24,449 1% 23,128 1% -5% 25,987 1% 12%
Total Expenditures* 2,396,436 100% 2,213,591 100% -8% 2,981,371 100% 35%
Amount per Pupil $18,491 $18,791 2% $22,934 22%
Current Expenditures** 2,223,763 100% 2,023,830 100% -9% 2,067,531 100% 2%
Amount per Pupil $17,159 $17,180 0% $15,904 -7%
Instruction*** (Total Expenditures) 1,322,733 55% 1,301,231 59% 4% 1,336,108 45% -14%
Instruction*** (Current Expenditures) 1,322,733 59% 1,301,231 64% 5% 1,336,108 65% 1%
Note: Percentages on charts are within +-1% due to rounding used. Pie graph percentages may differ from charts for this reason also.
Further definition of what goes into each category:
Instruction - 1000 Transportation - 2700
Student Support Services - 2100 Food Service - 3100
Instructional Support Services - 2200 Other Costs - 2900 and 3300
Administration & Support - 2300, 2400 and 2500 Capital Improvements - 4000
Operations & Maintenance - 2600 Debt Services - 5100
Transfers - 5200
Percent of Expenditures
* The funds that are included in the categories above are: General, Supplemental General, Bilingual Education, At Risk(4yr Old), At Risk(K-12), Virtual Education, Capital
Outlay, Driver Education, Extraordinary School Program, Summer School, Special Education, Vocational Education, Professional Development, Bond & Interest #1, Bond &
Interest #2, No-Fund Warrant, Special Assessment, Parent Education, School Retirement, Student Materials Revolving & Textbook Rental, Tuition Reimbursement,
Gifts/Grants, KPERS Special Retirement Contribution, Contingency, Special Liability Expense, Federal Funds, Adult Education, Adult Supplemental Education, Activity Fund
and Special Education Coop Fund.
*** Instruction excludes Capital Outlay and Bond Debt expenditures (Code 16, Code 62, Code 63)
** Current Spending excludes Capital Outlay and Bond Debt expenditures (Code 16, Code 62, Code 63)
0
200,000
400,000
600,000
800,000
1,000,000
1,200,000
1,400,000
1,600,000 1,451,108
90,247 18,041
279,593 442,172 513,040
151,183 10,000 0 25,987
Summary of Total Expenditures by Function (All Funds)
2013-2014
2014-2015
2015-2016
Instruction 49%
Student Support Services
3%
Instructional Support 1%
Administration & Support 9%
Operations & Maintenance 15%
Transportation 17%
Food Services 5%
Other Costs
1%
2015-16 Summary of Total Expenditures by Function
Instruction
Student Support Services
Instructional Support
Administration & Support
Operations & Maintenance
Transportation
Food Services
Capital Improvements
Debt Services
Other Costs
10/9/2015 2:17 PM Sumexpen.xlsx Page 1 of 27

USD# 399
Summary of General Fund Expenditures
by Function
% % % % %
2013-2014 of 2014-2015 of inc/ 2015-2016 of inc/
Actual Tot Actual Tot dec Budget Tot dec
Instruction 577,925 51% 618,464 58% 7% 568,196 58% -8%
Student Support 44,893 4% 46,010 4% 2% 8,950 1% -81%
Instructional Support 0 0% 0 0% 0% 0 0% 0%
Administration & Support 211,895 19% 218,502 21% 3% 227,600 23% 4%
Operations & Maintenance 192,820 17% 104,626 10% -46% 88,700 9% -15%
Transportation 108,316 10% 75,758 7% -30% 78,636 8% 4%
Capital Improvements 0 0% 0 0% 0% 0 0% 0%
Other Costs 0 0% 0 0% 0% 0 0% 0%
Total Expenditures 1,135,849 100% 1,063,360 100% -6% 972,082 100% -9%
Amount per Pupil $8,764 $9,027 3% $7,478 -17%
The Summary of General Fund Expenditures chart information comes from pages 6-13 and only uses the 'General Fund' line items.
0
100,000
200,000
300,000
400,000
500,000
600,000
700,000
Instruction StudentSupport
InstructionalSupport
Administration& Support
Operations &Maintenance
Transportation CapitalImprovements
Other Costs
568,196
8,950 0
227,600
88,700 78,636
0 0
Summary of General Fund Expenditures
2013-2014
2014-2015
2015-2016
Instruction 59%
Student Support 1%
Administration & Support 23%
Operations & Maintenance 9%
Transportation 8%
2015-16 Summary of General Fund Expenditures by Function
Instruction
Student Support
Instructional Support
Administration & Support
Operations & Maintenance
Transportation
Capital Improvements
Other Costs
10/9/2015 2:17 PM Sumexpen.xlsx Page 2 of 27

USD# 399
Summary of Supplemental General Fund Expenditures
by Function
% % % % %
2013-2014 of 2014-2015 of inc/ 2015-2016 of inc/
Actual Tot Actual Tot dec Budget Tot dec
Instruction 237,093 73% 223,837 78% -6% 224,400 78% 0%
Student Support 14,892 5% 15,392 5% 3% 15,219 5% -1%
Instructional Support 0 0% 0 0% 0% 0 0% 0%
Administration & Support 30,079 9% 31,315 11% 4% 32,015 11% 2%
Operations & Maintenance 23,802 7% 1,038 0% -96% 1,800 1% 73%
Transportation 18,951 6% 13,524 5% -29% 12,687 4% -6%
Capital Improvements 0 0% 0 0% 0% 0 0% 0%
Other Costs 0 0% 2,029 1% 0% 2,152 1% 6%
Total Expenditures 324,817 100% 287,135 100% -12% 288,273 100% 0%
Amount per Pupil $2,506 $2,437 -3% $2,217 -9%
The Summary of Supplemental General Fund Expenditures chart information comes from pages 6-13 and only uses the 'Supplemental
General Fund' line items.
0
50,000
100,000
150,000
200,000
250,000
Instruction StudentSupport
InstructionalSupport
Administration& Support
Operations &Maintenance
Transportation CapitalImprovements
Other Costs
224,400
15,219
0
32,015
1,800 12,687
0 2,152
Summary of Supplemental General Expenditures by Function
2013-2014
2014-2015
2015-2016
Instruction 78%
Student Support 5%
Administration & Support 11%
Operations & Maintenance 1% Transportation
4%
Other Costs 1%
2015-16 Summary of Supplemental General Fund Expenditures by Function
Instruction
Student Support
Instructional Support
Administration & Support
Operations & Maintenance
Transportation
Capital Improvements
Other Costs
10/9/2015 2:17 PM Sumexpen.xlsx Page 3 of 27
USD# 399
Summary of General and Supplemental General Fund
Expenditures by Function
% % % % %
2013-2014 of 2014-2015 of inc/ 2015-2016 of inc/
Actual Tot Actual Tot dec Budget Tot dec
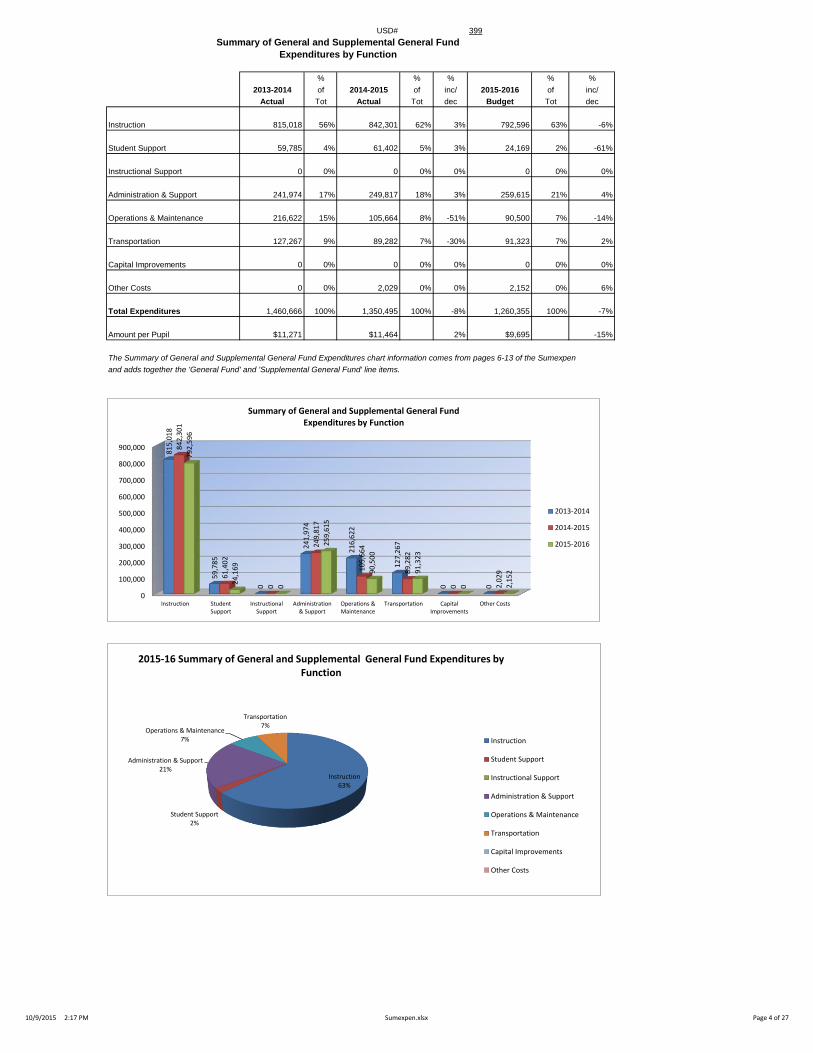
Instruction 815,018 56% 842,301 62% 3% 792,596 63% -6%
Student Support 59,785 4% 61,402 5% 3% 24,169 2% -61%
Instructional Support 0 0% 0 0% 0% 0 0% 0%
Administration & Support 241,974 17% 249,817 18% 3% 259,615 21% 4%
Operations & Maintenance 216,622 15% 105,664 8% -51% 90,500 7% -14%
Transportation 127,267 9% 89,282 7% -30% 91,323 7% 2%
Capital Improvements 0 0% 0 0% 0% 0 0% 0%
Other Costs 0 0% 2,029 0% 0% 2,152 0% 6%
Total Expenditures 1,460,666 100% 1,350,495 100% -8% 1,260,355 100% -7%
Amount per Pupil $11,271 $11,464 2% $9,695 -15%
The Summary of General and Supplemental General Fund Expenditures chart information comes from pages 6-13 of the Sumexpen
and adds together the 'General Fund' and 'Supplemental General Fund' line items.
0
100,000
200,000
300,000
400,000
500,000
600,000
700,000
800,000
900,000
Instruction StudentSupport
InstructionalSupport
Administration& Support
Operations &Maintenance
Transportation CapitalImprovements
Other Costs
81
5,0
18
59
,78
5
0
24
1,9
74
21
6,6
22
12
7,2
67
0
0
84
2,3
01
61
,40
2
0
24
9,8
17
10
5,6
64
89
,28
2
0 2,0
29
79
2,5
96
24
,16
9
0
25
9,6
15
90
,50
0
91
,32
3
0 2,1
52
Summary of General and Supplemental General Fund Expenditures by Function
2013-2014
2014-2015
2015-2016
Instruction 63%
Student Support 2%
Administration & Support 21%
Operations & Maintenance 7%
Transportation 7%
2015-16 Summary of General and Supplemental General Fund Expenditures by Function
Instruction
Student Support
Instructional Support
Administration & Support
Operations & Maintenance
Transportation
Capital Improvements
Other Costs
10/9/2015 2:17 PM Sumexpen.xlsx Page 4 of 27

USD# 399
Summary of Special Education Fund
by Function
% % % % %
2013-2014 of 2014-2015 of inc/ 2015-2016 of inc/
Actual Tot Actual Tot dec Budget Tot dec
Instruction 244,819 99% 209,607 100% -14% 226,570 99% 8%
Student Support 2,698 1% 811 0% -70% 1,615 1% 99%
Instructional Support 0 0% 0 0% 0% 0 0% 0%
Administraton & Support 130 0% 0 0% -100% 0 0% 0%
Operations & Maintenance 0 0% 0 0% 0% 0 0% 0%
Transportation 0 0% 0 0% 0% 0 0% 0%
Capital Improvements 0 0% 0 0% 0% 0 0% 0%
Other Costs 0 0% 0 0% 0% 0 0% 0%
Total Expenditures 247,647 100% 210,418 100% -15% 228,185 100% 8%
Amount per Pupil $1,911 $1,786 -7% $1,755 -2%
The Summary of Special Education Fund Expenditures chart information comes from pages 6-13 and only uses the 'Special Education Fund'
line items. (Total expenditures excludes Special Ed Coop Fund because it would include expenditures for all schools participating in the Coop.)
0
50,000
100,000
150,000
200,000
250,000
Instruction StudentSupport
InstructionalSupport
Administraton& Support
Operations &Maintenance
Transportation CapitalImprovements
Other Costs
24
4,8
19
2,6
98
0 13
0
0
0
0
0
20
9,6
07
81
1
0
0
0
0
0
0
22
6,5
70
1,6
15
0
0
0
0
0
0
Summary of Special Education Fund Expenditures by Function
2013-2014
2014-2015
2015-2016
Instruction 99%
Student Support 1%
2015-16 Summary of Special Education Fund by Function
Instruction
Student Support
Instructional Support
Administraton & Support
Operations & Maintenance
Transportation
Capital Improvements
Other Costs
10/9/2015 2:17 PM Sumexpen.xlsx Page 5 of 27

USD# 399
Instruction Expenditures (1000)
% %
2013-2014 2014-2015 inc/ 2015-2016 inc/
Actual Actual dec Budget dec
General 577,925 618,464 7% 568,196 -8%
Federal Funds 25,916 24,111 -7% 23,861 -1%
Supplemental General 237,093 223,837 -6% 224,400 0%
At Risk (4yr Old) 10,805 13,355 24% 13,000 -3%
At Risk (K-12) 70,957 38,124 -46% 82,000 115%
Bilingual Education 0 0 0% 3,500 0%
Virtual Education 0 0 0% 0 0%
Capital Outlay 1,544 16,988 1000% 115,000 577%
Driver Education 1,904 1,760 -8% 1,522 -14%
Declining Enrollment 0 0 0% 0 0%
Extraordinary School Program 0 0 0% 0 0%
Food Service 0 0 0% 0 0%
Professional Development 0 0 0% 0 0%
Parent Education Program 0 0 0% 0 0%
Summer School 0 0 0% 0 0%
Special Education 244,819 209,607 -14% 226,570 8%
Cost of Living 0 0 0% 0 0%
Vocational Education 96,930 96,455 0% 98,000 2%
Gifts/Grants 401 2,250 461% 7,000 211%
Special Liability 0 0 0% 0 0%
School Retirement 0 0 0% 0 0%
Extraordinary Growth Facilities 0 0 0% 0 0%
Special Reserve 0 0 0%
KPERS Spec. Ret. Contribution 36,504 49,750 36% 88,059 77%
Contingency Reserve 0 0 0%
Text Book & Student Material 2,065 1,630 -21%
Activity Fund 17,414 21,888 26%
Bond and Interest #1 0 0 0% 0 0%
Bond and Interest #2 0 0 0% 0 0%
No-Fund Warrant 0 0 0% 0 0%
Special Assessment 0 0 0% 0 0%
Temporary Note 0 0 0% 0 0%
SUBTOTAL 1,324,277 1,318,219 0% 1,451,108 10%
Enrollment (FTE)* 129.6 117.8 -9% 130.0 10%
Amount per Pupil 10,218 11,190 10% 11,162 0%
Adult Education 0 0 0% 0 0%
Adult Supplemental Education 0 0 0% 0 0%
Tuition Reimbursement 0 0 0% 0 0%
Special Education Coop 0 0 0% 0 0%
TOTAL 1,324,277 1,318,219 0% 1,451,108 10%
NOTE: Gifts/Grants includes private grants and grants from nonfederal sources.
Amount per pupil excludes the following funds: Adult Education, Adult Supplemental Education, Special Education Coop
and Tuition Reimbursement.
* Enrollment (FTE) includes the current year enrollment on September 20, February 20, 4 yr old at-risk, and virtual.
It does not include non-funded preschool or full-day kindergarten not on an IEP.
0
200,000
400,000
600,000
800,000
2013-2014 2014-2015 2015-2016
577,925 618,464
568,196
237,093 223,837 224,400 244,819
209,607
226,570
Instruction Expenditures
GeneralSupplemental GeneralSpecial Education
1,250,000
1,300,000
1,350,000
1,400,000
1,450,000
1,500,000
2013-2014 2014-2015 2015-2016
1,324,277 1,318,219
1,451,108
Instruction Expenditures
10/9/2015 2:17 PM Sumexpen.xlsx Page 6 of 27
USD# 399
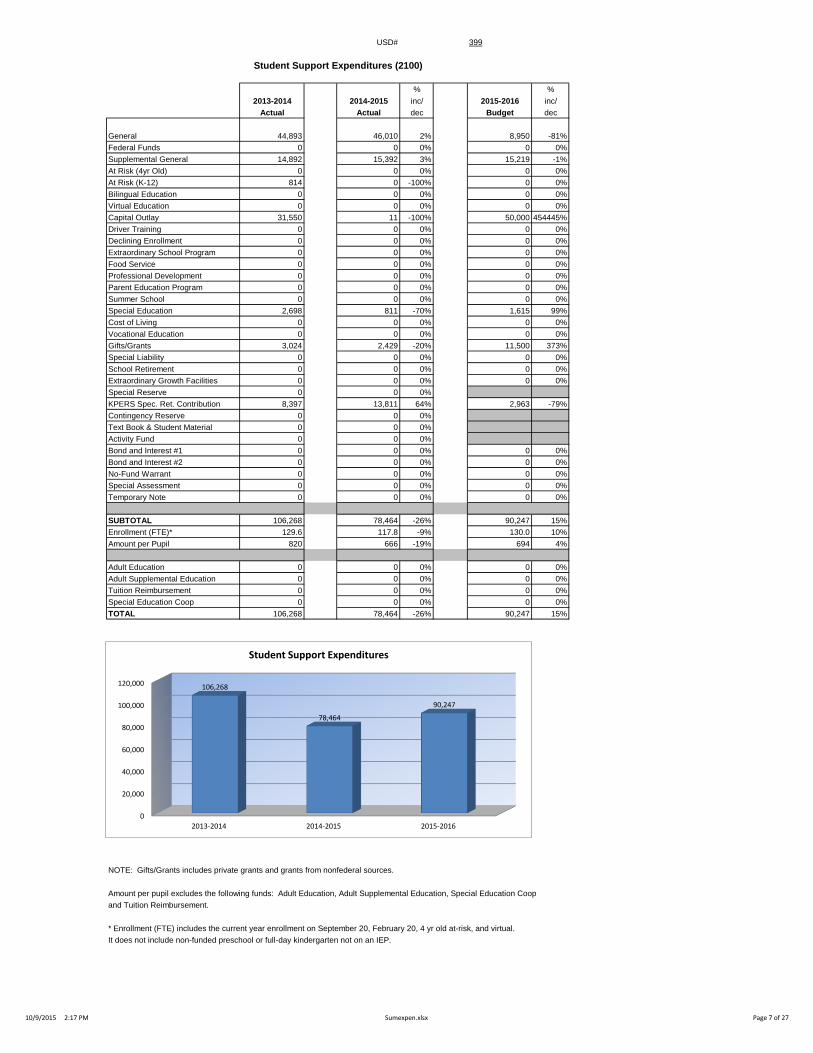
Student Support Expenditures (2100)
% %
2013-2014 2014-2015 inc/ 2015-2016 inc/
Actual Actual dec Budget dec
General 44,893 46,010 2% 8,950 -81%
Federal Funds 0 0 0% 0 0%
Supplemental General 14,892 15,392 3% 15,219 -1%
At Risk (4yr Old) 0 0 0% 0 0%
At Risk (K-12) 814 0 -100% 0 0%
Bilingual Education 0 0 0% 0 0%
Virtual Education 0 0 0% 0 0%
Capital Outlay 31,550 11 -100% 50,000 454445%
Driver Training 0 0 0% 0 0%
Declining Enrollment 0 0 0% 0 0%
Extraordinary School Program 0 0 0% 0 0%
Food Service 0 0 0% 0 0%
Professional Development 0 0 0% 0 0%
Parent Education Program 0 0 0% 0 0%
Summer School 0 0 0% 0 0%
Special Education 2,698 811 -70% 1,615 99%
Cost of Living 0 0 0% 0 0%
Vocational Education 0 0 0% 0 0%
Gifts/Grants 3,024 2,429 -20% 11,500 373%
Special Liability 0 0 0% 0 0%
School Retirement 0 0 0% 0 0%
Extraordinary Growth Facilities 0 0 0% 0 0%
Special Reserve 0 0 0%
KPERS Spec. Ret. Contribution 8,397 13,811 64% 2,963 -79%
Contingency Reserve 0 0 0%
Text Book & Student Material 0 0 0%
Activity Fund 0 0 0%
Bond and Interest #1 0 0 0% 0 0%
Bond and Interest #2 0 0 0% 0 0%
No-Fund Warrant 0 0 0% 0 0%
Special Assessment 0 0 0% 0 0%
Temporary Note 0 0 0% 0 0%
SUBTOTAL 106,268 78,464 -26% 90,247 15%
Enrollment (FTE)* 129.6 117.8 -9% 130.0 10%
Amount per Pupil 820 666 -19% 694 4%
Adult Education 0 0 0% 0 0%
Adult Supplemental Education 0 0 0% 0 0%
Tuition Reimbursement 0 0 0% 0 0%
Special Education Coop 0 0 0% 0 0%
TOTAL 106,268 78,464 -26% 90,247 15%
NOTE: Gifts/Grants includes private grants and grants from nonfederal sources.
Amount per pupil excludes the following funds: Adult Education, Adult Supplemental Education, Special Education Coop
and Tuition Reimbursement.
* Enrollment (FTE) includes the current year enrollment on September 20, February 20, 4 yr old at-risk, and virtual.
It does not include non-funded preschool or full-day kindergarten not on an IEP.
0
20,000
40,000
60,000
80,000
100,000
120,000
2013-2014 2014-2015 2015-2016
106,268
78,464
90,247
Student Support Expenditures
10/9/2015 2:17 PM Sumexpen.xlsx Page 7 of 27

USD# 399
Instructional Support Expenditures (2200)
% %
2013-2014 2014-2015 inc/ 2015-2016 inc/
Actual Actual dec Budget dec
General 0 0 0% 0 0%
Federal Funds 8,004 4,311 -46% 8,041 87%
Supplemental General 0 0 0% 0 0%
At Risk (4yr Old) 0 0 0% 0 0%
At Risk (K-12) 0 0 0% 0 0%
Bilingual Education 0 0 0% 0 0%
Virtual Education 0 0 0% 0 0%
Capital Outlay 4,946 0 -100% 10,000 0%
Driver Training 0 0 0% 0 0%
Declining Enrollment 0 0 0% 0 0%
Extraordinary School Program 0 0 0% 0 0%
Food Service 0 0 0% 0 0%
Professional Development 0 0 0% 0 0%
Parent Education Program 0 0 0% 0 0%
Summer School 0 0 0% 0 0%
Special Education 0 0 0% 0 0%
Cost of Living 0 0 0% 0 0%
Vocational Education 0 0 0% 0 0%
Gifts/Grants 210 0 -100% 0 0%
Special Liability 0 0 0% 0 0%
School Retirement 0 0 0% 0 0%
Extraordinary Growth Facilities 0 0 0% 0 0%
Special Reserve 0 0 0%
KPERS Spec. Ret. Contribution 5,134 9,385 83% 0 -100%
Contingency Reserve 0 0 0%
Text Book & Student Material 0 0 0%
Activity Fund 0 0 0%
Bond and Interest #1 0 0 0% 0 0%
Bond and Interest #2 0 0 0% 0 0%
No-Fund Warrant 0 0 0% 0 0%
Special Assessment 0 0 0% 0 0%
Temporary Note 0 0 0% 0 0%
SUBTOTAL 18,294 13,696 -25% 18,041 32%
Enrollment (FTE)* 129.6 117.8 -9% 130.0 10%
Amount per Pupil 141 116 -18% 139 19%
Adult Education 0 0 0% 0 0%
Adult Supplemental Education 0 0 0% 0 0%
Tuition Reimbursement 0 0 0% 0 0%
Special Education Coop 0 0 0% 0 0%
TOTAL 18,294 13,696 -25% 18,041 32%
NOTE: Gifts/Grants includes private grants and grants from nonfederal sources.
Amount per pupil excludes the following funds: Adult Education, Adult Supplemental Education, Special Education Coop
and Tuition Reimbursement.
* Enrollment (FTE) includes the current year enrollment on September 20, February 20, 4 yr old at-risk, and virtual.
It does not include non-funded preschool or full-day kindergarten not on an IEP.
0
2,000
4,000
6,000
8,000
10,000
12,000
14,000
16,000
18,000
20,000
2013-2014 2014-2015 2015-2016
18,294
13,696
18,041
Instructional Support Expenditures
10/9/2015 2:17 PM Sumexpen.xlsx Page 8 of 27

USD# 399
General Administration Expenditures (2300)
% %
2013-2014 2014-2015 inc/ 2015-2016 inc/
Actual Actual dec Budget dec
General 104,833 97,645 -7% 98,550 1%
Federal Funds 0 0 0% 0 0%
Supplemental General 14,904 14,383 -3% 14,700 2%
At Risk (4yr Old) 0 0 0% 0 0%
At Risk (K-12) 0 0 0% 0 0%
Bilingual Education 0 0 0% 0 0%
Virtual Education 0 0 0% 0 0%
Capital Outlay 0 0 0% 0 0%
Driver Training 0 0 0% 0 0%
Declining Enrollment 0 0 0% 0 0%
Extraordinary School Program 0 0 0% 0 0%
Food Service 0 0 0% 0 0%
Professional Development 0 0 0% 0 0%
Parent Education Program 0 0 0% 0 0%
Summer School 0 0 0% 0 0%
Special Education 130 0 -100% 0 0%
Cost of Living 0 0 0% 0 0%
Vocational Education 0 0 0% 0 0%
Gifts/Grants 0 0 0% 0 0%
Special Liability Expense 0 0 0% 0 0%
School Retirement 0 0 0% 0 0%
Extraordinary Growth Facilities 0 0 0% 0 0%
Special Reserve 0 0 0%
KPERS Spec. Ret. Contribution 19,540 9,299 -52% 5,684 -39%
Contingency Reserve 0 0 0%
Text Book & Student Material 0 0 0%
Activity Fund 0 0 0%
Bond and Interest #1 0 0 0% 0 0%
Bond and Interest #2 0 0 0% 0 0%
No-Fund Warrant 0 0 0% 0 0%
Special Assessment 0 0 0% 0 0%
Temporary Note 0 0 0% 0 0%
SUBTOTAL 139,407 121,327 -13% 118,934 -2%
Enrollment (FTE)* 129.6 117.8 -9% 130.0 10%
Amount per Pupil 1,076 1,030 -4% 915 -11%
Adult Education 0 0 0% 0 0%
Adult Supplemental Education 0 0 0% 0 0%
Tuition Reimbursement 0 0 0% 0 0%
Special Education Coop 0 0 0% 0 0%
TOTAL 139,407 121,327 -13% 118,934 -2%
NOTE: Gifts/Grants includes private grants and grants from nonfederal sources.
Amount per pupil excludes the following funds: Adult Education, Adult Supplemental Education, Special Education Coop
and Tuition Reimbursement.
* Enrollment (FTE) includes the current year enrollment on September 20, February 20, 4 yr old at-risk, and virtual.
It does not include non-funded preschool or full-day kindergarten not on an IEP.
105,000
110,000
115,000
120,000
125,000
130,000
135,000
140,000
2013-2014 2014-2015 2015-2016
139,407
121,327 118,934
General Administration Expenditures
10/9/2015 2:17 PM Sumexpen.xlsx Page 9 of 27

USD# 399
School Administration Expenditures (2400)
% %
2013-2014 2014-2015 inc/ 2015-2016 inc/
Actual Actual dec Budget dec
General 107,062 102,448 -4% 108,330 6%
Federal Funds 0 0 0% 0 0%
Supplemental General 15,175 16,932 12% 17,315 2%
At Risk (4yr Old) 0 0 0% 0 0%
At Risk (K-12) 0 0 0% 0 0%
Bilingual Education 0 0 0% 0 0%
Virtual Education 0 0 0% 0 0%
Capital Outlay 0 0 0% 0 0%
Driver Training 0 0 0% 0 0%
Declining Enrollment 0 0 0% 0 0%
Extraordinary School Program 0 0 0% 0 0%
Food Service 0 0 0% 0 0%
Professional Development 0 0 0% 0 0%
Parent Education Program 0 0 0% 0 0%
Summer School 0 0 0% 0 0%
Special Education 0 0 0% 0 0%
Cost of Living 0 0 0% 0 0%
Vocational Education 0 0 0% 0 0%
Gifts/Grants 0 0 0% 0 0%
Special Liability Expense 0 0 0% 0 0%
School Retirement 0 0 0% 0 0%
Extraordinary Growth Facilities 0 0 0% 0 0%
Special Reserve 0 0 0%
KPERS Spec. Ret. Contribution 16,171 10,404 -36% 12,330 19%
Contingency Reserve 0 0 0%
Text Book & Student Material 0 0 0%
Activity Fund 0 0 0%
Bond and Interest #1 0 0 0% 0 0%
Bond and Interest #2 0 0 0% 0 0%
No-Fund Warrant 0 0 0% 0 0%
Special Assessment 0 0 0% 0 0%
Temporary Note 0 0 0% 0 0%
SUBTOTAL 138,408 129,784 -6% 137,975 6%
Enrollment (FTE)* 129.6 117.8 -9% 130.0 10%
Amount per Pupil 1,068 1,102 3% 1,061 -4%
Adult Education 0 0 0% 0 0%
Adult Supplemental Education 0 0 0% 0 0%
Tuition Reimbursement 0 0 0% 0 0%
Special Education Coop 0 0 0% 0 0%
TOTAL 138,408 129,784 -6% 137,975 6%
NOTE: Gifts/Grants includes private grants and grants from nonfederal sources.
Amount per pupil excludes the following funds: Adult Education, Adult Supplemental Education, Special Education Coop
and Tuition Reimbursement.
* Enrollment (FTE) includes the current year enrollment on September 20, February 20, 4 yr old at-risk, and virtual.
It does not include non-funded preschool or full-day kindergarten not on an IEP.
124,000
126,000
128,000
130,000
132,000
134,000
136,000
138,000
140,000
2013-2014 2014-2015 2015-2016
138,408
129,784
137,975
School Administration Expenditures
10/9/2015 2:17 PM Sumexpen.xlsx Page 10 of 27

USD# 399
Central Services Expenditures (2500)
% %
2013-2014 2014-2015 inc/ 2015-2016 inc/
Actual Actual dec Budget dec
General 0 18,409 0% 20,720 13%
Federal Funds 0 0 0% 0 0%
Supplemental General 0 0 0% 0 0%
At Risk (4yr Old) 0 0 0% 0 0%
At Risk (K-12) 0 0 0% 0 0%
Bilingual Education 0 0 0% 0 0%
Virtual Education 0 0 0% 0 0%
Capital Outlay 0 0 0% 0 0%
Driver Training 0 0 0% 0 0%
Declining Enrollment 0 0 0% 0 0%
Extraordinary School Program 0 0 0% 0 0%
Food Service 0 0 0% 0 0%
Professional Development 0 0 0% 0 0%
Parent Education Program 0 0 0% 0 0%
Summer School 0 0 0% 0 0%
Special Education 0 0 0% 0 0%
Cost of Living 0 0 0% 0 0%
Vocational Education 0 0 0% 0 0%
Gifts/Grants 0 0 0% 0 0%
Special Liability 0 0 0% 0 0%
School Retirement 0 0 0% 0 0%
Extraordinary Growth Facilities 0 0 0% 0 0%
Special Reserve 0 0 0%
KPERS Spec. Ret. Contribution 0 0 0% 1,964 0%
Contingency Reserve 0 0 0%
Text Book & Student Material 0 0 0%
Activity Fund 0 0 0%
Bond & Interest #1 0 0 0% 0 0%
Bond & Interest #2 0 0 0% 0 0%
No-Fund Warrant 0 0 0% 0 0%
Special Assessment 0 0 0% 0 0%
Temporary Note 0 0 0% 0 0%
SUBTOTAL 0 18,409 0% 22,684 23%
Enrollment (FTE)* 129.6 117.8 -9% 130.0 10%
Amount per Pupil 0 156 0% 174 12%
Adult Education 0 0 0% 0 0%
Adult Supplemental Education 0 0 0% 0 0%
Tuition Reimbursement 0 0 0% 0 0%
Special Education Coop 0 0 0% 0 0%
TOTAL 0 18,409 0% 22,684 23%
NOTE: Gifts/Grants includes private grants and grants from nonfederal sources.
Amount per pupil excludes the following funds: Adult Education, Adult Supplemental Education, Special Education Coop
and Tuition Reimbursement.
* Enrollment (FTE) includes the current year enrollment on September 20, February 20, 4 yr old at-risk, and virtual.
It does not include non-funded preschool or full-day kindergarten not on an IEP.
0
5,000
10,000
15,000
20,000
25,000
2013-2014 2014-2015 2015-2016
0
18,409
22,684
Central Services Expenditures
10/9/2015 2:17 PM Sumexpen.xlsx Page 11 of 27

USD# 399
Operations and Maintenance Expenditures (2600)
% %
2013-2014 2014-2015 inc/ 2015-2016 inc/
Actual Actual dec Budget dec
General 192,820 104,626 -46% 88,700 -15%
Federal Funds 0 0 0% 0 0%
Supplemental General 23,802 1,038 -96% 1,800 73%
At Risk (4yr Old) 0 0 0% 0 0%
At Risk (K-12) 0 0 0% 0 0%
Bilingual Education 0 0 0% 0 0%
Virtual Education 0 0 0% 0 0%
Capital Outlay 47,339 133,842 183% 315,100 135%
Driver Training 354 128 -64% 134 5%
Declining Enrollment 0 0 0% 0 0%
Extraordinary School Program 0 0 0% 0 0%
Food Service 0 0 0% 0 0%
Professional Development 0 0 0% 0 0%
Parent Education Program 0 0 0% 0 0%
Summer School 0 0 0% 0 0%
Special Education 0 0 0% 0 0%
Cost of Living 0 0 0% 0 0%
Vocational Education 0 0 0% 0 0%
Gifts/Grants 0 0 0% 24,034 0%
Special Liability 0 0 0% 0 0%
School Retirement 0 0 0% 0 0%
Extraordinary Growth Facilities 0 0 0% 0 0%
Special Reserve 0 0 0%
KPERS Spec. Ret. Contribution 14,165 9,225 -35% 12,404 34%
Contingency Reserve 0 0 0%
Text Book & Student Material 0 0 0%
Activity Fund 0 0 0%
Bond and Interest #1 0 0 0% 0 0%
Bond and Interest #2 0 0 0% 0 0%
No-Fund Warrant 0 0 0% 0 0%
Special Assessment 0 0 0% 0 0%
Temporary Note 0 0 0% 0 0%
SUBTOTAL 278,480 248,859 -11% 442,172 78%
Enrollment (FTE)* 129.6 117.8 -9% 130.0 10%
Amount per Pupil 2,149 2,113 -2% 3,401 61%
Adult Education 0 0 0% 0 0%
Adult Supplemental Education 0 0 0% 0 0%
Tuition Reimbursement 0 0 0% 0 0%
Special Education Coop 0 0 0% 0 0%
TOTAL 278,480 248,859 -11% 442,172 78%
NOTE: Gifts/Grants includes private grants and grants from nonfederal sources.
Amount per pupil excludes the following funds: Adult Education, Adult Supplemental Education, Special Education Coop
and Tuition Reimbursement.
* Enrollment (FTE) includes the current year enrollment on September 20, February 20, 4 yr old at-risk, and virtual.
It does not include non-funded preschool or full-day kindergarten not on an IEP.
0
50,000
100,000
150,000
200,000
250,000
300,000
350,000
400,000
450,000
2013-2014 2014-2015 2015-2016
278,480
248,859
442,172
Operations and Maintenance Expenditures
10/9/2015 2:17 PM Sumexpen.xlsx Page 12 of 27

USD# 399
Transportation Expenditures (2700)
% %
2013-2014 2014-2015 inc/ 2015-2016 inc/
Actual Actual dec Budget dec
General 108,316 75,758 -30% 78,636 4%
Federal Funds 0 0 0% 0 0%
Supplemental General 18,951 13,524 -29% 12,687 -6%
At Risk (4yr Old) 0 0 0% 0 0%
At Risk (K-12) 0 0 0% 0 0%
Bilingual Education 0 0 0% 0 0%
Virtual Education 0 0 0% 0 0%
Capital Outlay 87,294 33,270 -62% 413,740 1144%
Driver Training 0 0 0% 0 0%
Declining Enrollment 0 0 0% 0 0%
Extraordinary School Program 0 0 0% 0 0%
Food Service 0 0 0% 0 0%
Professional Development 0 0 0% 0 0%
Parent Education Program 0 0 0% 0 0%
Summer School 0 0 0% 0 0%
Special Education 0 0 0% 0 0%
Cost of Living 0 0 0% 0 0%
Vocational Education 0 0 0% 0 0%
Gifts/Grants 0 229 0% 1,300 468%
Special Liability 0 0 0% 0 0%
School Retirement 0 0 0% 0 0%
Extraordinary Growth Facilities 0 0 0% 0 0%
Special Reserve 0 0 0%
KPERS Spec. Ret. Contribution 9,500 6,253 -34% 6,677 7%
Contingency Reserve 0 0 0%
Text Book & Student Material 0 0 0%
Activity Fund 0 0 0%
Bond and Interest #1 0 0 0% 0 0%
Bond and Interest #2 0 0 0% 0 0%
No-Fund Warrant 0 0 0% 0 0%
Special Assessment 0 0 0% 0 0%
Temporary Note 0 0 0% 0 0%
SUBTOTAL 224,061 129,034 -42% 513,040 298%
Enrollment (FTE)* 129.6 117.8 -9% 130.0 10%
Amount per Pupil 1,729 1,095 -37% 3,946 260%
Adult Education 0 0 0% 0 0%
Adult Supplemental Education 0 0 0% 0 0%
Tuition Reimbursement 0 0 0% 0 0%
Special Education Coop 0 0 0% 0 0%
TOTAL 224,061 129,034 -42% 513,040 298%
NOTE: Gifts/Grants includes private grants and grants from nonfederal sources.
Amount per pupil excludes the following funds: Adult Education, Adult Supplemental Education, Special Education Coop
and Tuition Reimbursement.
* Enrollment (FTE) includes the current year enrollment on September 20, February 20, 4 yr old at-risk, and virtual.
It does not include non-funded preschool or full-day kindergarten not on an IEP.
0
100,000
200,000
300,000
400,000
500,000
600,000
2013-2014 2014-2015 2015-2016
224,061
129,034
513,040
Transportation Expenditures
10/9/2015 2:17 PM Sumexpen.xlsx Page 13 of 27
USD# 399
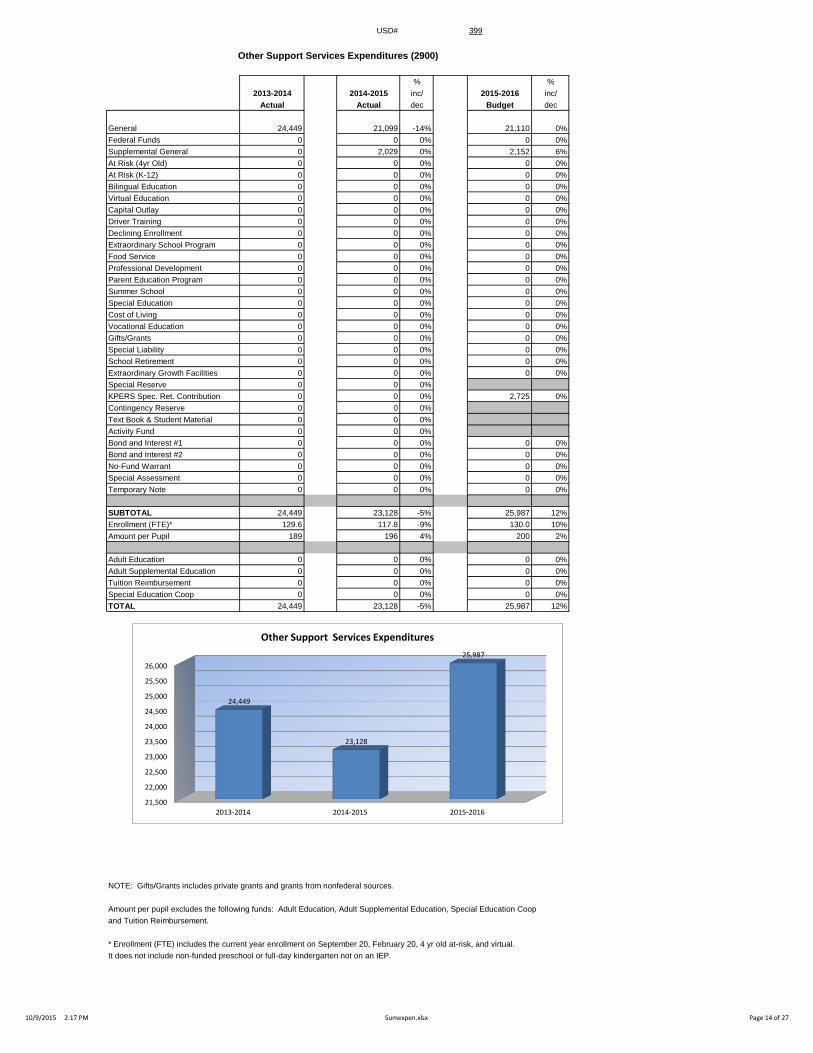
Other Support Services Expenditures (2900)
% %
2013-2014 2014-2015 inc/ 2015-2016 inc/
Actual Actual dec Budget dec
General 24,449 21,099 -14% 21,110 0%
Federal Funds 0 0 0% 0 0%
Supplemental General 0 2,029 0% 2,152 6%
At Risk (4yr Old) 0 0 0% 0 0%
At Risk (K-12) 0 0 0% 0 0%
Bilingual Education 0 0 0% 0 0%
Virtual Education 0 0 0% 0 0%
Capital Outlay 0 0 0% 0 0%
Driver Training 0 0 0% 0 0%
Declining Enrollment 0 0 0% 0 0%
Extraordinary School Program 0 0 0% 0 0%
Food Service 0 0 0% 0 0%
Professional Development 0 0 0% 0 0%
Parent Education Program 0 0 0% 0 0%
Summer School 0 0 0% 0 0%
Special Education 0 0 0% 0 0%
Cost of Living 0 0 0% 0 0%
Vocational Education 0 0 0% 0 0%
Gifts/Grants 0 0 0% 0 0%
Special Liability 0 0 0% 0 0%
School Retirement 0 0 0% 0 0%
Extraordinary Growth Facilities 0 0 0% 0 0%
Special Reserve 0 0 0%
KPERS Spec. Ret. Contribution 0 0 0% 2,725 0%
Contingency Reserve 0 0 0%
Text Book & Student Material 0 0 0%
Activity Fund 0 0 0%
Bond and Interest #1 0 0 0% 0 0%
Bond and Interest #2 0 0 0% 0 0%
No-Fund Warrant 0 0 0% 0 0%
Special Assessment 0 0 0% 0 0%
Temporary Note 0 0 0% 0 0%
SUBTOTAL 24,449 23,128 -5% 25,987 12%
Enrollment (FTE)* 129.6 117.8 -9% 130.0 10%
Amount per Pupil 189 196 4% 200 2%
Adult Education 0 0 0% 0 0%
Adult Supplemental Education 0 0 0% 0 0%
Tuition Reimbursement 0 0 0% 0 0%
Special Education Coop 0 0 0% 0 0%
TOTAL 24,449 23,128 -5% 25,987 12%
NOTE: Gifts/Grants includes private grants and grants from nonfederal sources.
Amount per pupil excludes the following funds: Adult Education, Adult Supplemental Education, Special Education Coop
and Tuition Reimbursement.
* Enrollment (FTE) includes the current year enrollment on September 20, February 20, 4 yr old at-risk, and virtual.
It does not include non-funded preschool or full-day kindergarten not on an IEP.
21,500
22,000
22,500
23,000
23,500
24,000
24,500
25,000
25,500
26,000
2013-2014 2014-2015 2015-2016
24,449
23,128
25,987
Other Support Services Expenditures
10/9/2015 2:17 PM Sumexpen.xlsx Page 14 of 27

USD# 399
Food Services Expenditures (3100)
% %
2013-2014 2014-2015 inc/ 2015-2016 inc/
Actual Actual dec Budget dec
General 0 0 0% 0 0%
Federal Funds 0 0 0% 0 0%
Supplemental General 0 0 0% 0 0%
At Risk (4yr Old) 0 0 0% 0 0%
At Risk (K-12) 0 0 0% 0 0%
Bilingual Education 0 0 0% 0 0%
Virtual Education 0 0 0% 0 0%
Capital Outlay 0 0 0% 0 0%
Driver Training 0 0 0% 0 0%
Declining Enrollment 0 0 0% 0 0%
Extraordinary School Program 0 0 0% 0 0%
Food Service 132,292 119,917 -9% 144,847 21%
Professional Development 0 0 0% 0 0%
Parent Education Program 0 0 0% 0 0%
Summer School 0 0 0% 0 0%
Special Education 0 0 0% 0 0%
Cost of Living 0 0 0% 0 0%
Vocational Education 0 0 0% 0 0%
Gifts/Grants 0 0 0% 0 0%
Special Liability 0 0 0% 0 0%
School Retirement 0 0 0% 0 0%
Extraordinary Growth Facilities 0 0 0% 0 0%
Special Reserve 0 0 0%
KPERS Spec. Ret. Contribution 10,500 7,104 -32% 6,336 -11%
Contingency Reserve 0 0 0%
Text Book & Student Material 0 0 0%
Activity Fund 0 0 0%
Bond and Interest #1 0 0 0% 0 0%
Bond and Interest #2 0 0 0% 0 0%
No-Fund Warrant 0 0 0% 0 0%
Special Assessment 0 0 0% 0 0%
Temporary Note 0 0 0% 0 0%
SUBTOTAL 142,792 127,021 -11% 151,183 19%
Enrollment (FTE)* 129.6 117.8 -9% 130.0 10%
Amount per Pupil 1,102 1,078 -2% 1,163 8%
Adult Education 0 0 0% 0 0%
Adult Supplemental Education 0 0 0% 0 0%
Tuition Reimbursement 0 0 0% 0 0%
Special Education Coop 0 0 0% 0 0%
TOTAL 142,792 127,021 -11% 151,183 19%
NOTE: Gifts/Grants includes private grants and grants from nonfederal sources.
Amount per pupil excludes the following funds: Adult Education, Adult Supplemental Education, Special Education Coop
and Tuition Reimbursement.
* Enrollment (FTE) includes the current year enrollment on September 20, February 20, 4 yr old at-risk, and virtual.
It does not include non-funded preschool or full-day kindergarten not on an IEP.
110,000
115,000
120,000
125,000
130,000
135,000
140,000
145,000
150,000
155,000
2013-2014 2014-2015 2015-2016
142,792
127,021
151,183
Food Service Expenditures
10/9/2015 2:17 PM Sumexpen.xlsx Page 15 of 27

USD# 399
Community Services Operations (3300)
% %
2013-2014 2014-2015 inc/ 2015-2016 inc/
Actual Actual dec Budget dec
General 0 0 0% 0 0%
Federal Funds 0 0 0% 0 0%
Supplemental General 0 0 0% 0 0%
At Risk (4yr Old) 0 0 0% 0 0%
At Risk (K-12) 0 0 0% 0 0%
Bilingual Education 0 0 0% 0 0%
Virtual Education 0 0 0% 0 0%
Capital Outlay 0 0 0% 0 0%
Driver Training 0 0 0% 0 0%
Declining Enrollment 0 0 0% 0 0%
Extraordinary School Program 0 0 0% 0 0%
Food Service 0 0 0% 0 0%
Professional Development 0 0 0% 0 0%
Parent Education Program 0 0 0% 0 0%
Summer School 0 0 0% 0 0%
Special Education 0 0 0% 0 0%
Cost of Living 0 0 0% 0 0%
Vocational Education 0 0 0% 0 0%
Gifts/Grants 0 0 0% 0 0%
Special Liability 0 0 0% 0 0%
School Retirement 0 0 0% 0 0%
Extraordinary Growth Facilities 0 0 0% 0 0%
Special Reserve 0 0 0%
KPERS Spec. Ret. Contribution 0 0 0% 0 0%
Contingency Reserve 0 0 0%
Text Book & Student Material 0 0 0%
Activity Fund 0 0 0%
Bond and Interest #1 0 0 0% 0 0%
Bond and Interest #2 0 0 0% 0 0%
No-Fund Warrant 0 0 0% 0 0%
Special Assessment 0 0 0% 0 0%
Temporary Note 0 0 0% 0 0%
SUBTOTAL 0 0 0% 0 0%
Enrollment (FTE)* 129.6 117.8 -9% 130.0 10%
Amount per Pupil 0 0 0% 0 0%
Adult Education 0 0 0% 0 0%
Adult Supplemental Education 0 0 0% 0 0%
Tuition Reimbursement 0 0 0% 0 0%
Special Education Coop 0 0 0% 0 0%
TOTAL 0 0 0% 0 0%
NOTE: Gifts/Grants includes private grants and grants from nonfederal sources.
Amount per pupil excludes the following funds: Adult Education, Adult Supplemental Education, Special Education Coop
and Tuition Reimbursement.
* Enrollment (FTE) includes the current year enrollment on September 20, February 20, 4 yr old at-risk, and virtual.
It does not include non-funded preschool or full-day kindergarten not on an IEP.
0
0
0
0
0
1
1
1
1
1
1
2013-2014 2014-2015 2015-2016
0 0 0
Community Services Operations (3300)
10/9/2015 2:17 PM Sumexpen.xlsx Page 16 of 27
USD# 399
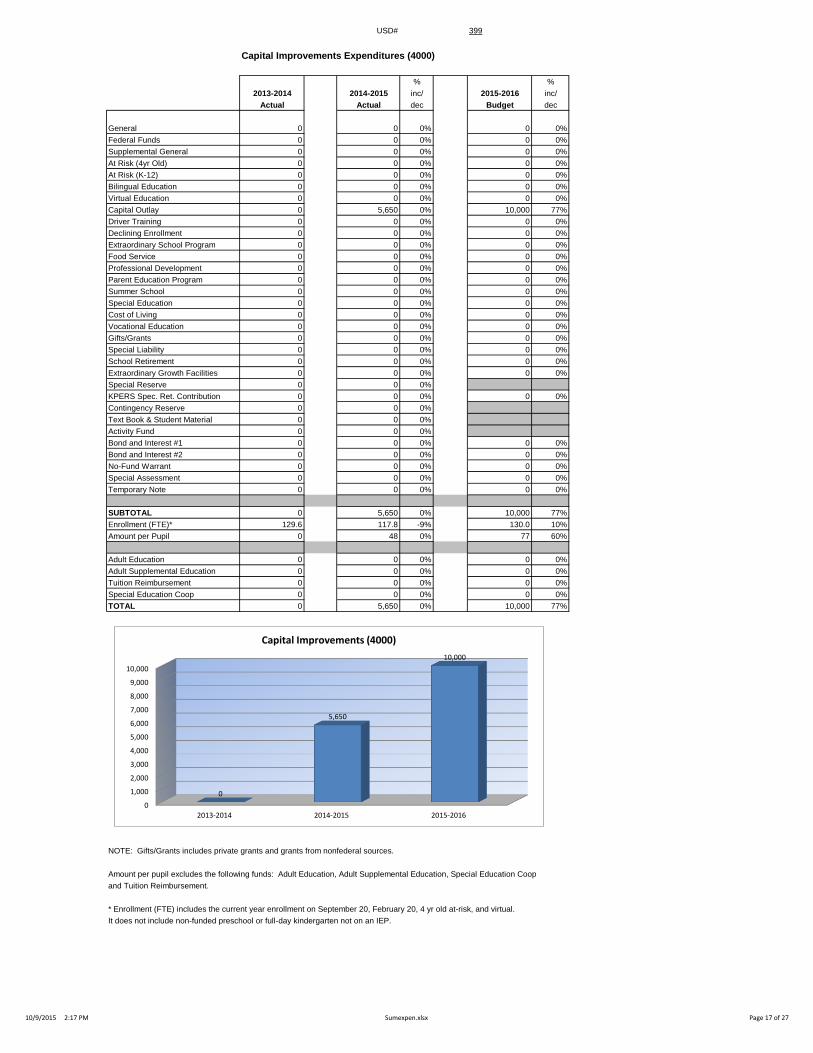
Capital Improvements Expenditures (4000)
% %
2013-2014 2014-2015 inc/ 2015-2016 inc/
Actual Actual dec Budget dec
General 0 0 0% 0 0%
Federal Funds 0 0 0% 0 0%
Supplemental General 0 0 0% 0 0%
At Risk (4yr Old) 0 0 0% 0 0%
At Risk (K-12) 0 0 0% 0 0%
Bilingual Education 0 0 0% 0 0%
Virtual Education 0 0 0% 0 0%
Capital Outlay 0 5,650 0% 10,000 77%
Driver Training 0 0 0% 0 0%
Declining Enrollment 0 0 0% 0 0%
Extraordinary School Program 0 0 0% 0 0%
Food Service 0 0 0% 0 0%
Professional Development 0 0 0% 0 0%
Parent Education Program 0 0 0% 0 0%
Summer School 0 0 0% 0 0%
Special Education 0 0 0% 0 0%
Cost of Living 0 0 0% 0 0%
Vocational Education 0 0 0% 0 0%
Gifts/Grants 0 0 0% 0 0%
Special Liability 0 0 0% 0 0%
School Retirement 0 0 0% 0 0%
Extraordinary Growth Facilities 0 0 0% 0 0%
Special Reserve 0 0 0%
KPERS Spec. Ret. Contribution 0 0 0% 0 0%
Contingency Reserve 0 0 0%
Text Book & Student Material 0 0 0%
Activity Fund 0 0 0%
Bond and Interest #1 0 0 0% 0 0%
Bond and Interest #2 0 0 0% 0 0%
No-Fund Warrant 0 0 0% 0 0%
Special Assessment 0 0 0% 0 0%
Temporary Note 0 0 0% 0 0%
SUBTOTAL 0 5,650 0% 10,000 77%
Enrollment (FTE)* 129.6 117.8 -9% 130.0 10%
Amount per Pupil 0 48 0% 77 60%
Adult Education 0 0 0% 0 0%
Adult Supplemental Education 0 0 0% 0 0%
Tuition Reimbursement 0 0 0% 0 0%
Special Education Coop 0 0 0% 0 0%
TOTAL 0 5,650 0% 10,000 77%
NOTE: Gifts/Grants includes private grants and grants from nonfederal sources.
Amount per pupil excludes the following funds: Adult Education, Adult Supplemental Education, Special Education Coop
and Tuition Reimbursement.
* Enrollment (FTE) includes the current year enrollment on September 20, February 20, 4 yr old at-risk, and virtual.
It does not include non-funded preschool or full-day kindergarten not on an IEP.
0
1,000
2,000
3,000
4,000
5,000
6,000
7,000
8,000
9,000
10,000
2013-2014 2014-2015 2015-2016
0
5,650
10,000
Capital Improvements (4000)
10/9/2015 2:17 PM Sumexpen.xlsx Page 17 of 27

USD# 399
Debt Services Expenditures (5100)
% %
2013-2014 2014-2015 inc/ 2015-2016 inc/
Actual Actual dec Budget dec
General 0 0 0% 0 0%
Federal Funds 0 0 0% 0 0%
Supplemental General 0 0 0% 0 0%
At Risk (4yr Old) 0 0 0% 0 0%
At Risk (K-12) 0 0 0% 0 0%
Bilingual Education 0 0 0% 0 0%
Virtual Education 0 0 0% 0 0%
Capital Outlay 0 0 0% 0 0%
Driver Training 0 0 0% 0 0%
Declining Enrollment 0 0 0% 0 0%
Extraordinary School Program 0 0 0% 0 0%
Food Service 0 0 0% 0 0%
Professional Development 0 0 0% 0 0%
Parent Education Program 0 0 0% 0 0%
Summer School 0 0 0% 0 0%
Special Education 0 0 0% 0 0%
Cost of Living 0 0 0% 0 0%
Vocational Education 0 0 0% 0 0%
Gifts/Grants 0 0 0% 0 0%
Special Liability 0 0 0% 0 0%
School Retirement 0 0 0% 0 0%
Extraordinary Growth Facilities 0 0 0% 0 0%
Special Reserve 0 0 0%
KPERS Spec. Ret. Contribution 0 0 0% 0 0%
Contingency Reserve 0 0 0%
Text Book & Student Material 0 0 0%
Activity Fund 0 0 0%
Bond and Interest #1 0 0 0% 0 0%
Bond and Interest #2 0 0 0% 0 0%
No-Fund Warrant 0 0 0% 0 0%
Special Assessment 0 0 0% 0 0%
Temporary Note 0 0 0% 0 0%
SUBTOTAL 0 0 0% 0 0%
Enrollment (FTE)* 129.6 117.8 -9% 130.0 10%
Amount per Pupil 0 0 0% 0 0%
Adult Education 0 0 0% 0 0%
Adult Supplemental Education 0 0 0% 0 0%
Tuition Reimbursement 0 0 0% 0 0%
Special Education Coop 0 0 0% 0 0%
TOTAL 0 0 0% 0 0%
NOTE: Gifts/Grants includes private grants and grants from nonfederal sources.
Amount per pupil excludes the following funds: Adult Education, Adult Supplemental Education, Special Education Coop
and Tuition Reimbursement.
* Enrollment (FTE) includes the current year enrollment on September 20, February 20, 4 yr old at-risk, and virtual.
It does not include non-funded preschool or full-day kindergarten not on an IEP.
0
0
0
0
0
1
1
1
1
1
1
2013-2014 2014-2015 2015-2016
0 0 0
Debt Services (5100)
10/9/2015 2:17 PM Sumexpen.xlsx Page 18 of 27

USD# 399
Transfers (5200)
% %
2013-2014 2014-2015 inc/ 2015-2016 inc/
Actual Actual dec Budget dec
General 283,145 261,403 -8% 421,244 61%
Federal Funds 0 0 0% 0 0%
Supplemental General 143,912 159,338 11% 158,200 -1%
At Risk (4yr Old) 0 0 0% 0 0%
At Risk (K-12) 0 0 0% 0 0%
Bilingual Education 0 0 0% 0 0%
Virtual Education 0 0 0% 0 0%
Capital Outlay
Driver Training 0 0 0% 0 0%
Declining Enrollment 0 0 0% 0 0%
Extraordinary School Program 0 0 0% 0 0%
Food Service 0 0 0% 0 0%
Professional Development 0 0 0% 0 0%
Parent Education Program 0 0 0% 0 0%
Summer School 0 0 0% 0 0%
Special Education 0 0 0% XXXXXXXX 0%
Cost of Living 0 0 0% 0 0%
Vocational Education 0 0 0% 0 0%
Gifts/Grants 0 0 0% 0 0%
Special Liability 0 0 0% 0 0%
School Retirement 0 0 0% 0 0%
Extraordinary Growth Facilities 0 0 0% 0 0%
Special Reserve 0 0 0%
KPERS Spec. Ret. Contribution 0 0 0% 0 0%
Contingency Reserve 0 0 0% 0 0%
Text Book & Student Material 0 0 0% 0 0%
Activity Fund 0 0 0% 0 0%
Bond and Interest #1 0 0 0% 0 0%
Bond and Interest #2 0 0 0% 0 0%
No-Fund Warrant 0 0 0% 0 0%
Special Assessment 0 0 0% 0 0%
Temporary Note 0 0 0% 0 0%
SUBTOTAL 427,057 420,741 -1% 579,444 38%
Enrollment (FTE)* 129.6 117.8 -9% 130.0 10%
Amount per Pupil 3,295 3,572 8% 4,457 25%
Adult Education 0 0 0% 0 0%
Adult Supplemental Education 0 0 0% 0 0%
Tuition Reimbursement 0 0 0% 0 0%
Special Education Coop 0 0 0% 0 0%
TOTAL 427,057 420,741 -1% 579,444 38%
NOTE: Gifts/Grants includes private grants and grants from nonfederal sources.
Amount per pupil excludes the following funds: Adult Education, Adult Supplemental Education, Special Education Coop
and Tuition Reimbursement.
* Enrollment (FTE) includes the current year enrollment on September 20, February 20, 4 yr old at-risk, and virtual.
It does not include non-funded preschool or full-day kindergarten not on an IEP.
0
100,000
200,000
300,000
400,000
500,000
600,000
2013-2014 2014-2015 2015-2016
427,057 420,741
579,444
Transfers (5200)
10/9/2015 2:17 PM Sumexpen.xlsx Page 19 of 27

USD# 399
Miscellaneous Information
Unencumbered Cash Balance by Fund
July 1, 2013 July 1, 2014 July 1, 2015
General 0 0 0
Federal Funds 0 0 0
Supplemental General 12,731 73,130 51,557
At Risk (4yr Old) 0 0 0
At Risk (K-12) 0 0 0
Bilingual Education 0 0 0
Virtual Education 0 0 0
Capital Outlay 564,158 659,393 714,910
Driver Training 0 0 0
Declining Enrollment 0 0 0
Extraordinary School Program 0 0 0
Food Service 25,694 7,323 15,182
Professional Development 0 0 0
Parent Education Program 0 865 865
Summer School 0 0 0
Special Education 35,176 11,872 23,083
Cost of Living 0 0 0
Vocational Education 0 0 0
Gifts/Grants 16,237 15,297 33,834
Special Liability 0 0 0
School Retirement 0 0 0
Extraordinary Growth Facilities 0 0 0
Special Reserve 0 0 0
KPERS Spec. Ret. Contribution 0 0 0
Contingency Reserve 76,314 76,314 76,314
Text Book & Student Material 0 0 0
Activity Fund 46 1,826 98
Bond and Interest #1 0 0 0
Bond and Interest #2 0 0 0
No Fund Warrant 0 0 0
Special Assessment 0 0 0
Temporary Note 0 0 0
SUBTOTAL 730,356 846,020 915,843
Enrollment (FTE)* 129.6 117.8 130.0
Amount per Pupil 5,635 7,182 7,045
Adult Education 0 0 0
Adult Supplemental Education 0 0 0
Tuition Reimbursement 0 0 0
Special Education Coop 0 0 0
TOTAL 730,356 846,020 915,843
NOTE: Gifts/Grants includes private grants and grants from nonfederal sources.
Amount per pupil excludes the following funds: Adult Education, Adult Supplemental Education, Special Education Coop
and Tuition Reimbursement.
* Enrollment (FTE) includes the current year enrollment on September 20, February 20, 4 yr old at-risk, and virtual.
It does not include non-funded preschool or full-day kindergarten not on an IEP.
0
100,000
200,000
300,000
400,000
500,000
600,000
700,000
800,000
900,000
1,000,000
July 1, 2013 July 1, 2014 July 1, 2015
730,356
846,020 915,843
Unencumbered Cash Balances by Fund
10/9/2015 2:17 PM Sumexpen.xlsx Page 20 of 27

USD# 399
Reserve Funds
Unencumbered Cash Balance
July 1, 2013 July 1, 2014 July 1, 2015
Special Reserve 0 0 0
TOTAL OTHER 0 0 0
Amount per Pupil $0 $0 $0
*School districts are authorized by law to self insure rather than purchase insurance for the following categories: Worker's Comp,
Health Insurance, Life Insurance, Property and Casualty (Risk Management) and Disability Income Insurance. Monies are placed
in the Self Insured Fund to pay for claims which may arise from the categories listed above.
0
0
0
0
0
1
1
1
1
1
1
July 1, 2013 July 1, 2014 July 1, 2015
0 0 0
Unencumbered Cash Balances by Fund (Reserve Funds Only)
10/9/2015 2:17 PM Sumexpen.xlsx Page 21 of 27
USD# 399
2011-2012 2012-2013 % 2013-2014 % 2014-2015 % 2015-2016 %
Actual Actual inc/ Actual inc/ Actual inc/ Budget inc/
dec dec dec dec
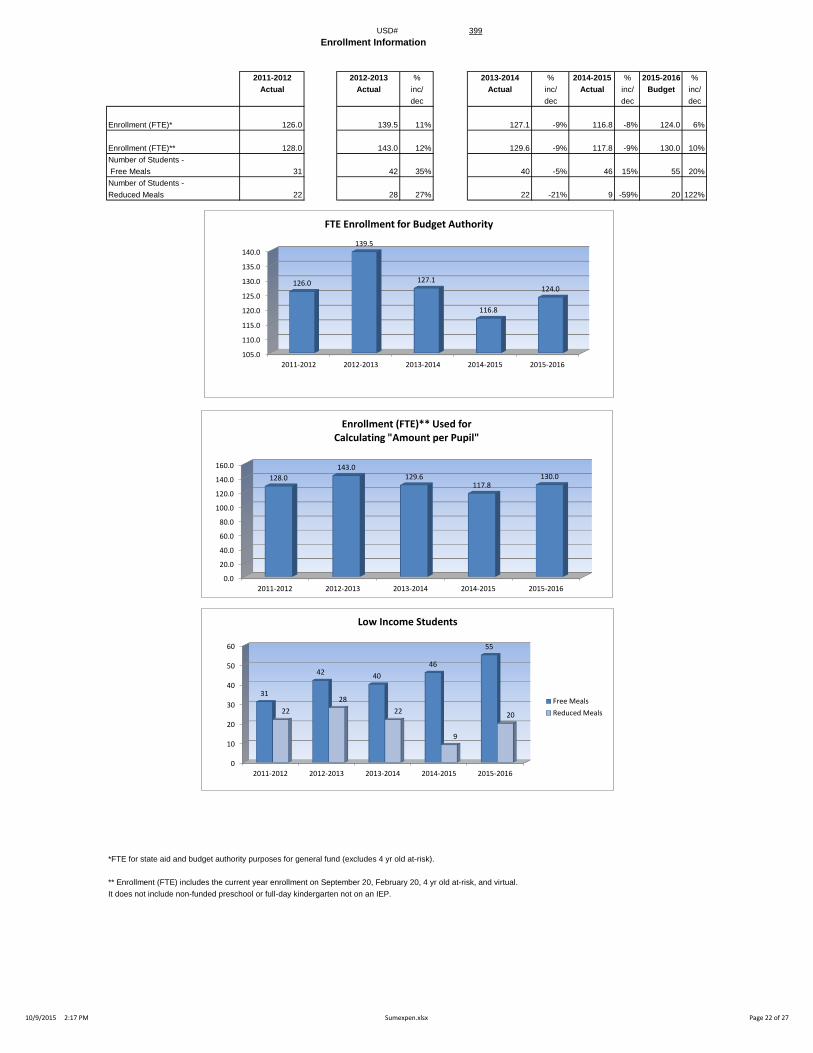
Enrollment (FTE)* 126.0 139.5 11% 127.1 -9% 116.8 -8% 124.0 6%
Enrollment (FTE)** 128.0 143.0 12% 129.6 -9% 117.8 -9% 130.0 10%
Number of Students -
Free Meals 31 42 35% 40 -5% 46 15% 55 20%
Number of Students -
Reduced Meals 22 28 27% 22 -21% 9 -59% 20 122%
*FTE for state aid and budget authority purposes for general fund (excludes 4 yr old at-risk).
** Enrollment (FTE) includes the current year enrollment on September 20, February 20, 4 yr old at-risk, and virtual.
It does not include non-funded preschool or full-day kindergarten not on an IEP.
Enrollment Information
0.0
20.0
40.0
60.0
80.0
100.0
120.0
140.0
160.0
2011-2012 2012-2013 2013-2014 2014-2015 2015-2016
128.0
143.0 129.6
117.8 130.0
Enrollment (FTE)** Used for Calculating "Amount per Pupil"
0
10
20
30
40
50
60
2011-2012 2012-2013 2013-2014 2014-2015 2015-2016
31
42 40
46
55
22
28
22
9
20
Low Income Students
Free Meals
Reduced Meals
105.0
110.0
115.0
120.0
125.0
130.0
135.0
140.0
2011-2012 2012-2013 2013-2014 2014-2015 2015-2016
126.0
139.5
127.1
116.8
124.0
FTE Enrollment for Budget Authority
10/9/2015 2:17 PM Sumexpen.xlsx Page 22 of 27

USD# 399
Miscellaneous Information
Mill Rates by Fund
2013-2014 2014-2015 2015-2016
Actual Actual Budget
General 20.000 20.000 20.000
Supplemental General 15.846 13.061 16.649
Adult Education 0.000 0.000 0.000
Capital Outlay 8.000 7.353 8.000
Declining Enrollment 0.000 0.000 0.000
Cost of Living 0.000 0.000 0.000
Special Liability 0.000 0.000 0.000
School Retirement 0.000 0.000 0.000
Extraordinary Growth Facilities 0.000 0.000 0.000
Bond and Interest #1 0.000 0.000 0.000
Bond and Interest #2 0.000 0.000 0.000
No Fund Warrant 0.000 0.000 0.000
Special Assessment 0.000 0.000 0.000
Temporary Note 0.000 0.000 0.000
TOTAL USD 43.846 40.414 44.649
Historical Museum 0.000 0.000 0.000
Public Library Board 0.000 0.000 0.000
Public Library Brd & Emp Benf 0.000 0.000 0.000
Recreation Commission 0.000 0.000 0.000
Rec Comm Employee Bnfts 0.000 0.000 0.000
TOTAL OTHER 0.000 0.000 0.000
0.000
10.000
20.000
30.000
40.000
50.000
60.000
70.000
80.000
2013-2014 2014-2015 2015-2016
43.846 40.414
44.649
Total USD Mill Rates
General 45%
Supplemental General 37%
Capital Outlay 18%
2015-16 Miscellaneous Information Mill Rates by Fund (Total USD)
General
Supplemental General
Adult Education
Capital Outlay
Special Liability
School Retirement
Declining Enrollment
Cost of Living
Bond and Interest #1
Bond and Interest #2
Extraordinary Growth Facilities
No Fund Warrant
Special Assessment
Temporary Note
10/9/2015 2:17 PM Sumexpen.xlsx Page 23 of 27
USD# 399
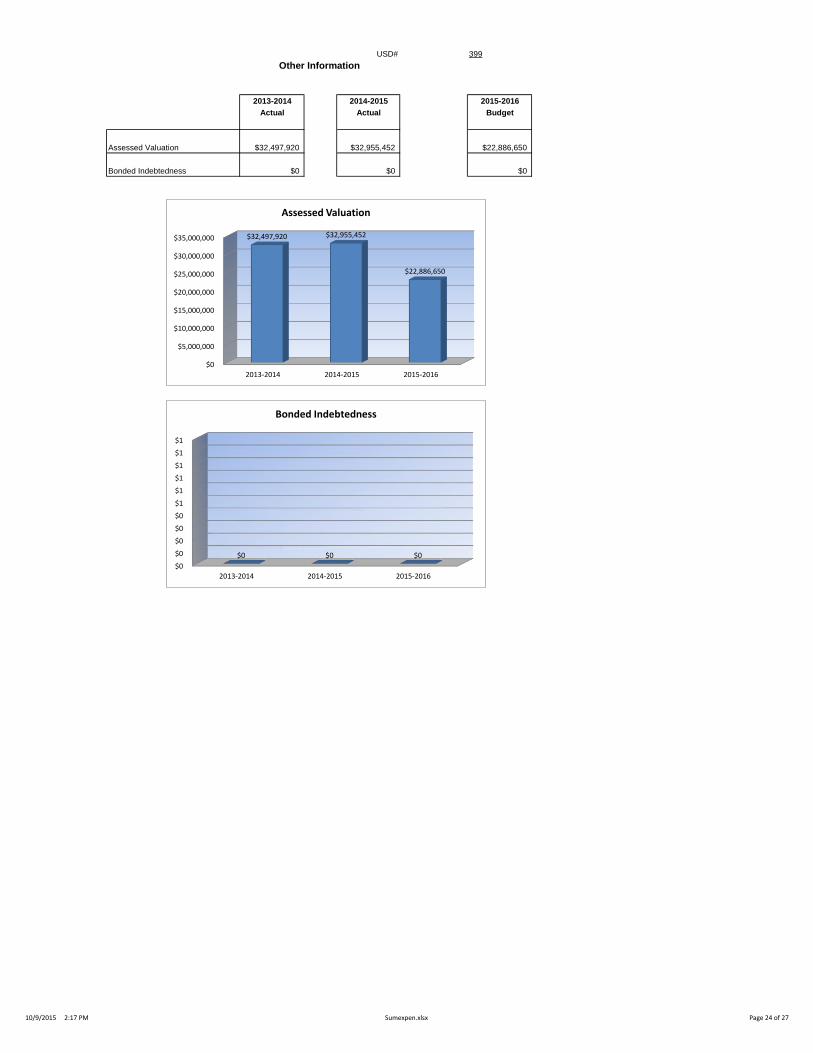
Other Information
2013-2014 2014-2015 2015-2016
Actual Actual Budget
Assessed Valuation $32,497,920 $32,955,452 $22,886,650
Bonded Indebtedness $0 $0 $0
$0
$5,000,000
$10,000,000
$15,000,000
$20,000,000
$25,000,000
$30,000,000
$35,000,000
2013-2014 2014-2015 2015-2016
$32,497,920 $32,955,452
$22,886,650
Assessed Valuation
$0
$0
$0
$0
$0
$1
$1
$1
$1
$1
$1
2013-2014 2014-2015 2015-2016
$0 $0 $0
Bonded Indebtedness
10/9/2015 2:17 PM Sumexpen.xlsx Page 24 of 27

USD 399
2015-16 Estimated Sources of Revenue--2015-16 Estimated
Amount July 1, 2015 State Federal Local July 1, 2016
Fund Budgeted Cash Balance Interest Transfers Other Cash Balance
General 1,414,436 0 1,413,836 0 600 0 0 0
Supplemental General 446,473 51,557 0 394,916 XXXXXXXX
Adult Education 0 0 0 0 xxxxxxxxxxxx 0 0 0
At Risk (4yr Old) 13,000 0 0 xxxxxxxxxxxx 13,000 0 0
Adult Supplemental Education 0 0 xxxxxxxxxxxx 0 0 0
At Risk (K-12) 82,000 0 0 xxxxxxxxxxxx 82,000 0 0
Bilingual Education 3,500 0 3,500 xxxxxxxxxxxx 0 0 0
Virtual Education 0 0 0 0 0 0
Capital Outlay 913,840 714,910 0 1,200 0 197,730 0
Driver Training 1,656 0 456 0 xxxxxxxxxxxx 1,200 0 0
Declining Enrollment 0 0 0 0 XXXXXXXX
Extraordinary School Program 0 0 0 xxxxxxxxxxxx 0 0 0
Food Service 144,847 15,182 615 35,614 xxxxxxxxxxxx 56,000 37,436 0
Professional Development 0 0 0 xxxxxxxxxxxx 0 0 0
Parent Education Program 0 865 0 0 xxxxxxxxxxxx 0 0 865
Summer School 0 0 0 xxxxxxxxxxxx 0 0 0
Special Education 228,185 23,083 0 0 xxxxxxxxxxxx 195,102 10,000 0
Vocational Education 98,000 0 0 0 xxxxxxxxxxxx 93,000 5,000 0
Special Liability Expense Fund 0 0 0 0 0 0
Special Reserve Fund 0 XXXXXXXX
Gifts and Grants 43,834 33,834 10,000 0
Textbook & Student Materials Revolving 0 XXXXXXXX
School Retirement 0 0 xxxxxxxxxxxx 0 0
Extraordinary Growth Facilities 0 0 0 0 XXXXXXXXX
KPERS Special Retirement Contribution 139,142 0 139,142 XXXXXXXXX
Contingency Reserve 76,314 XXXXXXXXX
Activity Funds 98 XXXXXXXXX
Tuition Reimbursement 0 0 0 0 0
Bond and Interest #1 0 0 0 0 0 0 0
Bond and Interest #2 0 0 0 0 0 0 0
No Fund Warrant 0 0 0 0
Special Assessment 0 0 0 0
Temporary Note 0 0 xxxxxxxxxxxx 0 0
Coop Special Education 0 0 0 0 0 0 0
Federal Funds 31,902 0 xxxxxxxxxxx 31,902 xxxxxxxxxxxx xxxxxxxxxxxx xxxxxxxxxxx 0
Cost of Living 0 0 xxxxxxxxxxx xxxxxxxxxxx xxxxxxxxxxxx 0 0 XXXXXXXXX
SUBTOTAL 3,560,815 915,843 1,414,907 71,016 1,800 579,444 655,082 865
Less Transfers 579,444
TOTAL Budget Expenditures $2,981,371
2013-2014 2014-2015 2015-2016
State Revenues 852,761 1,389,918 1,414,907
Federal Revenues 70,338 60,610 71,016
Local Revenues* 1,589,001 832,886 656,882
Total Revenues 2,512,100 2,283,414 2,142,805
Revenues Per Pupil 19,383 19,384 16,483
*Excludes "Transfers" to avoid duplication of revenue.
Sources of Revenue and Proposed Budget for 2015-16
Sources of Revenue - - State, Federal, Local
Effective July 1, 2014 (2014-15 school year) KSA 72-6431 states proceeds from the
Ad Valorem taxes levied for the General Fund shall be remitted to the
State Treasurer. Such remittance shall be redistributed as state general aid.

USD 399 - Paradise - Summary
0
200,000
400,000
600,000
800,000
1,000,000
1,200,000
1,400,000
1,600,000
Summary of Total Expenditures by Function (All Funds)
0100,000200,000300,000400,000500,000600,000700,000800,000900,000
General and Supplemental General Fund Expenditures by Function
1,240,000
1,260,000
1,280,000
1,300,000
1,320,000
1,340,000
1,360,000
1,380,000
1,400,000
1,420,000
1,440,000
1,460,000
2013-2014 2014-2015 2015-2016
Instruction Expenditures
105.0
110.0
115.0
120.0
125.0
130.0
135.0
140.0
2011-2012 2012-2013 2013-2014 2014-2015 2015-2016
FTE Enrollment for Budget Authority
0.0002.0004.0006.0008.000
10.00012.00014.00016.00018.00020.000
2014-2015 Mill Levies by Fund
010,00020,00030,00040,00050,00060,00070,00080,00090,000
100,000
Average Salary
0.000
10.000
20.000
30.000
40.000
50.000
60.000
70.000
80.000
2013-2014 2014-2015 2015-2016
Total USD Mill Rates
0
5,000
10,000
15,000
20,000
25,000
Amount Per Pupil By Function (All Funds)

Intentionally left blank