Embed Size (px)
Citation preview

An integrated catchment and coastal
forecasting system for the Great Barrier Reef
Brassington, Tuteja, Colberg, Sandery, Sakov, Freeman, Sakova, Allen, Laugesen,
Brinkman, Tonin, Beaman, Wilkin
ACOMO, Canberra, Oct 2016
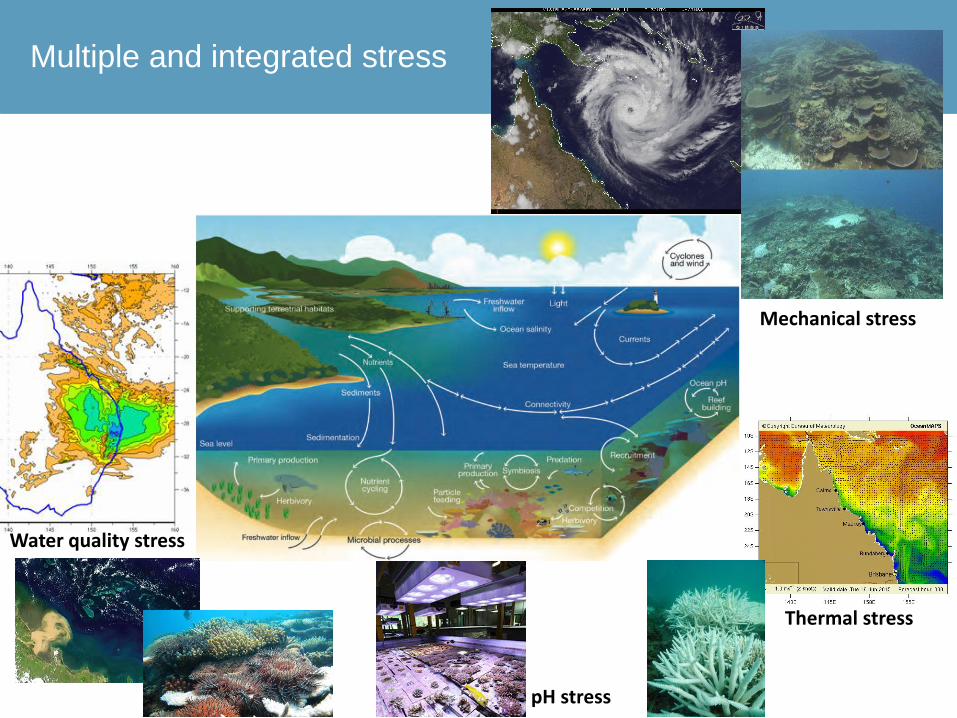
Mechanical stress
Thermal stress
Water quality stress
pH stress
Multiple and integrated stress
500m
4km
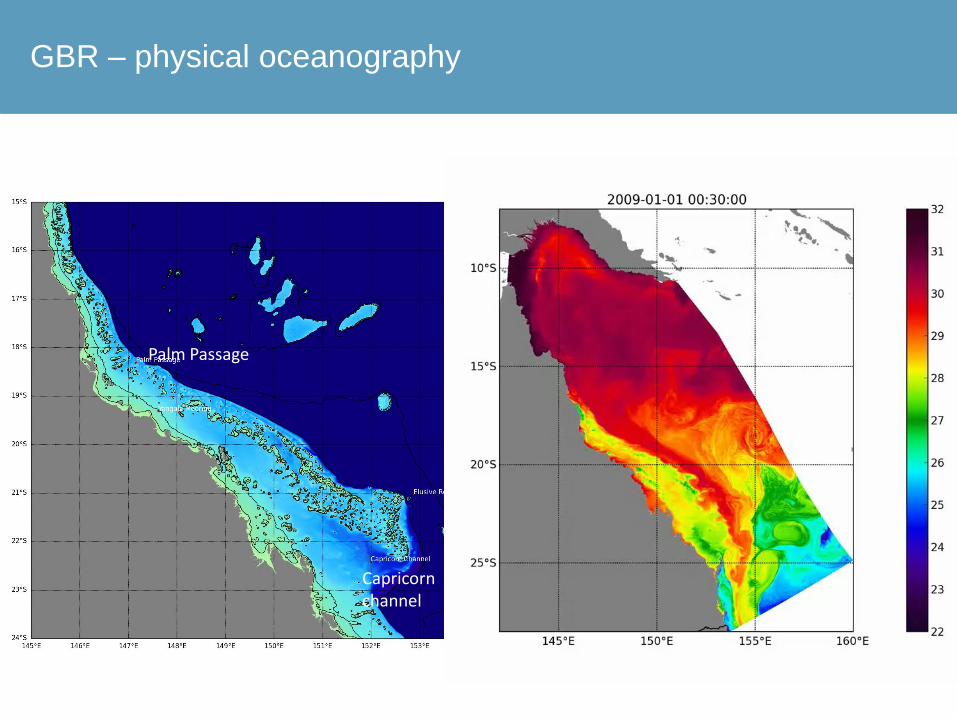
Swaines
Palm Passage
Elusive Reef
GBR – physical oceanography
Capricorn channel

Coastal ocean – modelling (general circulation)
• Inside the reef matrix complex circulation • interaction of currents from tide • Winds, pressure • continental shelf waves, River discharge
• Atmospheric variability • SE Trades in APR-NOV flow reversal • SW-Monsoon, DEC-MAR
• Ocean current variability • SEC strong in winter/ spring • EAC weak in autumn/ winter
• Main Currents SEC, EAC, NQC (Papua Gyre) • Key outflow from GBR area • North: via Papua Gyre • South: EAC
• Shelf: Narrow in North 40-60lm • Reefs cover 90% of the shelf leaving only little channels of oceanic
and tidal flows to pass
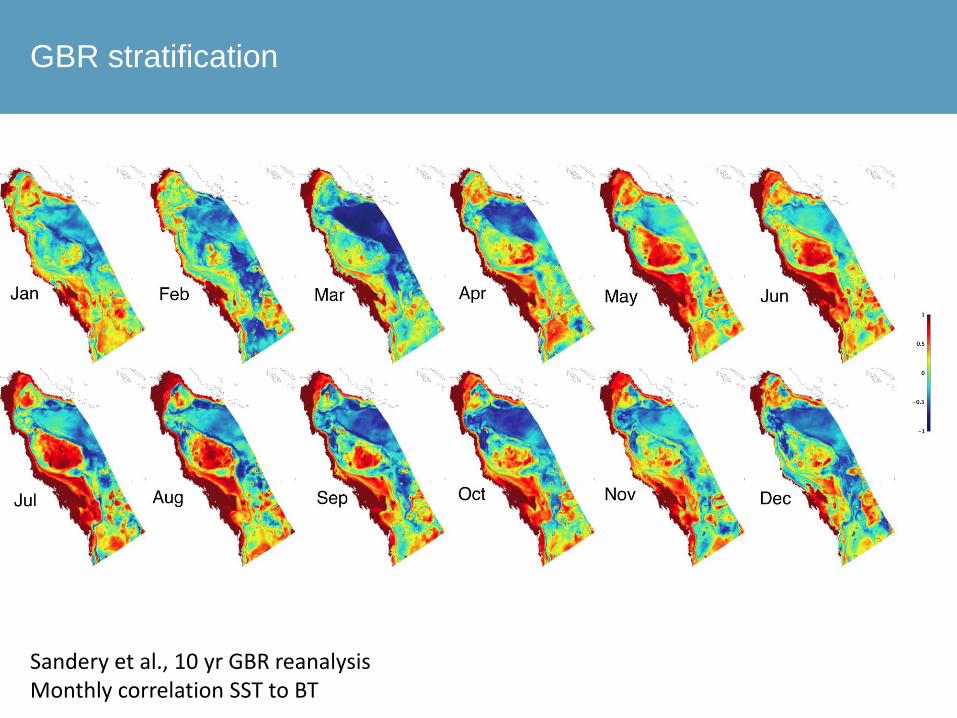
GBR stratification
Sandery et al., 10 yr GBR reanalysis Monthly correlation SST to BT
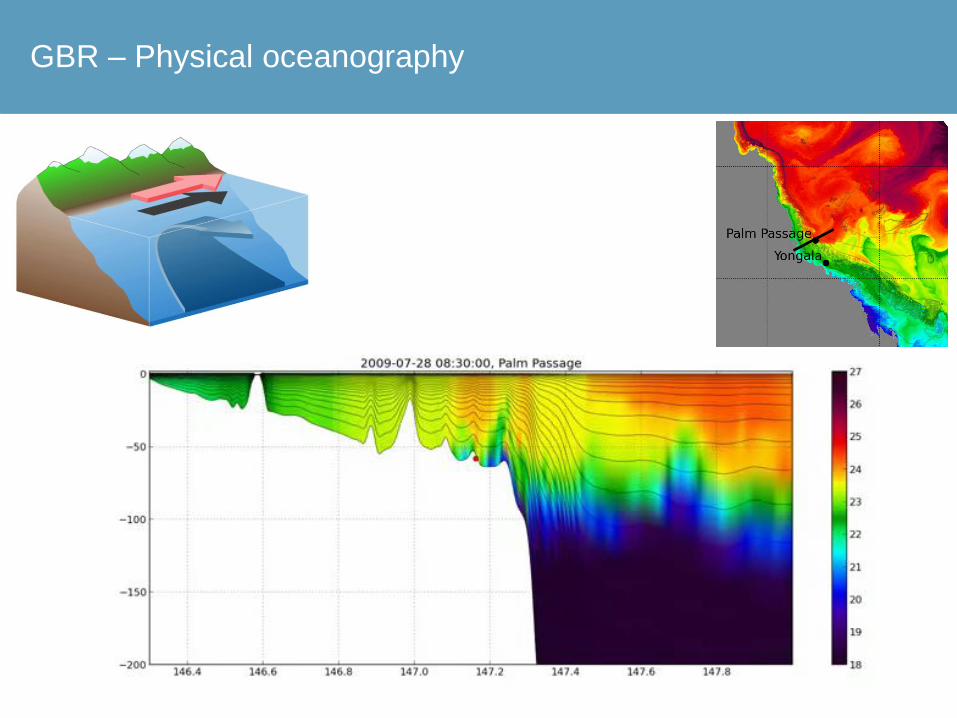
GBR – Physical oceanography

Coastal ocean – river plumes

Observation system – GOOS (real-time)
Observations• Along track altimetry from
RADS database
• Infrared and Microwave SST from Pathfinder, AVHRR, AMSR-E, AMSR2, WindSat
• In-situ temperature and salinity from Argo
• Super-observations
January 2008 super-observation composite
January composite
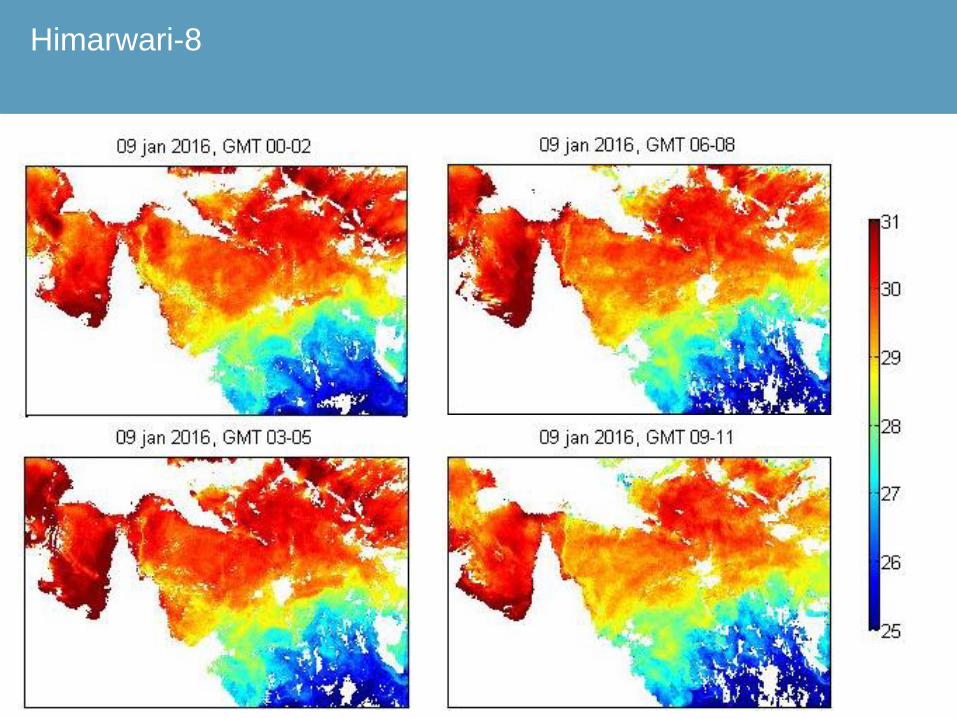
Himarwari-8
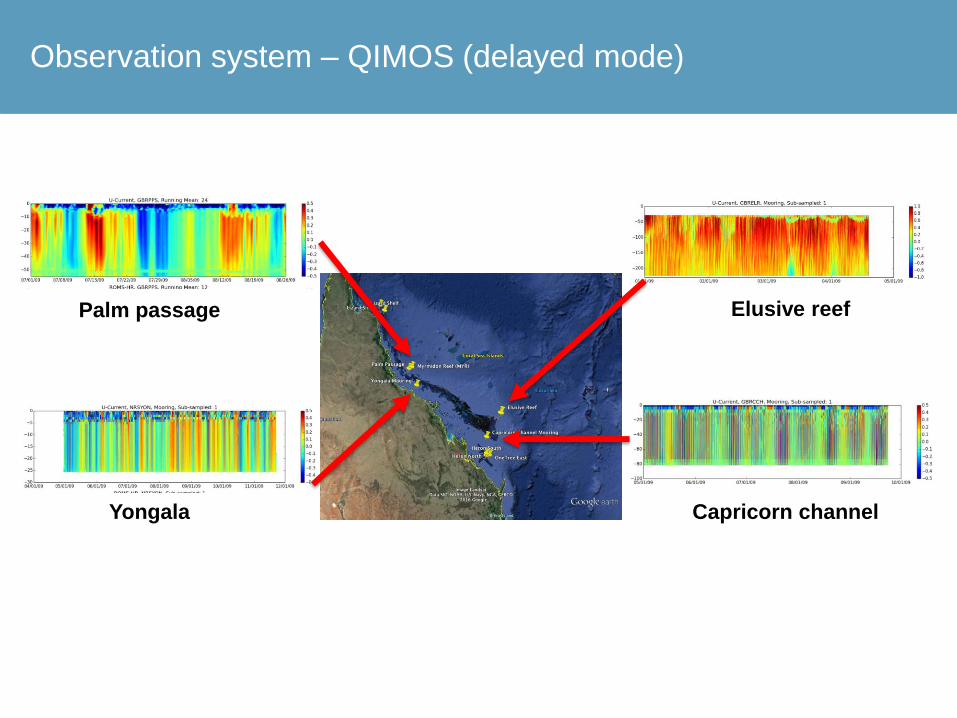
Observation system – QIMOS (delayed mode)
Yongala
Palm passage
Capricorn channel
Elusive reef
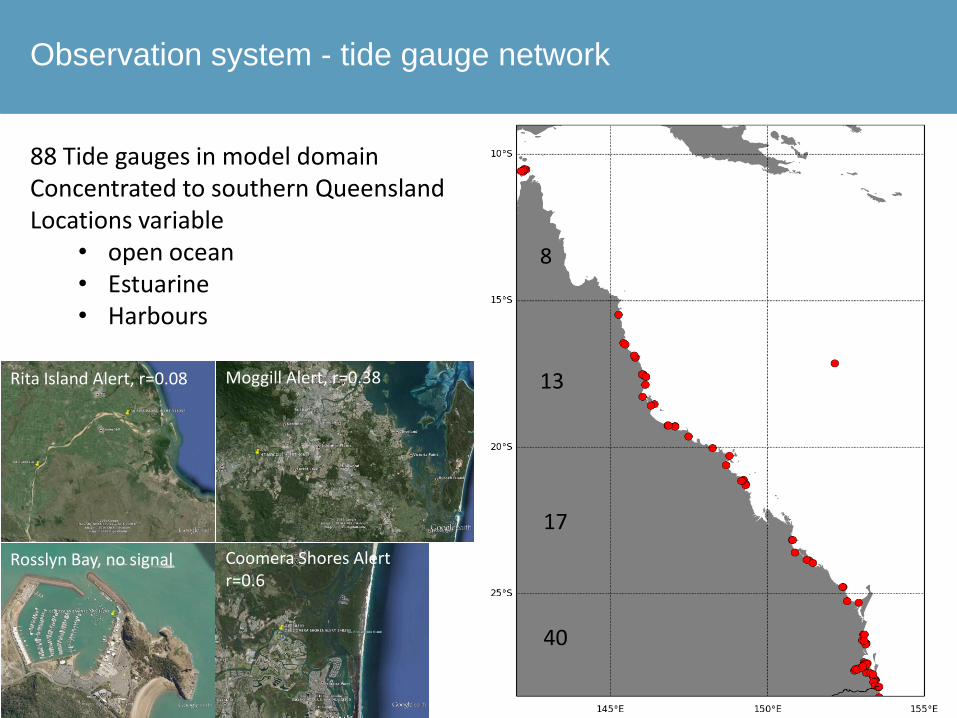
Observation system - tide gauge network
40
17
13
8
Moggill Alert, r=0.38 Rita Island Alert, r=0.08
Coomera Shores Alert r=0.6
Rosslyn Bay, no signal
88 Tide gauges in model domain Concentrated to southern Queensland Locations variable
• open ocean • Estuarine • Harbours

Observation system - catchment monitoring
Great Barrier Reef Catchment Loads Monitoring Program (Australian and Queensland Govt.)
eReefs catchment forecasts will use near real time rainfall and water level stations
25 eReefs catchments ~ 25 water quality monitoring locations
across the Reef catchments
Catchment sizes • Burdekin 129,700 km2 (~Pennsylvania) • Fitzroy, 142,665 km2 (~New York)

Coastal ocean prediction system – design choices
Operational forecasting – A Foundation physical system • Physical ocean – feasible/mature (apply methodologies from BLUElink) • Adoption of ROMS (non-trivial) • Boundary forced tides, Sigma-coordinate, Nested boundary • Catchment forecast – quantity and quality • BGC – observing system and modelling viewed as immature • River plumes modelled by passive tracers/Lagrange particles • Ensemble OI and Ensemble KF • Ensemble forecasts (perturbed atmosphere/perturbed river)
Scenario Model – A research-frontier system BGC-Sedimentation
• Physical ocean - Nested 4km/1km SHOC • Catchment forecast – quantity and quality • Sediment transport model (uncoupled) • Water quality and basal ecology model (uncoupled) • Data assimilation used offline for parameter estimation • Wave model used as a forcing term for particle re-suspension

Mechanical stress
Thermal stress
Water quality stress
pH stress
Multiple and integrated stress
500m
4km
SST
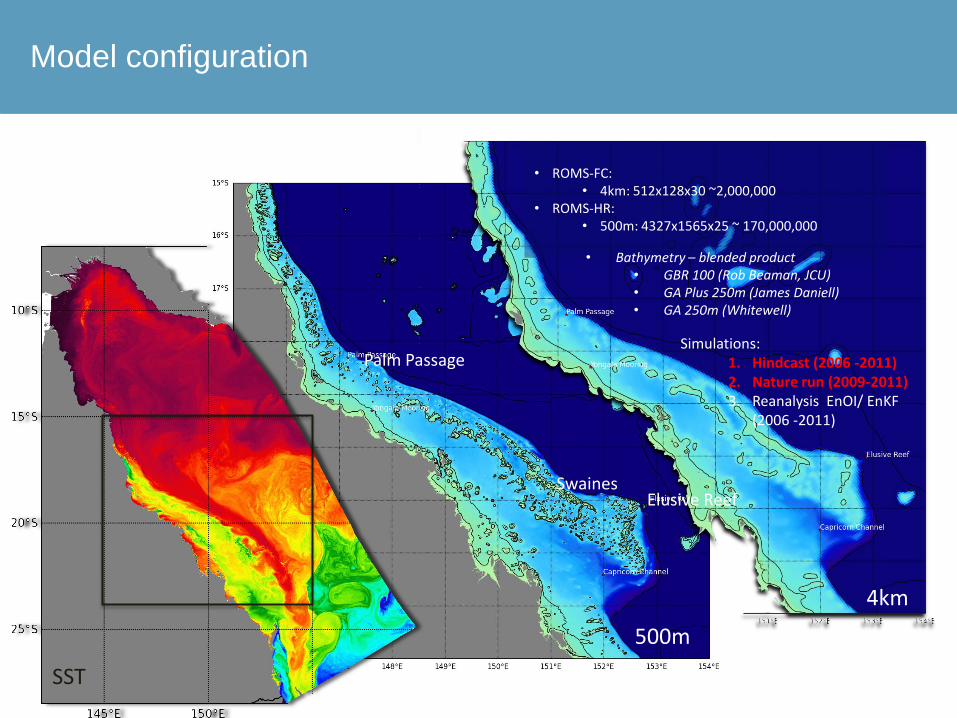
• ROMS-FC:
• 4km: 512x128x30 ~2,000,000 • ROMS-HR:
• 500m: 4327x1565x25 ~ 170,000,000
Simulations: 1. Hindcast (2006 -2011) 2. Nature run (2009-2011) 3. Reanalysis EnOI/ EnKF
(2006 -2011)
Swaines
Palm Passage
Elusive Reef
• Bathymetry – blended product • GBR 100 (Rob Beaman, JCU) • GA Plus 250m (James Daniell) • GA 250m (Whitewell)
Model configuration

ROMS-FC Yellow: Catchment locations Red: River mouth locations
Explicit modelling of estuaries (1) Aim to preserve river volume Balance between model stability and (1)
River channels

SALINITY<0
SALINITY>0
ROMS 3rd-order advection – non monotonic

3rd-order upstream advection + limiters

ROMS-FC
ROMS-HR
Palm passage temperature section: JUL-AUG 2009
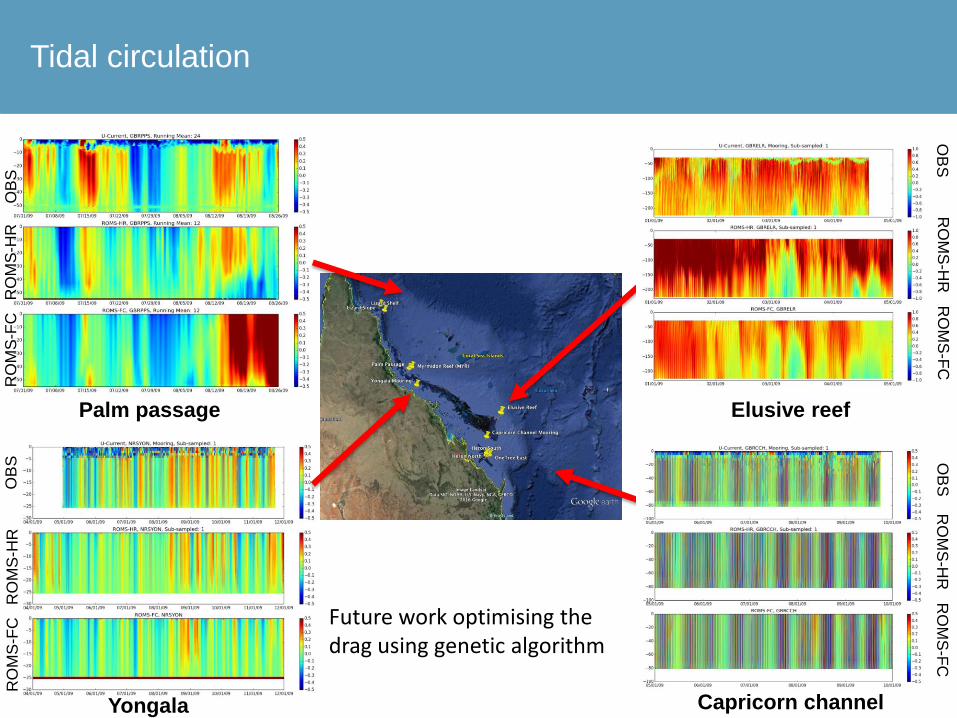
Tidal circulation
Yongala
Palm passage
Capricorn channel
Elusive reef
OB
S
OB
S
RO
MS
-HR
O
BS
O
BS
R
OM
S-H
R
RO
MS
-FC
R
OM
S-H
R
RO
MS
-FC
RO
MS
-FC
R
OM
S-H
R
RO
MS
-FC
Future work optimising the drag using genetic algorithm
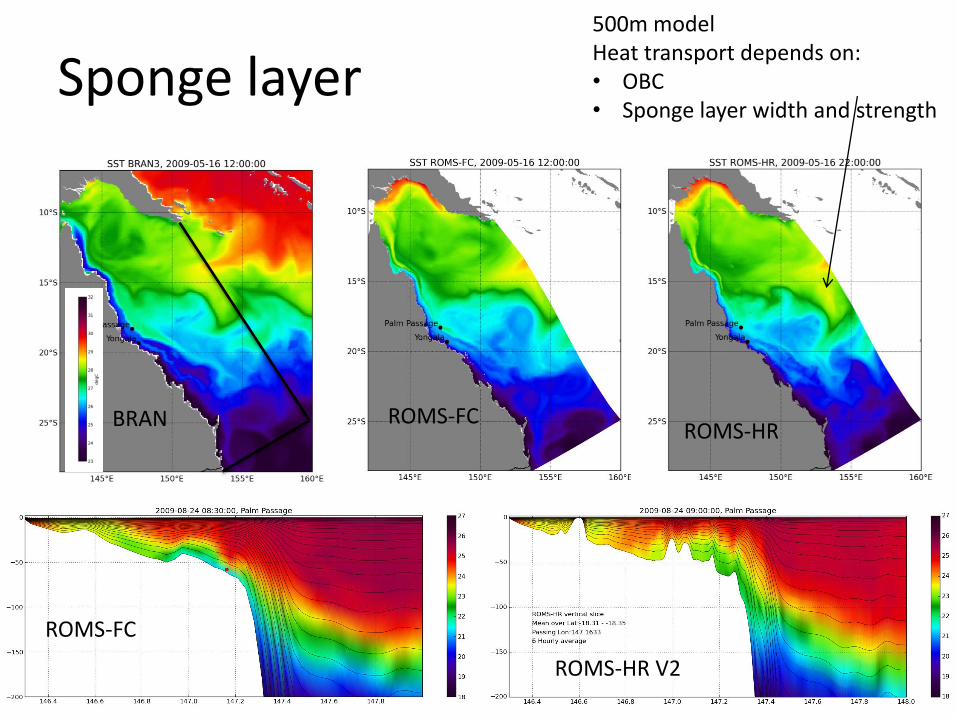
ROMS-FC ROMS-HR BRAN ROMS-HR
ROMS-FC
ROMS-HR V2
Sponge layer 500m model Heat transport depends on: • OBC • Sponge layer width and strength

PHYSICAL OCEANOGRAPHY – first system • Physical ocean – feasible/mature (apply methodologies from BLUElink) • Adoption of ROMS (non-trivial decision) • BGC – immature/R&D challenge (CSIRO making good progress) • River nutrients modelled by passive tracers/Lagrange particles
OBSERVING SYSTEM
• Real-time observations (deep water) - feasible • Lagoon observations – limited (R/T) require enhancement • Predictability transition (forced shallow chaotic shelf break)
DATA ASSIMILATION/ENSEMBLE FORECASTING
• Ensemble KF vs Ensemble OI (not exploiting ROMS adjoint capability) • Sample atmospheric forecast uncertainty • Sample river discharge uncertainty
FORCING SYSTEM
• BRAN/OceanMAPS + TIDES • ACCESS-R + Ensemble perturbations • RIVER DISCHARGE (VOLUME + LOADS)
Coastal ocean prediction system – design decisions

Data assimilation (benchmark) – EnOI/FGAT Data Assimilation
• Anomalies are 255 member ensemble of centred 3 day minus 30 day running means from hindcast
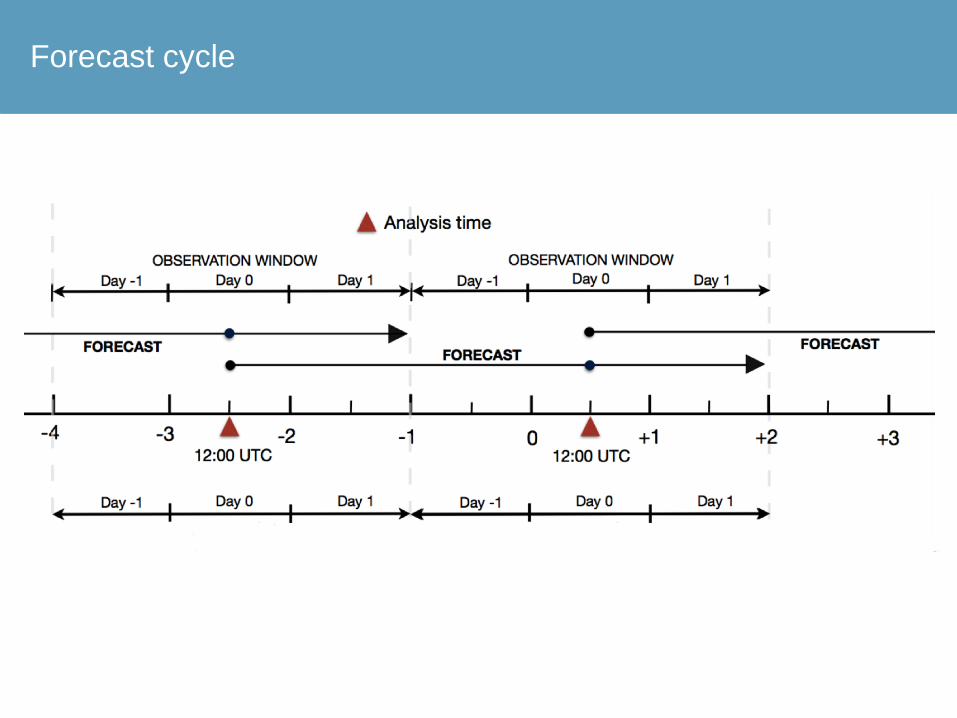
Forecast cycle
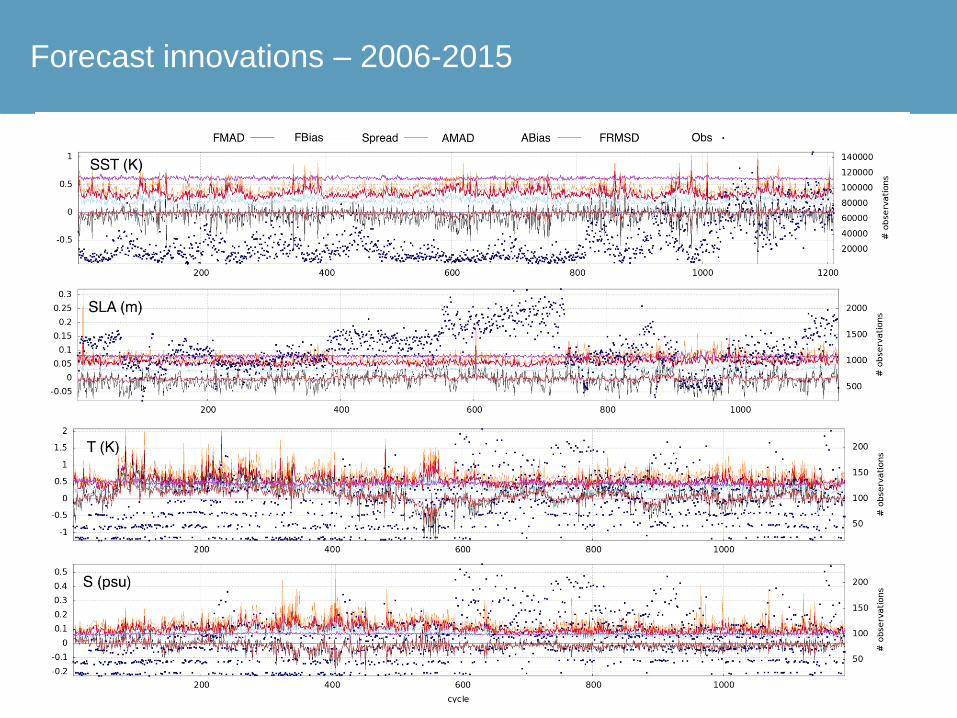
Forecast innovations – 2006-2015
Forecast innovation errors 2006-2015
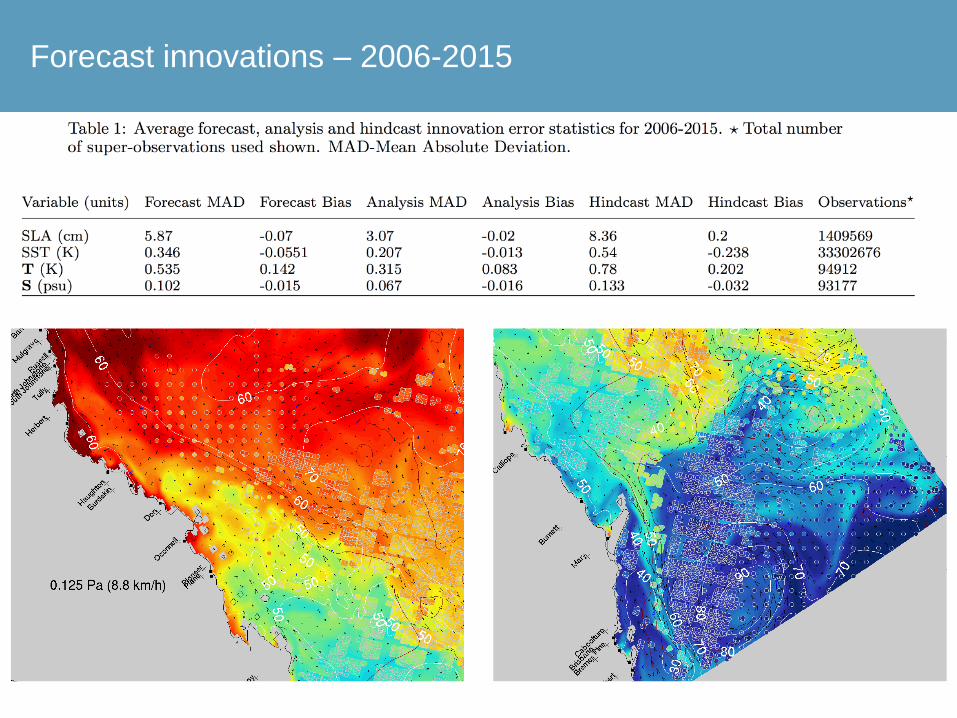
Forecast innovations – 2006-2015 Summary - 10 years of forecast error

Coastal ocean – reanalysis
IMOS ABOM GHRSST AVHRR L3S night time analysis
Daily mean from 3-day forecast with overlay of unassimilated super observations
21 May 2009

Coastal ocean – reanalysis
IMOS SRS ocean colour centred 3 day composite image from Aqua
satellite
Daily mean from 3-day forecast with overlay of unassimilated super observations

3 June 2006 4 April 2009
AVHRR AVHRR
ROMS
MODIS
ROMS
MODISMonthly mean sea surface temperature
3 June 2006 4 April 2009
AVHRR AVHRR
ROMS
MODIS
ROMS
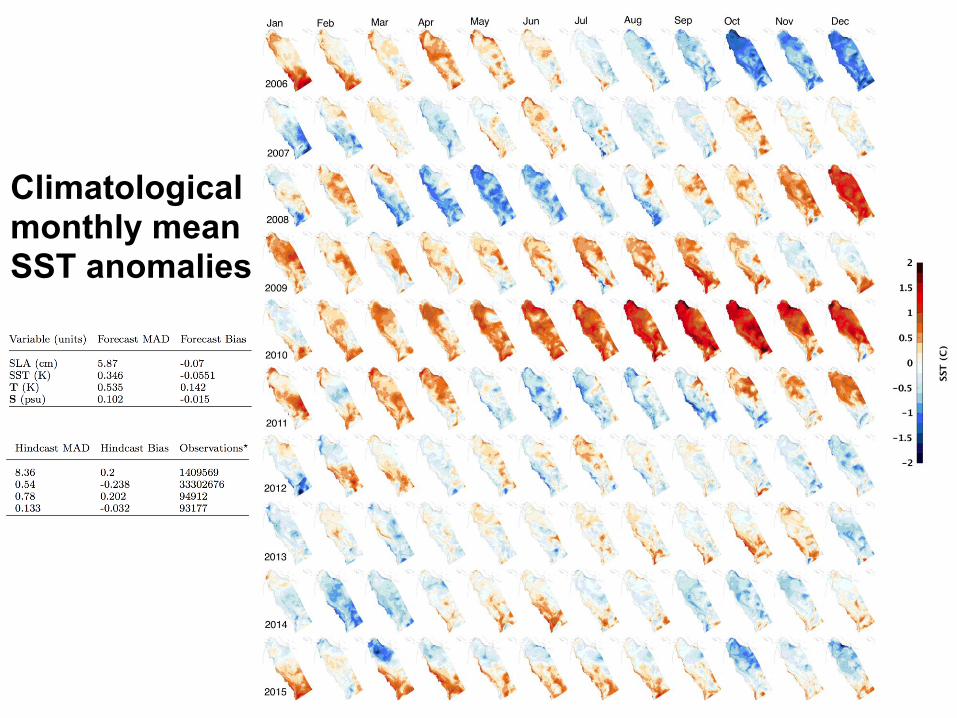
MODISClimatological monthly mean SST anomalies

3 June 2006 4 April 2009
AVHRR AVHRR
ROMS
MODIS
ROMS
MODISClimatological monthly mean SSS anomalies
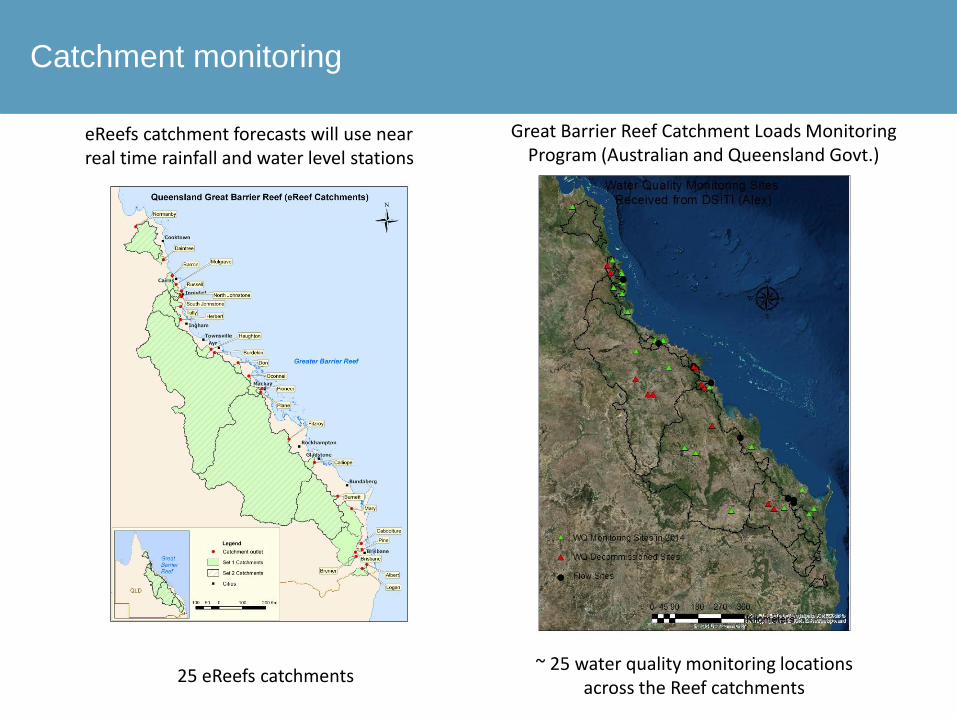
Catchment monitoring
Great Barrier Reef Catchment Loads Monitoring Program (Australian and Queensland Govt.)
eReefs catchment forecasts will use near real time rainfall and water level stations
25 eReefs catchments ~ 25 water quality monitoring locations
across the Reef catchments
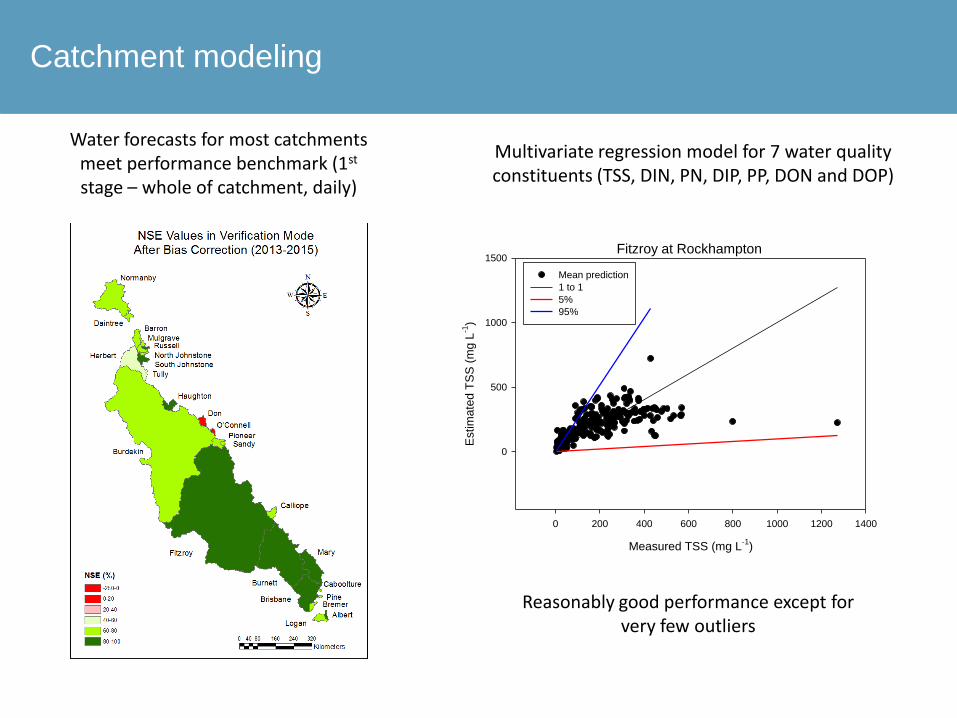
Catchment modeling
Water forecasts for most catchments meet performance benchmark (1st stage – whole of catchment, daily)
Fitzroy at Rockhampton
Measured TSS (mg L-1
)
0 200 400 600 800 1000 1200 1400
Estim
ate
d T
SS
(m
g L
-1)
0
500
1000
1500
Mean prediction
1 to 1
5%
95%
Multivariate regression model for 7 water quality constituents (TSS, DIN, PN, DIP, PP, DON and DOP)
Reasonably good performance except for very few outliers

Catchment forecast services (daily updates)
Water quantity forecast Water quality forecast
Verification: water quantity Verification: water quality (annual load)
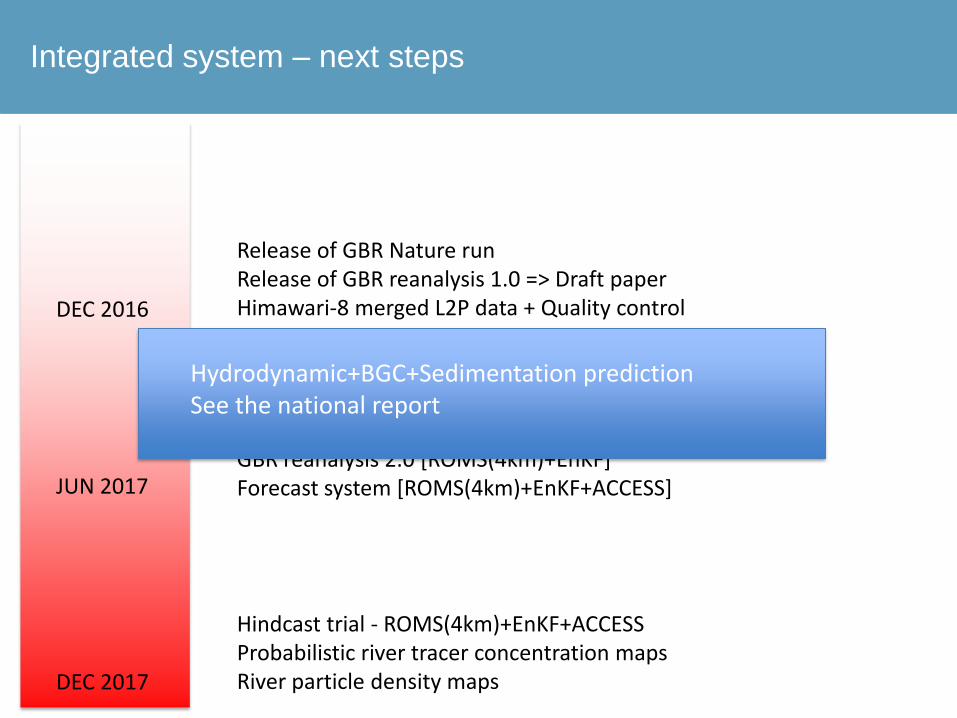
Integrated system – next steps
DEC 2017
JUN 2017
DEC 2016
Release of GBR Nature run Release of GBR reanalysis 1.0 => Draft paper Himawari-8 merged L2P data + Quality control
GBR reanalysis 2.0 [ROMS(4km)+EnKF] Forecast system [ROMS(4km)+EnKF+ACCESS]
Hindcast trial - ROMS(4km)+EnKF+ACCESS Probabilistic river tracer concentration maps River particle density maps
Hydrodynamic+BGC+Sedimentation prediction See the national report