Embed Size (px)
Citation preview

General Purpose Water Accounting Report 2010-2011
Border Rivers Catchment
www.water.nsw.gov.au

Publisher NSW Department of Primary Industries, Office of Water. Level 18, 227 Elizabeth Street GPO Box 3889 Sydney NSW 2001 T 02 8281 7777 F 02 8281 7799 [email protected] www.water.nsw.gov.au
The NSW Office of Water manages the policy and regulatory frameworks for the state’s surface water and
groundwater resources, to provide a secure and sustainable water supply for all users. It also supports water
utilities in the provision of water and sewerage services throughout New South Wales.
General Purpose Water Accounting Report 2010 -2011 – Border Rivers Catchment June 2012
ISBN 978 1 74256 313 8
Acknowledgment Soil data for groundwater methodologies provided by the Natural Resources Data Programs (soils) unit of the former NSW Department of Environment, Climate Change and Water. This report may be cited as: Burrell M., Moss P., Green D., Ali A., Petrovic J., Nguyen K. (2012) General Purpose Water Accounting Report 2010-2011: Border Rivers Catchment, NSW Department of Primary Industries, Sydney
Cover photo: Boobera Lagoon - Photo courtesy of MDBA, Arthur Mostead.
© State of New South Wales through the NSW Department of Trade and Investment, Regional Infrastructure and Services, 2012
This material may be reproduced in whole or in part for educational and non-commercial use, providing the meaning is unchanged and its source, publisher and authorship are clearly and correctly acknowledged.
Disclaimer: While every reasonable effort has been made to ensure that this document is correct at the time of publication, the State of New South Wales, its agents and employees, disclaim any and all liability to any person in respect of anything or the consequences of anything done or omitted to be done in reliance upon the whole or any part of this document.
NOW 12_261
i | NSW Office of Water, July 2012
Background Water accounting across Australia is undergoing major reform resulting from agreements reached
under the National Water Initiative which recognises the need for a standardised, cohesive and comparable approach for water accounting and reporting. A review undertaken in 2006 found that the then current water reporting was being developed in an ad-hoc fashion and recommended the need
for total accounting reform whereby water accounting would be developed as a discipline comparable to that of financial accounting.
In line with this recommendation the Water Accounting Standards Board (WASB) was formed with the
task of implementing a national standard for water accounting. This process has resulted in the production of the ‘Exposure Draft of Australian Water Accounting Standards 1 (ED AWAS 1)’ which defines the structure for preparing a ‘General Purpose Water Accounting Report’ (GPWAR)’, and
following a consultation and review phase will transition to the Australian Water Accounting Standard (AWAS) .
This document is a GPWAR for the regulated component of the NSW Border Rivers, prepared by the
NSW Office of Water under the ED AWAS 1 framework. It has been prepared for the reporting period of 1 July to 2010 to 30 June 2011 and aims to provide a consolidated and informative summary of the water resource and water management that occurred within the valley for this period.
A General Purpose Water Accounting Report prepared in accordance with the ED AWAS 1 contains:
A contextual statement detailing the climate and water management in place for the
reporting period
A statement of Water Assets and Water Liabilities
A statement of Change in Water Assets and Water Liabilities
A statement of Physical Water Flows
Disclosures/Notes – A section of notes referenced to line items within the above
statements that explain in detail the source of the data, how the number was derived and the expected uncertainty associated with the number. This section also contains
reconciliation statements required by the ED AWAS 1
An assurance statement
An accountability statement
ii | NSW Office of Water, July 2012

Table of Contents
Background...........................................................................................................................................ii
Contextual Statement.......................................................................................................................... 1 1.1 Introduction ............................................................................................................................ 2 1.2 Border Rivers catchment........................................................................................................ 2 1.3 Geographic boundaries of the Border Rivers reporting entity................................................ 2
Surface water ......................................................................................................................... 2 Groundwater .......................................................................................................................... 5
1.4 Climate ................................................................................................................................... 5 1.5 Dam inflows............................................................................................................................ 9 1.6 Major flow events ................................................................................................................. 11 1.7 Policy.................................................................................................................................... 12
Surface water ....................................................................................................................... 12 Groundwater ........................................................................................................................ 12
1.8 Surface water management................................................................................................. 13 1.9 Groundwater management .................................................................................................. 14 1.10 Environmental water ............................................................................................................ 14
Held Environmental Water ................................................................................................... 14 Planned Environmental Water ............................................................................................. 14
Water Accounting Statements ......................................................................................................... 16 Water Accounting Statement Descriptions..................................................................................... 17 Other statement descriptions ......................................................................................................... 18 Significant water accounting policies ............................................................................................. 19 Quantification of data ..................................................................................................................... 21 Accountability Statement................................................................................................................ 22 Border Rivers catchment................................................................................................................ 23
Water Assets and Water Liabilities ...................................................................................... 23 Changes in Water Assets and Water Liabilities................................................................... 24 Border Rivers catchment: Physical flows mass balance diagram 2010-11 ......................... 26
Note disclosures................................................................................................................................ 27 Reconciliation and future prospect descriptions............................................................................. 28 Note 1 - Surface water storage ...................................................................................................... 30 Note 2 - River channel storage....................................................................................................... 32 Note 3 - Allocation accounts........................................................................................................... 34 Note 4 - Storage inflow – Glenlyon and Pindari ............................................................................. 37 Note 5 - Storage evaporation and storage rainfall ......................................................................... 39 Note 6 - River evaporation and river rainfall................................................................................... 40 Note 7 - Tributary inflow ................................................................................................................. 41 Note 8 - Ungauged runoff estimate ................................................................................................ 42 Note 9 – Groundwater balance methodologies.............................................................................. 43 Note 10 – Flow leaving system/Replenishments ........................................................................... 48 Note 11 – Extractions (NSW) ......................................................................................................... 50 Note 12 - Basic rights ..................................................................................................................... 52 Note 13 - Available Water Determination (AWD) (Allocation Announcement) .............................. 53 Note 14 – Storage Releases (including transparent releases) ...................................................... 56 Note 15 – QLD extractions ............................................................................................................. 58
iii | NSW Office of Water, July 2012

Note 16 – Supplementary extractions ............................................................................................ 59 Note 17 - Allocation trading............................................................................................................ 61 Note 18 - Unaccounted difference ................................................................................................. 63 Note 19 - Held environmental water............................................................................................... 65 Note 20 – Environmental Stimulus Flow ........................................................................................ 68 Note 21 – Account corrections ....................................................................................................... 69 Note 22 – Water order debiting ...................................................................................................... 70 Assurance Statement ..................................................................................................................... 71
References ......................................................................................................................................... 72
Tables
Table 1: Border Rivers Regulated River opening announcement summary ................................ 13
Table 2: Recognition of assets and liabilities as of 30 June 2011 ................................................ 19
Table 3: Water account data accuracy estimates key .................................................................. 21
Figures
Figure 1: Surface water geographical extent of the accounts.......................................................... 4
Figure 2: Groundwater geographical extent of the accounts ........................................................... 5
Figure 3: Annual rainfall for 2010-11................................................................................................ 6
Figure 4: 2010-11 rainfall variation from long term mean ................................................................ 7
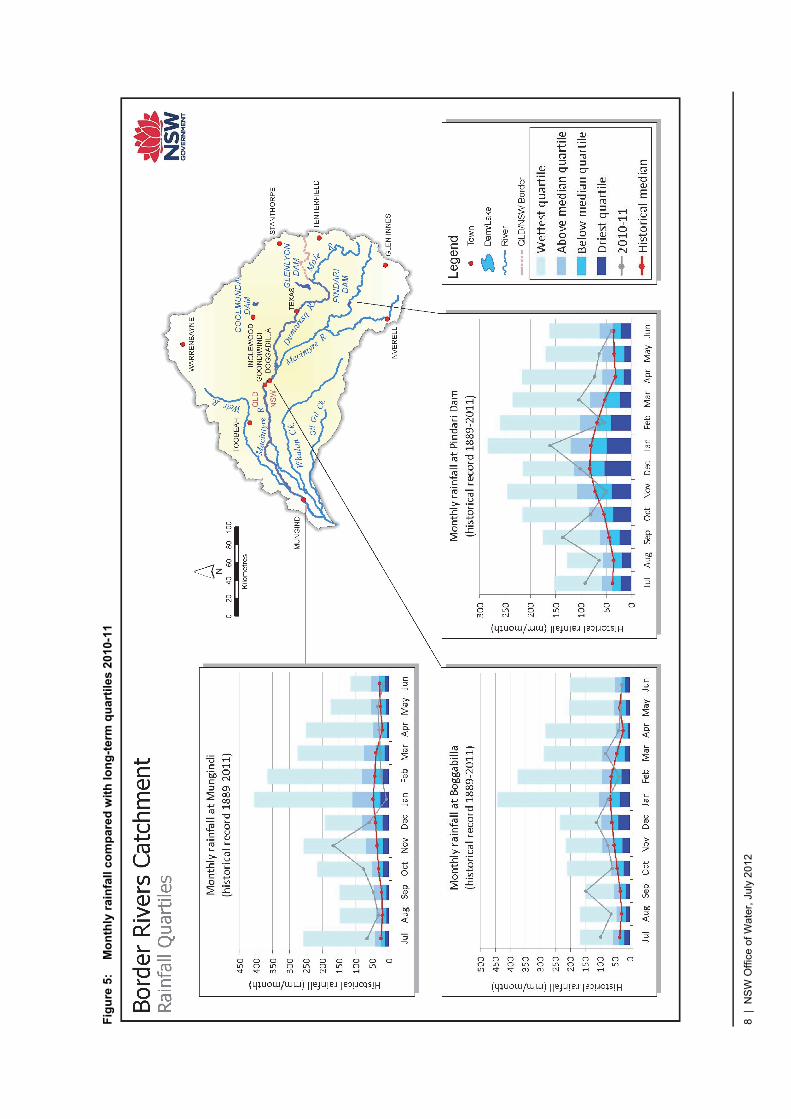
Figure 5: Monthly rainfall compared with long-term quartiles 2010-11 ............................................ 8
Figure 6: Class A pan evaporation at Mungindi and Pindari 2010-11 ............................................. 9
Figure 7: Long-term inflows to Glenlyon Dam against mean and reporting year inflow ................ 10
Figure 8: Daily inflows and rainfall at Glenlyon Dam 2010-11 ....................................................... 10
Figure 9: Long-term inflows to Pindari Dam against mean and reporting year inflow ................... 10
Figure 10: Daily inflows and rainfall at Pindari Dam 2010-11 .......................................................... 11
Figure 11: Flood events in the Border Rivers 2010-11 (July 2010 to November 2011) .................. 11
Figure 12: Flood events in the Border Rivers 2010-11 (January 2011 event) ................................. 12
Figure 13: Schematic diagram of accounting processes of surface water for the Border
Rivers .............................................................................................................................. 20
iv | NSW Office of Water, July 2012

Abbreviations
Acronym Description
AWAS Australian Water Accounting Standard
AWD Available Water Determination
BoM Bureau of Meteorology
CAIRO Computer Aided Improvements to River Operations
ED AWAS 1 Exposure Draft of Australian Water Accounting Standards
GIS Geographic Information System
GPWAR General Purpose Water Accounting Report
IQQM Integrated Quantity and Quality Model
MDBA Murray-Darling Basin Authority
ML Megalitres (1,000,000 litres)
MODFLOW Modular Three Dimensional Finite-Difference Groundwater Flow Model
NOW NSW Office of Water
NSW New South Wales
QLD Queensland
WAS Water Accounting System (Water Management Act 2000)
WASB Water Accounting Standards Board
v | NSW Office of Water, July 2012

Glossary
Allocation The specific volume of water allocated to water allocation accounts in a given season, defined according to rules established in the relevant water plan.
Allocation assignments The transfer of water between licence holder allocation accounts as a result of a trade agreement. The assignment becomes part of the receiver’s current year allocation account water.
Allocation Account Water account attached to an access licence used to track the balance of account water.
Aquifer Soil or rock below the land surface that is saturated with water. A confined aquifer has layers of impermeable material above and below it and is under pressure. When the aquifer is penetrated by a well, the water rises above the top of the aquifer. In an unconfined aquifer, the upper water surface (water table) is at atmospheric pressure and thus is able to rise and fall.
Available Water Determination (AWD)
The process by which water is made available for use and shared amongst water users who hold a water access licence. It determines the volume of water that is to be added to an individuals licence allocation account.
Australian Water Accounting Standard (AWAS)
A national standard that prescribes the basis for preparing and presenting a General Purpose Water Accounting Report (GPWAR). It sets out requirements for the recognition, quantification, presentation and disclosure of items in a GPWAR.
Back-calculation A calculation approach using a mass balance to determine an unknown variable (used to calculate storage inflows based on balancing the change in storage volume where inflow is the only unknown).
Basic rights The non-licensed right to extract water to meet basic requirements for household purposes (non-commercial uses in and around the house and garden) and for watering of stock. It is available for anyone who has access to river frontage on their property.
Computer Aided Improvements to River Operations (CAIRO)
A spreadsheet-based water balance model used for optimising river operations (orders and releases)
Carryover The volume or share component that may be reserved by a licence holder for use in the proceeding year.
Catchment The areas of land which collect rainfall and contribute to surface water (streams, rivers, wetlands) or to ground-water. A catchment is a natural drainage area, bounded by sloping ground, hills or mountains, from which water flows to a low point.
Conveyance licence Defined licence category that provides an allowance for losses in the delivery of water.
Dead storage The volume in storage that is generally considered unavailable for use (e.g water level below release valves) due to access and often poor water quality.
vi | NSW Office of Water, July 2012
Dealings A water dealing refers to a change that can be made to a licence, in particular, those arising from trading including the sale of all or part of an access licence or account water. May also include a change in location, licence category or consolidation/subdivision of licences.
Double entry accounting Double-entry accounting is a method of record-keeping that records both where money (or in this case water) comes from and where it goes. Using double-entry means that water is never gained or lost - it is always transferred from somewhere (a source account) to somewhere else (a destination account).
Effective storage The total volume of storage minus the dead storage component – the volume generally considered as useable.
Effluent Flow leaving a place or process. Sewage effluent refers to the flow leaving a sewage treatment plant. An effluent stream is one which leaves the main river and does not return.
Entity A defined geographical area or zone within the accounting region. Transactions and reports are produced for each entity.
End of system The last defined point in a catchment where water information can be measured and/or reported.
Environmental water Water allocated to support environmental outcomes and other public benefits. Environmental water provisions recognise the environmental water requirements and are based on environmental, social and economic considerations, including existing user rights.
Equity Total assets minus total liabilities
Evaporation The process by which water or another liquid becomes a gas. Water from land areas, bodies of water, and all other moist surfaces is absorbed into the atmosphere as a vapour.
Evapotranspiration The process by which water is transmitted as a vapour to the atmosphere as the result of evaporation from any surface and transpiration from plants.
Extraction The pumping or diverting of water from a river or aquifer by licensed users for a specific purpose (irrigation, stock, domestic, towns, etc). The volume is measured at the point of extraction or diversion (river pump, diversion works etc).
General Purpose Water Accounting Report (GPWAR)
A report prepared according to the Australian Water Accounting Standard. It is comprised of a number of components including a contextual statement, a Statement of Water Assets and Water Liabilities, a Statement of Change in Water Assets and Water Liabilities, a Statement of Physical Water Flows, Notes and Disclosures, and an assurance and accountability statement
General security licence A category of water access licence implemented under the Water Management Act 2000. Forms the bulk of the water access licence entitlement volume in NSW and is a low priority entitlement i.e. only receives water once essential and high security entitlements are met in the available water determination process.
Groundwater Water location beneath the ground in soil pore spaces and in the fractures of rock formations.
vii | NSW Office of Water, July 2012

High security licence A category of licence water access licence implemented under the Water Management Act 2000. Receives a higher priority than general security licences but less priority than essential requirements in the available water determination process.
HYDSTRA database A database used by NSW Office of Water to store continuous time series data such as river flow, river height, and water quality.
Inflows Surface water runoff and deep drainage to groundwater (groundwater recharge) and transfers into the water system (both surface and groundwater) for a defined area.
Inter-valley trade Trade of licence holder allocation account water, via allocation assignment, from one catchment to another catchment (or state).
Intra-valley trade Trade of licence holder allocation account water, via allocation assignment, within the same catchment.
Licence Administration System (LAS)
The system used by NSW Office of Water to manage water access licence information and transaction.
Liability A legally binding obligation to settle a debt.
Median The middle point of a distribution, separating the highest half of a sample from the lowest half.
Non-physical transaction An accounting transaction representing a process that is not a component of the water cycle (e.g. an available water determination).
Physical transaction An accounting transaction representing a process of the water cycle (e.g. a extraction)
Recharge Groundwater recharge is a hydrologic process where water drains downward from surface water to groundwater. Groundwater is recharged naturally by rain, floods and snow melt and to a smaller extent by drainage directly from surface water (such as rivers and lakes).
Regulated river A river system where flow is controlled via one or more major man-made structures e.g. dams and weirs. For the purposes of the Water Management Act 2000 a regulated river is one that is declared by the Minister to be a regulated river. Within a regulated river system licence holders can order water against a held entitlement.
Replenishment flows Flows provided along effluent systems downstream of a water source to supply water for household, town use and stock.
Return inflows Water that has been diverted from a river by a water user and is then returned to the river after use (e.g. can include non-consumptive uses, such as hydropower, cooling water for industry or water for aquaculture). This water is included as an inflow to the basin because the water is available to be diverted downstream or will pass the basin outlet.
Share component An entitlement to water specified on the access licence, expressed as a unit share or in the case of specific purpose licences (eg. local water utility, major water utility and domestic and stock) a volume in megalitres. The amount of water a licence holder is allocated as a result of an available water determination and the amount they can take in any year is based on their share component.
viii | NSW Office of Water, July 2012
ix | NSW Office of Water, July 2012
Steady State A condition in a physical groundwater system where the volume does not change over time, or in which any one change in volume is continually balanced by another.
Storage A state-owned dam, weir or other structure which is used to regulate and manage river flows in the catchment and the water bodies impounded by these structures.
Storage discharge The volume of water released from storage in a specified time frame.
Storage reserve Proportion of water in a storage reserved in the resource assessment process for future essential or high security requirements (e.g. town water).
Storage volume The total volume of water held in storage at a specified time.
Supplementary water Unregulated river flow available for extraction under a supplementary licence.
Surface water All water that occurs naturally above ground including rivers, lakes, reservoirs, creeks, wetlands and estuaries.
Translucent flow The release of an agreed percentage of an incoming flow event from a dam for environmental purposes immediately downstream of the dam.
Transparent flow The release of all or part of an incoming flow event from a dam for environmental purposes at one or more sites downstream of the dam.
Tributary A smaller river or stream that flows into a larger river or stream. Usually a number of smaller tributaries merge to form a river.
Uncontrolled flow Water permitted to be extracted without debt under a general security access licence during a supplementary flow event. The extracted water may be progressively debited to the general security account if water availability exceeds predefined levels.
Ungauged catchment A catchment without a flow gauge to accurately record stream flows. Modelled estimates must be used to approximate the contribution of ungauged catchments to the main river.
Water accounting The systematic process of identifying, recognising, quantifying, reporting, assuring and publishing information about water, the rights or other claims to that water, and the obligations against that water
Water assets The physical water held in storage, as well as any claims to water that are expected to increase the future water resource (e.g. external water entering the system through intervalley trading).
Water liabilities Claims on the water assets of the water report entity including water that has been allocated to licence holder accounts or environmental accounts but yet to be taken at the end of the reporting period.
Water sharing plan A water management plan that defines the rules for sharing of water within a region under the Water Management Act 2000.
Contextual Statement
1 | NSW Office of Water, July 2012

1 Contextual Statement
1.1 Introduction This statement is prepared under the Exposure Draft of Australian Water Accounting Standards 1 (ED AWAS 1), as defined by the Water Accounting Standards Board (WASB).
“The Contextual Statement shall provide information that enables users to understand the physical and administrative aspects of the water report entity. It shall contain contextual information about the water assets and water liabilities of the water report
entity, including any conditions that have an impact on the management of those water assets and water liabilities” Paragraph 48 (ED AWAS 1).
The contextual statement descriptive text is specific to the period being presented in the accounts
which is 2010-11.
1.2 Border Rivers catchment The Border Rivers comprise the catchments of the Dumaresq, Severn, Macintyre and Barwon Rivers
which drain from the Great Dividing Range between Inverell in far northern New South Wales (NSW) and Warrenbayne in Southern Queensland. The catchment occupies an area of approximately 49,500 km2 of which approximately 24,500 km2 is situated within NSW. The Dumaresq River, Macintyre River
and part of the Barwon River downstream of the Weir River form the border between NSW and Queensland for approximately 470 km.
The Border Rivers are regulated by three dams – Glenlyon Dam on Pikes Creek (QLD), Coolmunda
Dam on Macintyre Brook (QLD), and Pindari Dam on the Severn River (NSW). The main tributaries draining from Queensland are Pikes Creek and Macintyre Brook which enter the Dumaresq River, and the Weir River which enters the Macintyre River. The lower end of the catchment is characterised by a
complex series of anabranching channels. The junction of the Weir and Macintyre Rivers marks the start of the Barwon River, and the town of Mungundi on the Barwon River marks the downstream end of the Border Rivers catchment.
The Border Rivers flows through lands previously occupied by the Kamilaroi and Bigambul Aboriginal people. The catchment supports a population of around 50,000 people. In NSW the population is concentrated in the major centres of Glen Innes, Inverell, and Tenterfield which support around 30,000
people between the three local government areas. The largest towns in the Queensland part of the catchment are Goondiwindi and Stanthorpe which both have populations of around 5,000 people.
The main agricultural use of land is for grazing and dryland cropping, and this covers around ninety
per cent of the catchment. Irrigation for the production of cotton occurs on the western plains between Goondiwindi and Mungindi.
A more detailed description of the catchment can be found in the document Water resources and
management overview – Border Rivers catchment which is available from the NSW Office of Water website.
1.3 Geographic boundaries of the Border Rivers reporting entity
Surface water
Inclusions The accounted river extent is illustrated in Figure 1 and includes the area managed by the Water
Sharing Plan for the Border Rivers Regulated River Water Source.
2 | NSW Office of Water, July 2012

3 | NSW Office of Water, July 2012
For the purposes of this General Purpose Water Accounting Report (GPWAR) the Border Rivers component includes the Severn River from Pindari Dam and the Dumeresq River from Glenlyon Dam downstream to the junction of the Macintyre River and to the end of system at Mungindi.
Gauged inflow for the Border Rivers consists of inflow from Macintyre Brook, The Mole River, Frazers Creek, Weir River, Tenterfield Creek, Beardy River and Macintyre River (the unregulated component upstream of it’s junction with the Severn River).
As this GPWAR is an account for the NSW Border Rivers, only Pindari and Glenlyon storage volumes are included as major storage assets. While as previously mentioned, flow exiting Coolmunda Dam on the Macintyre Brook is treated as an inflow to the NSW Border Rivers, the Coolmunda system itself
including Coolmunda Dam is excluded.

Fig
ure
1:
Su
rfac
e w
ater
geo
gra
ph
ical
ext
ent
of
the
acco
un
ts
4 |
NS
W O
ffice
of W
ater
, Jul
y 20
12

Groundwater
With no planning model available, and the absence of sufficient monitoring bore data, the NSW Office of Water’s accounting Method C was the only method to be implemented for the Border Rivers. This was applied to the whole of the surface water catchment (Figure 2), with the exception of the Gwydir
Alluvium, which is being accounted in its entirety in the Gwydir GPWAR. Both the Gwydir GPWAR and a detailed explanation of the Method C accounting method are available on the NSW Office of Water webpage). A summarised explanation of the Method C accounting method is available in Note 9 of this
GPWAR.
From this method, an estimate of potential recharge is provided for the shaded area in Figure 2. While no metered data is available, an estimate of extractions resulting from pumping is provided based on
an estimate of extraction per bore distributed across the bores in the area.
Figure 2: Groundwater geographical extent of the accounts
1.4 Climate The Border Rivers catchment experienced a significant break in the drought conditions that have dominated the catchment for the past decade. Very high rainfalls during the first half of the year replenished water supplies available for water users and high river levels resulted in environmental
benefits and extended flooding of important wetland sites.
Rainfall The highest rainfall in the Border Rivers catchment occurred in areas along the eastern side of the
Border Rivers basin where rainfall in 2010-11 exceeded 1,400 mm (Figure 3). Most of the catchment to the east of Inverell to Stanthorpe received rainfall within the range of 1100 – 1400 mm for the year. On the plains to the west of Goondiwindi the average annual rainfall was within the range of 600 – 800
mm with the lowest rainfall occurring west of Mungindi (600 mm). For much of the catchment, these
5 | NSW Office of Water, July 2012

totals are 0 – 200 mm higher than long term average conditions for areas west of Inverell, while on the plains to the east of the catchment rainfall was 100 – 800 mm higher than the long term average falls (Figure 4).
Figure 3: Annual rainfall for 2010-11
Layer source: Bureau of Meteorology
6 | NSW Office of Water, July 2012

Figure 4: 2010-11 rainfall variation from long term mean
Layer source: Bureau of Meteorology
Rainfall was dominant throughout most the catchment during spring and summer (see Figure 5). In the east of the catchment at Pindari Dam, monthly rainfall was higher than the long-term median for the respective months in all but November 2010 and February 2011 (where falls were only slightly lower
than the long term median). In this area September and January exhibited rainfall that fell well within the wettest quartile for the record. Similarly, large falls were experienced in the central and lower part of the catchment at Boggabilla and Mungindi respectively. At Boggabilla, September 2010 was the
wettest on record, while Mungindi received monthly rainfall in July, September, October and November that fell with the wettest quartile of the historical record. This was preceded however by a relatively dry summer for this area, with monthly rainfall for January, February and March all failing to
reach the historical median.
7 | NSW Office of Water, July 2012
Fig
ure
5:
M
on
thly
rai
nfa
ll co
mp
ared
wit
h lo
ng
-ter
m q
uar
tile
s 20
10-1
1
8 |
NS
W O
ffice
of W
ater
, Jul
y 20
12

Evaporation The high rainfall and associated high cloud cover and lower temperatures that dominated the first half
of 2010-11 are reflected in the lower than average daily pan evaporation. This is particularly noticeable at Pindari where evaporation was consistently below average for the entire year (Figure 6). The greatest variation occurred in December when daily pan evaporation at Pindari was 2.5 – 3mm lower
than average. In the lower catchment at Mungindi pan evaporation was around 1mm lower than average during spring, with maximum variation occurring in December when pan evaporation was 3mm lower than average.
Figure 6: Class A pan evaporation at Mungindi and Pindari 2010-11
0
1
2
3
4
5
6
7
8
9
10
Jul‐10 Aug‐10 Sep‐10 Oct‐10 Nov‐10 Dec‐10 Jan‐11 Feb‐11 Mar‐11 Apr‐11 May‐11 Jun‐11
Evaporation (mm)
Mungindi 2010-11 Mungindi mean (1900-2011)
Pindari 2010-11 Pindari mean (1954-2011)
1.5 Dam inflows The water resource situation in the Border Rivers reached capacity during 2010-11 with the widespread and drought breaking flood conditions.
The annual inflow to Glenlyon Dam of 354,825 ML was well in excess of the mean annual flow of
70,845 ML. In fact it was the highest on record based on a long term record produced from back calculated data and simulated inflow (Figure 7). Minor but consistent event based inflows to Glenlyon of up to 10,000 ML/d had the dam at full capacity by the end of December 2010. As a result the major
inflow event in January 2011 (Figure 8) was spilled.
The annual inflow to Pindari Dam of 572,337 ML was well in excess of the mean annual flow of 176,533 ML. The Pindari Dam inflow was the largest since the dam was constructed in 1969. In
addition based on a long term record produced from back calculated data and simulated inflow it was the 6th highest on record (Figure 9). A series of inflows into Pindari Dam in August and September 2010 had the dam at full capacity by the end of September 2010. As a result the major inflow event in
January 2011 (Figure 10) was spilled.
9 | NSW Office of Water, July 2012

Figure 7: Long-term inflows to Glenlyon Dam against mean and reporting year inflow
0
50,000
100,000
150,000
200,000
250,000
300,000
350,000
400,000
1890
1895
1900
1905
1910
1915
1920
1925
1930
1935
1940
1945
1950
1955
1960
1965
1970
1975
1980
1985
1990
1995
2000
2005
2010
Historic inflows 2010‐11 inflow Mean inflow
Figure 8: Daily inflows and rainfall at Glenlyon Dam 2010-11
0
5000
10000
15000
20000
25000
30000
1/07/2010
1/08/2010
1/09/2010
1/10/2010
1/11/2010
1/12/2010
1/01/2011
1/02/2011
1/03/2011
1/04/2011
1/05/2011
1/06/2011
Inflow (ML/d)
0
10
20
30
40
50
60
70
Rainfall (m
m)
Rainfall at Mole River 56055 Glenlyon Dam Inflow (ML)
Figure 9: Long-term inflows to Pindari Dam against mean and reporting year inflow
0
100,000
200,000
300,000
400,000
500,000
600,000
700,000
800,000
1890
1895
1900
1905
1910
1915
1920
1925
1930
1935
1940
1945
1950
1955
1960
1965
1970
1975
1980
1985
1990
1995
2000
2005
2010
Inflow (ML/YR)
Historical inflows 2010‐11inflow Mean Inflow
10 | NSW Office of Water, July 2012

Figure 10: Daily inflows and rainfall at Pindari Dam 2010-11
0
10000
20000
30000
40000
50000
60000
70000
80000
90000
1/07/2010
1/08/2010
1/09/2010
1/10/2010
1/11/2010
1/12/2010
1/01/2011
1/02/2011
1/03/2011
1/04/2011
1/05/2011
1/06/2011
Inflow (ML/d)
0
10
20
30
40
50
60
Rainfall (m
m)
Rainfall at Pindari 54104 Pindari Dam Inflow (ML)
1.6 Major flow events 2010-11 was a relatively wet season when compared to the historical record producing significant flows to break the extended drought sequence. Minor but consistent events began from August 2010
ranging from around 25,000 ML/d to over 50,000 ML/day (Figure 11). The main flood event occurred in January 2011 and consisted of a double peak hydrograph along the Macintyre River (Figure 12). The first event peaked at around 60,000 ML/d before receding slightly. A few days later, the waters
began rising again, this time reaching major flooding levels, and peaking at almost 292,000 ML/day at Boggabilla, which is the highest daily flow that has been recorded at this site. The event typically slowed and flattened out by the time it reached Mungindi where it reached a peak of around 25,000
ML/d. In addition to flows breaching the river bank and travelling along the flood plain significant volumes of the event were also extracted by NSW and QLD irrigators.
Figure 11: Flood events in the Border Rivers 2010-11 (July 2010 to November 2011)
0
50,000
100,000
150,000
200,000
250,000
300,000
Aug 2
010
Sep 2010
Oct 2
010
Nov 2
010
Flow (ML/d)
Severn River at Strathbogie Macintyre River at HoldfastMacintyre River at Boggabilla Macintyre River at Mungindi
11 | NSW Office of Water, July 2012
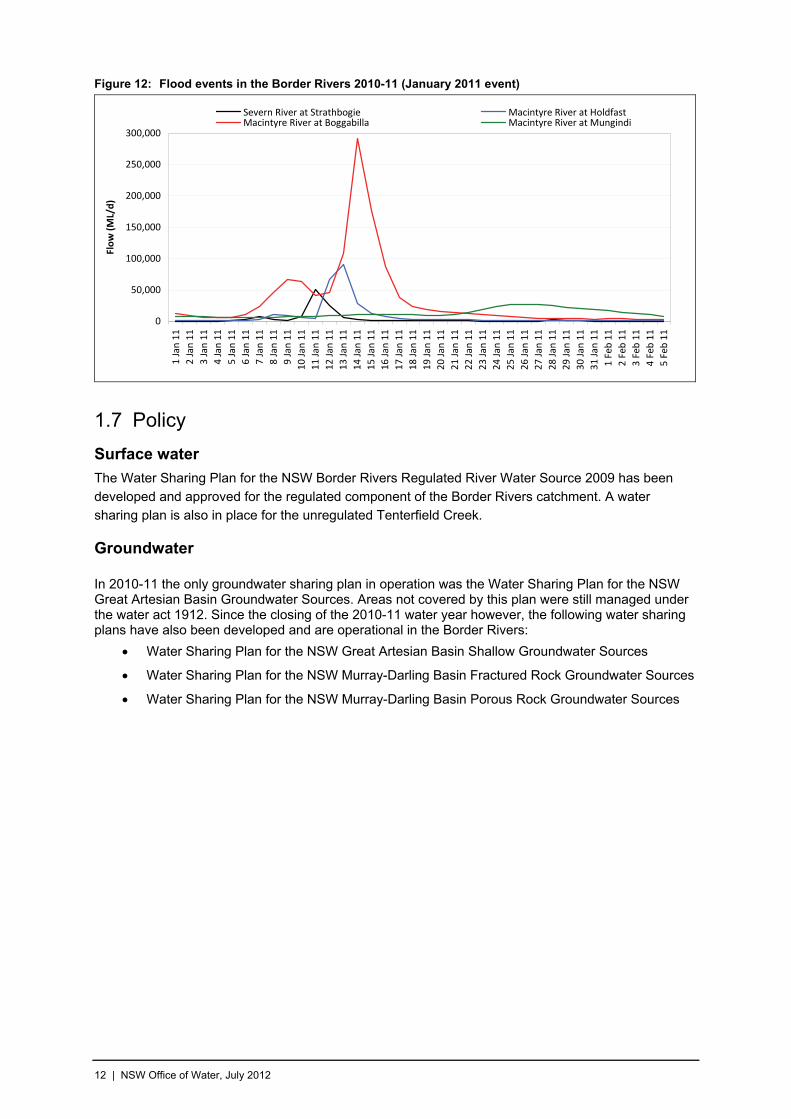
Figure 12: Flood events in the Border Rivers 2010-11 (January 2011 event)
0
50,000
100,000
150,000
200,000
250,000
300,000
1 Jan
11
2 Jan
11
3 Jan
11
4 Jan
11
5 Jan
11
6 Jan
11
7 Jan
11
8 Jan
11
9 Jan
11
10 Jan
11
11 Jan
11
12 Jan
11
13 Jan
11
14 Jan
11
15 Jan
11
16 Jan
11
17 Jan
11
18 Jan
11
19 Jan
11
20 Jan
11
21 Jan
11
22 Jan
11
23 Jan
11
24 Jan
11
25 Jan
11
26 Jan
11
27 Jan
11
28 Jan
11
29 Jan
11
30 Jan
11
31 Jan
11
1 Fe b
11
2 Feb
11
3 Feb
11
4 Feb
11
5 Feb
11
Flow (ML/d)
Severn River at Strathbogie Macintyre River at HoldfastMacintyre River at Boggabilla Macintyre River at Mungindi
1.7 Policy
Surface water
The Water Sharing Plan for the NSW Border Rivers Regulated River Water Source 2009 has been developed and approved for the regulated component of the Border Rivers catchment. A water sharing plan is also in place for the unregulated Tenterfield Creek.
Groundwater In 2010-11 the only groundwater sharing plan in operation was the Water Sharing Plan for the NSW Great Artesian Basin Groundwater Sources. Areas not covered by this plan were still managed under the water act 1912. Since the closing of the 2010-11 water year however, the following water sharing plans have also been developed and are operational in the Border Rivers:
Water Sharing Plan for the NSW Great Artesian Basin Shallow Groundwater Sources
Water Sharing Plan for the NSW Murray-Darling Basin Fractured Rock Groundwater Sources
Water Sharing Plan for the NSW Murray-Darling Basin Porous Rock Groundwater Sources
12 | NSW Office of Water, July 2012

1.8 Surface water management Available water was initially restricted at the commencement of the 2010-11 water with the
continuation of drought conditions (Table 1). Water was sufficient however to provide for allocation for the higher security categories of licence (Domestic and Stock, Local Water Utility and High Security. Both categories of General Security licences received no additional water at the commencement of
the season, however any water carried over from the 2009-10 was made available to the holders (541 ML and 27,821 ML for General Security A and General Security B respectively).
Table 1: Border Rivers Regulated River opening announcement summary
Licence Individual
Announcement Share
Component
Allocation Volume (ML)
% of Entitlement
Balance Available (ML)
Balance Total (%)
DOMESTIC AND STOCK
01 July 2010 AWD 100.0 % 858 858 100 858 100
01 July 2010 Start 858 0 0
DOMESTIC AND STOCK[DOMESTIC]
01 July 2010 Start 55 0 0
01 July 2010 AWD 100.0 % 55 55 100 55 100
DOMESTIC AND STOCK[STOCK]
01 July 2010 Start 100 0 0
01 July 2010 AWD 100.0 % 100 100 100 100 100
LOCAL WATER UTILITY
01 July 2010 Start 620 (29) (5)
01 July 2010 AWD 100.0 % 620 620 100 591 95
REGULATED RIVER (GENERAL SECURITY A)
01 July 2010 Start 22,027 541 3
01 July 2010 AWD 0.0 ML per Share 22,027 (1) 0 541 3
REGULATED RIVER (GENERAL SECURITY B)
01 July 2010 Start 241,211 27,821 12
01 July 2010 AWD 0.0 ML per Share 241,211 0 0 27,821 12
REGULATED RIVER (GENERAL SECURITY)
01 July 2010 Start 44 0 0
01 July 2010 AWD 0.0 ML per Share 44 0 0 0 0
REGULATED RIVER (HIGH SECURITY)
01 July 2010 Start 1,500 0 0
01 July 2010 AWD 1.0 ML per Share 1,500 1,500 100 1,500 100
SUPPLEMENTARY WATER
01 July 2010 Start 120,001 0 0
01 July 2010 AWD 1.0 ML per Share 120,001 120,001 100 120,001 100
The water sharing plan for the Regulated Border Rivers stipulates that up to two replenishment flows up to a combined maximum volume of 10,000 ML must be released to the Boomi River each water
year, if required. In 2010-11 given the major flooding in Border Rivers a replenishment flow was deemed unnecessary. The volume of water in 2010-11 measured at the Boomi River offtake was in fact the highest on record.
Licence holders with access to supplementary water were granted 100 per cent of entitlement. Throughout 2010-11 there were significant periods of supplementary flow access with 94,176 ML out of the 120,001 ML entitlement being extracted. For details of supplementary announcements by river
section see Note 16.
13 | NSW Office of Water, July 2012

1.9 Groundwater management
All groundwater licences in the NSW Border Rivers were granted an equivalent allocation of 1 ML per share with the exception of supplementary licences within the Lower Gwydir Alluvium which received
an allocation of 0.741 ML per share. However, this represents minimal entitlement for the NSW Border Rivers as only the far top edge of the Lower Gwydir Alluvium crosses into the Border Rivers Surface water management boundary (refer to Figure 2 ). Under the terms set out in the Water Sharing Plan
for the Lower Gwydir Groundwater Source 2003 the announcement for supplementary licences is reduced each year by 0.143 ML with the announcement set to be zero from the 2015/16 season onwards. The purpose of this licences category was to reduce entitlements to a sustainable level,
while allowing significant time and flexibility for effective users to adapt to these changes.
1.10 Environmental water
Held Environmental Water
Held environmental water represents water that is held as part of a licensed volumetric entitlement. In 2010-11 held General Security B environmental water in the Border Rivers Regulated River increased from a zero share component to 269 ML. No share component was held in other licences categories
during 2010-11.
While the licence category received a total Available Water Determination of 24 ML in 2010-11, given the extremely wet conditions it was not utilised and carried forward to the 2011-12 season. For a
detailed breakdown of held and traded environmental water refer to Note 19.
Planned Environmental Water
Planned environmental water is detailed in Part 3 of the Water Sharing Plan for the NSW Border Rivers Regulated River Water Source. It consists of 4 main components as explained below together
with the performance measure.
Minimum Release A minimum of 10 ML per day must be released from Pindari Dam. This is designed to provide a
riparian flow, connectivity of pools and riffles, and extend natural recession of flows released from Pindari.
2010-11 Performance The daily release from Pindari was greater that 10 ML at all times throughout the 2010-11 season.
Translucency Rule
The plan requires the passing of all inflows up to 50 ML per day during September to May, and all inflows up to 200 ML per day during June, July and August at Pindari Dam. This is designed to
increase natural flow variability downstream of the dam to the next significant tributary, Frazers Creek.
2010-11 Performance All requirements of the translucency were considered to be met in 2010-11. Stimulus flow rule
The plan provides for the reservation of 4,000 ML in Pindari Dam at the start of each water year for a stimulus flow, a pulse of water released from the dam to stimulate natural ecological processes. The
stimulus is required to be released between 1 August and 1 December each year triggered by an inflow greater than 1,200 ML per day into Pindari Dam during the preceding months of April-August.
14 | NSW Office of Water, July 2012
Any water not released may be carried over to the next water year to a maximum volume of 8,000 ML. The stimulus flow is intended to provide a flow event that will add to the benefit of any translucent
environmental releases, provide cues for ecological processes such as fish breeding and regularly inundate riparian areas of the river downstream of the dam.
2010-11 Performance
Even though the trigger was met, due to the extremely wet year and flooding conditions the stimulus flow was not released in 2010/11 and 8,000 ML was carried forward to 2011/12.
Long-term extraction limit
By limiting long-term average extractions to an estimated 194,500 ML/year the water sharing plan ensures that approximately 60 per cent of the long-term average annual flow in the water source at Mungindi (estimated to be 565,560 ML/year) will be preserved and will contribute to the maintenance
of basic ecosystem health.
2010-11 Performance
No assessment has been made of long-term extraction levels in this GPWAR given the plan has only been operational since 1 July 2009.
15 | NSW Office of Water, July 2012

Water Accounting Statements
16 | NSW Office of Water, July 2012

Water Accounting Statement Descriptions
The water accounting statements required under ED AWAS 1 comprise three statements that were
produced using double entry accounting:
Statement of Water Assets and Water Liabilities as at 30 June 2011
Statement of Changes in Water Assets and Water Liabilities for 1 July 2010 to 30 June 2011
Statement of Physical Water Flows for 1 July 2010 to 30 June 2011. This has been excluded from this report. See Significant Water Accounting Policies for further information.
Statement of Water Assets and Water Liabilities The Statement of Water Assets and Water Liabilities is prepared under the ED AWAS 1, as defined by the Water Accounting Standards Board.
‘The Statement of Water Assets and Water Liabilities shall provide information that
enables users to understand the nature and volumes of the water assets and water liabilities of a water report entity’ (paragraph 58, WASB 2010).
In line with the above statement, this report provides an assessment of the water available in storage
plus any current claims to water (water assets). This is offset by any present obligations (water liabilities) that are required to be met with these water assets. Figures from the previous reporting period are also provided to add context. All figures are in megalitres (ML).
Water assets Water assets for the reporting entity include not only physical water in storage, but also any claims to water that are expected to increase the future water resource. Other claims would be applicable where
the entity is owed water from another external entity.
Water liabilities Water liabilities represent claims on the water assets of the water report entity. This is most apparent
in water that has been allocated to licence holder accounts or environmental accounts but yet to be taken. At the end of the reporting period the liability balances are the balances of allocated water yet to be taken, and allowed to be carried forward to the next water year. It should be noted that there
have been no groundwater liabilities accounted for in the statements.
Net water assets This is a calculated figure of total water assets minus total water liabilities. The net water asset has
been reported separately for surface water and groundwater.
Statement of Changes in Water Assets and Water Liabilities This statement is prepared under the ED AWAS 1, as defined by the Water Accounting Standards
Board.
“The Statement of Changes in Water Assets and Water Liabilities shall contain information that enables users to understand changes in the volumes and nature of
the water report entity’s net water assets during the reporting period” (paragraph 101, WASB 2010).
The report is comprised of both physical and non-physical transactions and illustrates how the change
in net water assets from the previous reporting period has eventuated. Figures from the previous reporting period are also provided in order to put the change into context.
Water asset increases Account items that have an increasing effect on the water assets presented in the Statement of Water Assets and Water Liabilities e.g. tributary inflows and rainfall.
17 | NSW Office of Water, July 2012
Water asset decreases Account items that have a decreasing effect on the water assets presented in the Statement of Water
Assets and Water Liabilities e.g. evaporation and groundwater pumping.
Water liability increases Account items that have an increasing effect on the water liabilities presented in the Statement of
Water Assets and Water Liabilities e.g. available water determinations increase the amount of water available in the allocation liability accounts.
Water liability decreases Account items that have a decreasing effect on the water liabilities presented in the Statement of Water Assets and Water Liabilities e.g. forfeited water reduces the amount of water available in the allocation liability accounts.
Change in net water assets The figure is calculated as:
WLDWLIWADWAINWA
Where NWA = Net water assets
WAI = Water asset increases
WAD = Water asset decreases
WLI = Water liability increases
WLD = Water liability decreases
The resultant net change should be equal to the annual change in net water asset on the Statement of Water Assets and Water Liabilities i.e. {Net Water Asset [Reporting Year] minus Net Water Asset [Reporting Year-1]}
Other statement descriptions
Two additional statements are required under ED AWAS 1:
Accountability Statement
Assurance Statement
Accountability Statement The Accountability Statement is prepared under the ED AWAS 1, as defined by the Water Accounting Standards Board.
‘The Accountability Statement shall provide information that assists users to assess
whether:
the general purpose water accounting report has been prepared and presented in
accordance with Australian Water Accounting Standards;
externally-imposed requirements relevant to managing the water assets and water liabilities
of the water report entity have been complied with; and
best practices for managing water assets and water liabilities have been applied’ (Paragraph 50 WASB, 2010)
The statement details externally imposed requirements and best practice for management, relevant to the water reporting entity for the reporting period.
18 | NSW Office of Water, July 2012

Assurance Statement The Assurance Statement is prepared under the ED AWAS 1, as defined by the Water Accounting
Standards Board.
‘An explicit statement of whether the general purpose water accounting report is presented fairly in accordance with this standard shall be provided in the Assurance
Statement’ (paragraph 167, WASB 2010).
No specific Assurance Statement has been included in this report (see specific section on Assurance Statement in this report for more details).
Significant water accounting policies
The water accounting statements in this GPWAR have been prepared using an accrual basis of accounting. All figures are in megalitres (ML)
Recognition of water assets and liabilities The water assets and water liabilities that have been recognised in these accounts are illustrated in Table 2 below.
Allocation accounts that finish the water year as a negative figure as a result of over pumping must be carried over to be paid back in the following year. Under the ED AWAS 1 this could be represented as a positive value in the Water Assets for these accounts, however here it will be presented as a
negative liability with the intention of presenting a clearer and more informative statement whereby all licence allocation account balances are presented together.
Even though Glenlyon dam is a shared resource between NSW and QLD (57 and 43 per cent
respectively), the full volume held in the storage has been recognised in the Statement of Water Assets and Water Liabilities for this GPWAR. The net volume available for NSW is then determined in the reconciliation statements.
Table 2: Recognition of assets and liabilities as of 30 June 2011
Surface Water
Assets Liabilities
Volume in storage for:
Pindari Dam
Glenlyon Dam (inc QLD share)
Boogabilla Weir
NSW Regulated Border Rivers System (as defined in Figure 1)
NSW allocation account balances for:
Domestic and Stock
Local Water Utility
High Security
General Security
Stimulus flow account
Ground Water
Assets Liabilities
No assets were included in ground water in this report.
No liabilities were included in ground water in this report.
Recognition of changes in water assets and liabilities Accounting models were derived based on a physical model of the river which identified physical transactions that impacted the water assets and to which accounting policy was applied. The adopted physical model used in this process is illustrated in Figure 13.
19 | NSW Office of Water, July 2012

Figure 13: Schematic diagram of accounting processes of surface water for the Border Rivers
Internal water trades (between NSW licences) have a net zero change in liabilities and as such would
not be shown in the ‘Statement of Changes in Water Assets and Water Liabilities’. In order to show them it was necessary to consider trades as a two part transaction i.e. one being the selling and the other being the buying. Therefore the trades appear as both a water liability increase (buyer) and a
water liability decrease (seller).
Similarly, storages releases, while being a net zero transfer of water asset from the storage to the river, have been included in the ‘Changes in Water Assets and Water Liabilities’ statement. This has
been accounted as a decrease in the storage asset with a corresponding increase in the river asset.
To represent the extraction of water from the river in the ‘Change in Water Assets and Liabilities’ statement it was necessary to consider it as two specific processes firstly the physical extraction of the
water from the river and secondly the adjustment of the water liability as a result of this physical extraction. This is represented in the ‘Changes in Water Assets and Water Liabilities’ statement as a decrease in the river asset with a corresponding decrease in the water liability.
Omission of Statement of Physical Flows The ‘Statement of Physical Flows’ has been excluded for this GPWAR as all transactions have been presented in the statements ‘Water Assets and Water Liabilities’ and ‘Changes in Water Assets and
Water Liabilities’.
20 | NSW Office of Water, July 2012
The introduction of a ‘Physical Flow Diagram’ that represents the physical movements of water has been included in order to provide a clearer picture of this process.
Quantification of data
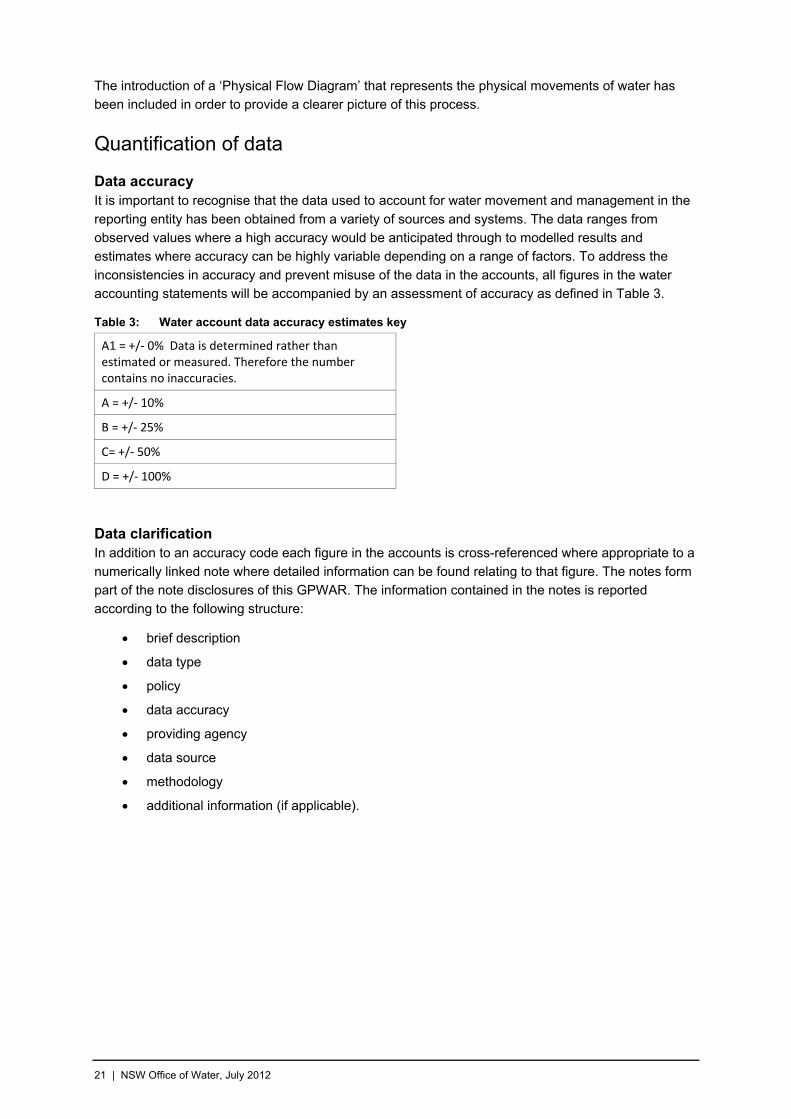
Data accuracy It is important to recognise that the data used to account for water movement and management in the
reporting entity has been obtained from a variety of sources and systems. The data ranges from observed values where a high accuracy would be anticipated through to modelled results and estimates where accuracy can be highly variable depending on a range of factors. To address the
inconsistencies in accuracy and prevent misuse of the data in the accounts, all figures in the water accounting statements will be accompanied by an assessment of accuracy as defined in Table 3.
Table 3: Water account data accuracy estimates key
A1 = +/‐ 0% Data is determined rather than estimated or measured. Therefore the number contains no inaccuracies.
A = +/‐ 10%
B = +/‐ 25%
C= +/‐ 50%
D = +/‐ 100%
Data clarification In addition to an accuracy code each figure in the accounts is cross-referenced where appropriate to a
numerically linked note where detailed information can be found relating to that figure. The notes form part of the note disclosures of this GPWAR. The information contained in the notes is reported according to the following structure:
brief description
data type
policy
data accuracy
providing agency
data source
methodology
additional information (if applicable).
21 | NSW Office of Water, July 2012
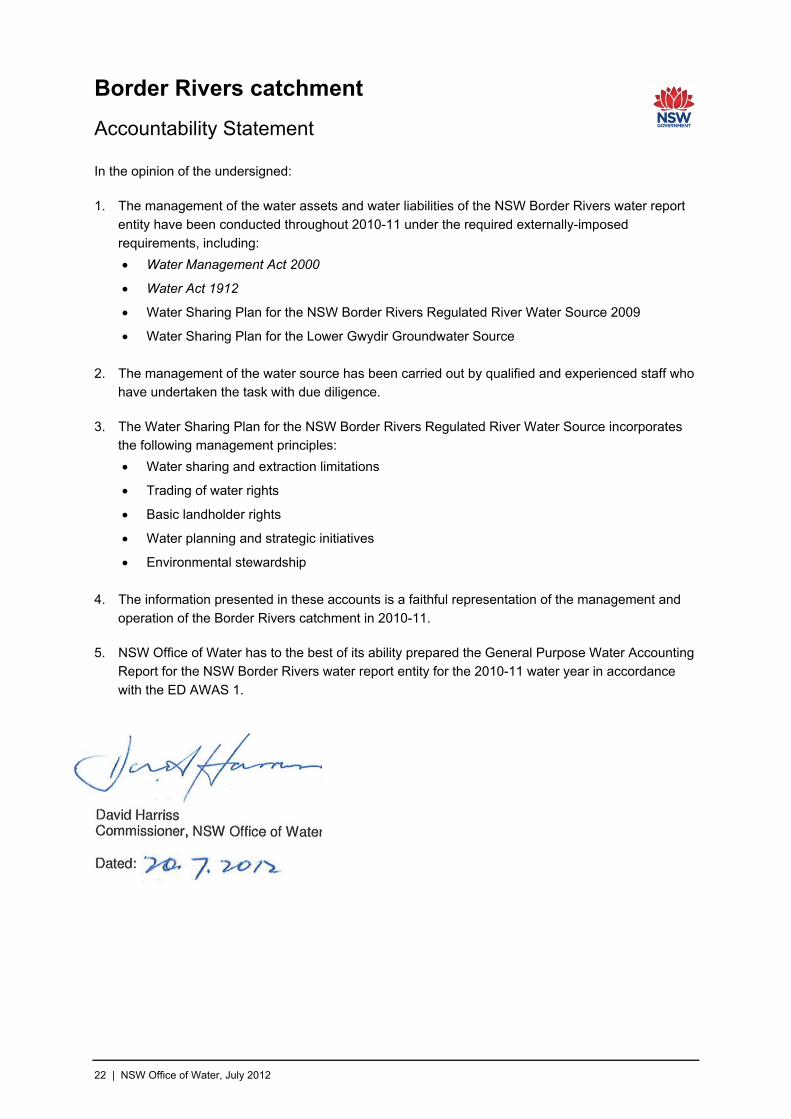
Border Rivers catchment
Accountability Statement
In the opinion of the undersigned:
1. The management of the water assets and water liabilities of the NSW Border Rivers water report entity have been conducted throughout 2010-11 under the required externally-imposed
requirements, including:
Water Management Act 2000
Water Act 1912
Water Sharing Plan for the NSW Border Rivers Regulated River Water Source 2009
Water Sharing Plan for the Lower Gwydir Groundwater Source
2. The management of the water source has been carried out by qualified and experienced staff who have undertaken the task with due diligence.
3. The Water Sharing Plan for the NSW Border Rivers Regulated River Water Source incorporates the following management principles:
Water sharing and extraction limitations
Trading of water rights
Basic landholder rights
Water planning and strategic initiatives
Environmental stewardship
4. The information presented in these accounts is a faithful representation of the management and
operation of the Border Rivers catchment in 2010-11.
5. NSW Office of Water has to the best of its ability prepared the General Purpose Water Accounting Report for the NSW Border Rivers water report entity for the 2010-11 water year in accordance
with the ED AWAS 1.
David Harriss Commissioner, NSW Office of Water
Dated:
22 | NSW Office of Water, July 2012

Border Rivers catchment Water Assets and Water Liabilities For the year ended 30 June 2011 SURFACE WATER ASSETS
1. Surface Water Storage Accuracy Notes 30 June 2011 30 June 2010
Glenlyon Dam A 1 250,930 56,152
Pindari Dam A 1 309,679 78,522
Boggabilla Weir 2,543 2,390
River B 2 8,866 1,278
Total Surface Water Storage (ASWS) 572,018 138,342
Change in Surface Water Storage 433,676 (63,686)
SURFACE WATER LIABILITIES
2. Allocation Account Balance Accuracy Notes 30 June 2011 30 June
2010
General Security A1 3 44 0
General Security (A) A1 3 6,592 542
General Security (B) A1 3 202,870 27,822
Local Water Utility A1 3 0 (29)
Total Allocation Account Balance (LAAB) 209,506 28,335
Change in Allocation Account Balance 181,171 (24,792)
3. Environmental Stimulus Flow Account Balance Accuracy Notes 30 June 2011 30 June
2010
Stimulus Flow Account (LESF) A1 20 8,000 4,000
Change in Environmental Stimulus Flow Account Balance 4,000 4,000
Net Surface Water Assets (ASWS ‐ LSWS ‐ LESF) 354,512 106,007
Change in Net Surface Water Assets 248,505 (42,894)
GROUNDWATER ASSETS AND GROUNDWATER LIABILITIES
As ‘Method C ‘ was the only groundwater accounting method implemented for the 2010‐11 GPWAR, no assets or liabilities
have been recognised. See Note 9 for further information.
23 | NSW Office of Water, July 2012

Border Rivers catchment Changes in Water Assets and Water Liabilities For the year ended 30 June 2011 (1 of 2) 1. Changes in Surface Water Storage (Physical Water Balance)
Surface Water Storage Increases Accuracy Notes 2010‐11 2009‐10 Glenlyon Dam
Inflow A 4 354,825 20,714 Rainfall B 5 670 687
Pindari Dam Inflow A 4 572,337 50,304 Rainfall B 5 1,013 600
River Rainfall C 6 22,814 8,709 Inflow from Releases A 14 488,914 117,062 Tributary inflow
Gauged Inflow A 7 2,488,644 219,327 Ungauged Inflow C 8 615,000 95,000
Inflow from Macintyre Brook regulated system A 7 457,820 27,802 Total Surface Water Storage Increases (ISWS) 5,002,037 540,205
Surface Water Storage Decreases Accuracy Notes 2010‐11 2009‐10
Glenlyon Dam Releases A 14 150,219 15,801 Evaporation B 5 10,498 9,920
Pindari Dam Releases (Other) A 14 310,131 86,286 Releases (Transparent) A 14 28,564 14,975 Evaporation B 5 3,498 5,346
River Evaporation C 6 34,171 26,055 Flows Leaving System A 10
Boomi River (Other) 145,573 4,485 Boomi River (Replenishment) 0 3,591 End of System 1,394,788 217,618
NSW Licenced Extractions A 11 Domestic and Stock (Domestic) 0 3 Domestic and Stock (Stock) 2 54 Domestic and Stock (D&S) 343 676 General Security (A) 15,254 13,966 General Security (B) 53,393 47,581 High Security 152 191 Local Water Utility 398 597 Supplementary Extractions A 16 94,176 0
Basic Rights Extractions C 12 8,000 8,000 QLD Extractions A 15
Regulated 30,558 20,988 Unsupplemented 160,207 44,171
Total Surface Water Storage Decreases (DSWS) 2,439,925 520,304 Unaccounted Volume (Balancing Item) (USWS) D 18 2,128,436 83,587
Net Surface Water Storage Inflow (ISWS ‐ DSWS ‐ USWS) 433,676 (63,686)
24 | NSW Office of Water, July 2012
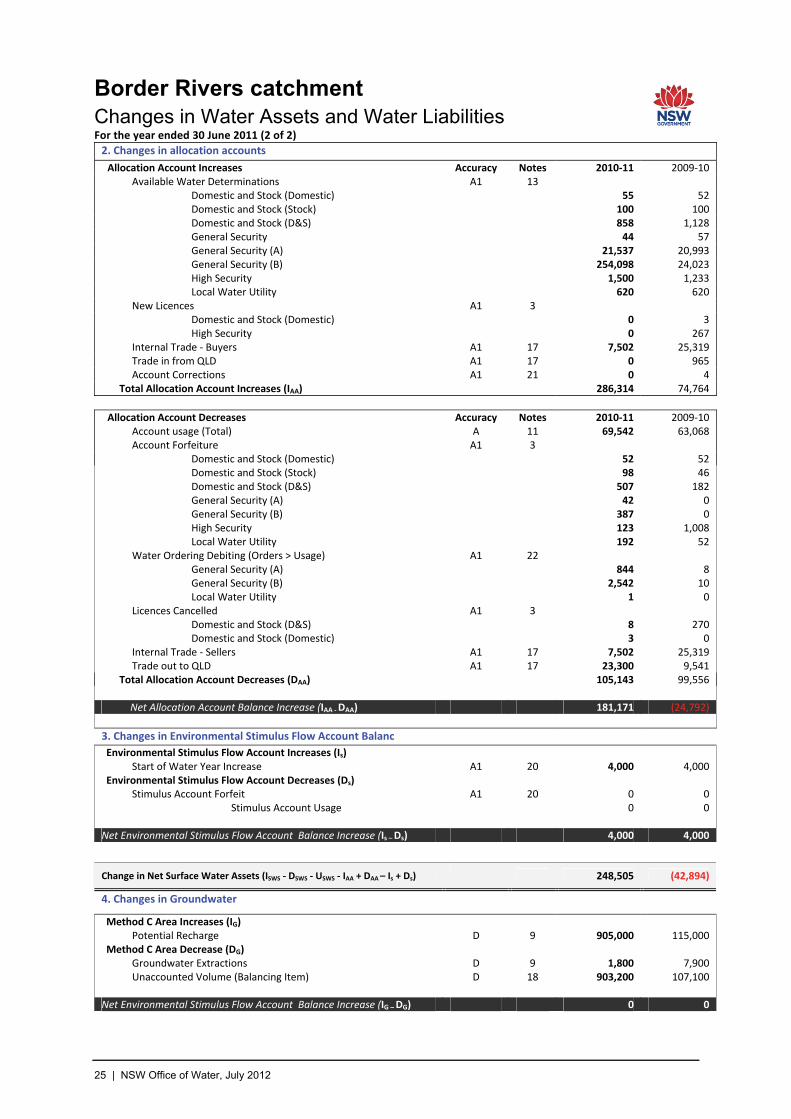
Border Rivers catchment Changes in Water Assets and Water Liabilities For the year ended 30 June 2011 (2 of 2)
2. Changes in allocation accounts
Allocation Account Increases Accuracy Notes 2010‐11 2009‐10 Available Water Determinations A1 13
Domestic and Stock (Domestic) 55 52 Domestic and Stock (Stock) 100 100 Domestic and Stock (D&S) 858 1,128 General Security 44 57 General Security (A) 21,537 20,993 General Security (B) 254,098 24,023 High Security 1,500 1,233 Local Water Utility 620 620
New Licences A1 3 Domestic and Stock (Domestic) 0 3 High Security 0 267
Internal Trade ‐ Buyers A1 17 7,502 25,319 Trade in from QLD A1 17 0 965 Account Corrections A1 21 0 4
Total Allocation Account Increases (IAA) 286,314 74,764
Allocation Account Decreases Accuracy Notes 2010‐11 2009‐10 Account usage (Total) A 11 69,542 63,068 Account Forfeiture A1 3
Domestic and Stock (Domestic) 52 52 Domestic and Stock (Stock) 98 46 Domestic and Stock (D&S) 507 182 General Security (A) 42 0 General Security (B) 387 0 High Security 123 1,008 Local Water Utility 192 52
Water Ordering Debiting (Orders > Usage) A1 22 General Security (A) 844 8 General Security (B) 2,542 10 Local Water Utility 1 0
Licences Cancelled A1 3 Domestic and Stock (D&S) 8 270 Domestic and Stock (Domestic) 3 0
Internal Trade ‐ Sellers A1 17 7,502 25,319 Trade out to QLD A1 17 23,300 9,541
Total Allocation Account Decreases (DAA) 105,143 99,556
Net Allocation Account Balance Increase (IAA ‐ DAA) 181,171 (24,792)
3. Changes in Environmental Stimulus Flow Account Balanc
Environmental Stimulus Flow Account Increases (Is) Start of Water Year Increase A1 20 4,000 4,000
Environmental Stimulus Flow Account Decreases (Ds) Stimulus Account Forfeit A1 20 0 0
Stimulus Account Usage 0 0
Net Environmental Stimulus Flow Account Balance Increase (Is – Ds) 4,000 4,000
Change in Net Surface Water Assets (ISWS ‐ DSWS ‐ USWS ‐ IAA + DAA – Is + Ds) 248,505 (42,894)
4. Changes in Groundwater
Method C Area Increases (IG) Potential Recharge D 9 905,000 115,000
Method C Area Decrease (DG) Groundwater Extractions D 9 1,800 7,900 Unaccounted Volume (Balancing Item) D 18 903,200 107,100
Net Environmental Stimulus Flow Account Balance Increase (IG – DG) 0 0
25 | NSW Office of Water, July 2012

Bor
der
Riv
ers
catc
hmen
t: P
hysi
cal f
low
s m
ass
bala
nce
diag
ram
201
0-11
Boomi River Offtake
145,573
Evaporation
3,498
338,695
Release
Inflow
572,337
Rainfall
1,013
01/07/10: 78,522
01/07/11: 309,679
Change: 231,157
Glenlyon Dam
Macintyre River
01/07/10: 1,278
01/07/11: 8,866 Change: 7,588
End of System
1,394,788
All figures in megalitres
Weir
Major Storage
Outflow
Inflow
River Inflows
Rainfall: 22,814
Gauged Inflow: 2,138,691
Ungauged Inflow: 615,000
Inflow from Mcintyre Brook Regulated System: 457,820
Evaporation: 34,171
NSW
Extractions: 69,542
QLD
Extractions: 190,765
Basic Rights: 8,000
Supplementary Licenced Extractions: 94,176
River Outflows
Unaccounted difference
2,128,436
Severn River
Dumaresq
River
01/07/10: 78,522
01/07/11: 309,679
Change: 231,157
Boogabilla W
eir
Rainfall
Evaporation
10,498
Inflow
354,825
670
Release
150,219
01/07/10: 56,152
01/07/11: 250,930
Change: 194,778
Pindari D
am
Inflow to M
cintyre River
349,953
26 |
NS
W O
ffice
of W
ater
, Jul
y 20
12

Note disclosures
27 | NSW Office of Water, July 2012
28 | NSW Office of Water, July 2012
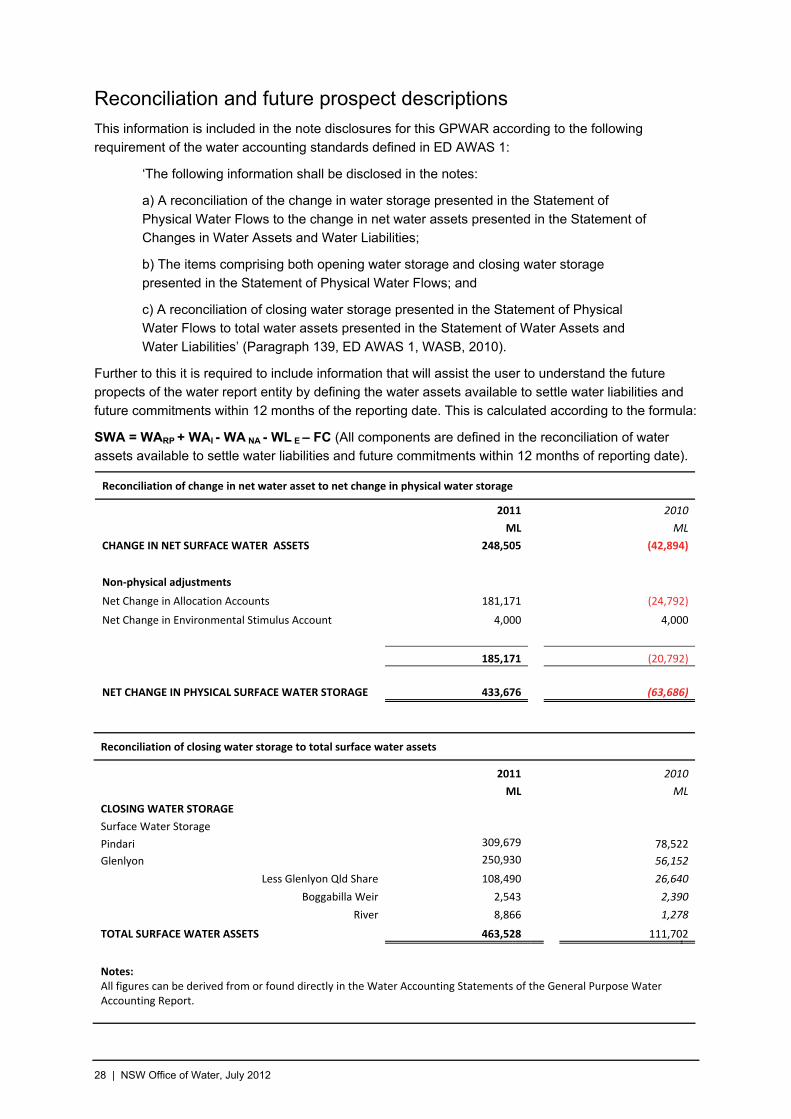
Reconciliation and future prospect descriptions
This information is included in the note disclosures for this GPWAR according to the following
requirement of the water accounting standards defined in ED AWAS 1:
‘The following information shall be disclosed in the notes:
a) A reconciliation of the change in water storage presented in the Statement of
Physical Water Flows to the change in net water assets presented in the Statement of Changes in Water Assets and Water Liabilities;
b) The items comprising both opening water storage and closing water storage
presented in the Statement of Physical Water Flows; and
c) A reconciliation of closing water storage presented in the Statement of Physical Water Flows to total water assets presented in the Statement of Water Assets and
Water Liabilities’ (Paragraph 139, ED AWAS 1, WASB, 2010).
Further to this it is required to include information that will assist the user to understand the future propects of the water report entity by defining the water assets available to settle water liabilities and
future commitments within 12 months of the reporting date. This is calculated according to the formula:
SWA = WARP + WAI - WA NA - WL E – FC (All components are defined in the reconciliation of water assets available to settle water liabilities and future commitments within 12 months of reporting date).
Reconciliation of change in net water asset to net change in physical water storage
2011 2010
ML ML
CHANGE IN NET SURFACE WATER ASSETS 248,505 (42,894)
Non‐physical adjustments
Net Change in Allocation Accounts 181,171 (24,792)
Net Change in Environmental Stimulus Account 4,000 4,000
185,171 (20,792)
NET CHANGE IN PHYSICAL SURFACE WATER STORAGE 433,676 (63,686)
Reconciliation of closing water storage to total surface water assets
2011 2010
ML ML
CLOSING WATER STORAGE
Surface Water Storage
Pindari 309,679 78,522
Glenlyon 250,930 56,152
Less Glenlyon Qld Share 108,490 26,640
Boggabilla Weir 2,543 2,390
River 8,866 1,278
TOTAL SURFACE WATER ASSETS 463,528 111,702
Notes: All figures can be derived from or found directly in the Water Accounting Statements of the General Purpose Water Accounting Report.
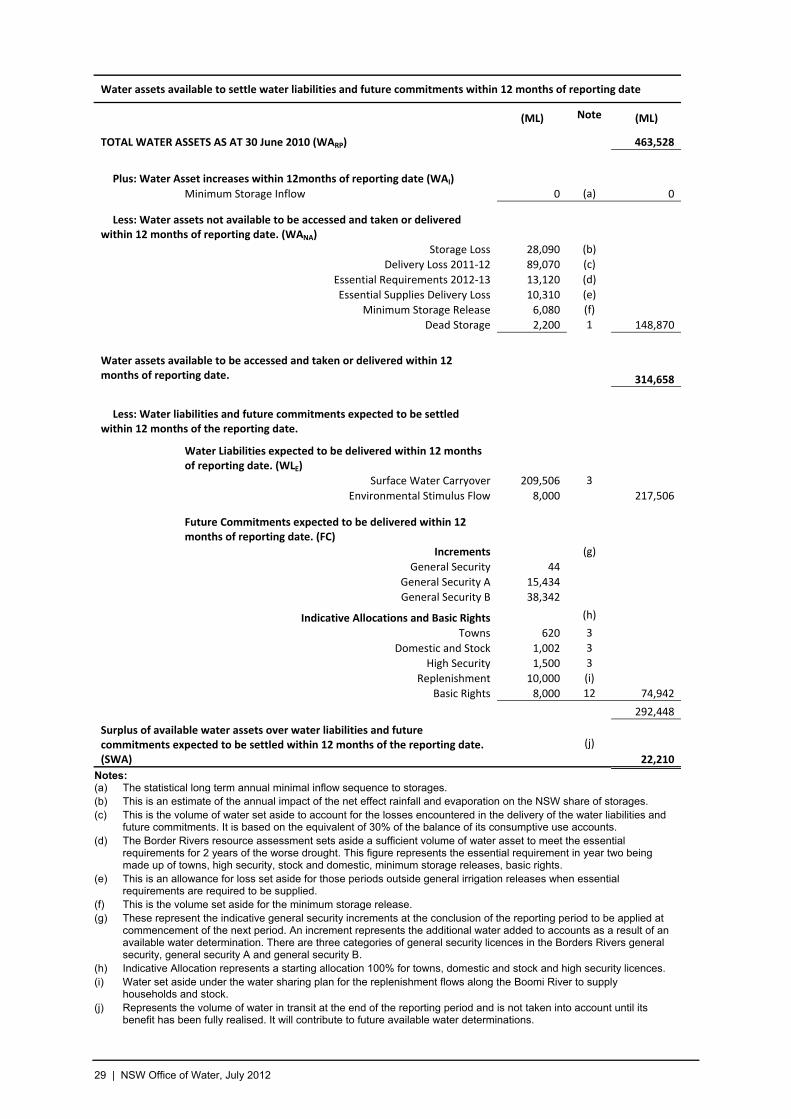
Water assets available to settle water liabilities and future commitments within 12 months of reporting date
(ML) Note (ML)
TOTAL WATER ASSETS AS AT 30 June 2010 (WARP) 463,528
Plus: Water Asset increases within 12months of reporting date (WAI)
Minimum Storage Inflow 0 (a) 0
Less: Water assets not available to be accessed and taken or delivered within 12 months of reporting date. (WANA)
Storage Loss 28,090 (b)
Delivery Loss 2011‐12 89,070 (c)
Essential Requirements 2012‐13 13,120 (d)
Essential Supplies Delivery Loss 10,310 (e)
Minimum Storage Release 6,080 (f)
Dead Storage 2,200 1 148,870
Water assets available to be accessed and taken or delivered within 12 months of reporting date.
314,658
Less: Water liabilities and future commitments expected to be settled within 12 months of the reporting date.
Water Liabilities expected to be delivered within 12 months of reporting date. (WLE)
Surface Water Carryover 209,506 3
Environmental Stimulus Flow 8,000 217,506
Future Commitments expected to be delivered within 12 months of reporting date. (FC)
Increments (g)
General Security 44
General Security A 15,434
General Security B 38,342
Indicative Allocations and Basic Rights (h)
Towns 620 3
Domestic and Stock 1,002 3
High Security 1,500 3
Replenishment 10,000 (i)
Basic Rights 8,000 12 74,942
292,448
Surplus of available water assets over water liabilities and future commitments expected to be settled within 12 months of the reporting date. (SWA)
(j)
22,210
Notes: (a) The statistical long term annual minimal inflow sequence to storages. (b) This is an estimate of the annual impact of the net effect rainfall and evaporation on the NSW share of storages. (c) This is the volume of water set aside to account for the losses encountered in the delivery of the water liabilities and
future commitments. It is based on the equivalent of 30% of the balance of its consumptive use accounts. (d) The Border Rivers resource assessment sets aside a sufficient volume of water asset to meet the essential
requirements for 2 years of the worse drought. This figure represents the essential requirement in year two being made up of towns, high security, stock and domestic, minimum storage releases, basic rights.
(e) This is an allowance for loss set aside for those periods outside general irrigation releases when essential requirements are required to be supplied.
(f) This is the volume set aside for the minimum storage release. (g) These represent the indicative general security increments at the conclusion of the reporting period to be applied at
commencement of the next period. An increment represents the additional water added to accounts as a result of an available water determination. There are three categories of general security licences in the Borders Rivers general security, general security A and general security B.
(h) Indicative Allocation represents a starting allocation 100% for towns, domestic and stock and high security licences. (i) Water set aside under the water sharing plan for the replenishment flows along the Boomi River to supply
households and stock. (j) Represents the volume of water in transit at the end of the reporting period and is not taken into account until its
benefit has been fully realised. It will contribute to future available water determinations.
29 | NSW Office of Water, July 2012
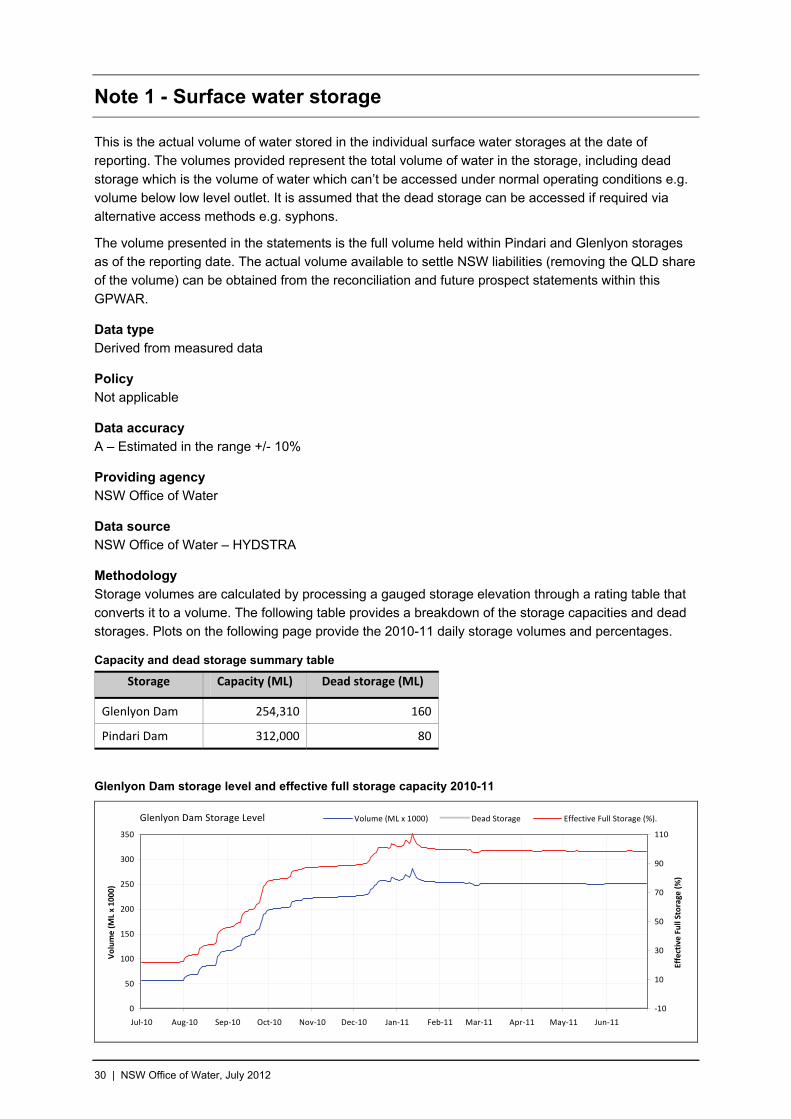
Note 1 - Surface water storage
This is the actual volume of water stored in the individual surface water storages at the date of reporting. The volumes provided represent the total volume of water in the storage, including dead
storage which is the volume of water which can’t be accessed under normal operating conditions e.g. volume below low level outlet. It is assumed that the dead storage can be accessed if required via alternative access methods e.g. syphons.
The volume presented in the statements is the full volume held within Pindari and Glenlyon storages as of the reporting date. The actual volume available to settle NSW liabilities (removing the QLD share of the volume) can be obtained from the reconciliation and future prospect statements within this
GPWAR.
Data type Derived from measured data
Policy Not applicable
Data accuracy A – Estimated in the range +/- 10%
Providing agency NSW Office of Water
Data source NSW Office of Water – HYDSTRA
Methodology Storage volumes are calculated by processing a gauged storage elevation through a rating table that converts it to a volume. The following table provides a breakdown of the storage capacities and dead storages. Plots on the following page provide the 2010-11 daily storage volumes and percentages.
Capacity and dead storage summary table
Storage Capacity (ML) Dead storage (ML)
Glenlyon Dam 254,310 160
Pindari Dam 312,000 80
Glenlyon Dam storage level and effective full storage capacity 2010-11
Glenlyon Dam Storage Level
0
50
100
150
200
250
300
350
Jul‐10 Aug‐10 Sep‐10 Oct‐10 Nov‐10 Dec‐10 Jan‐11 Feb‐11 Mar‐11 Apr‐11 May‐11 Jun‐11
Volume (ML x 1000)
‐10
10
30
50
70
90
110
Effective Full Storage (%)
Volume (ML x 1000) Dead Storage Effective Full Storage (%).
30 | NSW Office of Water, July 2012

Pindari Dam storage level and effective full storage capacity 2010-11
Pindari Dam Storage Level
0
50
100
150
200
250
300
350
Jul‐10 Aug‐10 Sep‐10 Oct‐10 Nov‐10 Dec‐10 Jan‐11 Feb‐11 Mar‐11 Apr‐11 May‐11 Jun‐11
Volume (ML x 1000)
‐10
10
30
50
70
90
110
Effective Full Storage (%)
Volume (ML x 1000) Dead Storage Effective Full Storage (%).
31 | NSW Office of Water, July 2012
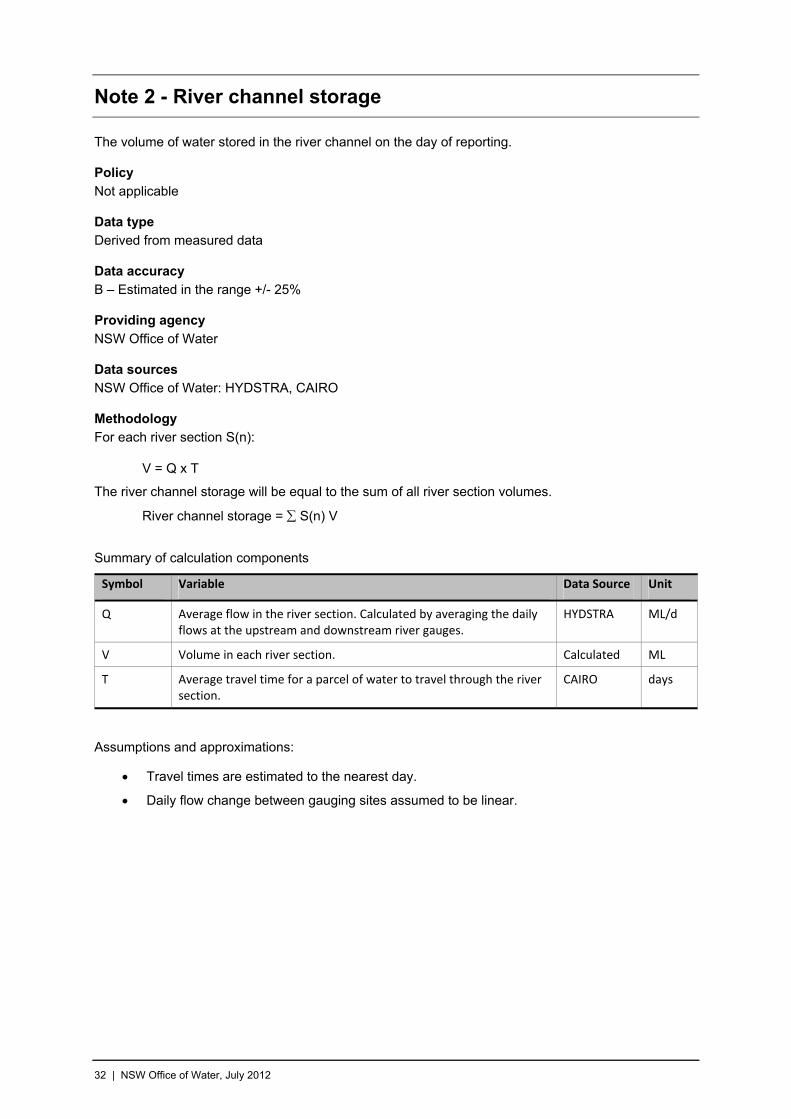
Note 2 - River channel storage
The volume of water stored in the river channel on the day of reporting.
Policy Not applicable
Data type Derived from measured data
Data accuracy B – Estimated in the range +/- 25%
Providing agency NSW Office of Water
Data sources NSW Office of Water: HYDSTRA, CAIRO
Methodology For each river section S(n):
V = Q x T
The river channel storage will be equal to the sum of all river section volumes.
River channel storage = S(n) V
Summary of calculation components
Symbol Variable Data Source Unit
Q Average flow in the river section. Calculated by averaging the daily flows at the upstream and downstream river gauges.
HYDSTRA ML/d
V Volume in each river section. Calculated ML
T Average travel time for a parcel of water to travel through the river section.
CAIRO days
Assumptions and approximations:
Travel times are estimated to the nearest day.
Daily flow change between gauging sites assumed to be linear.
32 | NSW Office of Water, July 2012

Additional information
Breakdown of 2010-11 river volume estimate
UPSTREAM DOWNSTREAM
Site Flow (ML/d) Site Flow (ML/d)
Average Flow (ML/D)
Travel Time (days)
Volume (ML)
Dumaresq
Glenlyon Dam 0 Roseneath 280 140 1 140
Roseneath 280 Bonshaw Weir 325 303 1 303
Bonshaw Weir 325 Glenarbon 447 386 1 386
Dumeresq Total 829
Severn
Pindari Dam 74 Ashford 222 148 1 148
Severn Total 148
Mcintyre
Holdfast 869 Boggabilla Weir 1,609 1,239 1 1,239
Boggabilla Weir 1,609 Terrawah 1,381 1,495 2 2,990
Terrawah 1,381 Boomi Weir 581 981 1 981
Boomi Weir 581 Kanowna 585 583 2 1,166
Kanowna 585 Mungindi 928 757 2 1,513
Mcintyre Total 8 7,889
Total Volume 8,866
33 | NSW Office of Water, July 2012
Note 3 - Allocation accounts
These represent the volume of water that is in the licence allocation accounts and the amount that is to be carried forward to the following water year at the time of reporting. It is the volume of water that
is yet to be extracted from the accounts. The balance in accounts at the end of the water year, being a net balance for the licence category, represents that water that can be carried forward to the next water year and therefore is dictated by carryover rules. Carryover rules determined for licence
categories will dictate whether water can or cannot carryover to the next year, as well as restrictions on the volume of carryover that is permitted. A negative number indicates that more usage has occurred than has been allocated to the account, and the deficit must be carried over to the next
season.
Water that is in accounts at the end of a water year but is not permitted to be carried over is forfeited and has been represented as a decrease in water liability.
Data type Derived from measured data
Policy
Water Act 1912
Water Sharing Plan for the NSW Border Rivers Regulated River Water Source 2009
Available on the NSW Office of Water website at www.water.nsw.gov.au
Data accuracy A1 – Nil inaccuracy +/- 0%
Providing agency NSW Office of Water
Data source State Water Corporation/NSW Office of Water – Water Accounting System (joint ownership)
Methodology This figure is the sum of the remaining volume of water in individual’s allocation accounts at the conclusion of the water year once all transactions and forfeit rules have been applied to the accounts.
These balances are at the licence category level and represent the water that can be carried forward for use in the next year. Below is list of typical transactions that can apply to an allocation account:
AWD Licenced extractions Forfeiture due to: o Carryover rules o Account spillage as a result of AWD o Licence conversions
Licence conversion Trade of allocation water between accounts
34 | NSW Office of Water, July 2012

35 | NSW Office of Water, July 2012
Additional information The tables on the following page provide a balanced summary of the water allocation accounts for
each category of access licence. Below is a description of each of the table components.
Explanatory information for allocation account summary
Heading Description
Share This is the total volume of entitlement in the specific licence category.
Opening The volume of water that has been carried forward from previous years allocation account.
AWD The total annual volume of water added to the allocation account as a result of allocation assessments.
New Increase in account water as a result of issuing new access licences Licences
Cancelled Decrease in account water as a result of licence cancellation
In Increase in account water as a result of temporary trade in. Assignments
Out Decrease in account water as a result of temporary trade out.
Accountable Volume of water that is extracted or diverted from the river under controlled river conditions and is accountable against the licence.
Extractions Over Order Debit
Volume of water that exceeded the recorded usage for corresponding periods which must also be accountable against the licence (excluding supplementary licence holders)
During Year Forfeit
Account water forfeited throughout the year as a result of the accounting rules specified in the water sharing plan. Forfeited water may occur due to account limits being reached, conversions between licence categories and various types of other licence dealings.
Available The remaining portion of the account balance at the conclusion of the water year that was available to be taken during the reporting period. End of Year
Balance
Non Available That portion of the total account balance that was not available to be taken during the reporting period.
End of Year Forfeit Account water that is forfeited at the end of the water year as a result of carryover rules that restrict the carry forward volume.
Carry Forward This represents the account water that is permitted to be carried forward into the next water year as determined by the carryover rules.
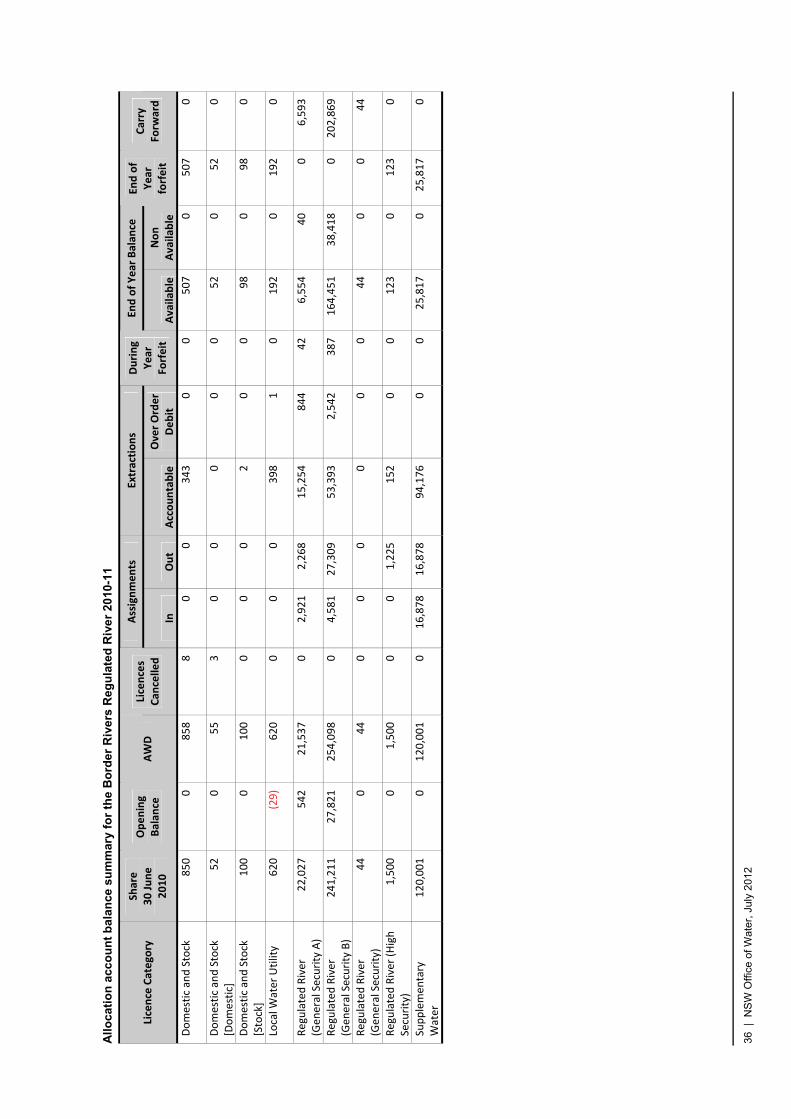
All
oca
tio
n a
cco
un
t b
alan
ce s
um
mar
y fo
r th
e B
ord
er R
iver
s R
egu
late
d R
ive
r 20
10-1
1
Assignments
Extractions
End of Year Balan
ce
Licence Category
Share
30 June
2010
Opening
Balan
ce
AWD
Licences
Can
celled
In
Out
Accountable
Over Order
Debit
During
Year
Forfeit
Available
Non
Available
End of
Year
forfeit
Carry
Forw
ard
Domestic and Stock
850
0
858
8
0
0
343
0
0
507
0
507
0
Domestic and Stock
[Domestic]
52
0
55
3
0
0
0
0
0
52
0
52
0
Domestic and Stock
[Stock]
100
0
100
0
0
0
2
0
0
98
0
98
0
Local W
ater Utility
620
(29)
620
0
0
0
398
1
0
192
0
192
0
Regulated River
(Gen
eral Security A)
22,027
542
21,537
0
2,921
2,268
15,254
844
42
6,554
40
0
6,593
Regulated River
(Gen
eral Security B)
241,211
27,821
254,098
0
4,581
27,309
53,393
2,542
387
164,451
38,418
0
202,869
Regulated River
(Gen
eral Security)
44
0
44
0
0
0
0
0
0
44
0
0
44
Regulated River (High
Security)
1,500
0
1,500
0
0
1,225
152
0
0
123
0
123
0
Supplemen
tary
Water
120,001
0
120,001
0
16,878
16,878
94,176
0
0
25,817
0
25,817
0
36 |
NS
W O
ffice
of W
ater
, Jul
y 20
12
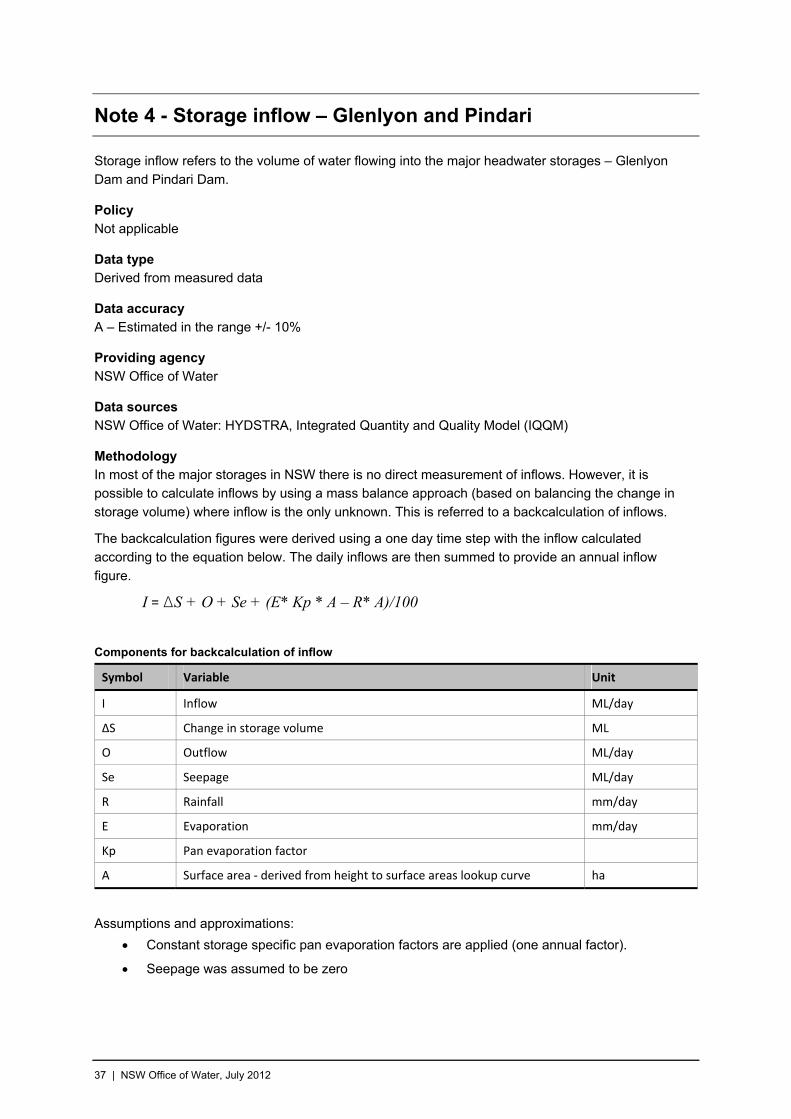
Note 4 - Storage inflow – Glenlyon and Pindari
Storage inflow refers to the volume of water flowing into the major headwater storages – Glenlyon Dam and Pindari Dam.
Policy Not applicable
Data type Derived from measured data
Data accuracy A – Estimated in the range +/- 10%
Providing agency NSW Office of Water
Data sources NSW Office of Water: HYDSTRA, Integrated Quantity and Quality Model (IQQM)
Methodology In most of the major storages in NSW there is no direct measurement of inflows. However, it is possible to calculate inflows by using a mass balance approach (based on balancing the change in
storage volume) where inflow is the only unknown. This is referred to a backcalculation of inflows.
The backcalculation figures were derived using a one day time step with the inflow calculated according to the equation below. The daily inflows are then summed to provide an annual inflow
figure.
I = ΔS + O + Se + (E* Kp * A – R* A)/100
Components for backcalculation of inflow
Symbol Variable Unit
I Inflow ML/day
ΔS Change in storage volume ML
O Outflow ML/day
Se Seepage ML/day
R Rainfall mm/day
E Evaporation mm/day
Kp Pan evaporation factor
A Surface area ‐ derived from height to surface areas lookup curve ha
Assumptions and approximations:
Constant storage specific pan evaporation factors are applied (one annual factor).
Seepage was assumed to be zero
37 | NSW Office of Water, July 2012

Additional information
Glenlyon Dam backcalculated inflows 2010-11
Glenlyon Dam backcalculated inflows
0
2,000
4,000
6,000
8,000
10,000
12,000
14,000
16,000
18,000
20,000
22,000
24,000
26,000
1/07/2010
1/08/2010
1/09/2010
1/10/2010
1/11/2010
1/12/2010
1/01/2011
1/02/2011
1/03/2011
1/04/2011
1/05/2011
1/06/2011
Inflow (ML/d)
Pindari Dam backcalculated inflows 2010-11
05,000
10,000
15,00020,000
25,000
30,00035,000
40,00045,000
50,000
55,00060,000
65,000
70,00075,000
1/07/2010
1/08/2010
1/09/2010
1/10/2010
1/11/2010
1/12/2010
1/01/2011
1/02/2011
1/03/2011
1/04/2011
1/05/2011
1/06/2011
Inflow (ML/d)
Pindari Dam backcalculated inflows
38 | NSW Office of Water, July 2012

Note 5 - Storage evaporation and storage rainfall
This refers to the volumetric change at Glenlyon and Pindari Dams resulting from either the lost as a result of evaporation, or gained as a result of rainfall.
Data type Derived from measured data
Policy Not applicable
Data accuracy B – Estimated in the range +/- 25%
Providing agency NSW Office of Water
Data source NSW Office of Water – IQQM backcalculation, HYDSTRA
Methodology While the backcalculation program within IQQM requires the effect of evaporation and rainfall on the storage to be calculated, it is currently output as a net evaporation figure. The ED AWAS 1 specifies
that off-setting should be avoided and as such, a further calculation was required to split the net evaporation figure to rainfall and evaporation. This is achieved by first, outputting daily time-series of storage surface area from the backcalculation (which uses a height to area lookup curve as defined in
HYDSTRA). Daily rainfall and evaporation data is then applied to the area time-series to achieve a volume in megalitres which is then aggregated to an annual figure. The rainfall and evaporation data utilised is equivalent to the data used in the storage inflow backcalculation, with the same pan factor
applied to the evaporation data.
Rainfall: Volume (ML) = Rainfall (mm) x Area (m2) x 10-6
Evaporation: Volume (ML) = Pan Evaporation (mm) x Pan Factor x Area (m2) x 10-6
Pan factors utilised for calculation
Storage Pan factor applied
Glenlyon 1.0
Pindari 1.0
39 | NSW Office of Water, July 2012

Note 6 - River evaporation and river rainfall
This refers to the volumetric change on the accounted river reach that is either lost as a result of evaporation, or gained as a result of rainfall.
Data type
Derived from measured data
Policy Not applicable
Data accuracy C – Estimated in the range +/- 50%
Providing agency NSW Office of Water
Data source NSW Office of Water: HYDSTRA, ARCGIS
QLD Department of Natural Resources: SILO
Methodology The volume applied for evaporation and rainfall on the regulated river is achieved by first calculating a daily time-series of river area. This is achieved by breaking the river up into reaches and utilising the cross sections recorded at river gauging locations to determine the average width of the river with a
given daily flow. River length is then determined between two gauging locations using ARCGIS and as such an area for each reach can be defined.
Area (m2) = Average W (m) x L (m)
Where W is the daily width determined from the gauging cross sections and L is the length as determined through ARCGIS analysis.
With daily area determined, various climate stations are then selected based on their proximity to each
river reach. Rainfall and evaporation data is then extracted from SILO and applied to the area time-series to achieve a volume in megalitres which is then aggregated to an annual figure.
Rainfall: Volume (ML) = Rainfall (mm) x Area (m2) x 10-6
Evaporation: Volume (ML) = ET0 (mm) x Kc x Area (m2) x 10-6
Where ET0 = reference evapotranspiration from SILO and Kc = crop factor for open water (1.05)
40 | NSW Office of Water, July 2012

Note 7 - Tributary inflow
The inflow into the regulated river that occurs downstream of the headwater storages that is measured at known gauging stations.
Policy Not applicable
Data type Measured data
Data accuracy A – Estimated in the range +/- 10%
Providing agency NSW Office of Water
Data sources NSW Office of Water: HYDSTRA
Methodology The flows are obtained by measuring river heights at gauging stations along the river, and then passing these heights through a rating table that converts them to a daily flow volume.
Additional information The total gauged inflow for 2010-11 is the sum of the inflows for the gauged tributaries defined in the table below.
Summary of gauged tributary inflow 2010-11
Station Area (km2) Volume (ML)
416008 Beardy River at Haystack 866 217,530
416010 Macintyre River at Wallangra 2,020 349,953
416021 Frazers Creek at Westholme (Ashford) 804 159,659
416032 Mole river at Donaldson 1,610 493,485
416415A Macintyre Brook at Booba Sands* 4,092* 457,820
416207A Weir River at Mascot 13,500 726,088
416310A Dumaresq River at Farnbro 1,309 444,387
416312A Oaky creek at Texas 422 75,067
416305B Brush Creek at Beebo 335 22,476
Total Gauged Tributaries Inflow 2,946,464
*End of System gauge for regulated Macintyre Brook
41 | NSW Office of Water, July 2012

Note 8 - Ungauged runoff estimate
The estimated inflow into the river that occurs downstream of the headwater storages that is not measured.
Policy Not applicable
Data type Estimated
Data accuracy
C – Estimated in the range +/- 50%
Providing agency NSW Office of Water
Data sources NSW Office of Water, Statewater: CAIRO
Methodology The amount of ungauged catchment runoff contributing volume to the river asset was estimated using the gauged flow information, the relative catchment area’s and a climatic factor to account for rainfall
differentiation across the catchments.
The methodology assumes that runoff events in the gauged sub-catchments respond similar to rainfall events in ungauged sub-catchments subject to area and rainfall volume.
UE = ((GI x Au)/Ag) x RF
Where
UE = Ungauged estimate
GI = Total gauged inflow from representative sub-catchments 2010-11
Au = Area of contributing ungauged catchment
Ag = Area of representative gauged sub-catchments
RF = Rainfall factor (estimated total rainfall in ungauged area / estimated total rainfall in gauged areas)
For the purposes of this calculation, catchment areas and runoff for Pindari dam, Glenlyon Dam and the Macintyre Brook regulated system were excluded. Ungauged contribution to the accounting entity downstream of Boggabilla was assumed to be zero. The rainfall factor used was 0.79, based on
comparing the rainfall in 2010-11 at Tenterfield (assumed representative of gauged areas) with the rainfall that fell at Pindari Dam (assumed representative of ungauged areas).
42 | NSW Office of Water, July 2012
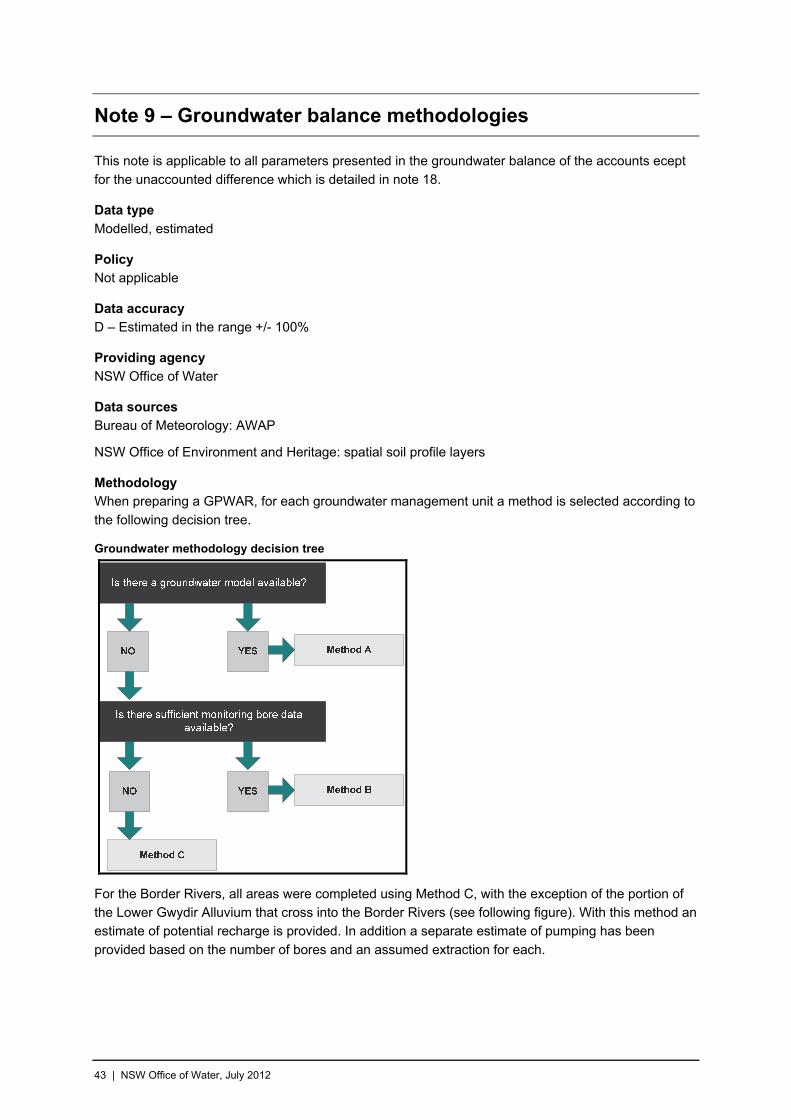
Note 9 – Groundwater balance methodologies
This note is applicable to all parameters presented in the groundwater balance of the accounts ecept for the unaccounted difference which is detailed in note 18.
Data type Modelled, estimated
Policy Not applicable
Data accuracy D – Estimated in the range +/- 100%
Providing agency NSW Office of Water
Data sources Bureau of Meteorology: AWAP
NSW Office of Environment and Heritage: spatial soil profile layers
Methodology When preparing a GPWAR, for each groundwater management unit a method is selected according to
the following decision tree.
Groundwater methodology decision tree
For the Border Rivers, all areas were completed using Method C, with the exception of the portion of the Lower Gwydir Alluvium that cross into the Border Rivers (see following figure). With this method an estimate of potential recharge is provided. In addition a separate estimate of pumping has been
provided based on the number of bores and an assumed extraction for each.
43 | NSW Office of Water, July 2012

Groundwater methodologies utilised for 2010-11
METHOD A (MODFLOW) – NOT UTILISED
Description MODFLOW is a three-dimensional finite-difference groundwater flow model that was developed by the United States Geological Survey and is the most widely used program in the world for simulating
ground-water. It has a modular structure that allows it to be easily modified to adapt the code for a particular application.
MODFLOW is used to simulate steady and non steady flow in an irregularly shaped flow system in
which aquifer layers can be confined, unconfined, or a combination of confined and unconfined. Flow from external stresses, such as flow to wells, areal recharge, evapotranspiration, flow to drains, and flow through river beds, can be simulated.
The input data required by the model includes rainfall, groundwater pumping, interactions between the shallow groundwater system and the river system and evapotranspiration.
METHOD B (Water table fluctuation) - NOT UTILISED
Description The water table fluctuation method is based on the premise that the rises in groundwater levels in unconfined aquifers are due to recharge water arriving at the water table and links the change in
groundwater storage (∆S) with the resulting water table fluctuations (∆h):
hSS y (1)
Where:
Sy is specific yield of the aquifer
Δh is the change in groundwater levels
44 | NSW Office of Water, July 2012

The employed methodology is based on applying the water table fluctuation method in conjunction with the groundwater water budget method to jointly estimate specific yield and natural recharge in an unconfined aquifer with significant seasonal water table fluctuations. The water budget method
focuses on the various components contributing to groundwater flow and groundwater storage changes (detailed in the figure below) and can be written as:
SQQPGETQQRFR bfoffriveron (2)
Where:
R is direct recharge from rainfall
RF is irrigation return flow
Qon and Qoff are lateral groundwater flow onto and off the groundwater system
Qriver is river seepage recharge
ET is evapotranspiration
PG is abstraction of groundwater by pumping
Qbf is baseflow (groundwater discharge to streams or springs)
∆S is change in groundwater storage.
Schematic diagram showing the flow components of the groundwater budget
Combining equation (1) with equation (2), we obtain:
hSQQPGETQQRFR ybfoffriveron (3)
By applying equation (3) separately to the dry season, during which R=0, and the wet season, we obtain two equations where the specific yield and natural recharge are the only two unknown
parameters:
dryy
drybf
dryoff
drydrydryriver
dryon
dry hSQQPGETQQRF (4)
wety
wetbf
wetoff
wetwetwetriver
weton
wet hSQQPGETQQRFR (5)
With the exception of the specific yield and natural recharge, all other seasonal parameters in
equation (4) and (5) are either known or can somehow be estimated.
45 | NSW Office of Water, July 2012
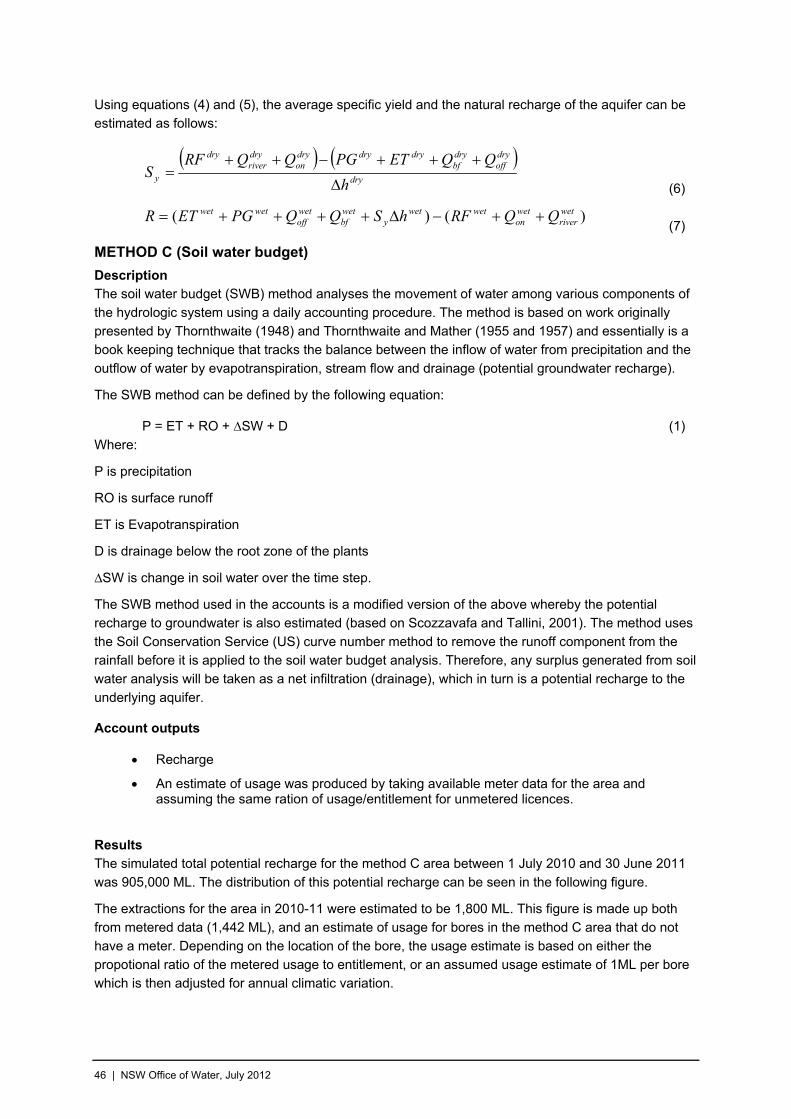
Using equations (4) and (5), the average specific yield and the natural recharge of the aquifer can be estimated as follows:
dry
dryoff
drybf
drydrydryon
dryriver
dry
y h
QQETPGQQRFS
(6)
)()( wetriver
weton
wetwety
wetbf
wetoff
wetwet QQRFhSQQPGETR (7)
METHOD C (Soil water budget)
Description The soil water budget (SWB) method analyses the movement of water among various components of
the hydrologic system using a daily accounting procedure. The method is based on work originally presented by Thornthwaite (1948) and Thornthwaite and Mather (1955 and 1957) and essentially is a book keeping technique that tracks the balance between the inflow of water from precipitation and the
outflow of water by evapotranspiration, stream flow and drainage (potential groundwater recharge).
The SWB method can be defined by the following equation:
P = ET + RO + ∆SW + D (1)
Where:
P is precipitation
RO is surface runoff
ET is Evapotranspiration
D is drainage below the root zone of the plants
∆SW is change in soil water over the time step.
The SWB method used in the accounts is a modified version of the above whereby the potential recharge to groundwater is also estimated (based on Scozzavafa and Tallini, 2001). The method uses
the Soil Conservation Service (US) curve number method to remove the runoff component from the rainfall before it is applied to the soil water budget analysis. Therefore, any surplus generated from soil water analysis will be taken as a net infiltration (drainage), which in turn is a potential recharge to the
underlying aquifer.
Account outputs
Recharge
An estimate of usage was produced by taking available meter data for the area and assuming the same ration of usage/entitlement for unmetered licences.
Results The simulated total potential recharge for the method C area between 1 July 2010 and 30 June 2011
was 905,000 ML. The distribution of this potential recharge can be seen in the following figure.
The extractions for the area in 2010-11 were estimated to be 1,800 ML. This figure is made up both from metered data (1,442 ML), and an estimate of usage for bores in the method C area that do not
have a meter. Depending on the location of the bore, the usage estimate is based on either the propotional ratio of the metered usage to entitlement, or an assumed usage estimate of 1ML per bore which is then adjusted for annual climatic variation.
46 | NSW Office of Water, July 2012

Modelled potential recharge 01 July 2010 to 30 June 2011
47 | NSW Office of Water, July 2012

Note 10 – Flow leaving system/Replenishments
This refers to flow that leaves the entity and does not return to the entity. Replenishment flows refers to water that has been set aside as part of the essential requirements for the provision of flows along the Boomi River to supply water households and stock. The annual requirements and limits associated
with this provision are detailed in the water sharing plan.
Data type Derived from measured data
Policy Not applicable
Data accuracy A – Estimated in the range +/- 10%
Providing agency NSW Office of Water
Data source NSW Office of Water – HYDSTRA
State Water Corporation – Annual compliance report (internal document)
Methodology The end of system flow is calculated by taking the total gauged flow at Mungindi for 2010-11. Significant flow also leaves the entity down the Boomi River which has been measured with the flow
gauge at the Boomi Weir offtake. Water leaving the system down the Boomi River is tagged as Replenishment or other based on information in the State Water Corporation annual compliance report.
Gauging Station Total Measured
Volume (ML)
Replenishment Reported Volume
(ML)
416001 Barwon River at Mungindi 1,394,788
N/A 1,394,788
416037 Boomi River at Boomi Weir Offtake
145,573
0 145,573
Total 1,540,361
48 | NSW Office of Water, July 2012
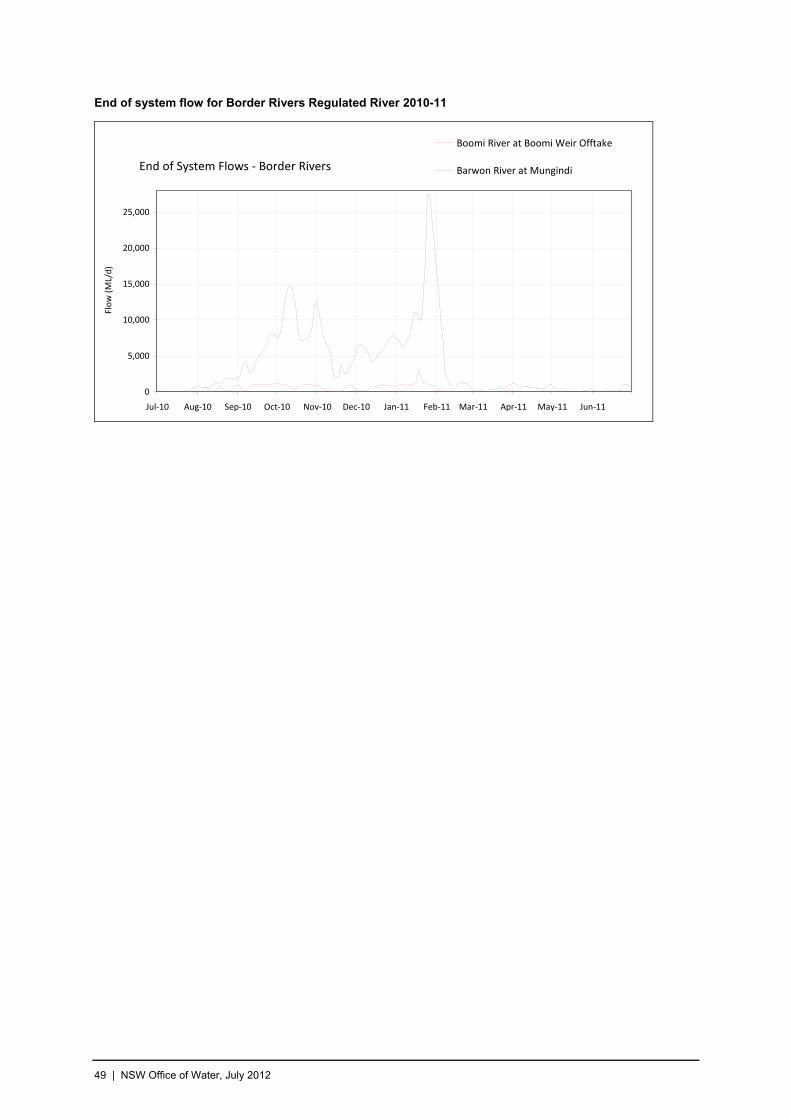
End of system flow for Border Rivers Regulated River 2010-11
End of System Flows ‐ Border Rivers
0
5,000
10,000
15,000
20,000
25,000
Jul‐10 Aug‐10 Sep‐10 Oct‐10 Nov‐10 Dec‐10 Jan‐11 Feb‐11 Mar‐11 Apr‐11 May‐11 Jun‐11
Flow (ML/d)
Boomi River at Boomi Weir Offtake
Barwon River at Mungindi
49 | NSW Office of Water, July 2012
Note 11 – Extractions (NSW)
This refers to the actual volume of water either pumped or diverted from the river or aquifer by NSW licensed users. A separate figure is given for each licence category. For the purposes of this GPWAR extractions have been input to appear in the statements as both the physical removal of the water
from the river asset through pumping (detail broken up by licence category), and also, the associated decrease in liability remaining (water available in the licence holders account) (presented as a consolidated total figure).
Data type Measured data
Policy Not applicable
Data accuracy A – Estimated in the range +/- 10%
Providing agency NSW Office of Water
Data source State Water/NSW Office of Water – Water Accounting System (Joint ownership of system).
NSW Office of Water – Water Ordering and Usage database
Methodology The extraction and diversion data is collected by either on-farm meters that measure extraction or gauges on diversion works. Meter readings are collected for individual licence holders at intervals during the year and converted via a calibration factor to a volume of water extracted. Water diverted
from the river is measured by recording the height at either the gauge or weir with the volume diverted being derived by passing these heights through a rating table. However, with multiple categories of access licences being extracted through the same pumps additional information and methodologies
are required to separate use under the various licence categories. Below is a description of these:
Based on periods of announcement – during periods of supplementary water announcements
extractions can be debited against the Supplementary Water Licences.
Extractions based on water orders – users place orders for water against an access licence and
extractions are debited against accounts in proportion to the orders placed.
Licence Category Apportionment – if no water orders are available water extracted is apportioned against categories of access licence in order of priority as set out in the table below. The prioritising is
based on the nature and rules around each of the licence categories.
The following table provides the order in which extractions are apportioned to access licence
categories. In the table following licensed extractions are apportioned in order of priority starting at priority 1. This is a generic list where not all categories will necessarily appear in this GPWAR. There are also various sub categories of licence associated with some of the categories.
50 | NSW Office of Water, July 2012
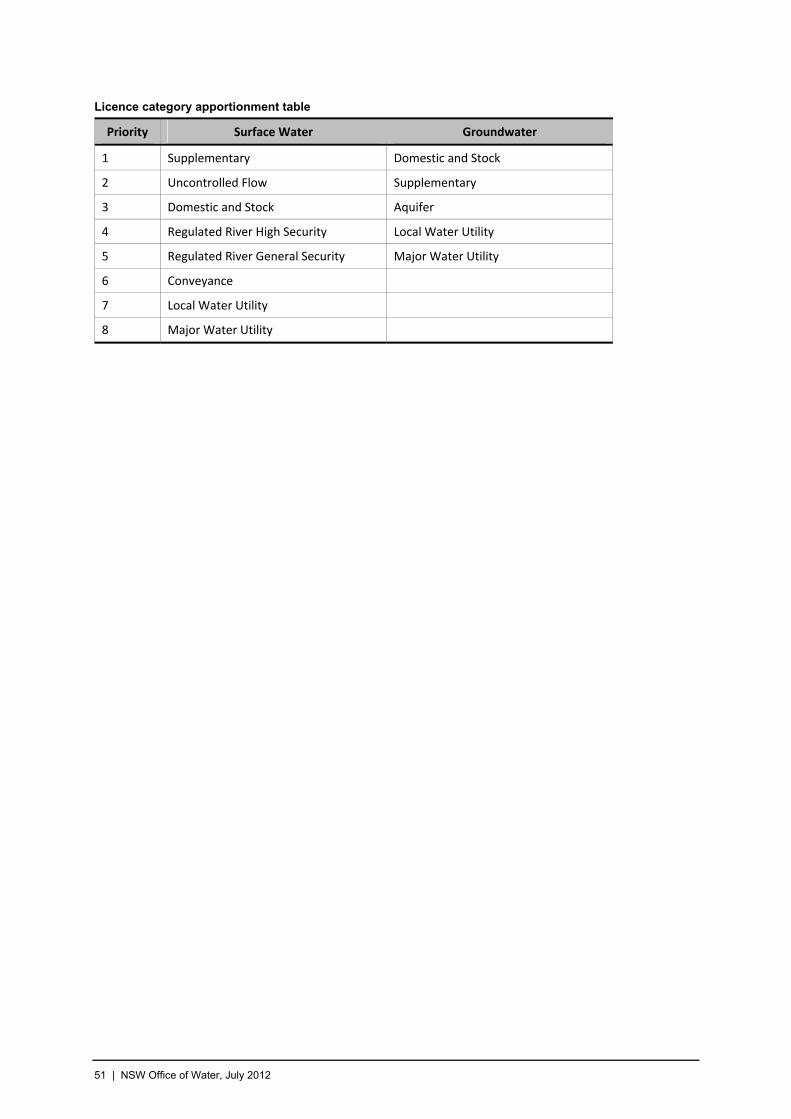
Licence category apportionment table
Priority Surface Water Groundwater
1 Supplementary Domestic and Stock
2 Uncontrolled Flow Supplementary
3 Domestic and Stock Aquifer
4 Regulated River High Security Local Water Utility
5 Regulated River General Security Major Water Utility
6 Conveyance
7 Local Water Utility
8 Major Water Utility
51 | NSW Office of Water, July 2012

Note 12 - Basic rights
This is the non-licensed right to extract water to meet basic requirements for household purposes (non-commercial uses in and around the house and garden) and for watering of stock. It is available for anyone who has access to river frontage on their property.
This water cannot be used for irrigating crops or garden produce that will be sold or bartered, for washing down machinery sheds or for intensive livestock operations.
In times of limited supply, there may be restrictions on taking water for domestic and stock use.
Data Type Estimated
Policy Water Sharing Plan for the Border Rivers Regulated River Water Source 2003
Part 4 Basic Landholder Rights
o Clause 15 Domestic and stock rights Available on the NSW Office of Water website at www.water.nsw.gov.au
Data accuracy C – Estimated in the range +/- 50%
Providing agency NSW Office of Water
Data source Water Sharing Plan for the Border Rivers Regulated River Water Source 2003
Methodology The estimation of domestic and stock rights uses a series of estimates for water usage, stocking rates, population and property shape based on local knowledge to calculate riparian (stock and domestic) requirements in megalitres per year. The annual extraction for Domestic and Stock rights in the water
accounts is assumed to be the estimated figure stated in the Water Sharing Plan for the Border Rivers Regulated River Water Source 2003 (8000 ML).
52 | NSW Office of Water, July 2012

Note 13 - Available Water Determination (AWD) (Allocation Announcement)
This is the process by which the regulated surface water asset available for use within the regulated
system is determined and shared. It determines the volume of water that is to be added to an individuals licence allocation account. Announcements of allocations are made on a seasonal basis - usually corresponding with the financial year and are updated on a regular basis or following
significant inflow events. Under the Water Management Act 2000 the announcements are termed available water determinations, while under the Water Act 1912 this process is known as an allocation announcement.
Data type Derived from measured data.
Policy
Water Act 1912.
Water Management Act 2000 (NSW).
Chapter 3 – Part 2 Access Licences.
o Clause 59 – Available Water Determinations.
Water Sharing Plan for the Border Rivers Regulated River Water Source 2003.
Part 8 – Limits to the availability of water
o Division 2 – Available Water Determinations.
Available on the NSW Office of Water website at www.water.nsw.gov.au
Data accuracy A1 – Nil inaccuracy +/- 0%
Providing agency NSW Office of Water.
Data source State Water/NSW Office of Water – Water Accounting System (Joint ownership of system).
Available Water Determination Register - NSW Office of Water website at www.water.nsw.gov.au
Methodology In the Border Rivers Regulated Water Source AWD’s are calculated by looking specifically at NSW share of the resource. The concept of continuous accounting is used which assesses the resource (water) contained in the headwaters storage, periodically updating projections and distributing the
regulated (stored) resource available. All projections are for two (2) years from the date of the assessment. It is important to note that under continuous accounting the AWD’s are based on the actual volume of water in storage at the time of the resource assessment and does not account for
sequences of future inflows.
Each assessment process firstly involves the assessment of the effective storage, being the available storage volume after storage losses are accounted for. This is to account for the fact that storage
losses cannot be controlled by a management rule and, therefore, must be provided for first. Following this existing commitments are taken into account and then any uncommitted water is first committed to essential supplies including any environmental commitments, then added to the delivery loss account
to targeting a volume equivalent to a maximum of 30% of the deliverable general security. Any
53 | NSW Office of Water, July 2012

54 | NSW Office of Water, July 2012
remaining uncommitted water is then shared in proportion to the amount of entitlement in the remaining resource categories.
The essential supplies mentioned above consist of items such as stock and domestic requirements,
Local Water Utilities (e.g. town water supplies, industrial use), High Security (permanent plantings e.g. orchards, vineyards), end of system flow requirement resulting from the system operation and minimum storage releases.
The volume of water distributed to licence categories is expressed as either a volume per share or as a percentage of share component depending on the category of licence. The following table details each licence category and how it is announced.
Priority of access licence categories
Licence Category AWD Priority
General Security Low
High Security High
Conveyance Low
Domestic and Stock* Very High
Local Water Utility Very High
Note: Domestic and Stock is further broken down into three sub categories: Domestic and Stock, Domestic and Stock
(Domestic) and Domestic and Stock (Stock). For the purposes of this report and the general purpose water account they were
all treated as Domestic and Stock
It should be noted that the AWD for supplementary licence accounts is a separate process and is not dependent on water asset available. It is made once at the start of the year and unless there is a
management change due to the growth in use strategy it is maintained at the maximum value prescribed in the plan generally 100% of share component. Therefore it is not considered to create a liability on the system and is only considered in terms of an extraction that reduces the water asset.
Additional information Following is the allocation summary report for 2010-11 and its associated Report Notes.
Allocation Summary Report Notes
Opening Remaining allocation account balances at the conclusion of the previous season that is allowed to be carried forward to this season.
Individual Announcement Actual announcement made to each licence category
Share Component (Entitlement) Sum of the licensed volume of water within the licence category on the announcement date.
Announced Volume Volume of water credited to accounts within a licence category as a result of the announcement made.
Cumulative Volume Cumulative total of the announced volumes for the water year and licence category.
Percent of Share Component (Entitlement)
This is the announced volume expressed as a percentage of the entitlement applicable on the particular date.
Balance Made Available Sum of water available in allocation accounts that has been made available to be taken during the season.
Non Available Balance Water allocated that is not accessible at this point in time.
Supplementary Water Water that is not a stored source of water and is only made available if an uncontrolled flow event occurs.
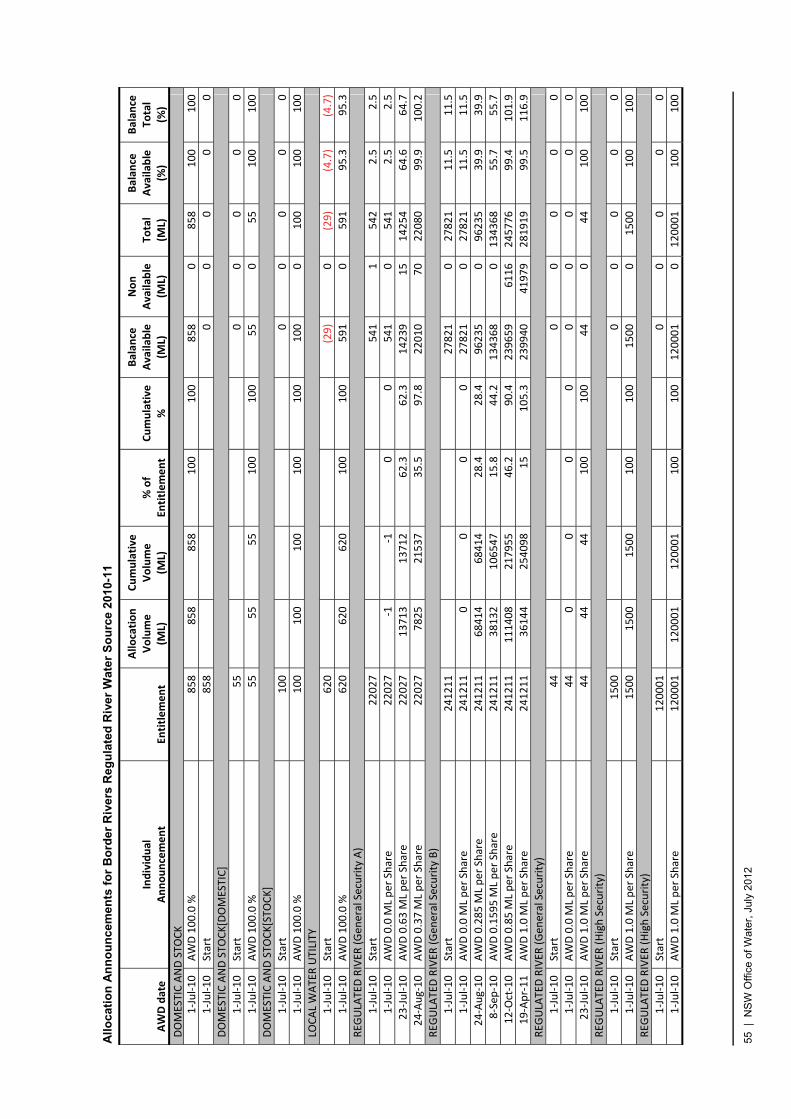
All
oca
tio
n A
nn
ou
nce
men
ts f
or
Bo
rder
Riv
ers
Reg
ula
ted
Riv
er
Wat
er S
ou
rce
201
0-11
AWD date
Individual
Announcement
Entitlement
Allo
cation
Volume
(ML)
Cumulative
Volume
(ML)
% of
Entitlement
Cumulative
%
Balan
ce
Available
(ML)
Non
Available
(ML)
Total
(ML)
Balan
ce
Available
(%)
Balan
ce
Total
(%)
DOMESTIC AND STO
CK
1‐Jul‐10
AWD 100.0 %
858
858
858
100
100
858
0858
100
100
1‐Jul‐10
Start
858
00
00
0
DOMESTIC AND STO
CK[DOMESTIC]
1‐Jul‐10
Start
55
00
00
0
1‐Jul‐10
AWD 100.0 %
55
55
55
100
100
55
055
100
100
DOMESTIC AND STO
CK[STO
CK]
1‐Jul‐10
Start
100
00
00
0
1‐Jul‐10
AWD 100.0 %
100
100
100
100
100
100
0100
100
100
LOCAL WATER UTILITY
1‐Jul‐10
Start
620
(29)
0(29)
(4.7)
(4.7)
1‐Jul‐10
AWD 100.0 %
620
620
620
100
100
591
0591
95.3
95.3
REG
ULATED RIVER
(Gen
eral Security A)
1‐Jul‐10
Start
22027
541
1542
2.5
2.5
1‐Jul‐10
AWD 0.0 M
L per Share
22027
‐1‐1
00
541
0541
2.5
2.5
23‐Jul‐10
AWD 0.63 M
L per Share
22027
13713
13712
62.3
62.3
14239
15
14254
64.6
64.7
24‐Aug‐10
AWD 0.37 M
L per Share
22027
7825
21537
35.5
97.8
22010
70
22080
99.9
100.2
REG
ULATED RIVER
(Gen
eral Security B)
1‐Jul‐10
Start
241211
27821
027821
11.5
11.5
1‐Jul‐10
AWD 0.0 M
L per Share
241211
00
00
27821
027821
11.5
11.5
24‐Aug‐10
AWD 0.285 M
L per Share
241211
68414
68414
28.4
28.4
96235
096235
39.9
39.9
8‐Sep
‐10
AWD 0.1595 M
L per Share
241211
38132
106547
15.8
44.2
134368
0134368
55.7
55.7
12‐Oct‐10
AWD 0.85 M
L per Share
241211
111408
217955
46.2
90.4
239659
6116
245776
99.4
101.9
19‐Apr‐11
AWD 1.0 M
L per Share
241211
36144
254098
15
105.3
239940
41979
281919
99.5
116.9
REG
ULATED RIVER
(Gen
eral Security)
1‐Jul‐10
Start
44
00
00
0
1‐Jul‐10
AWD 0.0 M
L per Share
44
00
00
00
00
0
23‐Jul‐10
AWD 1.0 M
L per Share
44
44
44
100
100
44
044
100
100
REG
ULATED RIVER
(High Security)
1‐Jul‐10
Start
1500
00
00
0
1‐Jul‐10
AWD 1.0 M
L per Share
1500
1500
1500
100
100
1500
01500
100
100
REG
ULATED RIVER
(High Security)
1‐Jul‐10
Start
120001
00
00
0
1‐Jul‐10
AWD 1.0 M
L per Share
120001
120001
120001
100
100
120001
0120001
100
100
55 |
NS
W O
ffice
of W
ater
, Jul
y 20
12

Note 14 – Storage Releases (including transparent releases)
The volume of water released or spilled from either Pindari Dam or Glenlyon Dam. In the accounting this release is represented as both a decrease in the storage asset and an equal increase in asset to the river asset (shown as the combined total release in the line item ‘Inflow from releases’). The policy
for planned environmental water outlined in the water sharing plan requires that a transparent flow of up to 200 ML be released from Pindari dam when a range of specified triggers have been met. Releases that satisfy the translucent release requirement have been presented as a separate sub
component of the total release.
Data type Measured data
Policy Water Sharing Plan for the NSW Border Rivers Regulated River Water Source 2002
Part 3 Environmental Water Provisions
o Clause 12 – Planned Environmental Water
Refer to applicable Water Sharing Plan on NSW Office of Water website at www.water.nsw.gov.au
Data accuracy A – Estimated in the range +/- 10%
Providing agency NSW Office of Water
Data source NSW Office of Water – HYDSTRA database
State Water Corporation Annual Compliance Report (internal document)
Methodology
Storage Releases for Pindari Dam and Glenlyon Dam 2010-11
Storage Dam Releases
0
10,000
20,000
30,000
40,000
50,000
60,000
70,000
80,000
1/07/10
1/08/10
1/09/10
1/10/10
1/11/10
1/12/10
1/01/11
1/02/11
1/03/11
1/04/11
1/05/11
1/06/11
Release (ML/d)
Glenlyon Dam releases (ML) Pindari Dam releases (ML)
56 | NSW Office of Water, July 2012
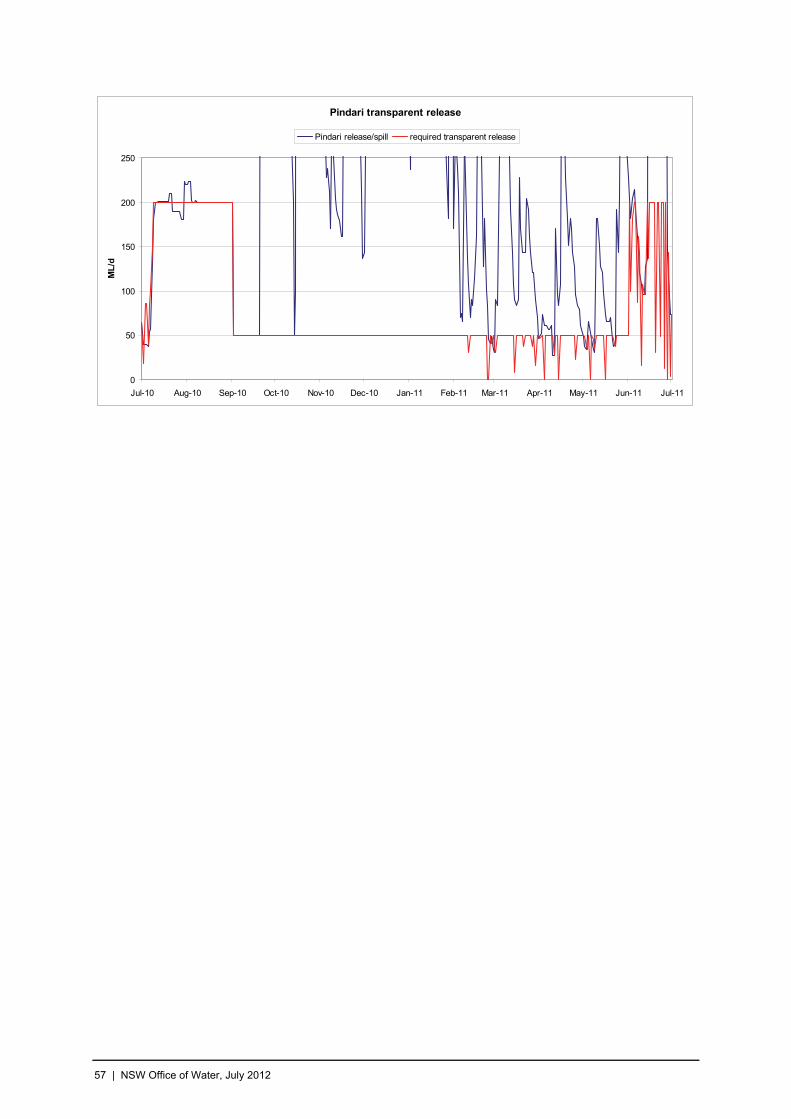
Pindari transparent release
0
50
100
150
200
250
Jul-10 Aug-10 Sep-10 Oct-10 Nov-10 Dec-10 Jan-11 Feb-11 Mar-11 Apr-11 May-11 Jun-11 Jul-11
ML
/d
Pindari release/spill required transparent release
57 | NSW Office of Water, July 2012

Note 15 – QLD extractions
The volume of water extracted from the accounted river extent by QLD licence holders. While detailed information is not available within this account, it is necessary to include the bulk figures extracted to maintain the integrity of the river physical mass balance. Total volumes extracted in ML for 2010-11
have been provided for the NSW equivalent of regulated (termed Supplemented in QLD) and supplementary (termed unsupplemented in QLD) extractions.
Data type Measured data
Policy
Water Resource (Border Rivers) Amendment Plan 2007
New South Wales – Queensland Border Rivers Intergovernmental Agreement 2008
Available at the QLD Department of Environment and Resource Management webpage (http://www.derm.qld.gov.au)
Data Accuracy A – Estimated in the range +/- 10%
Providing Agency Murray Darling Basin Authority
QLD Department of Environment and Resource Management
Data Source N/A
Methodology N/A
58 | NSW Office of Water, July 2012

Note 16 – Supplementary extractions
This is the volume of water extracted or diverted under supplementary access licences during announced periods of supplementary water. Supplementary flow events are announced periodically during the season when high flow events occur with the period of extraction and volume of water to be
extracted determined based on the rules as set out in the water sharing plans. It is important to note that supplementary access licences differ from other categories of access licence in that the volume of water in the account refers to an annual upper limit for extractions and its provision is totally reliant on
the occurrence of high flow events.
Data type Measured data
Policy Water Sharing Plan for the NSW Border Rivers Regulated River Water Source 2009
Part 8 Limits to the availability of water
o Division 2 - Available water determinations - Clause 38 - Available water determinations for supplementary water access licences
Part 9 Rules for managing access licences
o Division 3 - Extraction conditions - Clause 45 - Taking of water under supplementary water access licences upstream of the Macintyre River and Dumaresq River junction
- Clause 46 - Taking of water under supplementary water access licences downstream of the Macintyre River and Dumaresq River junction
Refer to applicable Water Sharing Plan on NSW Office of Water website at www.water.nsw.gov.au
Data accuracy A – Estimated in the range +/- 10%
Providing agency NSW Office of Water
Data source State Water/NSW Office of Water – Water Accounting System (Joint ownership of system).
Methodology Supplementary water extraction and diversion data is collected by either on farm meters that measure extraction or gauges on diversion works. Meter readings are collected for individual licence holders at
intervals during the year and converted via a calibration factor to a volume of water extracted. Water diverted from the river is measured by recording the height at either the gauge or weir with the volume diverted being derived by passing these heights through a rating table. However, with supplementary
water being extracted through the same pumps as those extracting water under other categories of access licences additional information is required to separate out supplementary extraction. Licence holders are therefore required to provide notification of their intention to pump prior to pumping or
diverting water during the declared supplementary event and provide meter readings both at the commencement and conclusion of pumping. This enables the supplementary flow extraction to be assessed independent of other categories of access licences.
59 | NSW Office of Water, July 2012

Additional Information
Border Rivers supplementary announcements by river section 2010-11
Catchment Section Section Start Date Section End Date
Severn River Pindari Dam To Ashford 12/07/2010 22/02/2011
Severn River Pindari Dam To Ashford 8/03/2011 30/06/2011
Severn River Ashford To Macintrye Junction 12/07/2010 22/02/2011
Severn River Ashford To Macintrye Junction 8/03/2011 30/06/2011
Dumaresq River Glenlyon To Roseneath 12/07/2010 22/02/2011
Dumaresq River Glenlyon To Roseneath 8/03/2011 30/06/2011
Dumaresq River Roseneath To Bonshaw Weir 12/07/2010 22/02/2011
Dumaresq River Roseneath To Bonshaw Weir 8/03/2011 30/06/2011
Dumaresq River Bonshaw Weir To Texas Bridge 12/07/2010 22/02/2011
Dumaresq River Bonshaw Weir To Texas Bridge 8/03/2011 30/06/2011
Dumaresq River Texas Bridge To Cunningham Weir 12/07/2010 22/02/2011
Dumaresq River Texas Bridge To Cunningham Weir 8/03/2011 30/06/2011
Dumaresq River Cunning Weir To Glenarbon 12/07/2010 22/02/2011
Dumaresq River Cunning Weir To Glenarbon 8/03/2011 30/06/2011
Dumaresq River Glenarbon To Mcintyre Brook Junction 12/07/2010 22/02/2011
Dumaresq River Glenarbon To Mcintyre Brook Junction 8/03/2011 30/06/2011
Dumaresq River Macintyre Book Junction To Macintyre River 12/07/2010 22/02/2011
Dumaresq River Macintyre Book Junction To Macintyre River 8/03/2011 30/06/2011
Macintyre River Bedwell Downs To Yetman 1/08/2010 22/02/2011
Macintyre River Bedwell Downs To Yetman 8/03/2011 30/06/2011
Macintyre River Yetman To Holdfast 12/07/2010 22/02/2011
Macintyre River Yetman To Holdfast 8/03/2011 30/06/2011
Macintyre River Holdfast To Dumaresq Junction 1/08/2010 19/11/2010
Macintyre River Holdfast To Dumaresq Junction 24/11/2010 8/02/2011
Macintyre River Dumaresq Junction To Boggabilla Weir 1/08/2010 19/11/2010
Macintyre River Dumaresq Junction To Boggabilla Weir 24/11/2010 22/02/2011
Macintyre River Boggabilla Weir To Goondwindi Weir 1/08/2010 19/11/2010
Macintyre River Boggabilla Weir To Goondwindi Weir 24/11/2010 8/02/2011
Macintyre River Boggabilla Weir To Goondwindi Weir 18/06/2011 2/07/2011
Macintyre River Goondiwindi Weir To Royston 1/08/2010 19/11/2010
Macintyre River Goondiwindi Weir To Royston 24/11/2010 8/02/2011
Macintyre River Royston To Trinkie 1/08/2010 19/11/2010
Macintyre River Royston To Trinkie 24/11/2010 9/02/2011
Macintyre River Trinkie To Avymore 1/08/2010 19/11/2010
Macintyre River Avymore To Lockadair 1/08/2010 19/11/2010
Macintyre River Avymore To Lockadair 24/11/2010 9/02/2011
Macintyre River Lockadair To Couralie 1/08/2010 19/11/2010
Macintyre River Lockadair To Couralie 24/11/2010 10/02/2011
Macintyre River Lockadair To Couralie 18/06/2011 2/07/2011
Macintyre River Couralie To Boomi Weir 1/08/2010 19/11/2010
Macintyre River Couralie To Boomi Weir 24/11/2010 11/02/2011
Macintyre River Couralie To Boomi Weir 18/06/2011 2/07/2011
Macintyre River Boomi Weir To Bonanga 1/08/2010 19/11/2010
Macintyre River Boomi Weir To Bonanga 24/11/2010 12/02/2011
Macintyre River Bonanga To Koramba 1/08/2010 19/11/2010
Macintyre River Bonanga To Koramba 24/11/2010 13/02/2011
Macintyre River Corinda To Barra 1/08/2010 19/11/2010
Macintyre River Corinda To Barra 24/11/2010 14/02/2011
Macintyre River Barra To Alluri 1/08/2010 19/11/2010
Macintyre River Barra To Alluri 24/11/2010 15/02/2011
Macintyre River Barra To Alluri 18/06/2011 2/07/2011
Macintyre River Alluri To Weir River Junction 1/08/2010 19/11/2010
Macintyre River Alluri To Weir River Junction 24/11/2010 16/02/2011
Barwon River Weir River Junction To Mungindi Weir 1/08/2010 19/11/2010
Barwon River Weir River Junction To Mungindi Weir 24/11/2010 16/02/2011
Barwon River Weir River Junction To Mungindi Weir 18/06/2011 2/07/2011
60 | NSW Office of Water, July 2012
Note 17 - Allocation trading
This represents the temporary assignment of allocation of water between allocation accounts within the NSW Regulated Border Rivers, or equivalent QLD licences within the Border Rivers.
Data type Administration
Policy Water Sharing Plan for the NSW Border Rivers Regulated River Water Source 2009
Part 10 Access licence dealing rules
o Clause 48 rules relating to constraints within a water source
o Clause 53 Rules for interstate assignment of water allocations
Available on the NSW Office of Water Website at www.water.nsw.gov.au
Water Act 1912
Data accuracy A1 – Nil inaccuracy +/- 0%
Providing agency NSW Office of Water
Data source State Water/NSW Office of Water – Water Accounting System (Joint ownership of system).
Methodology Trading of allocation is permitted between certain categories of access licences and between states. This is detailed in the water sharing plan or stipulated under the licence holder’s conditions.
Internal trade within NSW within licence categories results in a net effect of zero for a water year. In
order to present the information however, and for the purposes of this GPWAR such trades have been accounted as both a water liability decrease (sellers of water) and a water liability increase (buyers of water). Trades that occur between categories of licence, and between states result in the associated
liability being increased or reduced accordingly.
Additional information The tables below shows the allocation assignment figures between licence categories for the Border
Rivers. All figures represent a volume in megalitres.
61 | NSW Office of Water, July 2012

Border Rivers Regulated River internal trade summary 2010-11
TRADE TO
Border Rivers
License Category
General Security A
High Security B
Supplementary
QLD
Total Trade From
General Security A 918 295
1,055 2,268
General Security B 1,323 4,099 21,887 27,309
High Security 680 187 358 1,225 TRADE FR
OM
Border Rivers
Supplementary 16,878 16,878
Total Trade To 2,921 4,581 16,878 23,300 47,680
62 | NSW Office of Water, July 2012

Note 18 - Unaccounted difference
In theory if all the processes of a water balance could be accurately accounted for the unaccounted difference would be zero. In reality due to the large uncertainties in many of the volumes presented in the accounts, the various sources from which the data has been obtained and the fact that not all
processes of the water cycle have been accounted, the statements are not balanced at the end of the accounting process. In order to balance the accounts a final balancing entry is required, and this is termed the unaccounted difference. As technology progresses and accuracy improves in the account
estimates, it is anticipated that relatively, this figure should reduce in future accounts.
Data type Not applicable
Policy Not applicable
Data accuracy D – Estimated in the range +/- 100%
Providing agency Not applicable
Data source Not applicable
Methodology
- Surface Water Unaccounted difference
For surface water the unaccounted difference is equal to the amount required to obtain the correct
volume in river at the end of the reporting period, after all the known physical inflows and outflows have been accounted. The double-entry accounting process attempted to represent the physical movement of water by creating a river asset. The opening and closing balance of the river volume was
estimated according to Note 2.
UDSW = Rs – Rc + RI - Ro
Where:
UDSW = Unaccounted difference for Surface Water
Rs = Opening river volume estimate
Rc = Closing river volume estimate
Ro = Physical outflows from the river (e.g. extractions)
RI = Physical inflows to the river (e.g. runoff, return flows, dam releases)
- Groundwater Unaccounted difference (Method C areas)
For groundwater (areas accounted using Method C) a steady state system was assumed with the
volume required to maintain steady state attributed as the unaccounted difference. The volume reported for the unaccounted difference would include losses such as evapotranspiration, seepage to springs and loss to other groundwater aquifers.
63 | NSW Office of Water, July 2012

UDGW = RGW + EGW
Where
UDGW = Unaccounted difference for groundwater areas accounted with method C
RGW = Recharge to groundwater areas accounted with method C
EGW = Estimated extraction from groundwater areas accounted with method C
64 | NSW Office of Water, July 2012

Note 19 - Held environmental water
This represents environmental water that is held as part of a licensed volumetric entitlement. These licences are held within the same licence categories as all other water access licences hence are subject to the same operating rules. Therefore they are subject to the following key rules:
Available Water Determinations (AWD) for their share of the entitlement to be added to accounts.
Carryover rules hence the forfeiting of unused water that cannot be carried over.
Provide water orders prior to use.
These licences are used to provide environmental benefit and outcomes to the catchment by either providing water to, or supplementing water requirements of, a specific environmental events or
incidents.
Data type Measured
Policy Water Management Act 2000
Water Sharing Plan for the NSW Border Rivers Regulated River Water Source 2009
Available on the NSW Office of Water Website at www.water.nsw.gov.au
Data accuracy A – Estimated in the range +/- 10%
Providing agency NSW Office of Water
Data source State Water/NSW Office of Water – Water Accounting System (Joint ownership of System).
Available Water Determination Register - NSW Office of Water website at www.water.nsw.gov.au
Methodology The water held for the environment represents a volume of water in corresponding allocation
accounts. This allocation account represents the sum of the remaining volume of held environmental water at the conclusion of the water year once all transactions and forfeit rules have been applied to the accounts. These environmental balances are at the licence category level and represent the water
that can be carried forward for use in the next year. Below is list of typical transactions that can apply to an environmental allocation account:
AWD (including pro rata of AWD for new licences)
Licensed extractions
Forfeiture due to:
o Carryover rules
o Account spillage as a result of AWD
o Licence conversions
o Excess orders (where water order debiting is in place)
Licence conversion
Trade of allocation water between accounts
65 | NSW Office of Water, July 2012

66 | NSW Office of Water, July 2012
In addition the trade and purchase of environmental water is tracked to capture the movement of environmental entitlement both in number of entitlements, and volume.
Additional information The table on the following page provides a summary of held environmental water for 2010-11.
Explanatory information for Environmental Account Summary
Heading Description
No. Lic. This is the number of environmental licences held.
Share This is the total volume of entitlement in the specific licence category.
Opening The volume of water that has been carried forward from previous years allocation account.
AWD The total annual volume of water added to the allocation account as a result of allocation assessments.
In Increase in account water as a result of Temporary Trade in. Assignments
Out Decrease in account water as a result of Temporary Trade out.
Extractions Volume of water that is extracted or diverted from the river under controlled river conditions and is accountable against the licence.
Available Balance Account balance that is available to be taken at the conclusion of the water year.
Not Available Balance Account balance that is currently not available for use (e.g. restricted due to drought conditions or annual use limit restrictions)
End of Year Forfeit Account water that is forfeited at the end of the water year as a result of carryover rules that restrict the carry forward volume.
Carry Forward This represents the account water that is permitted to be carried forward into the next water year as determined by the carryover rules.
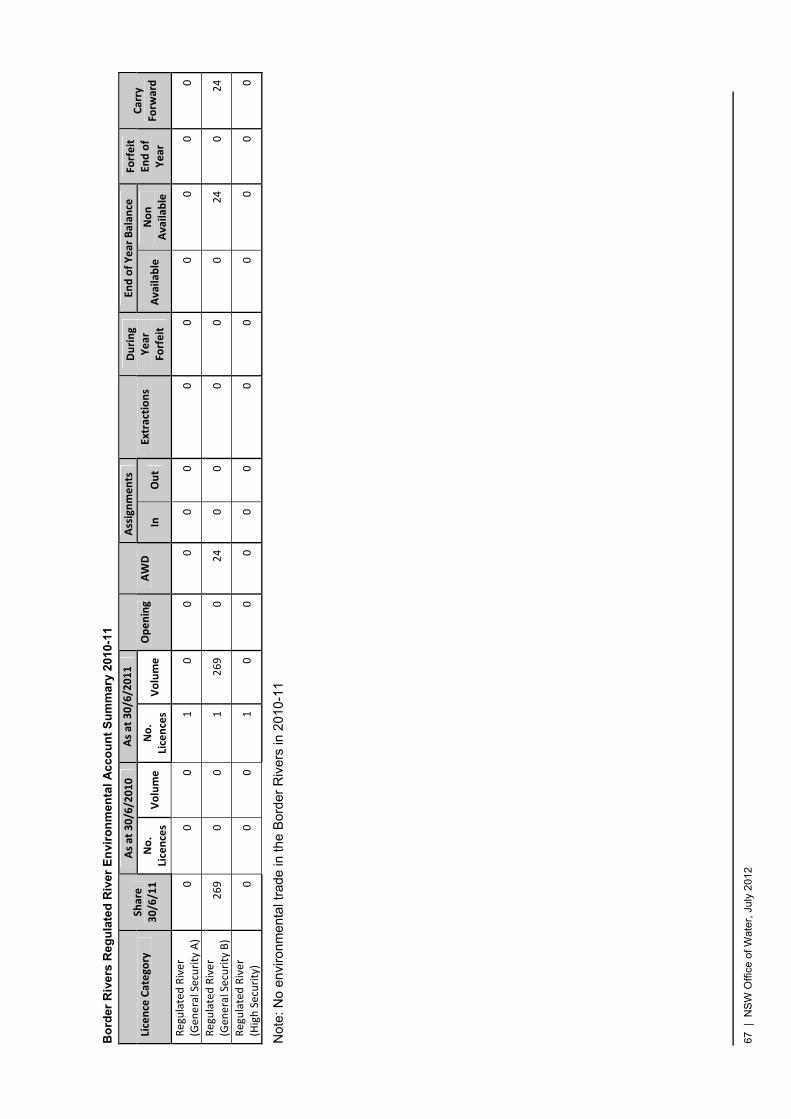
Bo
rder
Riv
ers
Reg
ula
ted
Riv
er
En
viro
nm
enta
l A
cco
un
t S
um
mar
y 20
10-1
1
As at 30/6/2010
As at 30/6/2011
Assignments
End of Year Balan
ce
Licence Category
Share
30/6/11
No.
Licences
Volume
No.
Licences
Volume
Opening
AWD
In
Out
Extractions
During
Year
Forfeit
Available
Non
Available
Forfeit
End of
Year
Carry
Forw
ard
Regulated River
(Gen
eral Security A)
0
0
0
1
0
0
0
0
0
0
0
0
0
0
0
Regulated River
(Gen
eral Security B)
269
0
0
1
269
0
24
0
0
0
0
0
24
0
24
Regulated River
(High Security)
0
0
0
1
0
0
0
0
0
0
0
0
0
0
0
Not
e: N
o en
viro
nmen
tal t
rade
in th
e B
orde
r R
iver
s in
201
0-11
67 |
NS
W O
ffice
of W
ater
, Jul
y 20
12

Note 20 – Environmental Stimulus Flow
A provision for an environmental stimulus flow is detailed in the plan which is put aside and called upon to supplement natural flow events when the defined triggers are met. At the beginning of each water year a volume of 4,000 ML must be set a side in the resource assessment process for Pindari
dam. If at any time during 1 April to 31 August, inflows to Pindari exceed 1,200 ML per day, the water will be called upon to provide an environmental stimulus flow. The timing, rate and total volume is to be determined by the Department of Environment and Heritage in consultation with the NSW Office of
Water. The unused water held within the account may be carried forward to the following water year, however the account may not exceed 8,000 ML at the beginning of any water year.
Data type Administration
Policy
Water Sharing Plan for the NSW Border Rivers Regulated River Water Source 2002
Part 3 Environmental Water Provisions
o Clause 12 – Planned Environmental Water
Refer to applicable Water Sharing Plan on NSW Office of Water website at www.water.nsw.gov.au
Data accuracy A1 – Nil inaccuracy +/- 0%
Providing agency State Water Corporation
Data source
Annual Compliance Report (internal document)
Methodology
N/A
68 | NSW Office of Water, July 2012

Note 21 – Account corrections
This is a line item that is used to correct balances in the accounts. The double entry accounting being applied is a continuous process whereby the closing balance of one year is the opening balance for the proceeding year. Occasionally corrections will be required for a variety of reasons including when
an error is identified in prior year reporting or when a process that had previously been reported is unable to be supplied and the associated asset or liability must be removed to maintain the integrity of the statements. This is different to the unaccounted difference component which is a physical volume
required to achieve mass balance after all the known processes have been accounted.
Data type Calculated
Accuracy A1 – Nil inaccuracy +/- 0%
Providing agency NSW Office of Water.
Data source Not applicable
Methodology N/A
69 | NSW Office of Water, July 2012

Note 22 – Water order debiting
Currently in the NSW Border Rivers the allocation accounts are managed using an over-ordering debiting system. Accounting under this system implies that the accounts are reduced by the greater of:
the volume of water extracted
the volume of water ordered for extraction against an access licence.
Therefore the volume appearing in statements against the line item water order debiting reflects the
amount of water ordered against a category of licence that is in excess to the physical extraction that occurred.
Data type Measured/calculated
Policy Water Sharing Plan for the NSW Border Rivers Regulated River Water Sources 2003
Part 9 – Rules for managing access licences.
o Division 2 – Water allocation account management.
- Clause 41 – Volume taken under access licences.
Available on the NSW Office of Water website at: www.water.nsw.gov.au.
Data accuracy A1 – Nil inaccuracy +/- 0%
Providing agency NSW Office of Water.
Data source State Water/NSW Office of Water – Water accounting system (joint ownership of system).
Methodology Water order debiting is a required component of balancing the allocation accounts detailed in note 3.
The over-order component is calculated by analysing the recorded extractions against orders.
70 | NSW Office of Water, July 2012

Border Rivers catchment
Assurance Statement
An Assurance Statement is required under the ED AWAS 1 for a general purpose water account which states that the accounts were prepared in accordance with the ED AWAS 1. It is a requirement
that this be provided by an appropriately qualified assurance provider independent of the water reporter and it management and governing body.
An assurance framework has yet to be provided under the ED AWAS 1 and in lieu of it the NSW Office
of Water will not be providing an Assurance Statement for the 2010-11 water account. It should be noted that at the time of publication WASB is in the process of developing an assurance standard for which more details can be obtained from the WASB website.
71 | NSW Office of Water, July 2012
72 | NSW Office of Water, July 2012
References BOM 2010, Pilot National Water Account, Bureau of Meteorology
Scozzafava M. & Tallini M. (2001) - Net infiltration in the Gran Sasso Massif (Central Italy): Thornthwaite water budget using the CN method (Soil Conservation Service). Hydrogeology Journal, 9, 461-475.
Thornthwaite, C.W., 1948, An approach toward a rational classification of climate. In: Geographical Review, v. 38, p. 55–94.
Thornthwaite, W.C. and J.R. Mather, 1955, The Water Balance, Publication in Climatology, Vol 8(1), 104 pp, Lab. of Climatol., Drexel Inst, of Technol., Centerton N.J.
Thornthwaite, W.C. and J.R. Mather, 1957, Instruction and Tables for Computing the Potential Evapotranspiration and the Water Balance, Publication in Climatology, Vol 10(3), 311 pp, Lab. of Climatol., Drexel Inst, of Technol., Centerton N.J.
WASB 2010, Exposure Draft of Australian Water Accounting Standard 1 Preparation and Presentation of General Purpose Water Accounting Reports (ED AWAS 1), Bureau of Meteorology