Embed Size (px)
Citation preview

BioMed CentralBMC Genomics
ss
Open AcceResearch articleSigned weighted gene co-expression network analysis of transcriptional regulation in murine embryonic stem cellsMike J Mason1, Guoping Fan2, Kathrin Plath3, Qing Zhou*1 and Steve Horvath*2,4Address: 1Statistics, University of California, Los Angeles, CA, 90095, USA, 2Human Genetics, David Geffen School of Medicine, Los Angeles, CA, 90095, USA, 3Biological Chemistry, University of California, Los Angeles, CA, 90095, USA and 4Biostatistics, School of Public Health, University of California, Los Angeles, CA, 90095, USA
Email: Mike J Mason - [email protected]; Guoping Fan - [email protected]; Kathrin Plath - [email protected]; Qing Zhou* - [email protected]; Steve Horvath* - [email protected]
* Corresponding authors
AbstractBackground: Recent work has revealed that a core group of transcription factors (TFs) regulatesthe key characteristics of embryonic stem (ES) cells: pluripotency and self-renewal. Current effortsfocus on identifying genes that play important roles in maintaining pluripotency and self-renewal inES cells and aim to understand the interactions among these genes. To that end, we investigatedthe use of unsigned and signed network analysis to identify pluripotency and differentiation relatedgenes.
Results: We show that signed networks provide a better systems level understanding of theregulatory mechanisms of ES cells than unsigned networks, using two independent murine ES cellexpression data sets. Specifically, using signed weighted gene co-expression network analysis(WGCNA), we found a pluripotency module and a differentiation module, which are not identifiedin unsigned networks. We confirmed the importance of these modules by incorporating genome-wide TF binding data for key ES cell regulators. Interestingly, we find that the pluripotency moduleis enriched with genes related to DNA damage repair and mitochondrial function in addition totranscriptional regulation. Using a connectivity measure of module membership, we not onlyidentify known regulators of ES cells but also show that Mrpl15, Msh6, Nrf1, Nup133, Ppif, Rbpj,Sh3gl2, and Zfp39, among other genes, have important roles in maintaining ES cell pluripotency andself-renewal. We also report highly significant relationships between module membership andepigenetic modifications (histone modifications and promoter CpG methylation status), which areknown to play a role in controlling gene expression during ES cell self-renewal and differentiation.
Conclusion: Our systems biologic re-analysis of gene expression, transcription factor binding,epigenetic and gene ontology data provides a novel integrative view of ES cell biology.
BackgroundEmbryonic stem (ES) cells have two important character-istics: pluripotency, the ability to differentiate into any
type of cell in the body, and self-renewal, the ability toreplicate indefinitely. As such, they have tremendous ther-apeutic potential for regenerative medicine [1,2]. Current
Published: 20 July 2009
BMC Genomics 2009, 10:327 doi:10.1186/1471-2164-10-327
Received: 17 February 2009Accepted: 20 July 2009
This article is available from: http://www.biomedcentral.com/1471-2164/10/327
© 2009 Mason et al; licensee BioMed Central Ltd. This is an Open Access article distributed under the terms of the Creative Commons Attribution License (http://creativecommons.org/licenses/by/2.0), which permits unrestricted use, distribution, and reproduction in any medium, provided the original work is properly cited.
Page 1 of 25(page number not for citation purposes)
BMC Genomics 2009, 10:327 http://www.biomedcentral.com/1471-2164/10/327
work focuses on understanding and extending the net-work of genes that controls these key characteristics [3-16]. These efforts identified ES cell-specific transcriptionfactors (TFs) that are differentially expressed between EScells and differentiated cells (fibroblasts). Several studieshave identified the targets of these TFs and the mechanismby which they regulate them [4,8,17]. Highly differen-tially expressed TFs (Oct4, Sox2, c-Myc, and Klf4) havebeen found capable of reprogramming fibroblasts to apluripotent state [3].
While standard differential expression analysis techniqueshave led to remarkable discoveries they ignore the strongcorrelations that may exist between gene expression pro-files. As a consequence, the user of a standard marginalanalysis can drown in information but starve in knowl-edge. This is especially true when considering ES cellswhere many genes change expression during differentia-tion. For example, in a data set from Zhou et al 2007,which we consider below, more than 6200 genes werehighly differentially expressed (Student t-test p-valuesmaller than the very stringent threshold of 10-6). It is dif-ficult to further prioritize these genes and to learn theunderlying biological pathways. In contrast, co-expres-sion networks, also referred to as 'association,' 'correla-tion,' or 'influence' networks [18-22], realize that genescan be highly correlated and thus can be grouped intolarge clusters (co-expression modules). For example, ournetwork analysis of the same data organizes the genes intoonly 8 large modules. Next our module-centric analysisfocuses on understanding the modules and their key reg-ulators. Since it applies significance testing to the level ofmodules, co-expression network analysis may greatly alle-viate the multiple testing problem that plagues standardgene-centric methods [23]. Gene co-expression networkmethods have been successfully applied in a variety of dif-ferent settings [18,19,21,22,24-32].
In this article, we demonstrate that a co-expression net-work analysis of stem cell data sets provides novel biolog-ical insights that cannot be found using conventionaltechniques. Using external data (including gene ontology,TF binding data, epigenetic regulators), we also contrastthe performance of signed and unsigned network con-struction methods. We find that signed co-expression net-work analysis performs best in this stem cell application.We identify pluripotency and differentiation related co-expression modules and novel ES cell regulators.
Results and discussionConstructing Signed Co-expression NetworksWe first define a gene co-expression similarity measurewhich is used to define the network. We denote the geneco-expression similarity measure of a pair of genes i and jby sij. Many co-expression studies use the absolute value of
the Pearson correlation as an unsigned co-expression sim-ilarity measure,
where gene expression profiles xi and xj consist of theexpression of genes i and j across multiple microarraysamples. However, using the absolute value of the correla-tion may obfuscate biologically relevant information,since no distinction is made between gene repression andactivation. In contrast, in signed networks the similaritybetween genes reflects the sign of the correlation of theirexpression profiles. To define a signed co-expressionmeasure between gene expression profiles xi and xj, we usea simple transformation of the correlation:
As the unsigned measure , the signed similarity
takes on a value between 0 and 1. Note that the
unsigned similarity between two oppositely expressedgenes (cor(xi, xj) = -1) equals 1 while it equals 0 for the
signed similarity. Similarly, while the unsigned co-expres-sion measure of two genes with zero correlation remainszero, the signed similarity equals 0.5.
Next, an adjacency matrix (network), A = [aij], is used toquantify how strongly genes are connected to oneanother. A is defined by thresholding the co-expressionsimilarity matrix S = [sij]. 'Hard' thresholding (dichot-omizing) the similarity measure S results in anunweighted gene co-expression network. Specifically anunweighted network adjacency is defined to be 1 if sij > τand 0 otherwise, i.e. two genes are considered connectedif their similarity measure is above a given threshold τ,and are considered separated otherwise.
Because hard thresholding encodes gene connections in abinary fashion, it can be sensitive to the choice of thethreshold and result in the loss of co-expression informa-tion [19]. The continuous nature of the co-expressioninformation can be preserved by employing soft thresh-olding, which results in a weighted network. Specifically,we use a continuous measure to assess their connectionstrength:
where the power β is the thresholding parameter. As adefault we use β = 6 and β = 12 for unsigned and signednetworks, respectively. Alternatively, β and be chosenusing the scale-free topology criterion [19]. Since log(aij) =
s cor x xijunsigned
i j=| ( , ) |, (1)
scor xi x j
ijsigned =
+1
2
( , ). (2)
sijunsigned
sijsigned
a sij ij= b , (3)
Page 2 of 25(page number not for citation purposes)

BMC Genomics 2009, 10:327 http://www.biomedcentral.com/1471-2164/10/327
β × log(sij), the weighted network adjacency is linearlyrelated to the co-expression similarity on a logarithmicscale. Figure 1 shows the resulting adjacencies after apply-ing the co-expression similarity measures and threshold-ing. Note that a high power β transforms high similaritiesinto high adjacencies, while pushing low similaritiestowards 0. Since this soft-thresholding procedure leads toweighted adjacency matrix, the ensuing analysis is referredto as weighted gene co-expression network analysis orWGCNA [19,23,33,34].
A major step in our module centric analysis is to clustergenes into network modules using a network proximitymeasure. Roughly speaking, a pair of genes has a highproximity if it is closely interconnected. We will use theconvention that the maximal proximity between twogenes is 1 and the minimum proximity is 0. Specifically,we define the proximity as the topological overlap meas-ure (TOM) [35-37] which can also be defined forweighted networks [19]. The TOM combines the adja-cency of two genes and the connection strengths these twogenes share with other "third party" genes (see equation 6in the Methods section and Additional File 1). The TOMis a highly robust measure of network interconnectedness(proximity). This proximity is used as input of averagelinkage hierarchical clustering. Modules are defined as
branches of the resulting cluster tree [38]. This moduledetection procedure has been used in many applications[23,25-30,32,39,40] and a comparison to alternative pro-cedures is beyond the scope of this article.
We find it convenient to summarize the gene expressionprofiles of a given module with the module eigengene,which can be considered as the best summary of thestandardized module expression data [33,41]. The mod-ule eigengene of a given module is defined as the firstprincipal component of the standardized expression pro-files (see equation 8 in the Methods section).
Quantifying Module Membership
To identify possible regulators within a given module, welooked for highly connected intramodular hub genes, i.e.genes that have strong connections within the module. Inour effort to find these genes, we examined two types ofconnectivity measures, which can be applied relative toany module q. The first connectivity measure is intramod-
ular connectivity defined askiq( )
k a a aiq
i i in q( )
( ) ,= + +1 2 L (4)
Network Connection Strength Versus Expression CorrelationFigure 1Network Connection Strength Versus Expression Correlation. Network adjacency (y-axis) versus correlation (x-axis) for an unweighted network (black step function with τ = 0.8) and weighted networks (dashed lines corresponding to different powers, β) in an unsigned network (a) and a signed network (b). Note that cor(xi, xj) = -1 leads to adjacency = 0 in the signed network. The weighted network preserves the continuous nature of the co-expression information while an unweighted net-work dichotomizes the correlation.
� � � � � � � � �
� �
�� �������
� �
� � � � � � � � �
�� �������
(a) (b)
Page 3 of 25(page number not for citation purposes)

BMC Genomics 2009, 10:327 http://www.biomedcentral.com/1471-2164/10/327
where n(q) is the number of genes in the qth module. In the
case of an unweighted network, simply counts the
number of connections to gene i within the qth module.Intramodular connectivity can be interpreted as a measureof module membership: the higher the intramodular con-nectivity, the more centrally located the gene is in themodule and the more certain is its membership withregard to this module. In signed networks, these highlyconnected hub genes may up-regulate adjacent genessince they are positively correlated with them, while inunsigned networks they may activate or repress theirneighboring genes.
The second connectivity measure is the module eigengene
based connectivity, (also known as the signed mod-
ule membership measure [33]), defined as
where E(q) is the eigengene of the qth module (see equa-tions 9 and 10 in the Methods section) and xi is the expres-
sion profile of the gene i. We denote modules by colors.
For example, denotes the module membership
measure of the i-th gene with regard to the blue module.
Module eigengene based connectivity has several advan-tages over intramodular connectivity: first, it is naturallyscaled to take on values between -1 and 1; second, one canuse a correlation test to calculate a corresponding p-valuefor a gene's module membership; third it can be used insigned networks to identify genes that are anti-correlatedwith a given module eigengene (i.e. they may repressgenes in the module), and fourth, kME can be computed
for any gene on the array (not just genes used in the net-work construction). In practice, we found that intramod-ular and module eigengene based connectivity are highlycorrelated (Additional File 2). A priori, the connectivitymeasures defined in equations 4 and 5 are quite different.But we show in the Methods section that a simple theoret-ical relationship between them can be derived in the con-text of a signed co-expression module. Due to itsadvantages, we used the module eigengene based connec-
tivity as the measure of module membership in our
applications.
Signed WGCNA Identifies Pluripotency Related Modules in Ivanova et al (2006) Data SetWe generated unsigned and signed co-expression net-works to analyze over 17,000 genes measured across 70
expression arrays from data published in Ivanova et al(2006) [4]. This data set contains expression profiles of EScells individually depleted for the transcription factorsOct4, Nanog, Sox2, Esrrb, and Tbx3 by RNA interference(RNAi). The data set also includes expression profiles forRNAi knock downs of Tcl1 a co-activator of AKT kinase,and an EST (Mm343880), along with expression profilesof control ES cells carrying an empty RNAi vector and ofES cells differentiated by retinoic acid (RA). Each of thesetreatments was sampled over approximately eight days.To compare the performances of unsigned and signedWGCNA in identifying gene groups that are important forthe regulation of the pluripotent state, we defined genemodules in unsigned and signed networks and assessedmodule function and importance by determining geneontology terms associated with each module and examin-ing module membership of genes known to play a role inES cells. In addition, we analyzed how genes of a givenmodule are bound by chromatin regulators or pluripo-tency TFs by incorporating independent promoter bind-ing information.
Figure 2a shows the dendrogram of the unsigned networkfor the Ivanova et al data set. Modules were found by cut-ting branches of the cluster tree (dendrogram), using thedynamic tree cut library in R [38]. Modules are indicatedby the color bands below the dendrogram. Genes that donot clearly belong to a branch are colored grey. To com-pare modules in signed and unsigned networks, we showtwo color bands: the top color band shows the genescolored by module membership in the unsigned network(corresponding to the dendrogram), while the bottomcolor band shows genes colored by module membershipin the signed network. Similarly, Figure 2b displays thedendrogram of the signed network with the top colorband showing genes colored by module membership inthe signed network and the bottom color band showinggenes colored by module membership in the unsignednetwork. These figures show that while some large mod-ules (turquoise, yellow, red, and blue) are preserved inboth networks, the signed network has two distinct smallmodules (black and tan) hidden within the unsigned tur-quoise module. The black and tan modules from thesigned network are scattered throughout the unsignednetwork's turquoise module and cannot be detected sincethere is no branch of the dendrogram correspondingdirectly to these modules (i.e. regardless of the tree cuttingalgorithm employed, these modules would not be foundin the unsigned network, data not shown). Figure 2a alsoshows a heatmap of the expression profiles of genes in theturquoise module from the unsigned network. Genes inthis module exhibit a positive (red) or negative (green)change in expression upon knock down of the master reg-ulator Oct4, which is not surprising given that Oct4 RNAihas be shown to cause a distinct differentiation patternfrom other TF RNAi's [4,42]. Heat maps are similarly
kiq( )
kME iq
,( )
k cor x EME iq
iq
,( ) ( )( , ),= (5)
kME iblue
,
kME iq
,( )
Page 4 of 25(page number not for citation purposes)
BMC Genomics 2009, 10:327 http://www.biomedcentral.com/1471-2164/10/327
Page 5 of 25(page number not for citation purposes)
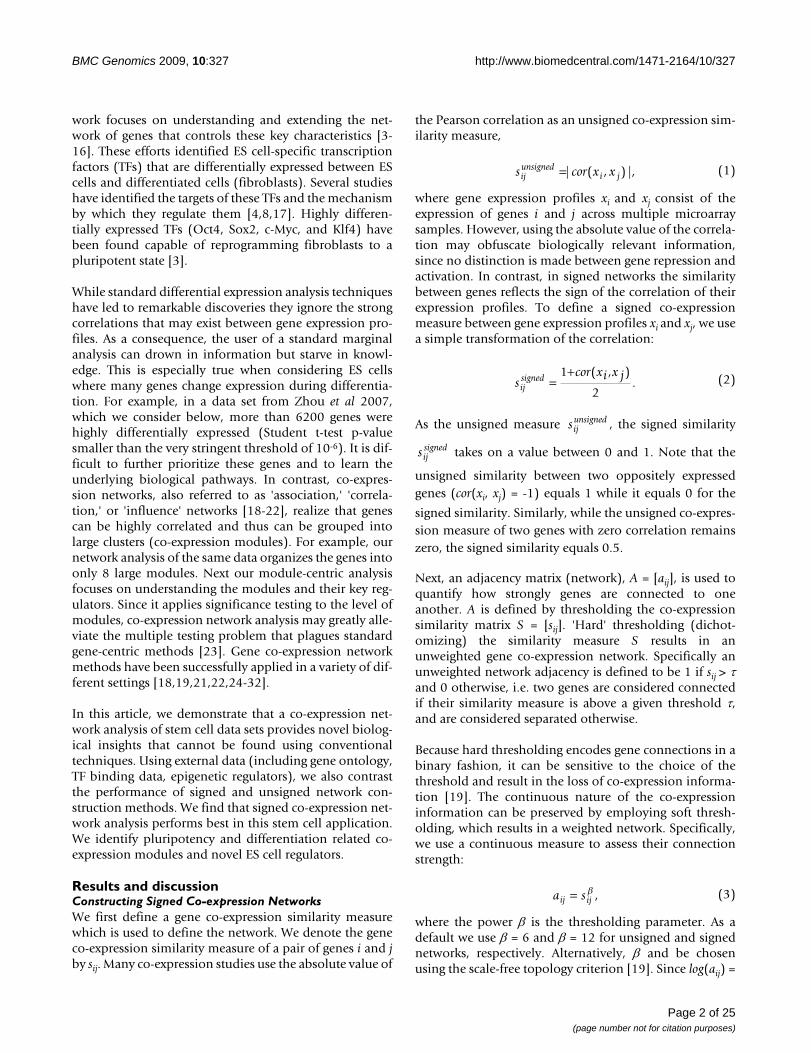
Unsigned and Signed Mouse ES cell Networks in Ivanova et alFigure 2Unsigned and Signed Mouse ES cell Networks in Ivanova et al. a, left, Dendrogram of the unsigned network of the Ivanova et al (2006) data set with color bands below indicating module membership for the unsigned network (U) and the signed network (S). a, right, heat map for visualizing standardized gene expressions (rows) across samples (columns) for genes in the turquoise module in the unsigned network. b, left, Dendrogram of the signed network of the Ivanova et al (2006) data set with color bands below indicating module membership for the signed network (S) and the unsigned network (U). b, right, heat map of expression profiles across samples for genes in the turquoise, black, and blue modules in the signed network. Note, modules are not scaled to reflect the number of genes in each module. c, scatter plot of module membership, kME, (x-axis) plotted against gene significance, GS, (y-axis) for the black and blue modules in the signed network with known ES cell regulators and differentiation genes labelled.
� ��
� ��
� ��
� ��
� ��
�
� ��
� ��
� ��
� ��
� ��
�
� � � � � � � � � � �
�
��
��
��
��
� � � � � � � � � � � �
�
��
��
{ RA in
duct
ion
days
1-7
{ Esrrb
RNA
i day
s 1-8
{ Cont
rol R
NAi d
ays 1
-8
{ Mm
3438
80 R
NAi d
ays 1
-8
{ Nano
g RN
Ai d
ays 1
-8
{ Oct
4 RN
Ai d
ays 1
-8
{ Sox2
RNA
i day
s 1-8
{ Tbx3
RNA
i day
s 1-8
{ Tcl1
RNA
i day
s 1-8
Turq
uois
eTu
rqui
oise
Blac
kBl
ue
Gen
e Si
gn
ifica
nce
Gen
e Si
gn
ifica
nce
kME
kME
Signed BlueSigned BlackOct4
Dppa4
Nanog
Utf1Dppa5
n-Myc
Esrrb
Lin28
Klf4 Sox2Phc1
Gata4
Gata6
Unsigned
Signed
(a)
(b)
(c)

BMC Genomics 2009, 10:327 http://www.biomedcentral.com/1471-2164/10/327
shown in Figure 2b for the turquoise, black, and bluemodules from the signed network. In contrast to theunsigned network, each module contains genes with sim-ilar expression profiles. Here the turquoise module ismade of genes that are activated when Oct4 is knockeddown, while the black module contains genes that arerepressed when Oct4 is knocked down and are down-reg-ulated during retinoic acid (RA) induced differentiation.The blue module contains genes that are activated upondifferentiation. This analysis shows that signed WGCNAidentifies modules with more specific expression patternsthan unsigned WGCNA.
Functional Enrichment with Regard to Known ES Cell Related GenesNext we used external data to further study the gene mod-ules defined by the networks and reveal their functionalroles. We used two different strategies for this evaluation:first we assigned transcription factors and other regulatorswith known roles in pluripotency, self-renewal or differ-entiation to modules [4,8] and second, we incorporatedgenome-wide binding data for transcription factors andother regulators implicated in ES cell regulation in orderto determine if these modules contain genes that aredirectly controlled by ES cell related TFs or differentiationsuppressors [5,6,16].
Many genes known to maintain the pluripotent state of EScells are found in the black module in the signed network.We defined a measure of gene significance (GS) as the t-statistic from the paired Student's t-test of expression incontrol RNAi samples and ES cell samples with RNAiknock down of Oct4 (paired by day of treatment). Figure2c shows GS plotted against its module eigengene basedconnectivity, kME, in the black and blue modules of the
signed network with marker genes labeled. Since thesigned module membership kME is defined as the correla-
tion between a gene expression profile and the moduleeigengene, its values lie between -1 and 1 with values near1 signifying strong module membership to the corre-sponding signed module. Figure 2c shows a strong linearrelationship between kME and GS in the black module
(correlation = 0.5, p-value = 6.5e-13). As expected, mostof the genes whose RNAi knock down induced ES cell dif-ferentiation in Ivanova et al [4] belong to the black mod-ule (Oct4, Nanog, Sox2, Esrrb, and Dppa4, Fisher's exact
test p-value = 3.2 × 10⁻⁵). Oct4's high connectivity (
= 0.94) makes it a hub gene in the black module, consist-ent with its known role as a master regulator of thepluripotent state. Furthermore, many genes that areknown to be highly expressed in ES cells are also in the
black module (e.g. Klf4, Utf1, and Phc1). Klf4 is one ofthe four TFs that can reprogram differentiated cells into apluripotency state [3]. Utf1 interacts with Oct4, affectschromatin regulation in ES cells, and has recently beenshown to improve reprogramming efficiency [43-45].Phc1 is a Polycomb Group (PcG) protein. PcG proteinsrepress genes that become active upon differentiation ofES cells by mediating histone H3 lysine 27 tri-methylationand histone H2a ubiquitination [6]. The blue modulecontains Gata6 and Gata4, which are both highly con-
nected ( = 0.93 and 0.88, respectively). These TFs are
markers of ES cell differentiation, particularly into endo-derm. Below we provide further evidence that the blackand blue modules are related to pluripotency and differ-entiation respectively.
Module Enrichment with Regard to Known ES Cell RegulatorsWe incorporated genome-wide binding data for TFs(Oct4, Sox2, Nanog, Stat3, Smad1, cMyc, nMyc, Zfx, E2f1)and other regulators (Suz12) implicated in the mainte-nance of pluripotency and self-renewal, which wereobtained by chromatin immunoprecipitation (ChIP) andmassive parallel sequencing (ChIP-seq) by Chen et al(2008) [16]. Oct4, Sox2, Nanog, Smad1, and Stat3 arereferred to as the Oct4 group of TFs, as they have beenshown to often co-bind genomic regions; cMyc, nMyc,E2f1, and Zfx are referred to as the cMyc group of TFsbecause they also co-bind genomic regions [16]. TogetherTFs in the Oct4 and cMyc group are thought to activateexpression of genes involved in pluripotency and self-renewal. Suz12, is a subunit of the histone H3K27 meth-yltransferase PcG protein complex, which represses genesthat are activated upon differentiation [6,16].
To determine if binding by the two TF groups and Suz12occurs more often in certain modules we computed bind-ing enrichment for each module. Enrichment is defined asthe odds ratio, that is the probability of a gene beingbound by a particular TF or TF complex for genes in agiven module divided by the probability of being boundfor genes not located in the module. Table 1 shows mod-ule enrichment of genes bound by TFs in the Oct4 group,the cMyc group, and Suz12 for modules in the unsignedand signed networks. A gene is called bound by the Oct4or cMyc groups if it is bound by at least 4 of the 5 and 3 ofthe 4 TFs in each TF group, respectively (similar results arefound when using 3 of 5 and 2 of 4, data not shown). Inagreement with the notion that the black module foundin the signed network contains genes that are implicatedin pluripotency, this module is strongly enriched withgenes bound by TFs in the Oct4 and cMyc groups andunder-enriched for binding by Suz12. Specifically, the
kMEblack
kMEblue
Page 6 of 25(page number not for citation purposes)

BMC Genomics 2009, 10:327 http://www.biomedcentral.com/1471-2164/10/327
proportion of genes bound by the Oct4 group in the blackmodule is almost twice the proportion of genes bound inthe general population (1.94). Similarly genes in the blackmodule are almost twice as likely to be bound by TFs inthe cMyc group (1.87) and are almost three times lesslikely to be bound by Suz12 (0.344). These enrichmentsfurther support the idea that the black module is apluripotency and self-renewal module. Other modules,like the blue, brown, and cyan, are enriched for Suz12bound genes and under-enriched for genes bound by thetwo TF groups. The blue module is the most significantlyenriched for Suz12 binding further supporting the ideathat genes in this module are involved in ES cell differen-tiation. For modules preserved in both unsigned andsigned networks, Table 1 shows that enrichment valuesare generally more significant in the signed network. Sim-ilar enrichments can be seen for Oct4 and Nanog bindingfrom Loh et al (2006) and Polycomb Group (PcG) proteinbinding from Boyer et al (2006) (Additional File 3). Theincorporation of binding data suggests that signedWGCNA better separates genes into modules based onfunction and regulation. Specifically, the black modulecan be considered a pluripotency/self-renewal module,while the blue, brown, and cyan modules can be consid-ered differentiation modules in the signed network. It isimportant to reiterate that the pluripotency/self-renewalblack module was only found using signed WGCNA.
Epigenetic Regulation and Module Membership
Recent studies suggest that chromatin structure and epige-netic modifications, like histone modification and DNAmethylation, play a role in controlling gene expressionduring ES cell self-renewal and differentiation [46-51].For example, gene repression by the PcG protein complexvia histone H3 lysine 27 trimethylation (H3K27me3) isrequired for ES cell self-renewal and pluripotency [6,52].To understand how epigenetic variables contribute to theregulation of ES cells we studied the relationship of thepluripotency and differentiation modules with ES cellH3K4 and H3K27 trimethylation, DNA methylation, andCpG promoter content from previously published datasets [50,51]. We related the epigenetic variables to modulemembership in the black (Figure 3, top row) and bluemodule (Figure 3, bottom row). Specifically, we deter-mined what proportion of genes with a given epigeneticmark (H3K4me3 for example) are also in the top 1000
genes with the highest (or ). Below we show
that our findings are highly robust with respect to thenumber of selected module genes (see also Additional File4). H3K4me3 is associated with gene activation, whereasH3K27me3 is known to silence genes. Figure 3 shows that
kMEblack kME
blue
Table 1: Transcription Factor Binding in Ivanova et al Networks
Unsigned NetworkModule No. of genes Oct4Complex cMycComplex Suz12
blue 899 0.863, 0.232 1.09, 0.0398 0.956, 0.366brown 1241 0.862, 0.179 0.757, 3.09e-09 1.92, 2.5e-21green 1556 0.825, 0.0832 0.811, 1.78e-07 1.13, 0.0496grey 7407 1.16, 2.37e-05 1.18, 4.62e-45 0.866, 2.17e-07red 1673 1.1, 0.169 1.68, 6.75e-74 0.281, 7.61e-28turquoise 5721 0.898, 0.0268 0.801, 4.3e-36 1.2, 6.96e-10yellow 1053 1.14, 0.15 1.46, 5.74e-22 0.458, 7.39e-10
Signed Networkblack 941 2.9, 7.25e-24 1.83, 4.8e-58 0.288, 1.95e-15blue 220 0.608, 0.165 0.488, 1.59e-07 1.93, 4.42e-05brown 1090 0.736, 0.0402 0.754, 2.04e-08 1.99, 3.27e-21cyan 581 0.783, 0.174 0.931, 0.15 1.78, 2.58e-08green 1538 0.731, 0.0138 0.778, 1.14e-09 1.12, 0.0534grey 4428 0.949, 0.224 0.853, 2.38e-14 1.13, 0.000604magenta 514 1.09, 0.286 1.11, 0.0548 0.824, 0.122midnightblue 649 1.61, 0.00131 1.89, 2.87e-45 0.181, 6.99e-15pink 2242 1.4, 4.41e-05 1.85, 8.63e-160 0.341, 3.32e-31red 1270 1.01, 0.429 1.56, 1.19e-37 0.371, 8.07e-16salmon 650 1.03, 0.388 1.19, 0.00083 0.67, 0.00378tan 445 2.16, 4.62e-06 1.71, 4.65e-21 0.37, 3.14e-06turquoise 5205 0.679, 2.41e-09 0.749, 3.51e-49 1.24, 2.71e-11yellow 1042 1.05, 0.326 1.35, 1.9e-13 0.633, 4.69e-05
Enrichment for binding by the Oct4 and cMyc TF Groups and Suz12.Each enrichment score (before the comma) is followed by its corresponding p-value (after the comma) calculated from the hyper-geometric distribution. P-values are uncorrected for multiple comparisons.
Page 7 of 25(page number not for citation purposes)

BMC Genomics 2009, 10:327 http://www.biomedcentral.com/1471-2164/10/327
genes with H3K4 trimethylation in ES cells contain signif-icantly more black module genes than genes without thismarker (Kruskal Wallis test p-value = 6.7 × 10-113) whichmay reflect the active role the pluripotency module playsin ES cells. Interestingly, genes with H3K4 trimethylationor bivalent methylation contain significantly (p = 1.3 × 10-
33) more blue module genes than other gene classifica-tions. Promoters that are both H3K4 and H3K27 trimethi-lated in ES cells (referred to as bivalent promoters) arethought to poise key developmental genes for activationupon differentiation [50].
Mammalian gene promoters are known to fall into one ofat least two major classes: 1) CpG-rich promoters are asso-ciated with both ubiquitously expressed 'housekeeping'genes, and genes with more complex expression patterns,particularly those expressed during embryonic develop-ment and 2) CpG-poor promoters are generally associatedwith highly tissue-specific genes. To understand the roleof CpG content in our modules we analyzed three CpGcontent classifications from Mikkelsen et al(2007): high(denoted HCP), low (LCP), and intermediate (ICP). Fig-ure 3 shows that HCP genes contain significantly moreblack module genes (p = 1.3 × 10-51) and significantlymore blue module genes (p = 2.4 × 10-36) than ICP or LCPgenes. The LCPs are known to have a very different tri-methylation pattern than the HCPs. Few (6.5%) of LCPs
have significant H3K4me3 in ES cells and virtually nonehave H3K27me3. HCPs and LCPs are subject to distinctmodes of regulation. In ES cells, all HCPs seem to be tar-gets of trithorax group activity, and may therefore drivetranscription unless actively repressed by PcG proteins. Incontrast, LCPs seem to be inactive by default, independentof repression by PcG proteins, and may instead be selec-tively activated by cell-type- or tissue-specific factors [50].
Figure 3 also shows promoter CpG methylation in rela-tion to module membership. DNA methylation in mam-malian cells plays multiple roles in cell physiology,including genome stability, repression of endogenous ret-roviral elements, genomic imprinting. Levels of DNAmethylation are dynamically regulated during embroyo-genesis but less is known about the role DNA methylationplay in gene expression and maintenance of pluripotencyin ES cells [51]. Figure 3 shows that methylated genes aresignificantly under-enriched for black module (p = 2.0 ×10⁻¹⁴) and significantly under-enriched for blue modulegenes (p = 5.1 × 10⁻¹¹). In Additional File 5, we present thedata used for cross-referencing module membership toepigenetic regulators.
Variance in kME Explained by Epigenetic Variables
The above results demonstrate highly significant relation-ships between module membership and epigenetic varia-
Relating Module Membership to Epigenetic RegulationFigure 3Relating Module Membership to Epigenetic Regulation. The top 1000 genes with highest module membership in the black module (top row) and blue module (bottom row) are related to 3 epigenetic variables (corresponding to the 3 columns). The y-axis reports the proportion of top 1000 genes that are known to belong to the group of genes defined on the x-axis. Histone H3K4me3 trimethylation status is abbreviated K4, H3K27me3 trimethylation statys is abbreviated by K27. Promoters that are both H3K4 and H3K27 trimethilated in ES cells (denoted K4&K27) are thought to poise key developmental genes for activation upon differentiation [50,51]. Note that genes with promoter CpG methylation are significantly (p = 2.0 × 10⁻¹⁴) under-enriched with respect to the top 1000 black module genes.
K27 K4 K4&K27 None
Black vs Lysine Methyl , p= 6.7e−113
Lysine Trimethylation
Pro
p. B
lack
Mod
ule
0.00
0.10
HCP ICP LCP
Black MM vs CPG , p= 1.3e−51
CPG Class
Pro
p. B
lack
Mod
ule
0.00
0.10
no yes
Black vs Methyl. , p= 2e−14
Methylated
Pro
p. B
lack
Mod
ule
0.00
0.05
0.10
0.15
K27 K4 K4&K27 None
Blue vs Lysine Methyl , p= 1.3e−33
Lysine Trimethylation
Pro
p. B
lue
Mod
ule
0.00
0.10
HCP ICP LCP
Blue MM vs CPG , p= 2.4e−36
CPG Class
Pro
p. B
lue
Mod
ule
0.00
0.05
0.10
0.15
no yes
Blue vs Methyl. , p= 5.1e−11
Methylated
Pro
p. B
lue
Mod
ule
0.00
0.06
0.12
Page 8 of 25(page number not for citation purposes)

BMC Genomics 2009, 10:327 http://www.biomedcentral.com/1471-2164/10/327
bles. In the following, we probe deeper and determine theproportion of variance in module membership that canbe explained by the epigenetic variables. Using analysis ofvariance, we can determine what proportion of the varia-tion in eigengene-based connectivity kME can be explained
by the different epigenetic variables. As can be seen fromTable 2, the epigenetic variables explain only 8.3% of the
variation in and 4.2% of the variation in . For
, histone trimethylation status (p < 2.2 × 10⁻¹⁶, prop.
of variance explained = 6.7%) and cMyc complex binding(p < 2.2 × 10⁻¹⁶, prop. of variance explained = 1.5%)
explain most of the variation. For , histone trimeth-
ylation status (p < 2.2 × 10⁻¹⁶, prop. of variance explained= 3.4%) and CPG class (p = 6.0 × 10⁻¹⁰, prop. of varianceexplained = 0.5%) explain most of the variation. In sum-mary, we find highly significant but relatively weak rela-tionships between module membership and epigeneticvariables.
Signed WGCNA Identifies a Pluripotency Module in data from Zhou et al (2007)To further investigate WGCNA's ability to discover func-tionally important groups of genes, we turned to an inde-pendent data set from Zhou et al (2007) [8]. In this study,ES cells were removed from feeder cells and leukemiainhibitory factor (LIF) to induce differentiation. Duringthe course of differentiation, cells were separated based onexpression of an Oct4 green fluorescent protein (GFP)
reporter gene. Multiple samples were taken from undiffer-entiated ES cells and cells sorted at days 2, 4, 8, and 15 forhigh and low Oct4 expression. As before, we first identi-fied gene modules via signed and unsigned methods andthen related module membership to external data. In thefollowing we show that a pluripotency/self-renewal and adifferentiation module can be found in this new data set.For consistency between data sets, we have colored thesemodules black and blue, respectively.
Cluster Tree Comparison of Unsigned and Signed NetworksSimilar to Figure 2, Figure 4 shows the dendrograms of theunsigned and signed networks with color bands indicat-ing module membership in the unsigned and signed net-works. The heat maps of the expression profiles of genesin the blue and black modules appear the same across theunsigned and signed networks. The dendrograms, how-ever, reveal network differences. Because module genesroughly stay together, we note that the red, black, blue,and yellow modules are partially preserved in the signednetwork. However, the black and blue modules are co-located on the same large branch in the unsigned network(Figure 4a) but are separated onto two distinct branchesin the signed network (Figure 4b), suggesting a change innetwork topology. Therefore, depending on branch cut-ting methods used, the blue and black modules could eas-ily be merged into a larger module in the unsignednetwork. Indeed, the structure of the dendrogram in Fig-ure 4a suggests that the black and blue modules (alongwith the turquoise, magenta, and brown) may compriseone large module. For illustrative purposes, we have sepa-
kMEblack kME
blue
kMEblack
kMEblue
Table 2: Module Membership Versus Epigenetic Variables
Source of Variation in kME kMEblack, Total Prop Var Explained = 8.3% kMEblue, Total Prop Var Explained = 4.2%Source Degrees Of
FreedomSums of Sq Prop. Of Total Var p-value (F test) Sums of Sq Prop. Of Total Var p-value (F-test)
Histone Trimethylation
(K4, K27, K4&K27, none)
3 170.91 0.067 < 2.2E-16 30.49 0.034 < 2.2E-16
cMyc Complex 1 39.21 0.015 < 2.2E-16 1.48 0.002 2.6E-04Oct4 Complex 1 8.62 0.003 8.0E-08 0.79 0.001 7.5E-03
CPG class (HCP, ICP, LCP)
2 4.56 0.002 4.9E-04 4.71 0.005 6.0E-10
PcG Bound 1 0.88 0.000 8.7E-02 0.19 0.000 1.9E-01CpG Methylated 1 0.04 0.000 7.1E-01 0.58 0.001 2.2E-02Residual Error 7846 2353.8 0.917 868.36 0.958
Total Variation 7855 2567.11 906.6
This analysis of variance table reports which epigenetic variables and TF binding data have a significant effect on (columns on the left hand
side) and (columns on the right hand side). For each variable (source of variation), the columns report the degrees of freedom, the sums of
squares, the proportion of total variance explained by the variable and the corresponding F-test p-value. Note that histone trimethylation status is
the most significant source of variation for both and .
kMEblack
kMEblue
kMEblack kME
blue
Page 9 of 25(page number not for citation purposes)

BMC Genomics 2009, 10:327 http://www.biomedcentral.com/1471-2164/10/327
rated them into smaller modules. In the signed network,on the other hand, the black and blue modules willremain separate regardless of the branch cutting tech-nique employed.
Module Membership in Unsigned and Signed NetworksFigure 5 shows the module eigengene based connectivity,kME, of genes in the black and blue modules plottedagainst their fold change between samples with high and
low Oct4 expression as defined in Zhou et al (2007). Fig-ures 5a and 5b show that the unsigned black and bluemodules each contain genes from both the signed blackand blue modules. However, these genes are clearly sepa-rated by fold change and connectivity. Furthermore, boththese unsigned modules contain two types of genes,pluripotency/self-renewal related genes and differentia-tion related genes. For example, the unsigned black mod-ule has pluripotency TFs Oct4, Nanog, and Esrrb, while
Unsigned and Signed Networks of the Zhou et al ES Expression DataFigure 4Unsigned and Signed Networks of the Zhou et al ES Expression Data. a, left, Dendrogram of the unsigned network of the Zhou et al (2007) data with color bands below indicating module membership for the unsigned network (U) and the signed network (S). a, right, A heat map shows microarray expression profiles accross samples for genes in the blue and black modules in the unsigned network. b, left, Dendrogram of the signed network of the Zhou et al (2007) data with color bands below indicating module membership for the signed network (S) and the unsigned network (U). b, right, heatmap of expres-sion profiles (rows) across samples (columns) for genes in the blue and black modules in the signed network.
� ��
� ��
� ��
� ��
�
�
�
�
�
�
�
Unsigned
Signed
Oct4 Sorted + Oct4 Sorted -
Bla
ckB
lue
Blu
eB
lack
(a)
(b)
Page 10 of 25(page number not for citation purposes)

BMC Genomics 2009, 10:327 http://www.biomedcentral.com/1471-2164/10/327
also having Tcf7l2, which is known to play a role in differ-entiation. The unsigned blue module has pluripotencygenes Sox2, Dppa4, Dppa5, Utf1, and Phc1 along withdifferentiation genes Gata4, Gata6, Cited2, and a secondprobe for Tcf7l2. Figures 5c and 5d show the black andblue modules in the signed network. These modules con-
tain genes that not only have consistent fold changes andconnectivities but also have consistent functional roles.Here the black module contains genes expressed similarlyto Oct4 including (Nanog, Sox2, Dppa4, Dppa5, Utf1,and Phc1). Many of the genes found to induce differenti-ation when knocked down by Ivanova et al are in this
Expression Changes Versus Module Membership in the Black and Blue Modules (Zhou et al)Figure 5Expression Changes Versus Module Membership in the Black and Blue Modules (Zhou et al). Module member-ship, kME, is plotted against log2 expression fold change (FC) for the black (a) and blue (b) modules in the unsigned network of the Zhou et al (2007) data. FC is the ratio between the average expression in Oct4 positive samples and Oct4 negative micro-array samples. Known ES cell regulators are labeled. Genes are colored by module membership in the signed network. c and d are analogous to a and b but module membership is with regard to the signed black and blue modules.
kME
kME
kME k
ME
log
2 Fo
ld C
han
ge
log
2 Fo
ld C
han
ge
log
2 Fo
ld C
han
ge
log
2 Fo
ld C
han
ge
EsrrbNanog
Oct4
Tcf7l2
Dppa5Dppa4Tcl1
Sox2Phc1
Gata6Bmp2
Gata4Cited2
Tcf7l2
Utf1
Dppa4-5Nanog,Esrrb,Tcl1
Utf1Sox2
Phc1
Oct4
Gata6Bmp2
Gata4Cited2
Tcf7l2
(a) (b)
(c) (d)
Unsigned
Signed
Black
Black
Blue
Blue
Page 11 of 25(page number not for citation purposes)

BMC Genomics 2009, 10:327 http://www.biomedcentral.com/1471-2164/10/327
module (Oct4, Nanog, Sox2, Esrrb, Dppa4, and Tcl1,Fisher's exact test, p-value = 1.01 × 10⁻⁵). The blue moduleconsists of genes that become expressed when Oct4 isdown-regulated upon differentiation and contains manyhighly connected genes related to ES cell differentiation(Gata4, Gata6, Cited2, Bmp2, Tcf7l2, and Foxa12). Theseresults confirm our earlier finding that the signed blackmodule is a pluripotency module while the signed blue isa differentiation module.
A Comparison of Transcription Factor Binding Enrichment in Unsigned and Signed NetworksThis conclusion is further supported by our analysis of TFbinding patterns in the modules of the Zhou et al network.Table 3 shows enrichment for binding by the Oct4 andcMyc groups of TFs and Suz12 from ChIP-seq data fromChen et al [16]. In the signed network the black, brown,and red modules are enriched for binding by transcriptionfactors in the Oct4 and cMyc groups and are under-enriched for Suz12 binding. This is not surprising sincethe black, red, and brown modules are co-located on thesame large branch in the signed network (Figure 4b),which shows that they have similar expression profilesand share many of the same gene connections. The bluemodule, on the other hand, is under-enriched for genesbound by the Oct4 group TFs. These results were alsofound when using Oct4, Nanog, and PcG binding datafrom two other studies (Loh et al (2006) and Boyer et al(2006)) (Additional File 6). The identification of thebrown module and the increased enrichment of the black
module in the signed network show that signed WGCNAis better at grouping genes into modules based on tran-scriptional regulation. Furthermore, the black and bluemodules are well separated in the signed network (Figure4b), while in the unsigned network branch cutting coulderroneously group them into one large module (Figure4a).
Functional Enrichment Analysis of the Pluripotency and Differentiation Modules
Given that there was significant overlap between thepluripotency modules and differentiation modules of theIvanova and Zhou networks, we focused further analysison the network constructed from the Zhou et al data set asthis network was based solely on differentiation inducedexpression changes. We determined functional enrich-ment using the Database for Annotation Visualizationand Integrated Discovery (DAVID) [53]. Table 4 showsthe significantly enriched GO terms for genes with the 5%
highest . In agreement with the finding that the blue
module is related to differentiation, genes within thismodule are significantly enriched for a functional groupcontaining organ development, system development, andcell differentiation (p-value = 0.002). Other highlyenriched groups are involved in regulating protein locali-zation (p-value = 9.7 × 10⁻¹⁷) and membrane composition(p-value = 5.6 × 10⁻⁸).
kMEblue
Table 3: Transcription Factor Binding in Zhou et al Networks
Unsigned NetworkModule No. of genes Oct4Complex cMycComplex Suz12
black 2659 1.55, 2.08e-09 1.4, 4.18e-46 0.666, 6.21e-10blue 1484 0.872, 0.172 1.09, 0.0125 1.01, 0.447brown 992 1.2, 0.093 1.02, 0.315 1.11, 0.127green 1493 0.758, 0.028 0.863, 0.000186 1.36, 4.79e-06grey 7318 0.766, 1.87e-08 0.803, 1.69e-51 1.2, 7.19e-14magenta 1583 0.919, 0.28 1.04, 0.147 1.1, 0.0982red 2593 1.48, 2.3e-07 1.64, 4.02e-107 0.437, 2.49e-26turquoise 838 0.997, 0.459 1.3, 1.74e-08 0.829, 0.0631yellow 2002 1.08, 0.213 1.1, 0.00171 0.844, 0.0106
Signed Networkblack 1859 1.94, 2.94e-15 1.4, 4.22e-30 0.523, 2.19e-13blue 1972 0.656, 0.000465 1.03, 0.18 1.13, 0.03brown 1267 1.45, 0.000755 1.72, 1.22e-59 0.411, 5.78e-14green 1548 0.818, 0.0763 0.933, 0.0414 1.27, 0.000329grey 7175 0.729, 1.64e-10 0.784, 2.34e-59 1.24, 2.7e-18pink 659 0.941, 0.432 1.27, 5e-06 0.474, 2.48e-06red 2184 1.48, 2.18e-06 1.63, 1.7e-85 0.493, 9.37e-18turquoise 2317 0.896, 0.156 1.05, 0.0498 1.09, 0.0716yellow 1870 1.17, 0.0587 1.05, 0.0545 0.885, 0.054
Module enrichments for binding by the Oct4 and cMyc TF Groups amd Suz12. Each enrichment score (before the comma) is followed by its corresponding p-value calculated from the hyper-geometric distribution (uncorrected for multiple comparisons).
Page 12 of 25(page number not for citation purposes)

BMC Genomics 2009, 10:327 http://www.biomedcentral.com/1471-2164/10/327
Table 4 also shows significant GO terms for genes with the5% highest . Given that many pluripotency TFs arein the black module, it is not surprising that the functionalclassifications, DNA binding and transcriptional regula-tion, are significantly enriched (p-value = 5.4 × 10⁻⁸).However, two functional classifications, DNA damage/repair and mitochondrial function, are more significantlyenriched than the transcriptional regulation group (p-val-ues = 2.0 × 10⁻⁸ and 3.8 × 10⁻⁸, respectively) suggestingthat these pathways play important roles in maintainingpluripotency and self-renewal.
We also used Ingenuity Pathway Analysis, IPA, to comparefunctional enrichment in the pluripotency and differenti-ation modules (Ingenuity Systems, http://www.ingenu-ity.com). Additional File 7 shows that functional groupssimilar to those found using DAVID are enriched in theblack and blue module respectively. Cell cycle and DNAreplication, recombination, and repair are enriched in theblack module compared to the blue module and skeletal,muscular, and cardiovascular system development areenriched in the blue module.
Comparison to a Standard Differential Expression AnalysisHere we compare some of our WGCNA results with thoseof a standard differential expression analysis. In Figure 2cand Figure 5 we showed that for some modules a strongrelationship between module membership (kME) and dif-ferential expression (gene significance/fold change) canbe observed. In [33], we provide a geometric descriptionof modules for which such a relationship can be observed.While a close relationship may exist between kME and aStudent t-test statistic, it does not imply that correspond-ing gene ranking procedures are equivalent.
Here we compare signed WGCNA to standard differentialexpression methods using three different approaches.First, we show that a gene ranking based on kME is moreconsistent (reproducible) than that based on the Studentt-test in our data. Specifically, we computed two generankings for the Ivanova et al data set, one ranked by t-sta-tistic and the other by connectivity to a module of interest.We similarly computed two such rankings for the Zhou etal data set and studied the overlap between the two datasets (Additional File 8). Of the 1000 genes most signifi-
kMEblack
Table 4: Functional Pathways in Highly Connected Pluripotency and Differentiation Related Genes in the Zhou et al Network
p-value Functional Groups Blue Module highly connected genes (kME)
9.72E-17 er-golgi transport; protein localization; protein transport; vesicle-mediated transport; secretion by cell; cellular localization; secretory pathway; intracellular transport;
Myl6 (0.994), Sh3glb1 (0.993), Tm9sf3 (0.993), Tram1 (0.992), Derl1 (0.991), Serinc1 (0.991), Lman1 (0.991), Lrp10 (0.991), Mcfd2 (0.99), Mcfd2 (0.99), Tmed10 (0.99), Tpcn1 (0.989), Arl1 (0.989), Tinagl (0.987), Rab2 (0.987), Txndc1 (0.987), Col4a1 (0.987)
5.65E-08 Glycan structures – biosynthesis 1; signal-anchor; transferase activity, glycosyltransferase
Glt8d1 (0.993), Creb3 (0.991), Fut8 (0.99), Fkrp (0.99), Extl2 (0.989), Glt8d3 (0.987), Itm2c (0.986), Hs3st1 (0.986), Pofut2 (0.986), Dpagt1 (0.985), Mgat2 (0.983), Abhd6 (0.982), Ddost (0.982), Ndst2 (0.981), B4galnt1 (0.981), St3gal6 (0.98)
2.98E-06 membrane; transmembrane; transmembrane region; topological domain:Cytoplasmic
H13 (0.996), Pdgfra (0.994), Cd59a (0.994), Glt8d1 (0.993), Sh3glb1 (0.993), Tm9sf3 (0.993), Tram1 (0.992), Gdpd5 (0.991)
0.00185 organ development; system development; anatomical structure morphogenesis; cell differentiation; organ morphogenesis
Pdgfra (0.994), Myl6 (0.994), Sh3glb1 (0.993), Lmo4 (0.992), Rgnef (0.989), Syvn1 (0.988), Kit (0.988), Fndc3b (0.988), Txndc1 (0.987), Lama1 (0.987), Barx1 (0.986), Col4a2 (0.986), Ctgf (0.985), Fgf3 (0.985), Crim1 (0.983), Pthr1 (0.983)
p-value Functional Groups Black Module highly connected genes (kME)
1.98E-08 response to DNA damage stimulus; DNA damage; DNA repair Msh6 (0.993), Rif1 (0.983), Mre11a (0.982), Setx (0.974), Xrcc5 (0.971), Chek1 (0.968), Xab2 (0.967), Xrn2 (0.967), Trp53 (0.959), Npm1 (0.958), Tdp1 (0.955), Bccip (0.954)
3.75E-08 Mitochondrion; transit peptide; Mitochondrion Mrpl15 (0.992), Ppif (0.991), Mrps5 (0.987), Hspa9 (0.984), Coq3 (0.984), Tst (0.981), Mrpl45 (0.98), Akap1 (0.979), L2hgdh (0.978), Mrps31 (0.978), Chchd4 (0.976), Abce1 (0.975), Dci (0.975), Fpgs (0.974), Mrpl39 (0.973), Bdh1 (0.971)
5.83E-08 nucleus; biopolymer metabolic process; DNA binding; cellular metabolic process; Transcription regulation;
Msh6 (0.993), Pes1 (0.991), Zic3 (0.991), Uchl1 (0.99), Rnf138 (0.99), Rnf138 (0.99), Wdr36 (0.989), Pou5f1 (0.989), Rbpj (0.987), Glo1 (0.987), Tdgf1 (0.987), OTTMUSG00000010173 (0.986), Aarsd1 (0.986), Nup133 (0.985), Xpo1 (0.985), Xpo1 (0.985), Dnajc6 (0.985), Klhl13 (0.984), Dppa4 (0.984),
5.26E-04 cell cycle phase; cell cycle process; cell cycle; mitotic cell cycle; mitosis; cell division
Pes1 (0.991), Rif1 (0.983), Mre11a (0.982), Gtpbp4 (0.972), Chek1 (0.968), Mnat1 (0.966), Rcc2 (0.964), Gadd45gip1 (0.963), Rpa1 (0.961), Hells (0.96), Trp53 (0.959), Terf1 (0.959)
Enriched GO terms of genes with the highest 5% black and blue kME's. Highly connected genes in each functional group are given. All kME values are highly significant (Bonferroni corrected p-value < 0.00015).
Page 13 of 25(page number not for citation purposes)

BMC Genomics 2009, 10:327 http://www.biomedcentral.com/1471-2164/10/327
cantly down regulated upon differentiation in each dataset 139 overlap (hyper-geometric p-value = 1.0 × 10⁻²⁰).However, when ranking genes by connectivity to eachdata set's pluripotency model there is an increase in over-lap to 230 (p-value = 1.7 × 10-75, Additional File 8). Thisincreased consistency is also seen in genes up regulatedupon differentiation where 77 genes overlap between thetwo data sets (p-value = 0.02) when ranking by t-statisticand 161 genes overlap when ranking by connectivity tothe differentiation modules (p-value = 2.8 × 10⁻³¹, Addi-tional File 8).
A second approach for comparing gene rankings is to usethe functional enrichment with regard to known geneontologies. To compare the abilities of kME versus the con-ventional t-statistic in identifying functionally interestinggroups of genes we consider functional enrichment ofgenes found by one ranking method but not the other(Figure 6). Of the 1000 genes most strongly connected tothe Ivanova et al pluripotency module (black), 463 over-lap with the 1000 genes most significantly down regulatedupon Oct4 RNAi in the same data set. Figure 6 shows thefunctional enrichment from Ingenuity Pathway Analysis,IPA, of the 537 genes in each group that do not overlap.Genes found only by signed WGCNA are significantlyenriched for functions important to ES cells like DNAReplication, Recombination, and Repair, Cell Cycle, Can-cer, Protein Synthesis, and RNA Post-TranscriptionalModification, which have previously been found usingnetwork methods [54]. Generally, genes identified bysigned WGCNA exhibit more significant enrichment offunctional classifications than those found by standarddifferential analysis.
We similarly compare the 1000 most highly connectedgenes in the differentiation (blue) module and the 1000genes that are most significantly up regulated upon Oct4RNAi in the Ivanova network. Interestingly, only fivegenes overlap (Figure 6). By examining those genes thatdo not overlap we see that ranking by connectivity yieldsgreater significant enrichment for many functional groupsimportant in ES cell differentiation including OrganDevelopment, Tissue Development, Cell Morphology etc.
Similar analysis of pluripotency genes in Zhou et al yieldsconsistent results with DNA Replication, Recombination,and Repair being more enriched when ranked by connec-tivity (Additional File 9) while analysis of highly con-nected genes in the differentiation module shows thatdifferential analysis moderately out performs ranking byconnectivity. The differences in functional enrichment inthe Zhou et al data set are subtle given that there is moreoverlap between the two rankings (Additional File 8). Thislarge overlap is likely due to the simplicity of the expres-sion array samples which are filtered into only two
groups, those that exhibit Oct4 expression and those thatdo not. Meanwhile, signed WGCNA is especially useful inIvanova et al where smaller overlap is caused by the com-plexity of the expression samples which are made of manydifferent RNAi treatments.
A third approach for comparing gene rankings is to use theenrichment with regard to epigenetic and transcriptionalregulators. In Additional File 4 we relate different generankings to enrichment significance with regard to the fol-lowing variables (a) histone H3K4 alone versus all others,(b) bivalent H3K4 & H3K27 versus all others [50], (c)High CPG class versus all others (i.e. HCG versus ICG andLCG), (d) promoter CPG methylation status [51], (e) Oct4 complex binding status, (f) cMyc complex binding sta-tus. We report results for 3 different gene rankings usingthe Ivanova data: the black and blue curve represent generankings according to and , respectively. Thegrey curve represents ranking according to a Student T-testof differential expression. Additional File 4 shows thatblack and blue module genes can have very differentenrichment results that tend to be very different fromthose of a standard analysis. This analysis illustrates howmodule membership provides important complementaryvariables along the Student t-test for understanding differ-ences between genes.
The increased functional enrichment and improved con-sistency between data sets suggest that signed WGCNA isa complementary method to standard differential analy-sis. In practice, we recommend to use both kME and theStudent t-test to find highly differentially expressedintramodular hub genes.
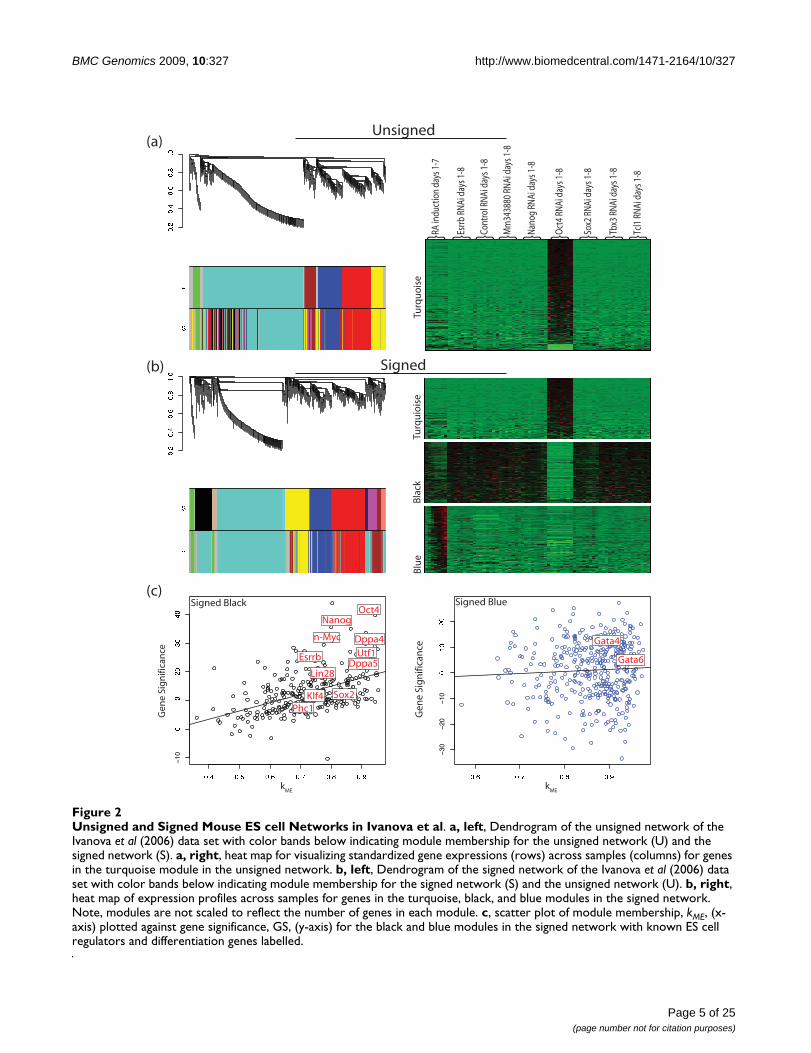
Pluripotency Module Genes involved in Transcriptional Regulation and Chromatin Structure
To gain a better understanding of the regulatory networkinvolved in maintaining ES cell pluripotency and self-
renewal, we first looked at genes with high black
and GO terms related to transcriptional regulation orchromatin structure. Figure 7 lists such genes and containsinformation about how these genes are bound by TFs inthe Oct4 and cMyc groups, and Suz12 plus Klf4, Esrrb,
and Tcfcp2l1. The sign of black allows us to distin-
guish genes that promote pluripotency from those thatrepress it. As expected, many of the genes with high posi-
tive module membership measure ( ) are known to
participate in ES cell regulation (Zic3, Mkrn1, Phc1, Esrrb,Jarid2, Nodal, Jarid1b, Tgif1, Utf1, Hells, and Rest)[20,55,56]. Importantly, four TFs capable of reprogram-ming differentiated cells into a ES cell like state are in thislist (Sox2, Klf2, Nanog, and Pou5f1(Oct4)) [10,11], con-
kMEblack kME
blue
kMEblack
kMEblack
kMEblue
Page 14 of 25(page number not for citation purposes)

BMC Genomics 2009, 10:327 http://www.biomedcentral.com/1471-2164/10/327
firming that the black module captures the known coretranscriptional regulatory network responsible for main-taining a cell's stemness. Genes with high positive values
of black module membership ( ) but have not been
implicated in maintaining pluripotency and self-renewal
should therefore be strong candidates for further func-tional study. Such genes include Msh6 (involved in DNAdamage and repair [57]), Rbpj (involved in Notch signal-ing [58]), Zfp39 (spermatogenesis [59]), and Nrf1 (mito-chondrial organization and biogenesis [60]). Similarly,many of the highly negatively connected genes in the
kMEblack
Comparison of Genes Ranked by Network Connectivity and Differential Expression in the Ivanova et al data setFigure 6Comparison of Genes Ranked by Network Connectivity and Differential Expression in the Ivanova et al data set. Ingenuity Pathway Analysis of functional enrichments in the set of genes ranked within the top 1000 by Student's t-test and kME and yet do not overlap with each other. Venn diagrams show the amount of gene overlap between the top 1000 black (pluripotency) module genes and the top 1000 genes most significantly down-regulated upon Oct4 RNAi (left); gene overlap between the top 1000 blue (differentiation) module genes and the 1000 genes most significantly up-regulated with Oct4 RNAi (right). Significance of differential expression was determined using Student's t-statistic. p-values have been corrected for multi-ple hypothesis tests (Benjamini-Hochberg). Only significantly enriched functional groups are shown.
Page 15 of 25(page number not for citation purposes)

BMC Genomics 2009, 10:327 http://www.biomedcentral.com/1471-2164/10/327
Page 16 of 25(page number not for citation purposes)
Transcriptional Regulators related to Pluripotency and Differentiation in the Zhou NetworkFigure 7Transcriptional Regulators related to Pluripotency and Differentiation in the Zhou Network. TF and Suz12 bind-ing in the promoter regions of highly connected genes related to ES cell pluripotency and self-renewal with GO terms of tran-scriptional regulation or chromatin structure. Genes are listed by black kME (positive, left and negative, right) along with their corresponding significance level (log10 of the Bonferroni corrected p-value generated by a correlation test). Binding data from Chen et al (2008), Boyer et al (2006), and Loh et al (2006), are marked in blue (bound) and beige (unbound). For Oct4, Sox2, and Suz12, where binding is given by two studies, binding will be blue if it is found in both studies and light blue if found in only one.
� � � � � � � � � � � � � � �
� � � � � � � � � �� � � � � � � � �� � � � � � � � � �
� � � � � � � � �� � � � � � � � �� � � � � � � � � �� � � � � � � � � � �
! � � � � � � � � � " # � � � � �
$ ! � � ! � � � �% � � � � �
� � � � � � � � � � �& � ! # � � � � �
� � ' � � � � � � � ! � � � � � � � � �% ! � ! � # � � � � �
( ) � � � � � '% * � � � � � � �
+ � � � � � �( � ! � � ' � � � � �( � ! � � � � � �� � ! � � � � � �+ � � � � � �& � � � � � � � �
, � � � � � � � �� � ! � � � � � � �
- � � # � ! � � � � �� � " ) # � � � � � �� # � � � � � � � �$ � � # � � � � � '. # � � � � � � �
� � � ' ' � � � � � � � � � � � � �
� � � � � � � � � ! � � � � � � � �
� � ! � � � � �/ # � � � � � �0 1 # # � � � � �& � � � � � � � �
% � 1 ! � � � � � � � � � � � � � � � �
( � � � � � � � �2 � � � � � � � � � � �
% � � � � � � � � �. # � � � � � � �� 3 � # � � � � � �4 1 � � � � � � � �� 1 � � � � � � �& ! � * � � � � '( � ! � ' � � � � �2 � � � � � � � �
Oc
t4
Na
no
g
So
x2
Sm
ad
1
Sta
t3
cM
yc
nM
yc
Klf
4
Esrr
b
Tc
fcp
2l1
Zfx
E2
f1
Su
z1
2
5 6 7 8 9 : ; 7 7< = > ? 8 9 : ; 7 7
5 @ A B B ; 8 9 : ; 7 B< C D = 8 9 : ; 7 B
5 E F G H I I 8 9 : ; 7 JK L 6 M 8 9 : ; 7 NK E = H B 8 9 : ; 7 NO P Q = @ 8 9 : ; 7 N
R S T S U V W X V T Y Z [ 8 9 : ; 7 M\ ] ^ _ I D I 8 9 : ; 7 M5 @ A ; I 8 9 : ; 7 `
K P > Q a 8 9 : ; 7 `b ? H a 8 9 : ; 7 ;O ^ > 8 9 : ; BO E L B 8 9 : ; BK = A 7 9 D 8 9 : ; B Ic = > ] ^ A I 8 9 : ; B IO = ^ ^ N 8 9 : ; B I
5 @ A a ` a 8 9 : ; B a< = P I 8 9 : ; B 7c > C ? 7 8 9 : ; B Bd = ? I 8 9 : ; B B
e A A 8 9 : ; B J< C > C 8 9 : ; B J
f E g H 7 8 9 : ; B Jb 6 P I 8 9 : ; B Mh = > 6 I 8 9 : ; B M
i C = H B 8 9 : ; B ;j ? 6 a 8 9 : ; B ;
5 @ A M N ` 8 9 : ; Jk = Q = N 8 9 : ; J< _ L > I 8 9 : ; Jd @ = Q _ I 8 9 : ; J I
e ? D P E I 8 9 : ; J al G @ B = 8 9 : ; J `
m = @ a 8 9 : ; J ;b = E D I 8 9 : ; J ;
i _ @ M D a 8 9 : ; N aK C > Q = H a 8 9 : ; N 7k = Q = B 8 9 : ; N B
n ? A I 8 9 : ; N Bd > a _ I 8 9 : ; N Jb ^ D 7 I 8 9 : ; N Jc > Q _ 7 8 9 : ; N Mo C = A I 8 9 : ; N MK P 6 J 8 9 : ; Mp L 6 = a 8 9 : ; Mj P Q 6 I 8 9 : ; M aO ] 6 ` 8 9 : ; M ac > C ? 7 D I 8 9 : ; M 7b = q C H I 8 9 : ; M Jc P Q C H a 8 9 : ; M NO = ^ ^ a 8 9 : ; M ;
Oc
t4
Na
no
g
So
x2
Sm
ad
1
Sta
t3
cM
yc
nM
yc
Klf
4
Esrr
b
Tc
fcp
2l1
Zfx
E2
f1
Su
z1
2
k ME
(Bla
ck)
k ME
(Bla
ck)
Incr
ea
sin
g k
ME
De
cre
asi
ng
kM
E
r r s t u u r u u u u u u u ru u r u r r u r u u r u ru u u u u r u u u u u u r
r s t r s t u u u u u u r u r r ru u u u u u u u u u u u rr r r r r r r r r u r u r
r s t r s t u u u r r u u r r u rr r s t r r r r r r r r r r rr r r r r r r r r r u r r s tu u u u r u r u u r u u ru r s t u u u u u r r r u u r
r s t r s t r r u r u r u u u u rr r r r u u r u u r u u r
r s t r s t r r u r u r r u r u rr s t u r u u u r u u u u u rr r r r r u u r r r u u r
r s t r s t u r r u u u r u u u rr r s t r r r u u r r u u u ru u r u u u u r r r u u ru u r r u u u u r u r u r
r s t u u u u u u u u u u u rr r r r r r u u r r u u rr r r r r u r u r u r u ru u u r u u u u u r u u rr r s t u r u u u r r u u u r
r s t r r u u u u r u u u u rr u r r r r u u u u u u rr r r u r u r u r r r u r
r st r st r u u u r u r r r u rr st r st u u u r u r r u u u rr st r r r r r u u r u r u rr st r st u u u u r u u u r r rr st r st u u u u u u u u u u rr st u u r r u u u u u u u rr r r r r r r u u r u u ru r u r r r u r r u r u rr st r st u r u u u u u u u u rr r r r r u u u u r u u rr r r r r u u r r r u u rr r st r r u r u r r u u u rr u r r u u u r r r u u rr u u u r u u u r u u u rr r u r r u u r u u r u rr r r r r u u u r r u u rr r r r r r r r r r r r ru r st u u u u u u u u r u ru u u u u r u u u u u u r st
r st u u u u u r u u u u u rr st r u r u r r r u r r u ru u u r u u u r r u u u r
r st r st u u u r u u u u u u rr r r r r r r r r r r r r
r st r u r r r r r r r r r r
v wx v v v y v v v v y y y v wxv v v v v v v v y v v v vv v v v v v v v v v v v vv v v v y y y v v v y y vv v v v v v v v y v y v vv v v v v v v v v y v v yv v v v v y y v v v y y vv v v v y v v v v y v y vv w x vw x v v v v v v y v y y vv v v v y v y v y v y v vv v v v v v y v v v y y vv v y v y y v v y v y v v
v w x v y v y y y y y v v y vv v v v v y v v v v v y vv v v v v v v v v v y y vv vw x y v y v v v y y y y v
v w x v v v v v v y v v v y vy v v y y v v v y v v v v
v w x v v v v v v y v v y v vv vw x v v y y v v v y y v v wx
v w x v v v y v v y y y y y vv v v v v v v v v v v v v wxv v v v v v v v v v v v v wxv v v v v v v v v v v v vv vw x v v y y y y y y v y v
v w x v v v v y v v v v v y vv v v v v v v v v v v v yv v v v y y y y y y y y vv v v v v v v v y v y v vv v v v v v y y y v v v v
v w x v v v v v v v y y v v yv v v v v v v v v y y y vv v v v v v v v y v v v yv v v v y v v v v v v v vv v v v v v v v v v v v vv v v v v v v v v y y v yv v v v v v v v v y v v vv v y v v v v v y y y v v
v w x v y v v y y y y y y y vv v v v v v v v v v v v yv y y v y y y y v v y y vv v v v v v v v v v v v vv v v v v v v v v v y y v
v w x v w x v v y v v v v v y v yv v v v v y y v y y y y v
v w x v v v v v y y v v v v vv v y v v v v v v v v v yv v y v v v v v v v v v yv v v v v v v v y v v v yv v v v y y v v y v v v vv v v v v v v y v v v y v
v w x v wx y v v y y y y y v y vv w x v wx y v y y y y v y y y v
z { |z { } ~ �z { � ~ |z { { ~ �
z { �z { � ~ �z { � ~ �z { � ~ }z { � ~ }z { � ~ }z { � ~ �z � � ~ �z � � ~ �
z � �z � � ~ �z � � ~ �
z � � ~ �z � � ~ �z � � ~ {z � | ~ }z � | ~ }z � | ~ �z � | ~ �z � � ~ �z � � ~ }z � � ~ �z � � ~ �z � � ~ {z � � ~ �z � � ~ �z � � ~ �z � } ~ �z � } ~ |z � } ~ |z � } ~ �z � } ~ �z � } ~ �z � } ~ {z � } ~ �z � } ~ �
z � }z � }z � }z � }
z � � ~ �z � � ~ �z � � ~ |z � � ~ }z � � ~ �z � � ~ �z � � ~ {z � � ~ �
z � �
� � � � �� � � � �� � � � �� � � � �� � � � �� � � � �� � � � �� � � � �
� � �� � � � �� � � � �� � � � �� � � � �� � � � �� � � � �� � � � �� � � � �� � � � �� � � � �� � � � �� � � � �� � � � �� � � � �� � � � �� � � � �� � � � �� � � � �� � � � �� � � � �� � � � �� � � � �� � � � �� � � � �� � � � �� � � � �
� � �� � �
� � � � �� � � � �� � � � �� � � � �� � � � �� � � � �� � � � �� � � � �
� � �� � � � �� � � � �� � � � �� � � � �� � � � �� � � � �� � � � �
Sig
nifi
can
ce
Sig
nifi
can
ce
� � � �� � � �
� � � �� � � �� � � �� � � �� � � �
� � �� � � �� � � �� � � �� � � �� � � �� � � �
� � � �� � � �� � � �� � � �� � � �� � � �
� � � �� � � �
� � �� � � �� � � �� � � �� � � �� � � �� � � �� � � �� � � �� � � �� � � �� � � �
� � �� � � �� � � �� � � �� � � �� � � �� � � �� � � �� � � �� � � �� � � �� � � �
� � � �� � � �� � � �� � � �
� � �� � � �� � � �
� � � � �� � ¡ ¢� � £ ¤� � £ ¥
� ¦ � ¢� � � ¢ ¤� ¦ � ¢ ¢� � ¡ §
� � §� ¦ � ¥ ¥� � ¦ £� � ¢ ¤� � � £ �� � ¦ � � ¡ ¡� ¦ � ¥ �� � � £ £� � � ¢ §� � �� � � ¦ ¤� � ¤ ¢� � ¤ §
� § � £� �
� � § �� � � ¤� � � � � ¢ �� � � ¢� � ¢� � � ¤ �� � ¢ ¥� � � ¡� � � ¢� � ¥ ¢� � � § � � § §� £ � § �� � ¦ � � � � ¥� � ¥ �� � ¦ £� § � � ¡� � � ¤ ¤� � � §� ¦ � ¡ ¥� � � ¤ � § � ¦ £� � £ ¢� £ � ¤ ¡� � ¢ §� § � ¥ �� � �
log
2(F
C)
log
2(F
C)

BMC Genomics 2009, 10:327 http://www.biomedcentral.com/1471-2164/10/327
black module are known to play a role in ES cell differen-tiation (Cited2, Gata4, Gata6, Tead4, Foxa2, and Sox7).
Because and are highly negatively correlated (r
= -0.99), genes with high positive have negative
and vice versa. Highly negatively connected genes
that are not known to be involved in ES cell differentia-tion are also candidates for functional investigation. Somegenes like Maged1 are known to play a role in cell differ-entiation but have not been shown to be important in EScell differentiation specifically [61]. Other genes like Lass2have little known about their role in cell differentiation.Figure 7 also shows that genes positively connected to theblack module tend to be bound by more ES cell relatedTFs compared to the negatively connected genes, support-ing the idea that these TFs bind and activate pluripotencyand self-renewal genes [13].
Pluripotency Module Genes not Involved in Transcriptional Regulation or Chromatin Structure
Genes that are not involved in transcriptional regulationor chromatin modification (as defined by GO analysis)
but have high average are also of interest. Figure 8
lists such genes along with TF and Suz12 binding informa-tion, connectivity, and fold change. Once again theimportance of some genes has been validated, while oth-ers should be candidates for further research. Genes likeDppa5, Dppa4, and Tcl1 are markers of pluripotency andNup133, a nuclear pore complex subunit, has recentlybeen shown to be necessary in the maintenance ofpluripotency [62]. Nup133 highlights the usefulness ofsigned WGCNA. Using the t-statistic from standard differ-ential analysis Nup133 is ranked 222th most significantlydown regulated upon differentiation while using connec-tivity its rank moves to 28th. Other candidate genesinclude Sh3gl2, which binds lipids and proteins [63],Mrpl15, a mitochondrial ribosomal protein, and Ppif,involved in mitochondrial function and oxidative stress-induced cell death [64]. Of the negatively connected genesin Figure 8, Ctsl (cathepsin L) has recently been shown tocleave the histone H3 N-terminus during ES cell differen-tiation [65], while little is known about Ctsz, also a cathe-psin, while Gnas and Ctgf are differentiation genes[66,67]. The high negative connectivity of Uqcrh, a mito-chondrial inner membrane protein [68], along with thehigh positive connectivity of Mrpl15 and Ppif, confirmsthat mitochondrial regulation may be distinct in ES cells[69-71] and suggests that they may be important regula-tors of mitochondrial function in ES cells.
Pluripotency Module Genes that Lack Binding by Known Pluripotency TFs
Figure 9 shows genes with relatively high that lack
binding by the TFs Nanog, Oct4, Sox2, and Klf4 [10,11]
and have low binding (≤ 2) by other TFs that maintainpluripotency (Smad1, Stat3, cMyc, nMyc, Esrrb, Tcfcp2l1,Zfx, and E2f1). Transcriptional regulators that have highpositive module membership in the black module butlack binding by the pluripotency TFs are of interest sincetheir strong module membership cannot be explained via
regulation by these TFs. Their high average suggests
that they may be upstream regulators of Oct4, Sox2,Nanog, and other genes important to pluripotency.
To further investigate the role of these genes, we usedmotif scanning methods described in Zhou et al (2007)[8] to determine if the binding sites of these genes are con-tained in regions co-bound by TFs in the Oct4 group orcMyc group in ChIP-seq data from Chen et al (2008). Weconcentrated solely on Lrh1 (Nr5a2) and Elk1 since theirmotifs have known position specific weight matriceswhile the other genes lack known motifs. Table 5 showsthe enrichment and significance of motifs scanned. Sox2and Oct4 bind to the composite SoxOct motif besidestheir own, Stat3 binds the Stat1 motif, and cMyc binds theEbox motif. Both the Oct4 and cMyc groups' expectedmotifs are enriched. For example, the SoxOct motif hasover three fold enrichment in regions bound by TFs in theOct4 group. Interestingly, the Lrh1 motif is more enrichedthan the Nanog motif in sequences bound by the Oct4group, which contains Nanog binding by definition. Thisreinforces the hypothesis that Lrh1 co-binds regionsbound by TFs in the Oct4 group [8]. Furthermore, Lrh1sites are found in the promoter regions of Pou5f1 (Oct4),Klf4, Dppa5, and Suz12 with Pou5f1 having three sepa-rate sites. These motif sites and Lrh1's known importancein ES cells, suggest that it may be an upstream regulator ofthese pluripotency factors and as such is a candidate forexperimental validation [72]. The Elk1 motif is also signif-icantly enriched in sequences bound by the cMyc group,thus Ekl1 may co-regulate genes bound by TFs in thisgroup.
A Geometric Interpretation of Signed WGCNA Modules
To understand how signed WGCNA is better able to sepa-rate genes into functional modules in the Ivanova data set,we plotted genes in the signed black or turquoise modulerelative to the unsigned turquoise module eigengene(Additional File 10). Note that genes located in the blackand turquoise modules in the signed network are clearlyseparated into two clusters. Because a module eigengeneis defined as the first principle component of its module,
kMEblack kME
blue
kMEblue
kMEblack
kMEblack
kMEblack
kMEblack
Page 17 of 25(page number not for citation purposes)

BMC Genomics 2009, 10:327 http://www.biomedcentral.com/1471-2164/10/327
it describes the main direction in which the module's geneexpressions vary. Note that the signed module eigengenesare oriented in the direction of their clusters. The directionof the unsigned turquoise module eigengene is more dif-ficult to interpret. Because the turquoise module in theunsigned network contains two distinct signed modules(black and turquoise), its module eigengene describes thevariance between these two sub-modules and the variancewithin the larger sub-module, the signed turquoise. Assuch, the unsigned turquoise module eigengene fails toquantify the true importance of highly connected genes in
the signed black module. For example, Oct4's in
the unsigned turquoise module is -0.74 while it is 0.94 inthe signed black module. Thus, Oct4 is not identified as ahub gene in the unsigned network while it is clearly a hubgene in the signed network.
ConclusionWe show that a systems biology approach, which utilizesgene expression, transcription factor binding, genomic,
epigenetic and gene ontology data, can be improved byaccounting for the sign of co-expression relationships. Wealso show that signed WGCNA has advantages over stand-ard differential expression methods. Specifically, signedWGCNA has more consistent gene rankings between datasets (see Additional File 8), is better able to identify func-tionally enriched groups of genes (Figure 6), and its focuson module eigengenes circumvents the multiple testingproblems that plague standard gene-based expressionanalysis. Below, we highlight several novel stem cellrelated genes that would not have been found using astandard differential expression analysis.
Signed WGCNA provides novel insight into murine EScell biology, which unsigned WGCNA is unable to pro-vide. Applying these signed methods to previously pub-lished data, we identified pluripotency and differentiationgene modules not found in unsigned networks or differ-ential analysis. The results of signed WGCNA are robust asit identifies similar modules in independently publisheddata sets. We show that module eigengene based connec-tivity kME is valuable for annotating genes with regard to
kMEturquoise
Non-Transcriptional Regulators Related to Pluripotency and DifferentiationFigure 8Non-Transcriptional Regulators Related to Pluripotency and Differentiation. TFs and Suz12 binding of highly con-nected genes related to ES cell pluripotency and self-renewal lacking GO terms for transcriptional regulation or chromatin structure. Genes are tablulated in the same format as Figure 7.
Oc
t4
Na
no
g
So
x2
Sm
ad
1
Sta
t3
cM
yc
nM
yc
Klf
4
Esrr
b
Tc
fcp
2l1
Zfx
E2
f1
Su
z1
2
Oc
t4
Na
no
g
So
x2
Sm
ad
1
Sta
t3
cM
yc
nM
yc
Klf
4
Esrr
b
Tc
fcp
2l1
Zfx
E2
f1
Su
z1
2
k ME
k ME
Incr
ea
sin
g k
ME
De
cre
asi
ng
kM
E
� � � � � � � � � � � � � �� � � � � � � �� � � � � � �� � � � � � �� � � � � � � � �� � � � � � � � � � � � � �
� � � � � � � � � ! " # � � $ % & � � � $ � � $
' � � � � � � $ ( � ) * � � � � � $ $
+ , - . . + + / . 0 1 2 3 � � $ $4 � � � � � 5 � � $ 6
� � � � � � $ 67 � � � � � $ 6
( � � � � � � $ �8 � � � 9 � � � $ �: � � 9 � � � � $ �
; < < � = > ? � � � � @� � � � � A � � � $ �
4 � � � � � � $ 8 & � � � $ � & * � � � � $ BC ) � � � � � � $ B
D � � � � � $ B� & E � � � � $ BF � � � � � � � $ B
( � � � � � $ B� � � B � � $ B
G H I J K J L M N O P PQ R S J T U V L M N O P PW S X Y L M N O P PG S Z [ L M N O P YG \ ] ^ U L M N O P Y_ H S X ` L M N O P YQ [ Z a L M N O P Y
b Z S c L M N O P Yd \ ] e V L M N O P O
b [ [ ] c L M N O P Od f T X c e L M N O P Od X T g L M N O P Oh i \ [ L M N O P Oh g R \ V L M N O Yh S ` ] H L M N O Y cG f j U i \ V ^ L M N O Y c
b U I e L M N O Y cb I H \ V L M N O Y c
k X I V ] L M N O Y cd \ V e J L M N O Y cG U J S ] L M N O Y Vl Z m S L M N O Y Vd X T n L M N O Y Vo J I ^ c L c L M N O Y jG U ] T c L M N O Y e_ m J U j L M N O Y Kd X Z m L M N O Y Pp q ] S f L M N O Y OQ [ J T L M N O Y O
r r s t r r r r r r u r u u rr st r s t r r r r r r r r r r rr r u r r r u u u u r u rr r r r r r u u u r u u rr r s t r r r u u r r u u u r
r st r s t r r r u u r r u r u rr st r s t u r u r u u r u r u rr r r r u u u u r r r u rr r r r u u u r r r r u rr r r r r u u r u u u u rr st r r r r u u u r u u u rr st u r r r u u u r u u u rr r r r u r u r u r u u rr r r r r r r r r r r r rr st r u r r r u r u u r u ru r s t u u u u r r r r u u rr r s t u u u u u u u u u r rr r u u r u u r r r r u rr r r r r u u u u u u u rr r r r r r r r r r r r rr r r r r u u r r r u u r
r st r s t u r u r u r u u u u rr r r r r r r r u u u u rr st r s t u r r r u u u r r u rr st r r r u u u u r u u u rr r r r u u r u r u r r rr r s t r r r r r r r r r r rr st r u u r u u u u r u u rr r s t r r r r r r r r r u r
v v v v v v w w v v v v v xyv v v v v v v v v v w w vv v v v v v v v v v v v v xy
v x y v v v v v v v v v v v vv v v v v v v w v v v w vv v v v v v w v w v w v v
v x y v v v v w w w w v w w vv v v v v v v v v w v w wv v v v v v v w v v w v vvx y v v v v w w v v v w v vv v v v v v v v v w w v vv v v v v v v v w v w w vv v v v v v v v v v v v v xyv v v v v v v v v w w w vv vx y v v v v w v v v v v vv v v v v v v v v v v v vvx y w v v v w w w v w w v vvx y v v v v w w v v v w v vv v v v v v v v v v v w vv v w v v w w v v v v w v xyv v v v v v v v v v v v vv v xy v v v v w w w v w w vv v v v v w v v w v w w vv v v v v v v v w w v w vv v v v v w w w v v w w vv v w v v w w w w v v w vv v xy w v w v w v w w v w vvx y v xy v v v v w w w w w w vvx y v w w v w w w v w w v v xy
z { | } ~z { � } �z { � } �z { � } {z { � } {z { � } {z { � } ~z { � } �z { � } {z { � } {
z { �z { � } �z { � } �z { � } ~z { { } �z { { } �z { { } �z { { } �z { { } �z { { } �z { { } ~z { ~ } �z { ~ } �z { ~ } �z { ~ } �z { ~ } �z { ~ } �z { ~ } �z { ~ } �
� � �� � �
� � � � �� � � � �� � � � �� � � � �� � � � �� � � � �� � � � �� � � � �� � � � �� � � � �� � � � �
� � �� � � � �� � � � �� � � � �� � � � �� � � � �� � � � �� � � � �� � � � �� � � � �� � � � �� � � � �� � � � �� � � � �
� � �� � � � �
Sig
nifi
can
ce
Sig
nifi
can
ce
� � � �� � � �
� � �� � � �
� � �� � � �� � � �
� � �� � � �� � � �
� � �� � � �� � � �� � � �� � � �� � � �
� � � �� � � �� � � �� � � �� � � �� � � �� � � �� � � �� � � �
� � � �� � � �� � � �� � � �
� � � � �� � � ¡� � � ¡ ¢� � � � £� � � ¤ �� � � � ¡� ¥ � � ¢� � � ¦ �� ¥ � � �� � � � ¤� � � �� � � £ ¢� � � ¤ ¤� ¤ � � ¢� ¡ � ¡ £� ¤ � ¥ ¦� ¡ � � ¢� � � � �� ¡ � ¥ ¡� ¤ � � ¦� ¤ � ¤ �� � � � �� � � ¦ ¦
� ¤ � ¦� � � ¡ �� � � � £
� ¤ � ¦� ¥ � �
� � � ¢lo
g2(F
C)
log
2(F
C)
Page 18 of 25(page number not for citation purposes)
BMC Genomics 2009, 10:327 http://www.biomedcentral.com/1471-2164/10/327
module membership and for identifying genes related topluripotency and differentiation. As a resource, we pro-vide a module membership annotation for each gene withregard to the signed modules (Additional Files 11 and12).
Many current studies focus on the role transcriptional reg-ulators play in ES cell maintenance. As expected, thepluripotency module is enriched with genes active in tran-scriptional regulation, e.g. Oct4, Sox2, Klf2, Nanog,Jarid1b, Jarid2, Nodal, Tgif1, and Esrrb, and containsother genes expected to play a role in ES cell function,such as Dppa4 and Dppa5. The module also containsgenes that have recently been shown to be necessary for
maintaining the pluripotent state, Nup133 and Utf1[45,62].
Interestingly, the pluripotency module contains geneswith roles in two other pathways, DNA repair and mito-chondrial function, which are not found by standard dif-ferential analysis. The enrichment for genes that respondto DNA damage is not surprising given that ES cells spenda larger portion of their cell cycle in S phase and have ashorter G1 phase than differentiated cells [73]. An empha-sis on accurate DNA replication is expected since it helpsES cells maintain a stable genome and prevents errorsfrom being inherited by differentiated cells. Mitochondriain ES cells may assist in the prevention of DNA damage[71]. During aerobic production of adenosine triphos-phate (ATP), mitochondria leak superoxides leading tothe creation of reactive oxygen species (ROS), which dam-age DNA. ES cells, however, produce ATP anaerobicallyand thus minimize the amount of DNA damaging ROS[69,71]. ES cells also have fewer mitochondria than differ-entiated cells and their mitochondria are smaller, havefewer cristae, lack dense matrices, and are perinuclearlylocated [69-71]. Our use of signed WGCNA reveals that inaddition to genes involved in transcriptional regulation,genes that prevent or repair DNA damage are key to main-taining pluriotency and self-renewal.
Figure 3 reports significant relationships between modulemembership, chromatin structure and epigenetic modifi-cations (histone modifications and DNA methylation),which are known to play a role in controlling gene expres-sion during ES cell self-renewal and differentiation. Whilethe relationships are highly significant, we find that epige-netic variables and binding data explain only 8.3% of the
variation in module membership and 4.3% of the
variation of (Table 2). In Additional File 5, we pro-
vide gene annotations with regard to module member-ship, transcription factor bindings, histone trimethylationstatus, CpG DNA methylation etc.
Using module eigengene based connectivity we find
that many known differentiation related genes are highlyconnected in the differentiation (blue) module, Cited2,Gata4, and Gata6, along with Ctsl, which has recentlybeen shown to be active in differentiation [65]. We alsofind that Uqcrh, a gene involved in the electron transportchain, is highly connected in this module, lending sup-port to the argument that ES cell mitochondria differ fromthose in differentiated cells. Module eigengene based con-nectivity enabled us to identify novel candidate genes inthe differentiation module, like Uqcrh, that warrant
kMEblack
kMEblue
kMEblue
Pluripotency Transcriptional Regulators that are not Bound by the Core TF Machinery in ES CellsFigure 9Pluripotency Transcriptional Regulators that are not Bound by the Core TF Machinery in ES Cells. Genes related to ES cell pluripotency and self-renewal with GO terms of transcriptional regulation or chromatin structure and little pluripotency TF binding. Genes are listed by black kME along with their corresponding significance level (log10 of the Bonferroni corrected p-value generated by a correlation test). Binding data from Chen et al, Boyer et al and Loh et al, are marked in blue (bound) and beige (unbound). For Suz12, light blue indicates that a genes is called bound in Chen et al or Boyer et al but not in both.
Na
no
g
Oc
t4
So
x2
Sm
ad
1
Sta
t3
cM
yc
nM
yc
Klf
4
Esrr
b
Tc
fcp
2l1
Zfx
E2
f1
Su
z1
2
k ME
(Bla
ck)
Incr
ea
sin
g k
ME
� � � � � � � � � � � � � � � � �� � � � � � � � � �� � � � � � � �
� � � � � � � � � �� � � � � � � � �� � � � � � � � � �� � � � � � � � �
� � � � � � � � �� � ! � � � � �� � � � � � � � �� " # $ � � � � � � � % � � � � � �� � � � � � � � � $
� � � � � � & � � ' � � � � � �
� � � � � � � � � �� � � � � � � �
( ) * + , - . / 0 1 2 � � � � �� " # � � � � � � �3 � 4 � � � � �5 % � � � � � � �6 " � � � � � � � �
7 , 8 , 1 2 , 9 , : ; < = � � � � �� " � � � � � � � � > " ! � � � � �6 � � � � � � � $ �
� � � � � � $ �� � � � � � � � � �5 � � � � � � � �� # � � � � � � �
? ? ? ? ? ? ? ? ? @ ? @ ?? ? ? ? ? ? ? ? ? ? @ ? ? AB? ? ? ? ? ? ? ? ? ? ? ? ?? ? ? ? ? ? ? ? ? ? ? ? ?? ? ? ? ? @ ? ? @ ? ? ? ?? ? ? ? ? @ @ ? ? ? ? ? ?? ? ? ? ? ? ? ? ? ? ? ? ?? ? ? ? ? ? ? ? ? ? ? ? ?? ? ? ? ? ? ? ? ? ? ? ? ?? ? ? ? ? ? ? ? ? ? ? ? ?? ? ? ? ? ? ? ? ? ? ? ? ?? ? ? ? ? ? ? ? ? ? ? ? ?? ? ? ? ? ? ? ? ? ? ? ? ?? ? ? ? @ ? ? ? ? ? ? @ ?? ? ? ? @ ? ? ? ? ? ? ? ?? ? ? ? ? ? ? ? ? @ ? @ ?? ? ? ? ? ? ? ? ? ? ? @ ?? ? ? ? ? @ ? ? ? ? @ ? ?? ? ? ? ? ? ? ? ? ? ? ? ?? ? ? ? ? ? ? ? ? @ ? @ ? AB? ? ? ? @ ? ? ? ? ? ? ? ?? ? ? ? ? ? ? ? ? ? ? ? ?? ? ? ? ? ? ? ? ? ? ? ? ?? ? ? ? ? ? ? ? ? ? @ @ ?? ? ? ? ? ? ? ? ? ? @ @ ?? ? ? ? ? ? ? ? ? ? ? ? ?? ? ? @ @ ? ? ? ? ? ? ? ?? ? ? ? ? ? ? ? ? ? ? ? ?? ? ? ? ? ? ? ? ? ? ? ? ?? ? ? ? @ @ ? ? ? ? ? ? ?? ? ? ? ? ? ? ? ? ? ? ? ?
C D E F GC D E F HC I J F KC I J F IC I L F IC I D F GC I I F MC I I F MC I I F MC I I F LC I I F DC I E F NC I E F MC G F L DC K F G MC K F G JC K F J JC K F D NC K F E MC N F K JC N F H KC N F L NC N F D GC N F D KC N F I NC N F I J
C N F IC M F G NC M F H MC M F H JC M F L N
Sig
nifi
can
ce � � �� � � $ � � � � � � � $ � � $ � � �� � $ � � �� � � � � $� � $ � � � �
� � �
� � � �� � � �
� � $� � � �� � � �� � � �� � � �� � $ � � $ $� � � � � � �� � � � � � � � � �� � � �� � � �
log
2(F
C)
Page 19 of 25(page number not for citation purposes)

BMC Genomics 2009, 10:327 http://www.biomedcentral.com/1471-2164/10/327
experimental validation (Figure 8). For the pluripotencymodule interesting candidate genes are Msh6, Ppif,Sh3gl2, Rbpj, Elk1, Nrf1, Nup133, Mrpl15, and Zfp39(Figures 7 and 8). These genes lack significant fold changebut are highly connected and thus would not be foundusing standard differential analysis. Using sequence datawith motif analysis we confirm the importance of twogenes, Nr5a2 and Elk1, computationally.
We use gene ontology information and literature resultsto provide strong statistical evidence that these candidategenes are very promising and justify further biologicalstudy. Our article provides a resource in form of modulebased gene annotation tables that could form the startingpoint of future biological validation studies. Dependingon their function, these candidate genes can be tested byRNAi knock down, viral infection in order to increase theefficiency of reprogramming, or, if they bind DNA, ana-lyzing their binding sites. Our article demonstrates thatsigned WGCNA not only identifies many well known EScell regulators; it also yields novel insights regarding EScell function.
MethodsOur statistical methods are implemented in the WGCNAR software package [34]. For example, a signed networkusing the power β = 12 is constructed with the R com-mand ADJ = adjacency (datExpr, power = 12, type ="signed").
The Topological Overlap MatrixThe topological overlap, reflects the relative interconnect-edness between genes i and j. It takes into account the rela-tionship between the two genes and their sharedconnection pattern to other genes [19,35-37]. The topo-logical overlap between two genes is defined as follows:
where aij is the above defined adjacency, lij = ∑u≠i,j aiuauj,and ki = ∑u≠i aiu.
The Effect of the Co-expression Similarity Measure on the Topological Overlap Measure
The choice of co-expression similarity measure (i.e.
versus ) has
strong implications for the resulting topological overlap
measure. Note that cor(x1, xu) = -1 implies and
. In case of a soft threshold β = 1, we find the
following corresponding weighted adjacency measures:
and . In the following, consider the
simple network in Additional File 1 (part a) where adja-cencies a1u = a and au2 = a for u = 3, ..., n. Using equation
(6), t12 simplifies as follows:
where the latter approximation assumes that the number
of genes n is large. For the above situation (with β = 1) this
implies ≈ aunsigned = 1 and ≈ asigned = 0. Thus,
the two genes have high interconnectedness in anunsigned network but zero interconnectedness in a signednetwork. Additional File 1 (part b) shows a simple net-work where genes 1 and 2 are oppositely correlated withtheir neighbors. Here the choice of gene co-expression
tlij aijki k j aij
ij =+
+ −min{ , } 1(6)
s cor x xijunsigned
i j=| ( , ) | sijsigned cor xi x j=
+( , ) 1
2
s uunsigned1 1=
s usigned1 0, =
a uunsigned1 1= a u
signed1 0, =
ta uauu a
k k an an a
a1 21 21 2 12
1 2 1 12
2 2
2 1,,
min{ , }( )( )
,= ≠∑ ++ −
= −− +
≈
t unsigned1 2, t signed
1 2,
Table 5: Motif Enrichment in Genes bound by Oct4 or cMyc TF Groups
Oct4 Group cMyc GroupMotif Binding TF No. of genes ratio p-value No. of genes ratio p-value
SoxOct (Oct4, Sox2) 66 3.41 2.0E-21 103 0.45 6.4E-24Oct4 (Oct4) 37 2.33 9.9E-08 151 0.81 2.5E-03Sox2 (Sox2) 51 3.06 3.8E-15 178 0.86 1.4E-02Nanog (Nanog) 18 2.20 5.0E-04 122 1.35 3.9E-04Stat1 (Stat3) 34 2.83 7.3E-09 145 1.32 1.0E-04Ebox (cMyc) 6 0.59 9.5E-01 373 4.02 2.6E-207E2f1 (E2f1) 1 1.44 9.4E-02 284 2.25 1.2E-40Klf4 (Klf4) 38 1.02 4.0E-01 235 0.61 1.4E-19Lrh1 (Lrh1) 28 2.22 1.4E-05 158 1.12 6.9E-02Elk1 (Elk1) 10 0.19 3.1E-02 170 1.64 8.6E-11
Sequences co-bound by all TFs of the Oct4 group (Oct4, Sox2, Nanog, Smad1, and Stat3) or all TFs of the cMyc group (cMyc, nMyc, E2f1, and Zfx) in the Chen et al data set were scanned for relevant motifs, plus the Lrh1 (Nr5a2) and Elk1 motifs. There were 122 genes bound by all TFs in the Oct4 group and 1173 genes bound by all TFs in the cMyc group. Enrichments, computed by comparing against motif scans in control sequences, and p-values are shown below.
Page 20 of 25(page number not for citation purposes)

BMC Genomics 2009, 10:327 http://www.biomedcentral.com/1471-2164/10/327
measure results in a very different topological overlapmeasures, which in turn, leads to different modules.
The Module Eigengene and Module MembershipFor the q-th module, we summarize its expression data, bya module eigengene, E(q), found by singular value decom-position of the expression data [39]:
where X(q) is the n(q) × m matrix of standardized expressionprofiles of the n(q) genes in the module across m samples,U(q) is an n(q) × m matrix with orthogonal columns, D(q) isan m × m diagonal matrix of singular values, and V(q) is anm × m orthogonal matrix of singular vectors. Then E(q) isdefined by:
where is the singular vector in V (q) corresponding to
, the largest absolute singular value in D(q). The
module eigengene, E(q), can be used to define the moduleeigengene based connectivity, kME, or fuzzy module mem-
bership [25,27,33,39] via
The Relationship between ki and kME, i, when β = 1
To study the relationship between module eigengenebased connectivity, kME, i, and intramodular connectivity,
ki, we consider a special case of a signed weighted network
with β = 1 (i.e. ). Then the intramodular
connectivity is given by
where n(q) is the number of genes in the qthmodule. It hasbeen shown that network modules are approximately fac-torizable (i.e. cor(xi,xj) ≈ cor(xi,E(q)) × cor (xj,E(q))) [33,39]).This approximation implies
where E(q) is the module eigengene of module q, ,
and . Equation (11) implies an
approximate linear relationship between and if
β = 1. Using real data, we illustrate this relationship inAdditional File 2.
Motif EnrichmentMethods developed in Zhou et al [8] were used to scansequences for motifs with pre-defined position specificweight matrices. Sequences were determined by extendingbound ChIP-seq sites 150 bp up and downstream result-ing in regions approximately 330 bp long. Any overlap-ping regions were then joined into larger meta-regions. Aset of control sequences was scanned to determine a motifenrichment ratio. The control group was created by ran-domly sampling 5,000 probes from the Agilent MousePromoter Whole Genome ChIP-on-chip Microarray Set.These probes are distributed -5.5 kb upstream to +2.5downstream of approximately 17,000 known gene tran-scription start sites from UCSC's version mm8 genome.
Overlapping control probes were merged into meta-regions as described above. Enrichment of a motif is
defined as where MT is the number of observed sites
and λ is the number of expected sites, , where
MC is the number of sites in the control, NC the length ofall control sequences, and NT the length of all boundsequences. Statistical significance is determined by thePoisson distribution with λ as the mean.
Authors' contributionsMJM carried out the study, analyzed the data, and draftedthe article. KP and GF provided embryonic stem cellexpertise in interpreting data. QZ provided guidance instatistical analysis. SH conceived of the study and assistedin its design and data analysis. All authors helped writethe article.
Additional material
X U D Vq q q q T( ) ( ) ( ) ( )( ) ,= (7)
E vq q( ) ( ),= 1(8)
v q1( )
| |( )d q1
k cor x EME iq
iq
,( ) ( )( , ).= (9)
aijcor xi x j=
+1
2
( , )
k acor xi x j n q cor xi x j
iq
ij
j i j i j i
( ) ( , ) ( ) ( , ),= =
+= − +
≠ ≠ ≠∑ ∑ ∑1
21
2 2
kn q
cor x Ecor x j E q
a b kiq
iq
j i
KEq( ) ( ) ( )
( )( , )
( , ( ))≈ − + ≈ +
≠∑1
2 2
(10)
a n q=
( )
2
b cor x Ejq
j= ∑1
2 ( , )( )
Additional file 1A Simple Illustration of How the Choice of a Similarity Measure Affects TOM. The TOM measure of interconnectedness is often used to define clusters of highly interconnected genes. Here we use very simple networks to highlight properties of the TOM measure. (a) Computing the topological overlap between genes 1 and 2 when all connection strengths between intermediate genes equal the constant a. (b) The numbers on the edges of the left network are correlations while the numbers on the edges of the networks on the right hand side equal corresponding unsigned adja-cencies (upper network) and signed adjacencies (lower network). In a signed network, the topological overlap between genes 1 and 2 is very low because intermediate genes 3 and 4 have negative correlations with gene 1. In contrast, the topological overlap between genes 1 and 2 is high in an unsigned network.Click here for file[http://www.biomedcentral.com/content/supplementary/1471-2164-10-327-S1.pdf]
kiq( ) kME i
q,
( )
MTl
l =MCNT
NC
Page 21 of 25(page number not for citation purposes)

BMC Genomics 2009, 10:327 http://www.biomedcentral.com/1471-2164/10/327
Additional file 2Intramodular Connectivity is Highly Correlated with Module Eigen-gene Based Connectivity kME. For each module from the Zhou et al data, we plot intramodular connectivity (defined using a weighted network with power β = 1) versus module eigengene based connectivity kME. We find that the two connectivity measures are highly correlated. A theoretical der-ivation between network concepts and eigengene based analogs is pre-sented in [32].Click here for file[http://www.biomedcentral.com/content/supplementary/1471-2164-10-327-S2.pdf]
Additional file 3Binding Enrichments for Unsigned and Signed Ivanova et al (2006) Networks. This file contains enrichments and corresponding p-vaules for binding from Loh et al (2006), Boyer et al (2007), and Chen et al (2008).Click here for file[http://www.biomedcentral.com/content/supplementary/1471-2164-10-327-S3.xls]
Additional file 4Comparing Gene Rankings to Regulators of Gene Expression. Here we relate different gene rankings to enrichment significance with regard to the following variables (a) histone H3K4 alone versus all others, (b) biva-lent H3K4&H3K27 versus all others [49], (c) high CPG class versus all others (i.e. HCG versus ICG and LCG), (d) promoter CPG methylation status [50], (e) Oct 4 complex binding status, (f) cMyc complex binding status. We report results for 3 different gene rankings using the Ivanova data: the black and blue curve represent gene rankings according to
and , respectively. The grey curve represents ranking
according to a Student T-test of differential expression. Additional File 4 shows that black and blue module genes can have very different enrich-ment results that tend to be quite different from those of a standard anal-ysis.Click here for file[http://www.biomedcentral.com/content/supplementary/1471-2164-10-327-S4.pdf]
Additional file 5Data for Cross-Referencing Module Membership to Epigenetic Regu-lators. In this Additional File, we merged Additional File 11 (Module Membership kME etc in the Ivanova data) with a Table (S4) from [50] that contained promoter CPG methylation and lysine trimethylation data from [49]. This Additional file reports module membership values, his-tone modifications, promoter CpG Status, and polycomb, Oct4 complex, cMyc complex binding etc. The table reports data regarding genes whose promoters have H3K4me3, H3K27me3, both, or neither histone mark. Further, column Class reports CPG promoter classifications (high HCP, intermediate ICP, or low LCP). The column Methylated reports which genes are known to be methylated (value 1) or unmethylated (0) [50]. For completeness, it also includes information regarding genes bound by Nanog or Oct4 in the proximal promoter (within 10 kb) or bound by Nanog and Oct4 long range (within 500 kb), or bound by Polycomb [5,6].Click here for file[http://www.biomedcentral.com/content/supplementary/1471-2164-10-327-S5.csv]
kMEblack kME
blue
Additional file 6Binding Enrichments for Unsigned and Signed Zhou et al (2007) Net-works. This file contains enrichments and corresponding p-values for binding from Loh et al (2006), Boyer et al (2007), and Chen et al (2008).Click here for file[http://www.biomedcentral.com/content/supplementary/1471-2164-10-327-S6.xls]
Additional file 7Ingenuity Pathway Analysis of the Pluripotency and Differentiation Modules from Zhou et al (2007).Click here for file[http://www.biomedcentral.com/content/supplementary/1471-2164-10-327-S7.pdf]
Additional file 8Comparison of Overlap in Ivanova et al and Zhou et al (2007) when Ranking by t-statistic and Connectivity.Click here for file[http://www.biomedcentral.com/content/supplementary/1471-2164-10-327-S8.pdf]
Additional file 9Ingenuity Pathway Analysis of Genes Ranked by Connectivity and Differential Expression in Zhou et al (2007).Click here for file[http://www.biomedcentral.com/content/supplementary/1471-2164-10-327-S9.pdf]
Additional file 10Understanding Signed Module Membership. Here we visualize the rel-ative position of unsigned and signed similarity modules. We used module eigengene based connectivity, kME = cor(xi, E), to visualize a gene's mod-ule membership, focusing on genes located in the signed turquoise or black modules. For any vectors a and b with angle θ between them, their correlation can be interpreted as cor(a, b) = cos(θ). Using this relation-ship we plotted genes in polar coordinates (radially) relative to the unsigned turquoise module. The figure shows the angle, θ, between the gene's expression profile and the turquoise module eigengene from the unsigned network, indicated by the solid turquoise line. Each gene's radius is defined as the absolute value of its log2 expression fold change (FC). FC is the ratio between the average expression in the control RNAi samples and the average expression in the Oct4 RNAi knock down sam-ples. For reference the signed turquoise and black module eigengenes are indicated by dashed turquoise and black lines, respectively, and genes are colored by signed module membership. Known ES cell regulators and dif-ferentiation markers are labeled. Note that the signed module eigengenes (dashed lines) reflect the relationship within their corresponding modules while the unsigned module eigengene (solid line) reflects the relationship between the two signed modules.Click here for file[http://www.biomedcentral.com/content/supplementary/1471-2164-10-327-S10.pdf]
Page 22 of 25(page number not for citation purposes)

BMC Genomics 2009, 10:327 http://www.biomedcentral.com/1471-2164/10/327
AcknowledgementsSH is supported 1U19AI063603-01, 5P30CA016042-28, P50CA092131, and DK072206. KP is supported by DP2 OD001686-01, RN1-00564-1, RL1-00681-1, and P01 GM081621-01A1. QZ is supported by NSF DMS-0805491. We thank Mark Chin, Noah Dowell, Tom Drake, Tova Fuller, Dan Geschwind, Peter Langfelder, Jake Lusis, Paul Mischel, Mike Oldham, Bernadett Papp, Rupa Sridharan, and Jason Tchieu for useful discussions.
References1. Chien K: Regenerative medicine and human models of human
disease. Nature 2008, 453:302-305.2. Passier R, van Laake L, Mummery C: Stem-cell-based therapy and
lessons from the heart. Nature 2008, 453:322-329.3. Takahashi K, Yamanaka S: Induction of Pluripotent Stem Cells
from Mouse Embryonic and Adult Fibroblast Cultures byDefined Factors. Cell 2006, 1264:663-676.
4. Ivanova N, Dobrin R, Lu R, Kotenko L, Levorse J, DeCoste C, SchaferX, Lun Y, Lemischka I: Discecting self-renewal in stem cells withRNA interference. Nature 2006, 442:533-538.
5. Loh Y, Wu Q, Chew J, Vega V, Zhang W, Chen X, Bourque G,George J, Leong B, Liu J: The Oct4 and Nanog transcription net-work regulates pluripotency in mouse embryonic stem cells.Nature Genetics 2006, 38:431-440.
6. Boyer L, Plath K, Zeitlinger J, Brambrink T, Medeiros L, Lee T, LevineS, Wernig M, Tajonar A, Ray M, Bell G, Otte A, Vidal M, Gifford D,Young R, Jaenisch R: Polycomb complexes repress develop-mental regulators in murine embryonic stem cells. Nature2006, 441:349-353.
7. Maherali N, Sridharan R, Xie W, Utikal J, Eminli S, Arnold K, StadtfeldM, Yachechko R, Tchieu J, Jaenisch R, Plath K, Hochedlinger K:Directly Reprogrammed Fibroblasts Show Global Epige-netic Remodeling and Widespread Tissue Contribution. CellStem Cell 2007, 1:55-70.
8. Zhou Q, Chipperfield H, Melton DA, Wong WH: A gene regula-trory network in mouse embryonic stem cells. Proc Natl AcadSci 2007, 104(42):16438-16443.
9. Takahashi K, Tanabe K, Ohnuki M, Narita M, Ichisaka T, Tomoda K,Yamanaka S: Induction of pluripotent stem cells from adulthuman fibroblasts by defined factors. Cell 2007,131(5):861-872.
10. Yu J, Vodyanik M, Smuga-Otto K, Antosiewicz-Bourget J, Frane J, TianS, Nie J, Jonsdottir G, Ruotti V, Stewart R, Slukvin I, Thomson J:Induced pluripotent stem cell lines derived from humansomatic cells. Science 2007, 318(5858):1917-1920.
11. Nakagawa M, Koyanagi M, Tanabe K, Takahashi K, Ichisaka T, Aoi T,Okita K, Mochiduki Y, Takizawa N, Yamanaka S: Generation ofinduced pluripotent stem cells without Myc from mouse andhuman fibroblasts. Nature Biotechnology 2008, 26:101-106.
12. Viswanathan S, Daley G, Gregory R: Selective blockade of micro-RNA processing by Lin28. Science 2008, 320(5872):58-59.
13. Kim J, Chu J, Shen X, Wang J, Orkin S: An extended transcrip-tional network for pluripotency of embryonic stem cells. Cell2008, 132(6):1049-1061.
14. Park I, Zhao R, West J, Yabuuchi A, Huo H, Ince T, Lerou P, LenschM, Daley G: Reprogramming of human somatic cells topluripotency with defined factors. Nature 2008,451(7175):141-146.
15. Lowry W, Richter L, Yachechko R, Pyle A, Tchieu J, Sridharan R,Clark A, Plath K: Generation of human induced pluripotentstem cells from dermal fibroblasts. Proc Natl Acad Sci USA 2008,105(8):2883-2888.
16. Chen X, Xu H, Yuan P, Fang F, Huss M, Vega V, Wong E, Orlov Y,Zhang W, Jiang J, Loh Y, Yeo H, Yeo Z, Narang V, Govindarajan K,Leong B, Shahab A, Ruan Y, Bourque G, Sung W, Clarke N, Wei C,Ng H: Integration of External Signaling Pathways with theCore Transcriptional Network in Embryonic Stem Cells. Cell2008, 133:1106-1117.
17. Mitsui K, Tokuzawa Y, Itoh H, Segawa K, Murakami M, Takahashi K,Maruyama M, Maeda M, Yamanaka S: The homeoprotein Nanogis required for maintenance of pluripotency in mouse epi-blast and ES cells. Cell 2003, 113(5):631-42.
18. Stuart JM, Segal E, Koller D, Kim SK: A gene-coexpression net-work for global discovery of conserved genetic modules. Sci-ence 2003, 302(5643):249-255.
19. Zhang B, Horvath S: A General Framework for Weighted GeneCo-Expression Network Analysis. Stat Appl Genet Mol Biol 2005,4:Article17.
20. Walker E, Ohishi M, Davey R, Zhang W, Cassar P, Tanaka T, Der S,Morris Q, Hughes T, Zandstra P, Stanford W: Prediction and Test-ing of Novel Transcriptional Networks Regulating Embry-onic Stem Cell Self-Renewal and Commitment. Cell Stem Cell2007, 1:71-86.
21. Huang Y, Li H, Hu H, Yan X, Waterman M, Huang H, Zhou X: Sys-tematic discovery of functional modules and context-specificfunctional annotation of human genome. Bioinformatics 2007,23(13):222-229.
22. Chen C, Weirauch M, Powell C, Zambon A, Stuart J: A searchengine to identify pathway genes from expression data onmultiple organisms. BMC Systems Biology 2007, 1:20.
23. Horvath S, Zhang B, Carlson M, Lu K, Zhu S, Felciano R, Laurance M,Zhao W, Shu Q, Lee Y, Scheck A, Liau L, Wu H, Geschwind D, FebboP, Kornblum H, TF C, Nelson S, Mischel P: Analysis of OncogenicSignaling Networks in Glioblastoma Identifies ASPM as aNovel Molecular Target. PNAS 2006, 103(46):17402-17407.
24. Wei H, Persson S, Mehta T, Srinivasasainagendra V, Chen L, Page G,Somerville C, Loraine A: Transcriptional Coordination of theMetabolic Network in Arabidopsis. Plant Physiol 2006,142(2):762-774.
25. Ghazalpour A, Doss S, Zhang B, Plaisier C, Wang S, Schadt E, ThomasA, Drake T, Lusis A, Horvath S: Integrating Genetics and Net-work Analysis to Characterize Genes Related to MouseWeight. PLoS Genet 2006, 2(8):e130.
26. Carlson M, Zhang B, Fang Z, Mischel P, Horvath S, Nelson SF: GeneConnectivity, Function, and Sequence Conservation: Predic-tions from Modular Yeast Co-expression Networks. BMCGenomics 2006, 7(40):.
27. Oldham M, Horvath S, Geschwind D: Conservation and evolutionof gene co-expression networks in human and chimpanzeebrain. Proc Natl Acad Sci U S A 2006, 103(4717973-17978 [http://www.pnas.org/content/103/47/17973.full].
28. Keller MP, Choi Y, Wang P, Belt Davis D, Rabaglia ME, Oler AT, Sta-pleton DS, Argmann C, Schueler KL, Edwards S, Steinberg HA, Chai-bub Neto E, Kleinhanz R, Turner S, Hellerstein MK, Schadt EE,Yandell BS, Kendziorski C, Attie AD: A gene expression networkmodel of type 2 diabetes links cell cycle regulation in isletswith diabetes susceptibility. Genome Res 2008, 18(5):706-716.
29. Weston D, Gunter L, Rogers A, Wullschleger S: Connecting genes,coexpression modules, and molecular signatures to environ-mental stress phenotypes in plants. BMC Systems Biology 2008,2:16 [http://www.biomedcentral.com/1752-0509/2/16].
30. Oldham MC, Konopka G, Iwamoto K, Langfelder P, Kato T, HorvathS, Geschwind DH: Functional organization of the transcrip-tome in human brain. Nature Neuroscience 2008,11(11):1271-1282.
Additional file 11Module Membership and Binding Information in the Signed Ivanova et al (2006) Network. This file contains module membership, kME, and binding data from Loh et al (2006), Boyer et al (2007), and Chen et al (2008) for each gene on the microarray.Click here for file[http://www.biomedcentral.com/content/supplementary/1471-2164-10-327-S11.xls]
Additional file 12Module Membership and Binding Information in the Signed Zhou et al (2007) Network. This file contains module membership, kME, and binding data from Loh et al (2006), Boyer et al (2007), and Chen et al (2008) for each gene on the microarray.Click here for file[http://www.biomedcentral.com/content/supplementary/1471-2164-10-327-S12.xls]
Page 23 of 25(page number not for citation purposes)

BMC Genomics 2009, 10:327 http://www.biomedcentral.com/1471-2164/10/327
31. Shieh G, Chen CM, Yu CY, Huang J, Wang WF, Lo YC: Inferringtranscriptional compensation interactions in yeast via step-wise structure equation modeling. BMC Bioinformatics 2008,9:134 [http://www.biomedcentral.com/1471-2105/9/134].
32. Presson A, Sobel E, Papp J, Suarez C, Whistler T, Rajeevan M, VernonS, Horvath S: Integrated weighted gene co-expression net-work analysis with an application to chronic fatigue syn-drome. BMC Systems Biology 2008, 2(95):.
33. Horvath S, Dong J: Geometric Interpretation of Gene Coex-pression Network Analysis. PLoS Computational Biology 2008,4(8):.
34. Langfelder P, Horvath S: WGCNA: an R package for weightedcorrelation network analysis. BMC Bioinformatics 2008, 9:559.
35. Ravasz E, Somera AL, Mongru DA, Oltvai ZN, Barabasi AL: Hierar-chical organization of modularity in metabolic networks. Sci-ence 2002, 297:1551-1555.
36. Li A, Horvath S: Network Neighborhood Analysis with themulti-node topological overlap measure. Bioinformatics 2006,23(2):222-231.
37. Yip A, Horvath S: Gene network interconnectedness and thegeneralized topological overlap measure. BMC Bioinformatics2007, 8(22):.
38. Langfelder P, Zhang B, Horvath S: Defining clusters from a hier-archical cluster tree: the Dynamic Tree Cut library for R.BMC Syst Biol 2007:1-24 [http://bioinformatics.oxfordjournals.org/cgi/reprint/btm563v1].
39. Dong J, Horvath S: Understanding network concepts in mod-ules. BMC Systems Biology 2007, 1:24.
40. Fuller T, Ghazalpour A, Aten J, Drake T, Lusis A, Horvath S:Weighted gene coexpression network analysis applied tomouse weight. Mammalian Genome 2007, 18(6):463-472.
41. Langfelder P, Horvath S: Eigengene networks for studying therelationships between co-expression modules. BMC SystemsBiology 2007, 1:54.
42. Velkey J, O'Shea K: Oct4 RNA interference induces trophecto-derm differentiation in mouse embryonic stem cells. Genesis2003, 37(1):18-24.
43. Nishimoto M, Miyagi S, Yamagishi T, Sakaguchi T, Niwa H, MuramatsuM, Okuda A: Oct-3/4 maintains the proliferative embryonicstem cell state via specific binding to a variant octamersequence in the regulatory region of the UTF1 locus. Molec-ular Cell Biology 2005, 25(12):5084-5094.
44. Boom V van den, Kooistra SM, Boesjes M, Geverts B, Houtsmuller A,Monzen K, Komuro I, Essers J, Drenth-Diephuis L, Eggen BJ: UTF1 isa chromatin-associated protein involved in ES cell differenti-ation. Journal of Cell Biology 2007, 10(178):913-924.
45. Zhao Y, Yin X, Qin H, Zhu F, Liu H, Yang W, Zhang Q, Xiang C, HouP, Song Z, Liu Y, Yong J, Zhang P, Cai J, Liu M, Li H, Li Y, Qu X, CuiK, Zhang W, Xiang T, Wu Y, Zhao Y, Liu C, Yu C, Yuan K, Lou J, DingM, Deng H: Two Supporting Factors Greatly Improve the Effi-ciency of Human iPSC Generation. Cell Stem Cell 2008,35:475-479.
46. Keller G: Embryonic stem cell differentiation: emergence of anew era in biology and medicine. Genes Development 2005,19(10):1129-1155.
47. Bernstein B, Mikkelsen T, Xie X, Kamal M, Huebert D, Cuff J, Fry B,Meissner A, Wernig M, Plath K, Jaenisch R, Wagschal A, Feil R, Sch-reiber S, Lander E: A Bivalent Chromatin Structure Marks KeyDevelopmental Genes in Embryonic Stem Cells. Cell 2006,125(2):315-326.
48. Bernstein B, Meissner A, Lander E: The Mammalian Epigenome.Cell 2007, 128(4):669-681.
49. Guenther MG, Levine SS, Boyer LA, Jaenisch R, Young RA: A chro-matin landmark and transcription initiation at most promot-ers in human cells. Cell 2007, 130:77-88.
50. Mikkelsen T, Ku M, Jaffe D, Issac B, Lieberman E, Giannoukos G, Alva-rez P, Brockman W, Kim T, Koche R, Lee W, Mendenhall E, O'Dono-van A, Presser A, Russ C, Xie X, Meissner A, Wernig M, Jaenisch R,Nusbaum C, Lander E, Bernstein B: Genome-wide maps of chro-matin state in pluripotent and lineage-committed cells.Nature 2007, 448(7153):553-60.
51. Fouse S, Shen Y, Pellegrini M, Cole S, Meissner A, VanNeste L, Jae-nisch R, Fan G: Promoter CpG Methylation Contributes to ESCell Gene Regulation in Parallel with Oct4/Nanog, PcGComplex, and Histone H3 K4/K27 Trimethylation. Cell StemCell 2008, 2(2):160-169.
52. Lee T, Jenner R, Boyer L, Guenther M, Levine S, Kumar R, ChevalierB, Johnstone S, Cole M, Isono K, Koseki H, Fuchikami T, Abe K, Mur-ray H, Zucker J, Yuan B, Bell G, Herbolsheimer E, Hannett N, Sun K,Odom D, Otte A, Volkert T, Bartel D, Melton D, Gifford D, JaenischR, Young R: Control of developmental regulators by Poly-comb in human embryonic stem cells. Cell 2006,125(2):301-13.
53. Dennis G, Sherman BT, Hosack DA, Yang J, Gao W, Lane HC, Lem-picki RA: DAVID: Database for Annotation, Visualization, andIntegrated Discovery. Genome Biol 2003, 4(9):R60.
54. Müller F, Laurent L, Kostka D, Ulitsky I, Williams R, Lu C, Park I, RaoM, Shamir R, Schwartz P, Schmidt N, Loring J: Regulatory networksdefine phenotypic classes of human cell lines. Nature 2008,455(18):401-406.
55. Sharov A, Piao Y, Matoba R, Dudekula D, Qian Y, VanBuren V, FalcoG, Martin P, Stagg C, Bassey U, Wang Y, Carter M, Hamatani T, AibaK, Akutsu H, Sharova L, Tanaka T, Kimber W, Yoshikawa T, JaradatS, Pantano S, Nagaraja R, Boheler K, Taub D, Hodes R, Longo D, Sch-lessinger D, Keller J, Klotz E, Kelsoe G, Umezawa A, Vescovi A, Ros-sant J, Kunath T, Hogan B, Curci A, D'Urso M, Kelso J, Hide W, KoM: Transcriptome analysis of mouse stem cells and earlyembryos. PLoS Biology 2003, 1(3):.
56. Jiang J, Chan Y, Loh Y, Cai J, Tong G, Lim C, Robson P, Zhong S, NgH: A core Klf circuitry regulates self-renewal of embryonicstem cells. Nature Cell Biology 2008, 10(3):353-360.
57. Young L, Keuling A, Lai R, Nation P, Tron V, Andrew S: The associ-ated contributions of p53 and the DNA mismatch repair pro-tein Msh6 to spontaneous tumorigenesis. Carcinogenesis 2007,28:2131-2138.
58. Hori K, Cholewa-Waclaw J, Nakada Y, Glasgow S, Masui T, Henke R,Wildner H, Martarelli B, Beres T, Epstein J, Magnuson M, MacDonaldR, Birchmeier C, Johnson J: A nonclassical bHLH-Rbpj transcrip-tion factor complex is required for specification of GABAer-gic neurons independent of Notch signaling. Genes andDevelopment 2008, 22:166-178.
59. Nocea T, Fujiwaraa Y, Sezakia M, Fujimoto H, Higashinakagawa T:Expression of a mouse zinc finger protein gene in both sper-matocytes and oocytes during meiosis. Developmental Biology1992, 153(2):356-367.
60. O'Hara M, Nibbio B, Craig R, Nemeth K, Charlap J, Knudsen T: Mito-chondrial benzodiazepine receptors regulate oxygen home-ostasis in the early mouse embryo. Reproductive Toxicology 2003,17(4):365-375.
61. Kendall S, Battelli C, Irwin S, Mitchell J, Glackin C, Verdi J: NRAGEmediates p38 activation and neural progenitor apoptosis viathe bone morphogenetic protein signaling cascade. Molecularand Cellular Biology 2005, 25(17):7711-7724.
62. Lupu F, Alves A, Anderson K, Doye V, Lacy E: Nuclear pore com-position regulates neural stem/progenitor cell differentia-tion in the mouse embryo. Developmental Cell 2008, 14:831-842.
63. Howard L, Nelson K, Maciewicz R, Blobel C: Interaction of themetalloprotease disintegrins MDC9 and MDC15 with twoSH3 domain-containing proteins, endophilin I and SH3PX1.Journal of Biological Chemistry 1999, 274(44):31693-31699.
64. Baines C, Kaiser R, Purcell N, Blair N, Osinska H, Hambleton M,Brunskill E, Sayen M, Gottlieb R, Dorn G, Robbins J, Molkentin J: Lossof cyclophilin D reveals a critical role for mitochondrial per-meability transition in cell death. Nature 2005,434(7033):658-662.
65. Duncan E, Muratore-Schroeder T, Cook R, Garcia B, Shabanowitz J,Hunt DF, Allis C: Cathepsin L Proteolytically Processes His-tone H3 During Mouse Embryonic Stem CellDifferentiation.Cell 2008, 135(2):284-294.
66. Sakamoto A, Chen M, Nakamura T, Xie T, Karsenty G, Weinstein L:Deficiency of the G-protein alpha-subunit G(s)alpha in oste-oblasts leads to differential effects on trabecular and corticalbone. Journal of Biological Chemistry 2005, 280(22):21369-21375.
67. Shimo T, Kanyama M, Wu C, Sugito H, Billings P, Abrams W, Rosen-bloom J, Iwamoto M, Pacifici M, Koyama E: Expression and roles ofconnective tissue growth factor in Meckel's cartilage devel-opment. Developmental Dynamics 2004, 231:136-147.
68. Da Cruz S, Xenarios I, Langridge J, Vilbois F, Parone P, Martinou J:Proteomic analysis of the mouse liver mitochondrial innermembrane. Journal of Biological Chemistry 2003,278(42):41566-41471.
Page 24 of 25(page number not for citation purposes)

BMC Genomics 2009, 10:327 http://www.biomedcentral.com/1471-2164/10/327
Publish with BioMed Central and every scientist can read your work free of charge
"BioMed Central will be the most significant development for disseminating the results of biomedical research in our lifetime."
Sir Paul Nurse, Cancer Research UK
Your research papers will be:
available free of charge to the entire biomedical community
peer reviewed and published immediately upon acceptance
cited in PubMed and archived on PubMed Central
yours — you keep the copyright
Submit your manuscript here:http://www.biomedcentral.com/info/publishing_adv.asp
BioMedcentral
69. Cho Y, Kwon S, Pak Y, Seol H, Choi Y, Park D, Park K, Lee HK:Dynamic changes in mitochondrial biogenesis and antioxi-dant enzymes during the spontaneous differentiation ofhuman embryonic stem cells. Biochemical and Biophysical ResearchCommunications 2006, 348:1472-1478.
70. Lonergan T, Bavister B, Brenner C: Mitochondria in stem cells.Mitochondrion 2007, 7:289-296.
71. Saretzki G, Walter T, Atkinson S, Passos JF, Bareth B, Keith W, Stew-art R, Hoare S, Stojkovic M, Armstrong L, von Zglinicki T, Lako M:Downregulation of Multiple Stress Defense MechanismsDuring Differentiation of Human Embryonic Stem Cells.Stem Cells 2008, 26:455-464.
72. Gu P, Goodwin B, Chung A, Xu X, Wheeler D, Price R, Galardi C,Peng L, Latour A, Koller B, Gossen J, Kliewer S, Cooney A: OrphanNuclear Receptor LRH-1 Is Required To Maintain Oct4Expression at the Epiblast Stage of Embryonic Develop-ment. Molecular Cell Biology 2005, 25:3492-3505.
73. White J, Dalton S: Cell Cycle Control of Embryonic Stem Cells.Stem Cell Reviews 2005, 1:131-138.
Page 25 of 25(page number not for citation purposes)