Embed Size (px)
Citation preview
BLUEMOUNTAIN INVESTMENT RESEARCH
Look ing for Easy Games in Bonds
Markets are always evolving. One of the
biggest changes in recent years has been the
rise of index funds. These passive funds, which
include traditional index funds and exchange-
traded funds that follow specific rules, have
received the majority of flows from investors in
the past decade. While active managers
continue to play a critical role in gathering
information and reflecting it in prices, passive
managers are growing their share of the
market in stocks and bonds.
The most popular indexes in the U.S. are the
S&P 500 for stocks and the Bloomberg
Barclays US Aggregate Bond Index for bonds.
Passive funds can mimic the S&P 500’s returns
closely and cheaply, but mimicking the
returns for the Bloomberg Barclays US
Aggregate Bond Index is substantially more
challenging because it has 20 times the
number of securities, higher turnover, and
more frequent rebalancing than the S&P 500.
The difficulty in matching the Bloomberg
Barclays US Aggregate Bond Index spells
opportunity for active managers. Indeed, a
much higher percentage of bond managers
than stock managers beat their passive peers
over time. One result is that U.S. active bond
managers have received $0.9 trillion in inflows
while active equity managers have suffered
$1.1 trillion in outflows over the past decade.
In this report, Michael reviews the shift from
active to passive, discusses the role of skill,
takes measure of the opportunities for active
bond managers, considers what these
developments mean for asset managers, and
examines the history of pre-fee excess returns
for bond managers. We always welcome your
questions and comments.
Andrew Feldstein
Chief Investment Officer
April 16, 2019
BLUEMOUNTAIN INVEST MENT RE SEAR CH / Apr i l 1 6 , 2 019
Looking for Easy Games in
Bonds
B L U E M O U N T A I N I N V E S T M E N T R E S E A R C H
Michael J. Mauboussin
Director of Research
The shift from active to passive management remains one of the hottest
issues in the investment industry. In this report we examine the shift from
active to passive investing in bonds. The migration in stocks has received
more attention than that in bonds because the move has been more
dramatic. The transition in bonds has been less rapid because active bond
investors have outperformed passive alternatives at a higher rate than equity
managers have, even if much of that outperformance can be explained by
exposure to risk premiums.
We document the shift by examining trends in assets under management and
flows for active and passive taxable bond funds. Next, we describe the
challenges that investors face in identifying skillful managers. We turn to
methods for measuring easy games, including a comparison of popular bond
and stock indexes and a consideration of the participants in the markets.
Finally, we review the implications for asset managers and conclude with a
novel framework for gauging the value that active managers generate.
Introduction
The growth in passive investing continues to be
an important topic for investors to consider.
Active managers select securities in an effort to
generate returns, adjusted for risk, that exceed
certain targets. Passive managers create
portfolios that mirror indexes or follow specific
rules. Examples of rules-based funds include those
that attempt to capture premiums from
fundamental factors such as size, value,
momentum, and volatility. These are commonly
called “smart beta” funds. Passive funds can be
in the form of traditional index mutual funds or
exchange-traded funds (ETFs).1
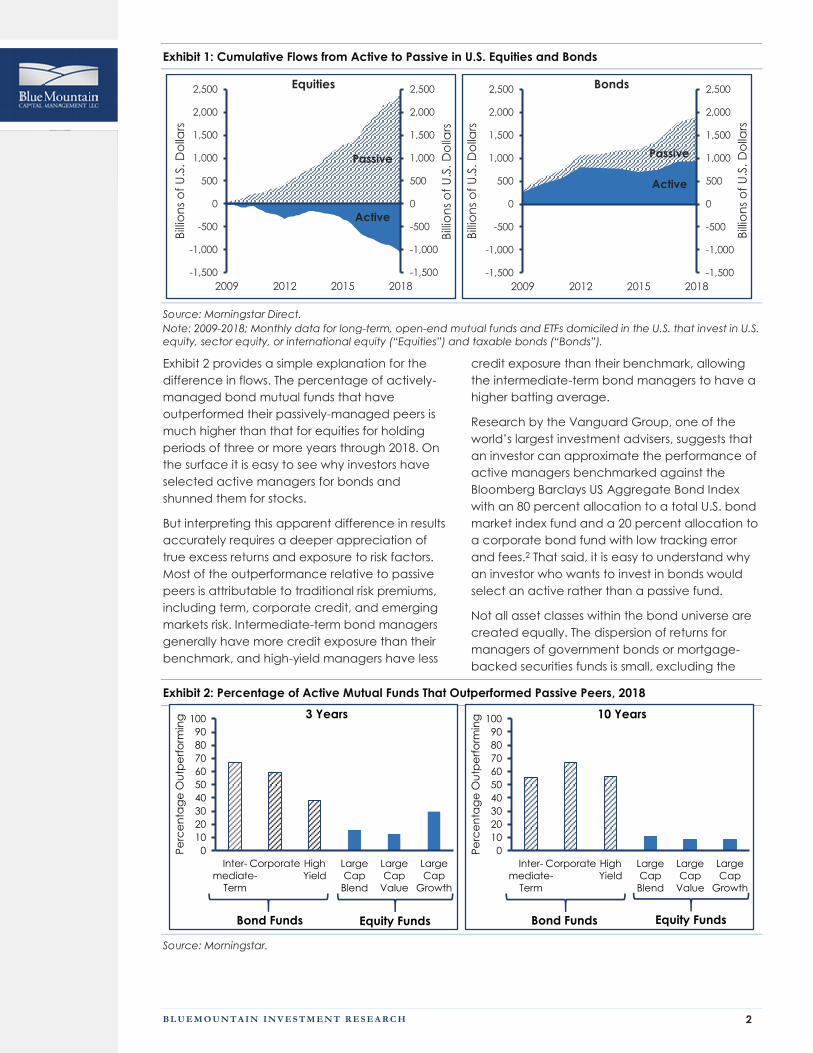
The top panel of exhibit 1 shows that active
equity funds in the U.S. have suffered $1.1 trillion in
cumulative outflows in the past ten years, while
flows into passive funds have approached $2.4
trillion.
Active managers in the bond market have not
fared as badly. The bottom panel of exhibit 1
reveals that cumulative flows have been positive
for both active and passive bond funds. Over the
past ten years, flows into active bond funds have
been roughly $935 billion and flows into passive
bond funds have been about $960 billion. The
trend has been clearly more favorable for passive
managers since 2012.
B L U E M O U N T A I N I N V E S T M E N T R E S E A R C H 2
Exhibit 1: Cumulative Flows from Active to Passive in U.S. Equities and Bonds
Source: Morningstar Direct.
Note: 2009-2018; Monthly data for long-term, open-end mutual funds and ETFs domiciled in the U.S. that invest in U.S.
equity, sector equity, or international equity (“Equities”) and taxable bonds (“Bonds”).
Exhibit 2 provides a simple explanation for the
difference in flows. The percentage of actively-
managed bond mutual funds that have
outperformed their passively-managed peers is
much higher than that for equities for holding
periods of three or more years through 2018. On
the surface it is easy to see why investors have
selected active managers for bonds and
shunned them for stocks.
But interpreting this apparent difference in results
accurately requires a deeper appreciation of
true excess returns and exposure to risk factors.
Most of the outperformance relative to passive
peers is attributable to traditional risk premiums,
including term, corporate credit, and emerging
markets risk. Intermediate-term bond managers
generally have more credit exposure than their
benchmark, and high-yield managers have less
credit exposure than their benchmark, allowing
the intermediate-term bond managers to have a
higher batting average.
Research by the Vanguard Group, one of the
world’s largest investment advisers, suggests that
an investor can approximate the performance of
active managers benchmarked against the
Bloomberg Barclays US Aggregate Bond Index
with an 80 percent allocation to a total U.S. bond
market index fund and a 20 percent allocation to
a corporate bond fund with low tracking error
and fees.2 That said, it is easy to understand why
an investor who wants to invest in bonds would
select an active rather than a passive fund.
Not all asset classes within the bond universe are
created equally. The dispersion of returns for
managers of government bonds or mortgage-
backed securities funds is small, excluding the
Exhibit 2: Percentage of Active Mutual Funds That Outperformed Passive Peers, 2018
Source: Morningstar.
-1,500
-1,000
-500
0
500
1,000
1,500
2,000
2,500
-1,500
-1,000
-500
0
500
1,000
1,500
2,000
2,500
2009 2012 2015 2018
Bill
ion
s o
f U
.S.
Do
llars
Bill
ion
s o
f U
.S.
Do
llars
Equities
Active
Passive
-1,500
-1,000
-500
0
500
1,000
1,500
2,000
2,500
-1,500
-1,000
-500
0
500
1,000
1,500
2,000
2,500
2009 2012 2015 2018
Bill
ion
s o
f U
.S.
Do
llars
Bill
ion
s o
f U
.S.
Do
llars
Bonds
Active
Passive
0
10
20
30
40
50
60
70
80
90
100
Inter-
mediate-
Term
Corporate High
Yield
Large
Cap
Blend
Large
Cap
Value
Large
Cap
Growth
Pe
rce
nta
ge
Ou
tpe
rfo
rmin
g 3 Years
Equity FundsBond Funds
0
10
20
30
40
50
60
70
80
90
100
Inter-
mediate-
Term
Corporate High
Yield
Large
Cap
Blend
Large
Cap
Value
Large
Cap
Growth
Pe
rce
nta
ge
Ou
tpe
rfo
rmin
g 10 Years
Equity FundsBond Funds

B L U E M O U N T A I N I N V E S T M E N T R E S E A R C H 3
amplifying effect of leverage, whereas the
dispersion in returns for managers of emerging-
market or high-yield bonds is large. For instance,
the difference between the 75th and 25th
percentile managers, measured over three years,
is roughly 5 times larger for emerging market debt
than for long-term government debt. Equity funds
are more volatile but the difference in dispersion
between the high- and low-dispersion asset
classes is only two times.
Notwithstanding the growth of passive investment
in stocks and bonds, it is important to underscore
that active management will not disappear
altogether. Active managers generate excess
returns by gathering information and reflecting it
in the market. In so doing, they promote price
discovery and provide liquidity.3 Active managers
make money as they drive prices toward
efficiency and allow all market participants to get
in and out of investments at a relatively low cost.
These are good for society and are a positive
externality. Traditional index funds and ETFs get a
free ride on this externality. The open question is
what percentage of the investment
management industry needs to be active to
accrue these benefits.
Documenting the Shift
The assets under management (AUM) for the U.S.
taxable bond mutual fund and ETF universe have
gone from about $380 billion in 1993 to roughly
$3.8 trillion today (left panel of exhibit 3), and
passive funds have gone from close to zero to
nearly one-third of the AUM (right panel). By way
of comparison, passive U.S. equity funds are now
about one-half of all AUM for managed funds.4
Exhibit 4 shows the flow of money into active and
passive taxable bond funds from 1993 through
2018. Flows into active funds were positive for 20
of the 26 years, although 3 of the 6 years of
outflows have occurred since 2012. Passive flows
have been positive every year.
Exhibit 3: AUM of U.S. Taxable Bond Mutual Funds and ETFs and Market Share of Passive, 1993-2018
Source: Morningstar Direct.
Exhibit 4: Fund Flows into Actively and Passively Managed U.S. Taxable Bond Funds, 1993-2018
Source: Morningstar Direct.
0
500
1,000
1,500
2,000
2,500
3,000
3,500
4,000
1993
1998
2003
2008
2013
2018
Bill
ion
s o
f D
olla
rs
AUM
Active
Passive
0
5
10
15
20
25
30
35
1993
1998
2003
2008
2013
2018
Pe
rce
nt
Passive as a Percentage of AUM
-100
0
100
200
300
400
500
1993
1994
1995
1996
1997
1998
1999
2000
2001
2002
2003
2004
2005
2006
2007
2008
2009
2010
2011
2012
2013
2014
2015
2016
2017
2018
Bill
ion
s o
f D
olla
rs
Actively Managed
Passively Managed
B L U E M O U N T A I N I N V E S T M E N T R E S E A R C H 4
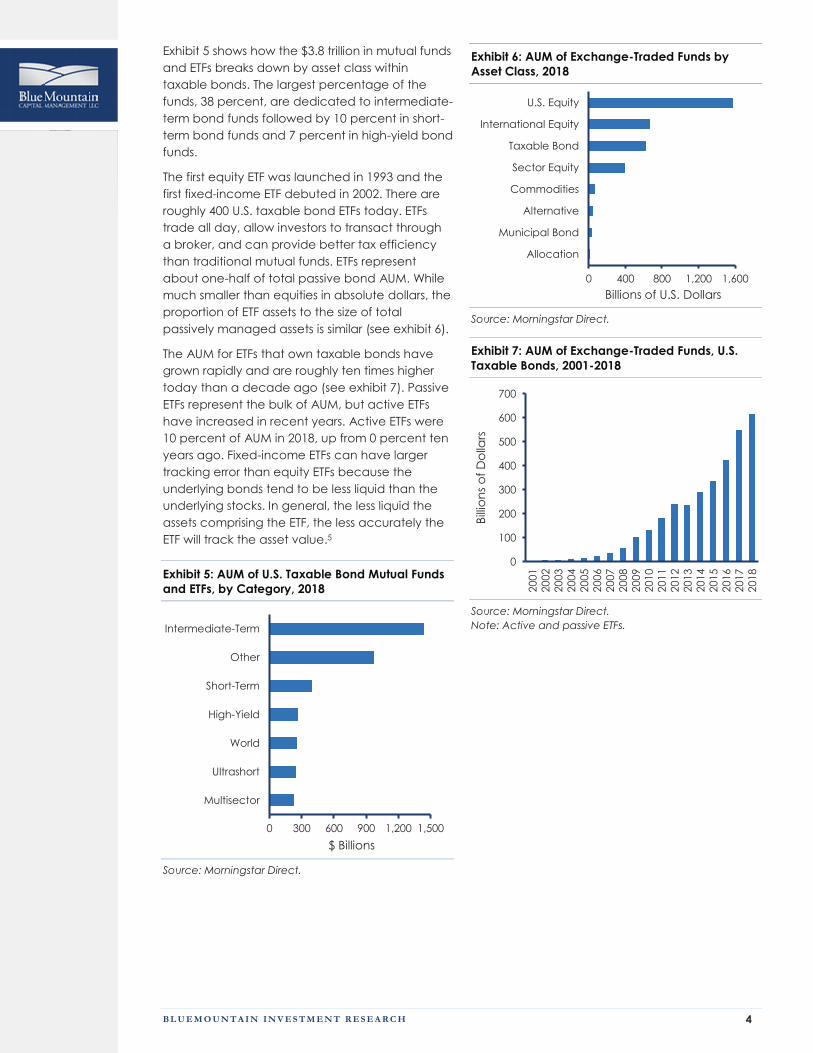
Exhibit 5 shows how the $3.8 trillion in mutual funds
and ETFs breaks down by asset class within
taxable bonds. The largest percentage of the
funds, 38 percent, are dedicated to intermediate-
term bond funds followed by 10 percent in short-
term bond funds and 7 percent in high-yield bond
funds.
The first equity ETF was launched in 1993 and the
first fixed-income ETF debuted in 2002. There are
roughly 400 U.S. taxable bond ETFs today. ETFs
trade all day, allow investors to transact through
a broker, and can provide better tax efficiency
than traditional mutual funds. ETFs represent
about one-half of total passive bond AUM. While
much smaller than equities in absolute dollars, the
proportion of ETF assets to the size of total
passively managed assets is similar (see exhibit 6).
The AUM for ETFs that own taxable bonds have
grown rapidly and are roughly ten times higher
today than a decade ago (see exhibit 7). Passive
ETFs represent the bulk of AUM, but active ETFs
have increased in recent years. Active ETFs were
10 percent of AUM in 2018, up from 0 percent ten
years ago. Fixed-income ETFs can have larger
tracking error than equity ETFs because the
underlying bonds tend to be less liquid than the
underlying stocks. In general, the less liquid the
assets comprising the ETF, the less accurately the
ETF will track the asset value.5
Exhibit 5: AUM of U.S. Taxable Bond Mutual Funds
and ETFs, by Category, 2018
Source: Morningstar Direct.
Exhibit 6: AUM of Exchange-Traded Funds by
Asset Class, 2018
Source: Morningstar Direct.
Exhibit 7: AUM of Exchange-Traded Funds, U.S.
Taxable Bonds, 2001-2018
Source: Morningstar Direct.
Note: Active and passive ETFs.
0 300 600 900 1,200 1,500
Multisector
Ultrashort
World
High-Yield
Short-Term
Other
Intermediate-Term
$ Billions
0 400 800 1,200 1,600
Allocation
Municipal Bond
Alternative
Commodities
Sector Equity
Taxable Bond
International Equity
U.S. Equity
Billions of U.S. Dollars
0
100
200
300
400
500
600
700
2001
2002
2003
2004
2005
2006
2007
2008
2009
2010
2011
2012
2013
2014
2015
2016
2017
2018
Bill
ion
s o
f D
olla
rs

B L U E M O U N T A I N I N V E S T M E N T R E S E A R C H 5
Sorting Skill and Luck
Active management is a zero-sum game in the
sense that there has to be symmetry between
managers who generate positive excess returns
and those who generate negative excess returns.
Investors face the challenge of identifying and
selecting skillful managers.
In fact, there are really two issues. The first is
judging which managers are likely to deliver
attractive returns and the other is assessing the
attractiveness of the opportunity to express skill.
A common way to measure skill is to look at
persistence. Results are persistent in activities
where outcomes are due predominantly to skill
rather than luck. Think of a world-class musician.
She will play beautifully night in and night out. The
quality of the performance is lasting. Results are
more random when luck primarily determines
outcomes. Yesterday’s lottery winner has no
better a chance to win tomorrow.
Consistent with the message from exhibit 2, the
persistence in performance for bond mutual fund
managers tends to be higher than that for equity
mutual fund managers.6 This means that bond
funds that outperform the benchmark tend to do
so with some consistency.
There are a couple ways to explain that result. It
may be the case that there is a lot of variety in
the skill of bond managers and that the better
ones outperform the worse ones. It may also be
the case that measuring relative results is trickier
than it appears. For example, managers may
have exposure to a risk factor that a simple return
figure fails to reflect and therefore the
outperformance is really compensation for risk.
The variation of skill is a crucial consideration in
any competitive domain. One useful concept is
the “paradox of skill,” which says that in activities
where both skill and luck contribute to outcomes,
as skill increases, luck can play a bigger role in
determining results.7 The key to the idea is to
recognize that you can measure absolute and
relative skill. In nearly all competitive domains,
absolute skill has improved. Consider sports
measured against a clock, such as running or
swimming. Athletes today are faster than their
predecessors as the result of advancements in
technique, nutrition, coaching, and training.
At the same time that absolute skill has improved,
relative skill has narrowed. That means that in a
field of competition, the difference between the
best and the average player is smaller today
than it was in the past. As the level of skill
becomes more uniform, the role of luck rises.
The paradox of skill is a big deal in investing. That
manager results appear close to random is not
because professional investors don’t know what
they are doing. It’s actually the opposite.
Investors today are so good that asset prices do
an effective, albeit imperfect, job of reflecting
relevant information.8
One way to measure the paradox of skill over
time is to examine changes in the standard
deviation of results. Think of it this way: the results
for many activities follow a distribution that looks
like a bell. Lots of participants are near the
average at the top of the bell. The sides that
slope down from the top represent the under-
and outperformers. Standard deviation measures
the width of the bell. A shrinking standard
deviation reveals the paradox of skill, as it
documents the gap between the average and
the extreme performers.
The investment management industry measures
results through excess returns adjusted for risk
relative to an appropriate benchmark, or alpha.
The distribution of alpha doesn’t follow a perfect
bell-shaped curve, but reality is close enough to
make the point. Skillful active managers want
wide distributions so they can earn positive alpha
while less skillful investors suffer negative alpha.
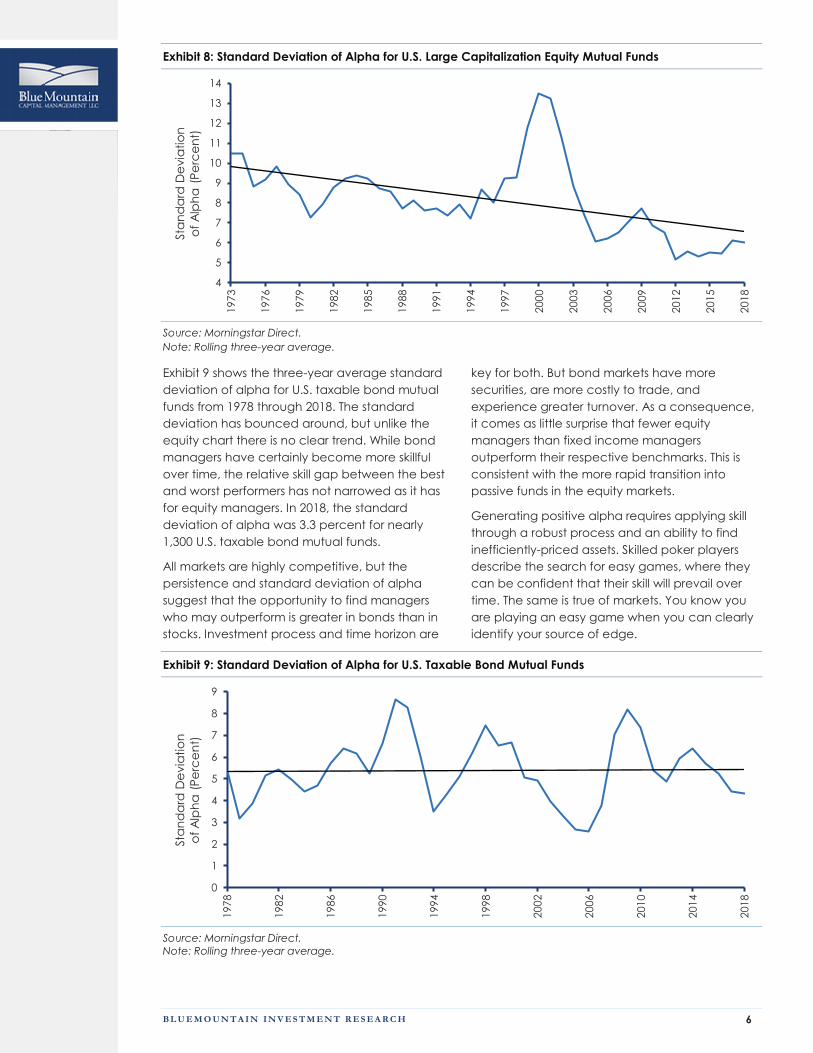
Exhibit 8 shows the three-year average standard
deviation of single-factor alpha for U.S. large
capitalization equity mutual funds from 1973
through 2018. There is a steady decline in
standard deviation, save for a brief but explosive
expansion during the dot-com bubble. That
noted, the standard deviation has rebounded
modestly since the financial crisis. In 2018, the
standard deviation of alpha was 5.1 percent for
more than 2,000 equity mutual funds.
B L U E M O U N T A I N I N V E S T M E N T R E S E A R C H 6
Exhibit 8: Standard Deviation of Alpha for U.S. Large Capitalization Equity Mutual Funds
Source: Morningstar Direct.
Note: Rolling three-year average.
Exhibit 9 shows the three-year average standard
deviation of alpha for U.S. taxable bond mutual
funds from 1978 through 2018. The standard
deviation has bounced around, but unlike the
equity chart there is no clear trend. While bond
managers have certainly become more skillful
over time, the relative skill gap between the best
and worst performers has not narrowed as it has
for equity managers. In 2018, the standard
deviation of alpha was 3.3 percent for nearly
1,300 U.S. taxable bond mutual funds.
All markets are highly competitive, but the
persistence and standard deviation of alpha
suggest that the opportunity to find managers
who may outperform is greater in bonds than in
stocks. Investment process and time horizon are
key for both. But bond markets have more
securities, are more costly to trade, and
experience greater turnover. As a consequence,
it comes as little surprise that fewer equity
managers than fixed income managers
outperform their respective benchmarks. This is
consistent with the more rapid transition into
passive funds in the equity markets.
Generating positive alpha requires applying skill
through a robust process and an ability to find
inefficiently-priced assets. Skilled poker players
describe the search for easy games, where they
can be confident that their skill will prevail over
time. The same is true of markets. You know you
are playing an easy game when you can clearly
identify your source of edge.
Exhibit 9: Standard Deviation of Alpha for U.S. Taxable Bond Mutual Funds
Source: Morningstar Direct.
Note: Rolling three-year average.
4
5
6
7
8
9
10
11
12
13
14
1973
1976
1979
1982
1985
1988
1991
1994
1997
2000
2003
2006
2009
2012
2015
2018
Sta
nd
ard
De
via
tio
n
of
Alp
ha
(P
erc
en
t)
0
1
2
3
4
5
6
7
8
9
1978
1982
1986
1990
1994
1998
2002
2006
2010
2014
2018
Sta
nd
ard
De
via
tio
n
of
Alp
ha
(P
erc
en
t)
B L U E M O U N T A I N I N V E S T M E N T R E S E A R C H 7
Measures of Easy Games
In assessing easy games, you consider the game
itself and the nature of the other participants. The
game provides some context for gauging how
active managers can perform relative to an
index fund or ETF that tracks a benchmark. Part of
the reason that active bond managers succeed
in outperforming a benchmark at a higher rate
than equity managers is the nature of the two
markets.
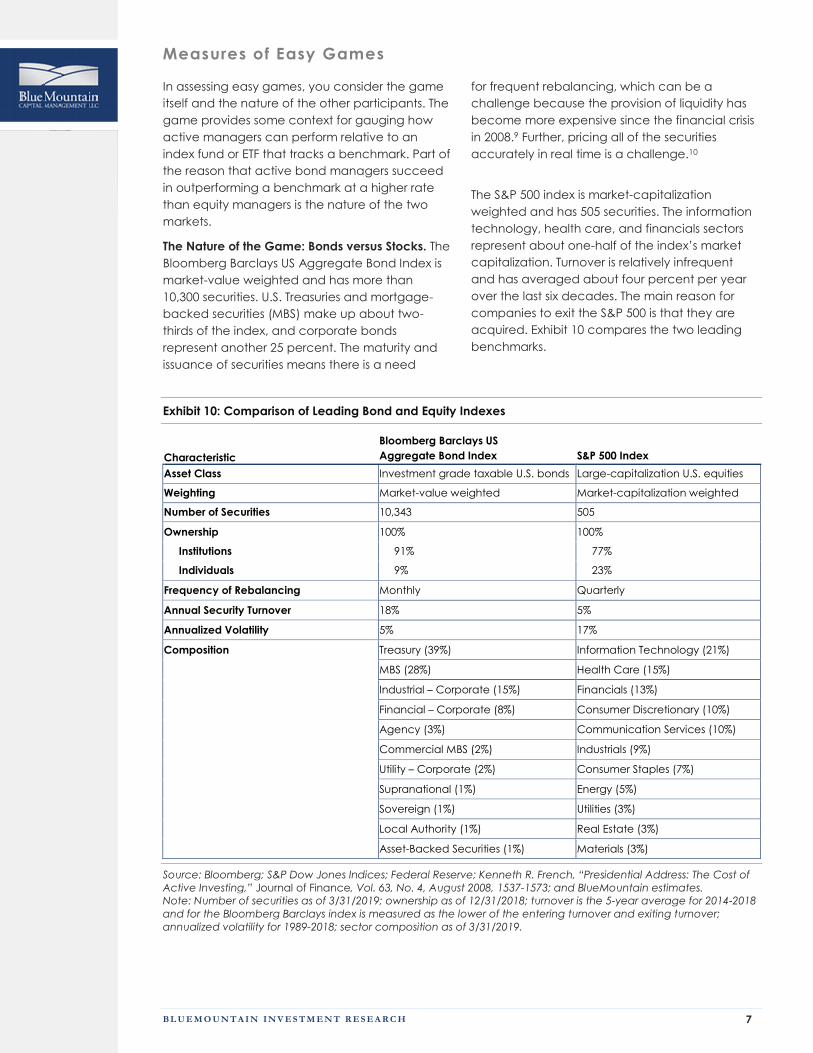
The Nature of the Game: Bonds versus Stocks. The
Bloomberg Barclays US Aggregate Bond Index is
market-value weighted and has more than
10,300 securities. U.S. Treasuries and mortgage-
backed securities (MBS) make up about two-
thirds of the index, and corporate bonds
represent another 25 percent. The maturity and
issuance of securities means there is a need
for frequent rebalancing, which can be a
challenge because the provision of liquidity has
become more expensive since the financial crisis
in 2008.9 Further, pricing all of the securities
accurately in real time is a challenge.10
The S&P 500 index is market-capitalization
weighted and has 505 securities. The information
technology, health care, and financials sectors
represent about one-half of the index’s market
capitalization. Turnover is relatively infrequent
and has averaged about four percent per year
over the last six decades. The main reason for
companies to exit the S&P 500 is that they are
acquired. Exhibit 10 compares the two leading
benchmarks.
Exhibit 10: Comparison of Leading Bond and Equity Indexes
Characteristic
Bloomberg Barclays US
Aggregate Bond Index S&P 500 Index
Asset Class Investment grade taxable U.S. bonds Large-capitalization U.S. equities
Weighting Market-value weighted Market-capitalization weighted
Number of Securities 10,343 505
Ownership 100% 100%
Institutions 91% 77%
Individuals 9% 23%
Frequency of Rebalancing Monthly Quarterly
Annual Security Turnover 18% 5%
Annualized Volatility 5% 17%
Composition Treasury (39%) Information Technology (21%)
MBS (28%) Health Care (15%)
Industrial – Corporate (15%) Financials (13%)
Financial – Corporate (8%) Consumer Discretionary (10%)
Agency (3%) Communication Services (10%)
Commercial MBS (2%) Industrials (9%)
Utility – Corporate (2%) Consumer Staples (7%)
Supranational (1%) Energy (5%)
Sovereign (1%) Utilities (3%)
Local Authority (1%) Real Estate (3%)
Asset-Backed Securities (1%) Materials (3%)
Source: Bloomberg; S&P Dow Jones Indices; Federal Reserve; Kenneth R. French, “Presidential Address: The Cost of
Active Investing,” Journal of Finance, Vol. 63, No. 4, August 2008, 1537-1573; and BlueMountain estimates.
Note: Number of securities as of 3/31/2019; ownership as of 12/31/2018; turnover is the 5-year average for 2014-2018
and for the Bloomberg Barclays index is measured as the lower of the entering turnover and exiting turnover;
annualized volatility for 1989-2018; sector composition as of 3/31/2019.

B L U E M O U N T A I N I N V E S T M E N T R E S E A R C H 8
To show how indexing to these benchmarks
differs in practice, we can compare the iShares
Core U.S. Aggregate Bond ETF (AGG) and the
iShares Core S&P 500 ETF (IVV). AGG had $57
billion in AUM and IVV had $149 billion at year-
end 2018. We look at three metrics for each:
percent of index securities held, active share,
and tracking error.
AGG owns 60 percent of the securities in the
Bloomberg Barclays US Aggregate Bond Index.
The leading ETFs that track the index hold
between one-quarter and three-quarters of the
securities in the index. Passive bond managers
must decide which securities to own. IVV holds
100 percent of its benchmark, as do all large
equity index funds.
Active share reflects how much a fund differs
from its index.11 Active share is zero percent if a
fund exactly matches the index and 100 percent
if it is completely different. The calculation
assumes no leverage or short sales. (See
appendix for more detail.) The active share is 53
percent for AGG and 1 percent for IVV. A passive
bond ETF is less similar to its benchmark than a
comparable stock ETF.
Tracking error, the standard deviation of the
difference between the returns of a portfolio and
the index, is a measure of how closely a portfolio
matches the index. AGG’s tracking error is four
basis points, while IVV’s is one basis point. Further,
the annualized volatility for the Bloomberg
Barclays US Aggregate Bond Index is lower on
average than that for the S&P 500 index, so the
tracking error as a percentage of volatility is
much higher for AGG than IVV.
Exhibit 11 summarizes the differences between
AGG and IVV and clarifies why equity indexing is
more straightforward than bond indexing.
Exhibit 11: Tale of the Tape: AGG versus IVV
Metric AGG IVV
Percent of index securities held 60% 100%
Active share 53% 1%
Tracking error (basis points) 4 1
Source: Morningstar Direct and ActiveShare.info.
Note: Percent of index securities held is through
3/26/2019; Active share as of 3/26/2019 for AGG and
12/31/2016 for IVV; Tracking error based on monthly
returns annualized over three years ended 2/28/2019.
Exhibit 12: Tracking Error for Index Funds and ETFs
Benchmarked to Various Indexes
Category
Tracking Error
(Basis Points)
S&P 500 2
Short-Term Government 5
Intermediate Government 9
Mortgage-Backed 18
Inflation-Protected 20
Intermediate Investment Grade 21
Emerging Markets 23
High Yield 47
Source: Morningstar Direct.
Note: Monthly returns annualized over three years
ended 2/28/2019; Reflects average of 5 largest funds for
each category except for mortgage-backed, which
includes 3 funds based on data availability.
We selected AGG because it is large and can be
reasonably compared to the Bloomberg Barclays
US Aggregate Bond Index. Exhibit 12 shows that
the average tracking error for passive bond funds
ranges from 5 basis points for short-term
government funds to 47 basis points for high yield
funds. In each case, the tracking error is
calculated using the benchmark noted in the
fund prospectus.
We have seen that it is difficult to build a fund
that closely tracks the Bloomberg Barclays US
Aggregate Bond Index. This difficulty creates
opportunity. Refinancing, maturities, and issuance
present ways for active managers to beat the
benchmark. This ability is inherently more limited
for active equity managers.
For example, the issuance of new securities is far
more active in the bond market than in the stock
market, creating a potential source of alpha for
bond managers. There are more new bond issues
because bonds mature whereas equities are
perpetual. Institutional bond investors purchase
new issues from bank underwriters, often at a
discount to similar secondary transactions.
This new-issue yield premium compensates
investors in corporate debt for bearing the
uncertainty of what the eventual market price will
be, as well as other risks. New issues equaled 17
percent of total debt outstanding for the
corporate debt market in the decade ended
2018. But research suggests bond investors earn
returns, or alpha, that these risks do not fully
explain. One argument is that banks underprice
new issues to benefit institutional investors. This
effectively transfers wealth from issuers to
investors.12
B L U E M O U N T A I N I N V E S T M E N T R E S E A R C H 9
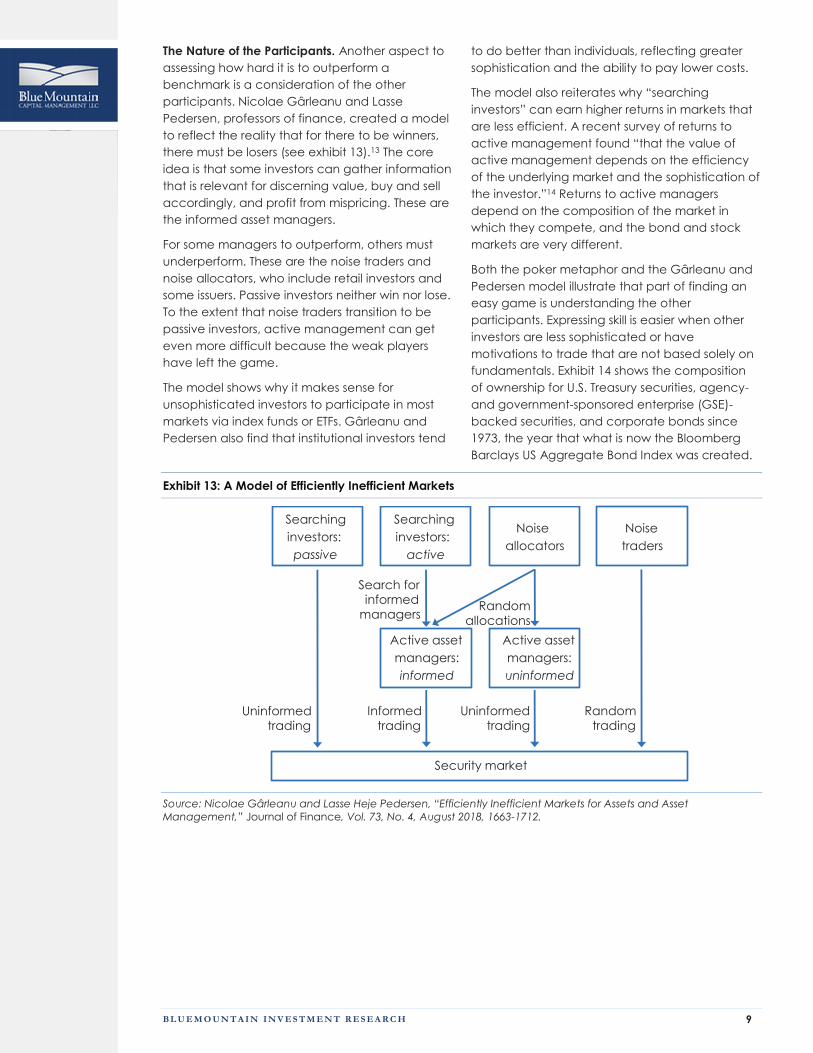
The Nature of the Participants. Another aspect to
assessing how hard it is to outperform a
benchmark is a consideration of the other
participants. Nicolae Gârleanu and Lasse
Pedersen, professors of finance, created a model
to reflect the reality that for there to be winners,
there must be losers (see exhibit 13).13 The core
idea is that some investors can gather information
that is relevant for discerning value, buy and sell
accordingly, and profit from mispricing. These are
the informed asset managers.
For some managers to outperform, others must
underperform. These are the noise traders and
noise allocators, who include retail investors and
some issuers. Passive investors neither win nor lose.
To the extent that noise traders transition to be
passive investors, active management can get
even more difficult because the weak players
have left the game.
The model shows why it makes sense for
unsophisticated investors to participate in most
markets via index funds or ETFs. Gârleanu and
Pedersen also find that institutional investors tend
to do better than individuals, reflecting greater
sophistication and the ability to pay lower costs.
The model also reiterates why “searching
investors” can earn higher returns in markets that
are less efficient. A recent survey of returns to
active management found “that the value of
active management depends on the efficiency
of the underlying market and the sophistication of
the investor.”14 Returns to active managers
depend on the composition of the market in
which they compete, and the bond and stock
markets are very different.
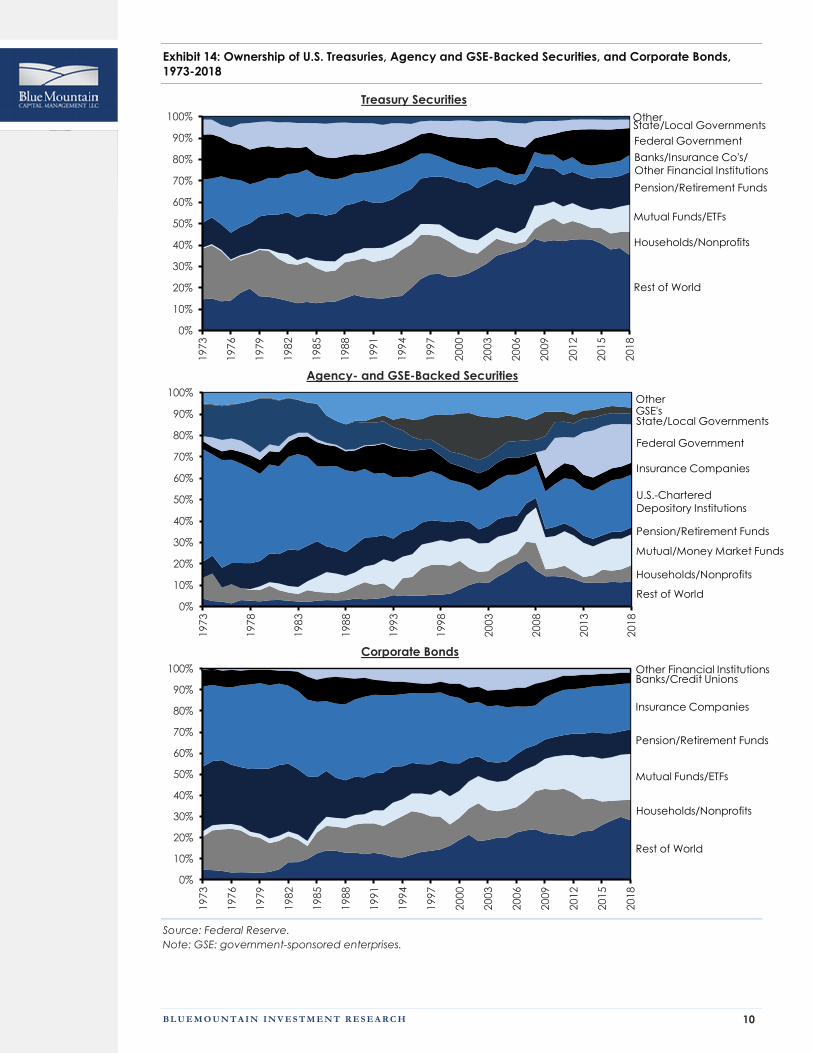
Both the poker metaphor and the Gârleanu and
Pedersen model illustrate that part of finding an
easy game is understanding the other
participants. Expressing skill is easier when other
investors are less sophisticated or have
motivations to trade that are not based solely on
fundamentals. Exhibit 14 shows the composition
of ownership for U.S. Treasury securities, agency-
and government-sponsored enterprise (GSE)-
backed securities, and corporate bonds since
1973, the year that what is now the Bloomberg
Barclays US Aggregate Bond Index was created.
Exhibit 13: A Model of Efficiently Inefficient Markets
Source: Nicolae Gârleanu and Lasse Heje Pedersen, “Efficiently Inefficient Markets for Assets and Asset
Management,” Journal of Finance, Vol. 73, No. 4, August 2018, 1663-1712.
Search for informed
managers
Searching
investors:
passive
Searching
investors:
active
Noise
allocators
Noise
traders
Active asset
managers:
informed
Active asset
managers:
uninformed
Security market
Uninformed trading
Informed trading
Uninformed trading
Random trading
Random allocations
B L U E M O U N T A I N I N V E S T M E N T R E S E A R C H 10
Exhibit 14: Ownership of U.S. Treasuries, Agency and GSE-Backed Securities, and Corporate Bonds,
1973-2018
Treasury Securities
Agency- and GSE-Backed Securities
Corporate Bonds
Source: Federal Reserve.
Note: GSE: government-sponsored enterprises.
0%
10%
20%
30%
40%
50%
60%
70%
80%
90%
100%
1973
1976
1979
1982
1985
1988
1991
1994
1997
2000
2003
2006
2009
2012
2015
2018
Rest of World
Mutual Funds/ETFs
Households/Nonprofits
State/Local Governments
Banks/Insurance Co's/
Other Financial Institutions
Pension/Retirement Funds
Federal Government
Other
0%
10%
20%
30%
40%
50%
60%
70%
80%
90%
100%
1973
1978
1983
1988
1993
1998
2003
2008
2013
2018
Rest of World
Mutual/Money Market Funds
Households/Nonprofits
State/Local Governments
U.S.-Chartered
Depository Institutions
Pension/Retirement Funds
Federal Government
OtherGSE's
Insurance Companies
0%
10%
20%
30%
40%
50%
60%
70%
80%
90%
100%
1973
1976
1979
1982
1985
1988
1991
1994
1997
2000
2003
2006
2009
2012
2015
2018
Rest of World
Mutual Funds/ETFs
Households/Nonprofits
Other Financial Institutions
Insurance Companies
Pension/Retirement Funds
Banks/Credit Unions
B L U E M O U N T A I N I N V E S T M E N T R E S E A R C H 11
There are a couple of observations that are
relevant for a consideration of passive and active
bond management:
Some large holders of U.S. Treasury and
agency- and GSE-backed securities may
have incentives unrelated to the value of
the bonds solely. For instance, the Federal
Reserve buys bonds to achieve quantitative
easing and non-U.S. central banks buy
bonds to stabilize exchange rates.15 This is
important because foreign ownership of U.S.
Treasury and agency- and GSE-backed
securities has increased substantially in
recent decades.
Further, banks are required to hold high-
quality liquid assets to ensure liquidity.
Because the Bloomberg Barclays US
Aggregate Bond Index largely comprises
U.S. Treasuries and agency- and GSE-
backed securities, these non-economic
owners can influence the price of the
securities and hence the index’s returns.
Rules or regulations constrain the bond
holdings of certain institutions.16 For
example, an insurance company that owns
an investment grade bond may need to sell
it if it is downgraded to high yield. This leads
to a lower price on the security than the
fundamentals justify. In both cases, active
managers can position themselves to
sidestep these challenges or take
advantage of them. This makes it easier to
beat the benchmark.
The pattern of fund flows is different in
equities versus bonds, as we saw in exhibit 1.
Active U.S. equity managers have realized
outflows of $1.1 trillion in the past ten years,
whereas active U.S. taxable bond managers
have seen inflows of $935 billion. While flows
into passive bond funds have exceeded
flows into active bond funds, the story is not
as one-sided as in equities.17 Flows are
important in investing because they create
a tailwind for funds doing well and a
headwind for those performing poorly.
Investors generally chase past performance
by investing in funds that have done well.
Portfolio managers who receive inflows
commonly purchase more of the securities
they already own, boosting the
performance of the portfolo.18
Underperforming managers who suffer
outflows must sell what they hold,
compounding performance woes. Flows are
a short-term predictor of results.19
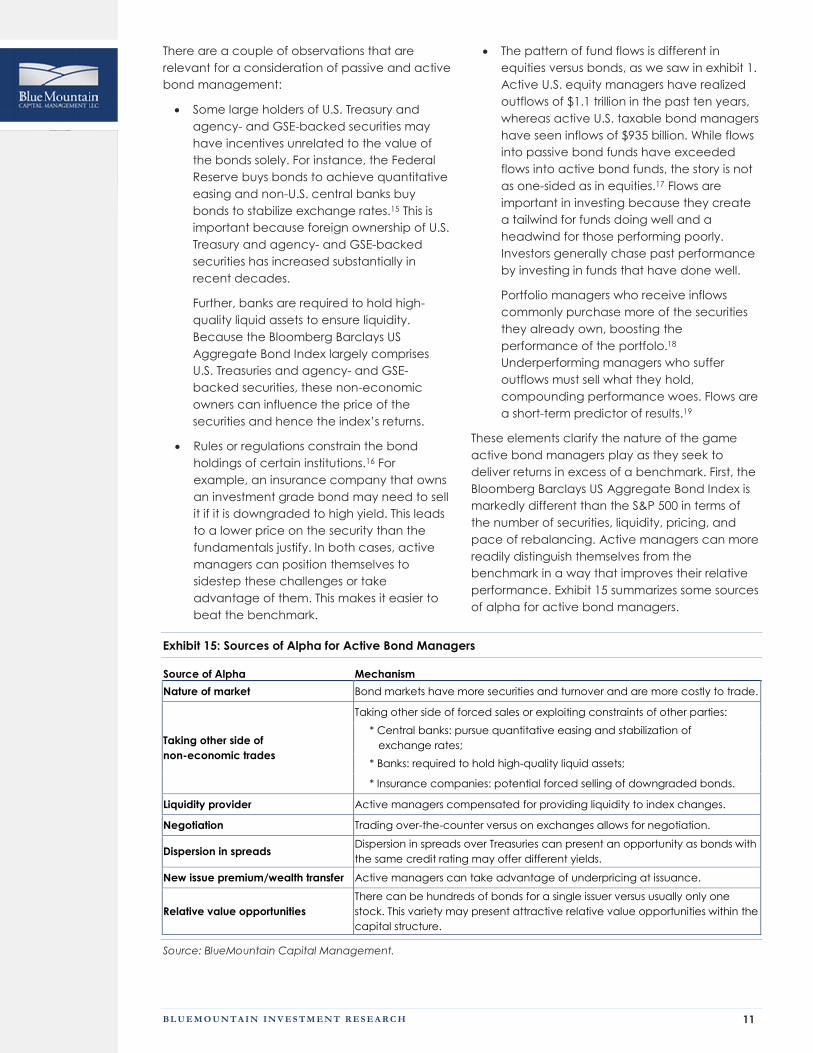
These elements clarify the nature of the game
active bond managers play as they seek to
deliver returns in excess of a benchmark. First, the
Bloomberg Barclays US Aggregate Bond Index is
markedly different than the S&P 500 in terms of
the number of securities, liquidity, pricing, and
pace of rebalancing. Active managers can more
readily distinguish themselves from the
benchmark in a way that improves their relative
performance. Exhibit 15 summarizes some sources
of alpha for active bond managers.
Exhibit 15: Sources of Alpha for Active Bond Managers
Source of Alpha Mechanism
Nature of market Bond markets have more securities and turnover and are more costly to trade.
Taking other side of
non-economic trades
Taking other side of forced sales or exploiting constraints of other parties:
* Central banks: pursue quantitative easing and stabilization of
exchange rates;
* Banks: required to hold high-quality liquid assets;
* Insurance companies: potential forced selling of downgraded bonds.
Liquidity provider Active managers compensated for providing liquidity to index changes.
Negotiation Trading over-the-counter versus on exchanges allows for negotiation.
Dispersion in spreads Dispersion in spreads over Treasuries can present an opportunity as bonds with
the same credit rating may offer different yields.
New issue premium/wealth transfer Active managers can take advantage of underpricing at issuance.
Relative value opportunities
There can be hundreds of bonds for a single issuer versus usually only one
stock. This variety may present attractive relative value opportunities within the
capital structure.
Source: BlueMountain Capital Management.
B L U E M O U N T A I N I N V E S T M E N T R E S E A R C H 12
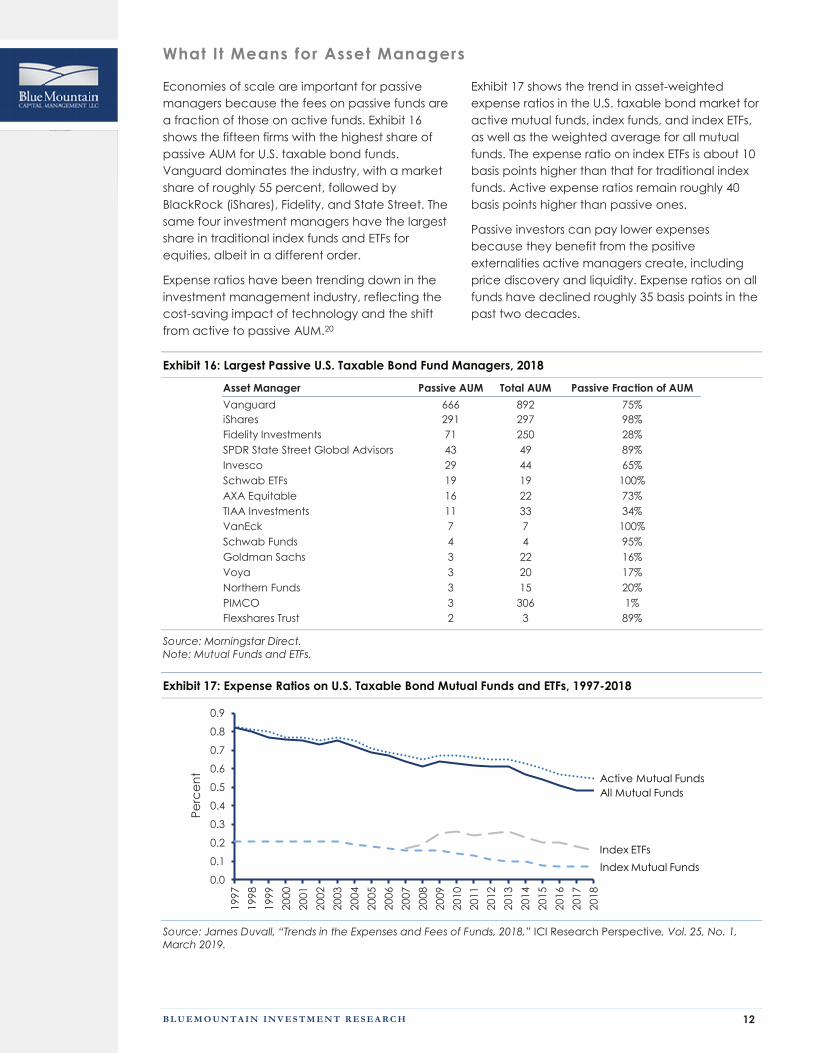
What It Means for Asset Managers
Economies of scale are important for passive
managers because the fees on passive funds are
a fraction of those on active funds. Exhibit 16
shows the fifteen firms with the highest share of
passive AUM for U.S. taxable bond funds.
Vanguard dominates the industry, with a market
share of roughly 55 percent, followed by
BlackRock (iShares), Fidelity, and State Street. The
same four investment managers have the largest
share in traditional index funds and ETFs for
equities, albeit in a different order.
Expense ratios have been trending down in the
investment management industry, reflecting the
cost-saving impact of technology and the shift
from active to passive AUM.20
Exhibit 17 shows the trend in asset-weighted
expense ratios in the U.S. taxable bond market for
active mutual funds, index funds, and index ETFs,
as well as the weighted average for all mutual
funds. The expense ratio on index ETFs is about 10
basis points higher than that for traditional index
funds. Active expense ratios remain roughly 40
basis points higher than passive ones.
Passive investors can pay lower expenses
because they benefit from the positive
externalities active managers create, including
price discovery and liquidity. Expense ratios on all
funds have declined roughly 35 basis points in the
past two decades.
Exhibit 16: Largest Passive U.S. Taxable Bond Fund Managers, 2018
Asset Manager Passive AUM Total AUM Passive Fraction of AUM
Vanguard 666 892 75%
iShares 291 297 98%
Fidelity Investments 71 250 28%
SPDR State Street Global Advisors 43 49 89%
Invesco 29 44 65%
Schwab ETFs 19 19 100%
AXA Equitable 16 22 73%
TIAA Investments 11 33 34%
VanEck 7 7 100%
Schwab Funds 4 4 95%
Goldman Sachs 3 22 16%
Voya 3 20 17%
Northern Funds 3 15 20%
PIMCO 3 306 1%
Flexshares Trust 2 3 89%
Source: Morningstar Direct.
Note: Mutual Funds and ETFs.
Exhibit 17: Expense Ratios on U.S. Taxable Bond Mutual Funds and ETFs, 1997-2018
Source: James Duvall, “Trends in the Expenses and Fees of Funds, 2018,” ICI Research Perspective, Vol. 25, No. 1,
March 2019.
0.0
0.1
0.2
0.3
0.4
0.5
0.6
0.7
0.8
0.9
1997
1998
1999
2000
2001
2002
2003
2004
2005
2006
2007
2008
2009
2010
2011
2012
2013
2014
2015
2016
2017
2018
Pe
rce
nt
All Mutual Funds
Active Mutual Funds
Index ETFs
Index Mutual Funds
B L U E M O U N T A I N I N V E S T M E N T R E S E A R C H 13
Winning the Easy Game (Value Added by Active Managers)
Markets cannot be perfectly efficient, where
price and value are the same, because there is a
cost to gather information and reflect it in prices.
To compensate investors for assuming this cost,
there must be a profit opportunity in the form of
excess return. In a competitive market, it would
be reasonable to assume that cost and benefit
are in rough parity.
The trick is to quantify cost and benefit. The
amount of fees that investors pay to active
managers is one approach to quantifying cost,
and available positive alpha captures benefit.
While much of the investment industry reports
results using percentage returns versus a
benchmark, the crucial underlying question is
how many dollars in excess returns a fund
creates.
Jonathan Berk and Richard Green, professors of
economics, created a framework to consider
excess returns that captures both cost and
benefit.21 They assume that investors seek to give
their money to funds that will generate excess
returns but that the more money a skillful
manager runs, the lower is his or her expected
alpha. Their setup suggests that skillful managers
end up with more money and expected alpha
moves toward zero as a fund grows.
The Berk and Green framework is similar to
economic profit, or a company’s economic
return after considering the opportunity cost of
capital.22 Economic profit equals a firm’s return
on invested capital (ROIC) minus its weighted
average cost of capital (WACC) times its invested
capital. For example, a firm with a 13 percent
ROIC, an 8 percent WACC, and $1,000,000 in
invested capital has an economic profit of
$50,000 ([0.13 – 0.08] x $1,000,000).
The same analysis applies to investment funds. A
fund’s gross economic profit equals its beta-
adjusted gross return minus the benchmark
return, multiplied by AUM. We call gross
economic profit “gross profit” for short. For
instance, a bond fund with average risk that has
a gross return of 9 percent, a benchmark return of
4 percent, and $100,000,000 of AUM would
produce a gross profit of $5,000,000 ([0.09 – 0.04]
x $100,000,000). Five million dollars is the value the
investment manager extracts from the market.
Berk and Green find that gross profit is a better
reflection of skill than simple measures of return.
Here’s an example. Peter Lynch, who managed
the Magellan Fund at Fidelity Investments from
May 1977 to May 1990, generated an average
annual return of more than 29 percent per
annum. Alpha was large but the AUM was small
in his first five years running the fund. Lynch’s
average monthly gross profit was $2.1 million in
2018 U.S. dollars.
Positive alpha was small but the AUM was large in
the last five years he ran the fund. Average
monthly gross profit was roughly $38 million. Even
though Lynch’s alpha was vastly larger in the
early years than in the late years, he extracted
nearly 20 times more value in his last 5 years as a
result of the large increase in AUM.23
Results for Bill Gross, the famous bond investor
who spent the bulk of his career running the Total
Return Fund at PIMCO, provide a noteworthy
comparison. The average monthly spread
between the fund’s risk-adjusted gross return and
the benchmark return, gross alpha, was 0.10
percent over Gross’s first five years running the
fund. His skill allowed him to extract about $1.9
million per month in 2018 U.S. dollars from the
market.
In his last five years ended in September 2014, the
average monthly spread was 0.18 percent, and
the average fund AUM was $271 billion. Gross’s
monthly value extraction was roughly $500 million.
The magnitude of his alpha in the later years was
roughly double what it was in the early years,
leading to value extraction that was roughly 270
times larger because of the substantial increase
in AUM.
We calculate gross profit before fees to
accurately measure an investment manager’s
skill.24 Fees finance the manager’s ability to
express skill by unearthing information and pricing
it in securities. But fees also eat into investor
returns. How best to split the fruits of skill between
managers and investors is a topic of debate.
We use the Berk and Green calculation to
analyze active mutual funds in the Morningstar
Direct database that invest in U.S. taxable bonds
from 1978 through 2018. Over the full period the
data capture roughly 23,400 fund years and $35
trillion of AUM. The database is free of survivorship
bias. We show all figures in 2018 U.S. dollars to
reflect inflation.
B L U E M O U N T A I N I N V E S T M E N T R E S E A R C H 14
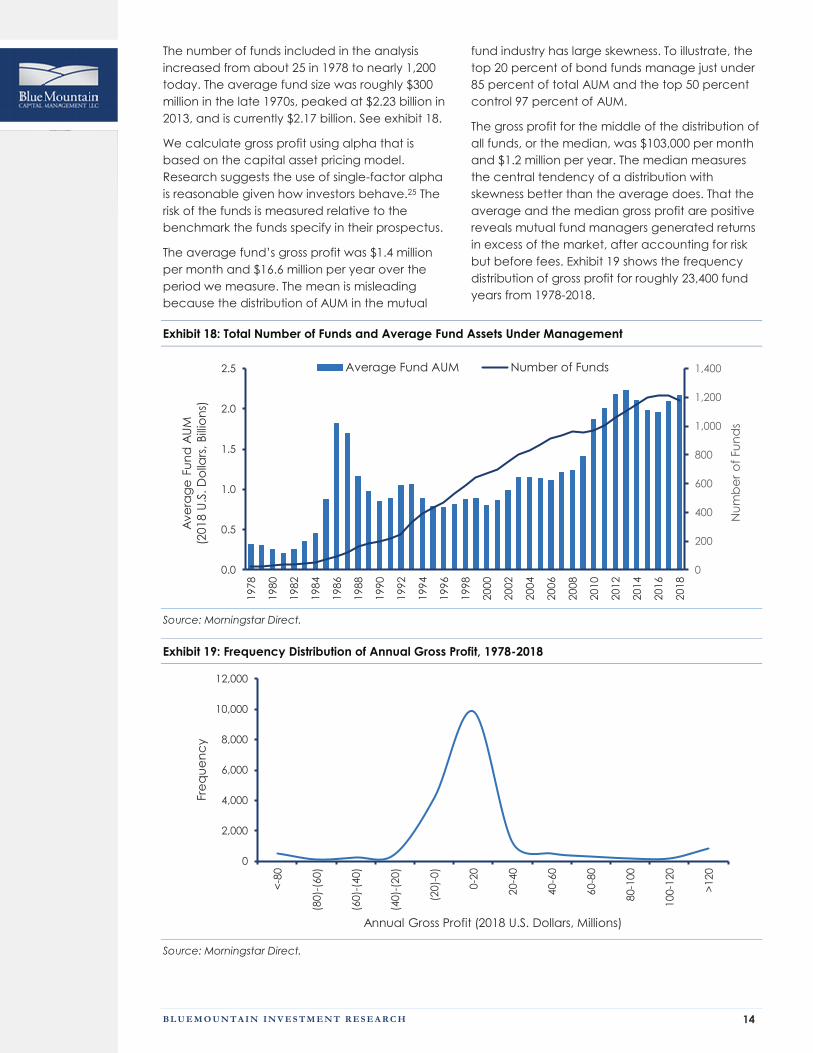
The number of funds included in the analysis
increased from about 25 in 1978 to nearly 1,200
today. The average fund size was roughly $300
million in the late 1970s, peaked at $2.23 billion in
2013, and is currently $2.17 billion. See exhibit 18.
We calculate gross profit using alpha that is
based on the capital asset pricing model.
Research suggests the use of single-factor alpha
is reasonable given how investors behave.25 The
risk of the funds is measured relative to the
benchmark the funds specify in their prospectus.
The average fund’s gross profit was $1.4 million
per month and $16.6 million per year over the
period we measure. The mean is misleading
because the distribution of AUM in the mutual
fund industry has large skewness. To illustrate, the
top 20 percent of bond funds manage just under
85 percent of total AUM and the top 50 percent
control 97 percent of AUM.
The gross profit for the middle of the distribution of
all funds, or the median, was $103,000 per month
and $1.2 million per year. The median measures
the central tendency of a distribution with
skewness better than the average does. That the
average and the median gross profit are positive
reveals mutual fund managers generated returns
in excess of the market, after accounting for risk
but before fees. Exhibit 19 shows the frequency
distribution of gross profit for roughly 23,400 fund
years from 1978-2018.
Exhibit 18: Total Number of Funds and Average Fund Assets Under Management
Source: Morningstar Direct.
Exhibit 19: Frequency Distribution of Annual Gross Profit, 1978-2018
Source: Morningstar Direct.
0
200
400
600
800
1,000
1,200
1,400
0.0
0.5
1.0
1.5
2.0
2.5
1978
1980
1982
1984
1986
1988
1990
1992
1994
1996
1998
2000
2002
2004
2006
2008
2010
2012
2014
2016
2018
Nu
mb
er
of
Fu
nd
s
Ave
rag
e F
un
d A
UM
(20
18
U.S
. D
olla
rs,
Bill
ion
s)
Average Fund AUM Number of Funds
0
2,000
4,000
6,000
8,000
10,000
12,000
<-8
0
(80)-
(60)
(60)-
(40)
(40)-
(20)
(20)-
0)
0-2
0
20-4
0
40-6
0
60-8
0
80-1
00
100
-120
>1
20
Fre
qu
en
cy
Annual Gross Profit (2018 U.S. Dollars, Millions)
B L U E M O U N T A I N I N V E S T M E N T R E S E A R C H 15
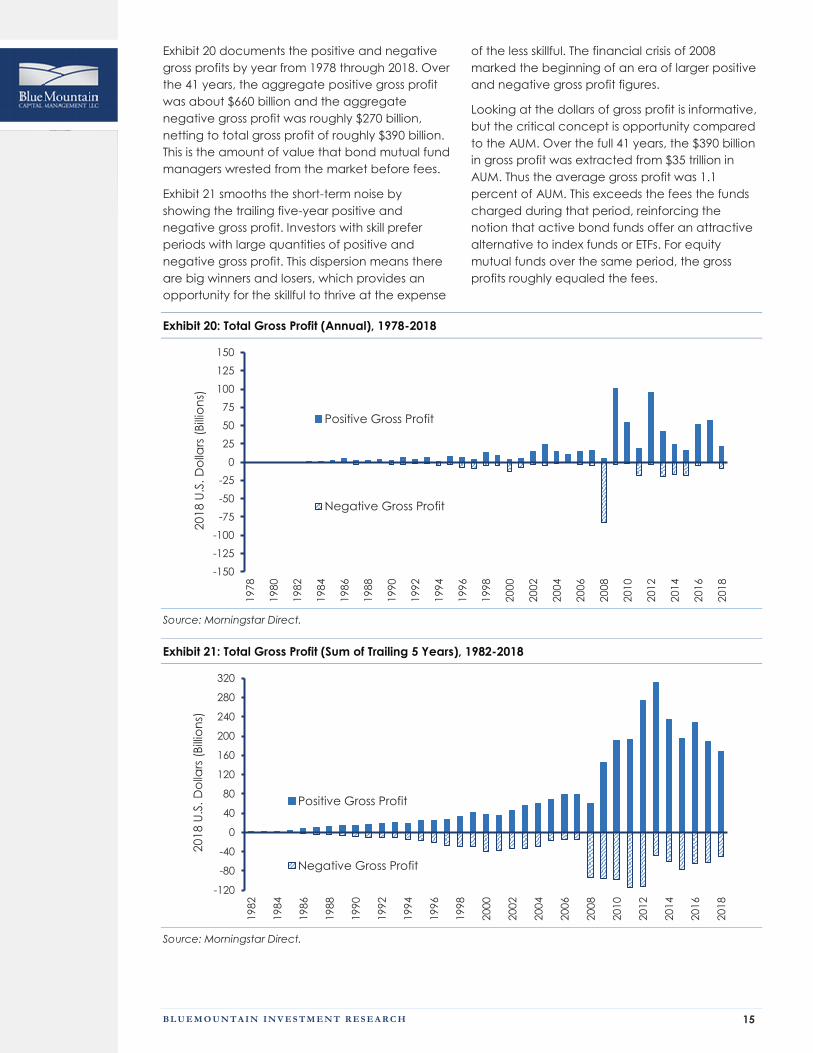
Exhibit 20 documents the positive and negative
gross profits by year from 1978 through 2018. Over
the 41 years, the aggregate positive gross profit
was about $660 billion and the aggregate
negative gross profit was roughly $270 billion,
netting to total gross profit of roughly $390 billion.
This is the amount of value that bond mutual fund
managers wrested from the market before fees.
Exhibit 21 smooths the short-term noise by
showing the trailing five-year positive and
negative gross profit. Investors with skill prefer
periods with large quantities of positive and
negative gross profit. This dispersion means there
are big winners and losers, which provides an
opportunity for the skillful to thrive at the expense
of the less skillful. The financial crisis of 2008
marked the beginning of an era of larger positive
and negative gross profit figures.
Looking at the dollars of gross profit is informative,
but the critical concept is opportunity compared
to the AUM. Over the full 41 years, the $390 billion
in gross profit was extracted from $35 trillion in
AUM. Thus the average gross profit was 1.1
percent of AUM. This exceeds the fees the funds
charged during that period, reinforcing the
notion that active bond funds offer an attractive
alternative to index funds or ETFs. For equity
mutual funds over the same period, the gross
profits roughly equaled the fees.
Exhibit 20: Total Gross Profit (Annual), 1978-2018
Source: Morningstar Direct.
Exhibit 21: Total Gross Profit (Sum of Trailing 5 Years), 1982-2018
Source: Morningstar Direct.
-150
-125
-100
-75
-50
-25
0
25
50
75
100
125
150
1978
1980
1982
1984
1986
1988
1990
1992
1994
1996
1998
2000
2002
2004
2006
2008
2010
2012
2014
2016
2018
20
18
U.S
. D
olla
rs (
Bill
ion
s)
Positive Gross Profit
Negative Gross Profit
-120
-80
-40
0
40
80
120
160
200
240
280
320
1982
1984
1986
1988
1990
1992
1994
1996
1998
2000
2002
2004
2006
2008
2010
2012
2014
2016
2018
20
18
U.S
. D
olla
rs (
Bill
ion
s)
Positive Gross Profit
Negative Gross Profit
B L U E M O U N T A I N I N V E S T M E N T R E S E A R C H 16
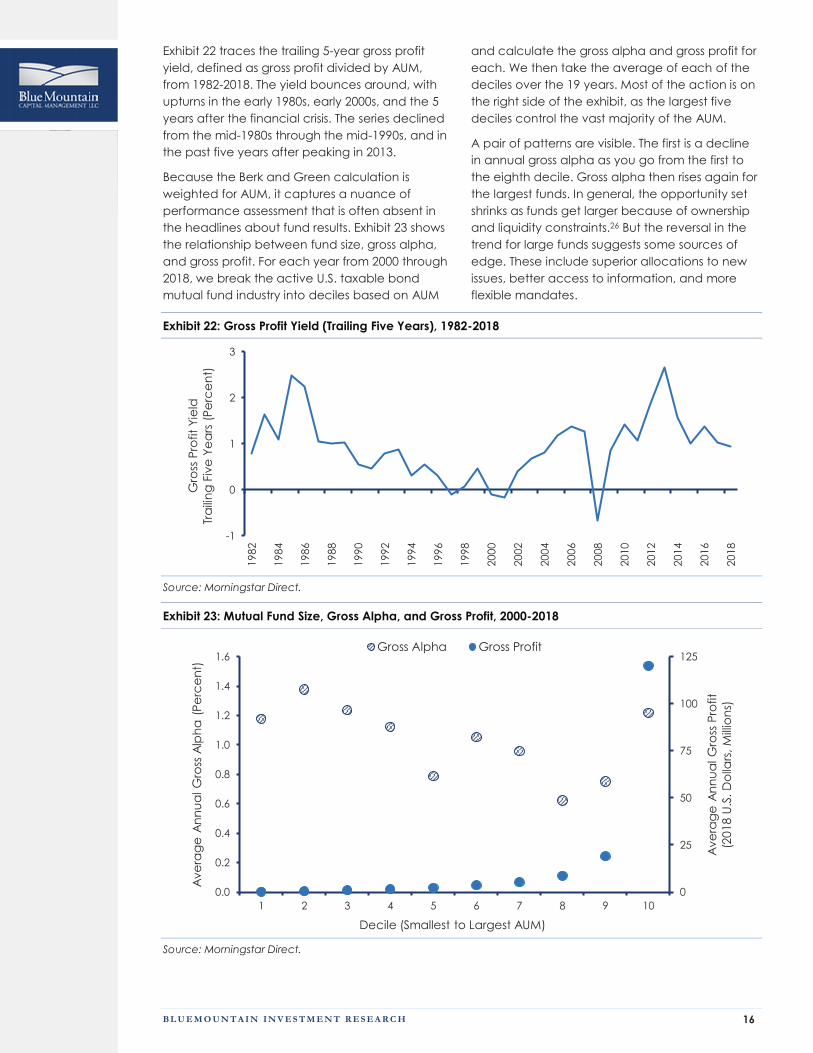
Exhibit 22 traces the trailing 5-year gross profit
yield, defined as gross profit divided by AUM,
from 1982-2018. The yield bounces around, with
upturns in the early 1980s, early 2000s, and the 5
years after the financial crisis. The series declined
from the mid-1980s through the mid-1990s, and in
the past five years after peaking in 2013.
Because the Berk and Green calculation is
weighted for AUM, it captures a nuance of
performance assessment that is often absent in
the headlines about fund results. Exhibit 23 shows
the relationship between fund size, gross alpha,
and gross profit. For each year from 2000 through
2018, we break the active U.S. taxable bond
mutual fund industry into deciles based on AUM
and calculate the gross alpha and gross profit for
each. We then take the average of each of the
deciles over the 19 years. Most of the action is on
the right side of the exhibit, as the largest five
deciles control the vast majority of the AUM.
A pair of patterns are visible. The first is a decline
in annual gross alpha as you go from the first to
the eighth decile. Gross alpha then rises again for
the largest funds. In general, the opportunity set
shrinks as funds get larger because of ownership
and liquidity constraints.26 But the reversal in the
trend for large funds suggests some sources of
edge. These include superior allocations to new
issues, better access to information, and more
flexible mandates.
Exhibit 22: Gross Profit Yield (Trailing Five Years), 1982-2018
Source: Morningstar Direct.
Exhibit 23: Mutual Fund Size, Gross Alpha, and Gross Profit, 2000-2018
Source: Morningstar Direct.
-1
0
1
2
3
1982
1984
1986
1988
1990
1992
1994
1996
1998
2000
2002
2004
2006
2008
2010
2012
2014
2016
2018
Gro
ss P
rofit
Yie
ld
Tra
ilin
g F
ive
Ye
ars
(P
erc
en
t)
0
25
50
75
100
125
0.0
0.2
0.4
0.6
0.8
1.0
1.2
1.4
1.6
1 2 3 4 5 6 7 8 9 10
Ave
rag
e A
nn
ua
l G
ross
Pro
fit
(20
18
U.S
. D
olla
rs,
Mill
ion
s)
Ave
rag
e A
nn
ua
l G
ross
Alp
ha
(P
erc
en
t)
Decile (Smallest to Largest AUM)
Gross Alpha Gross Profit
B L U E M O U N T A I N I N V E S T M E N T R E S E A R C H 17
The second pattern is a rise in annual gross profits
as fund size increases. The jump is particularly
large from the ninth to the tenth decile. The
average annual gross profit for the largest 10
percent of funds is roughly $120 million per year.
The next largest 10 percent, which today have 15
percent of the assets, is approximately $20 million
per year. The smaller funds do well but play for
lesser stakes. The larger funds have more modest
gross alpha but play for higher stakes and hence
extract more alpha from the market. This is
especially true for the largest funds.
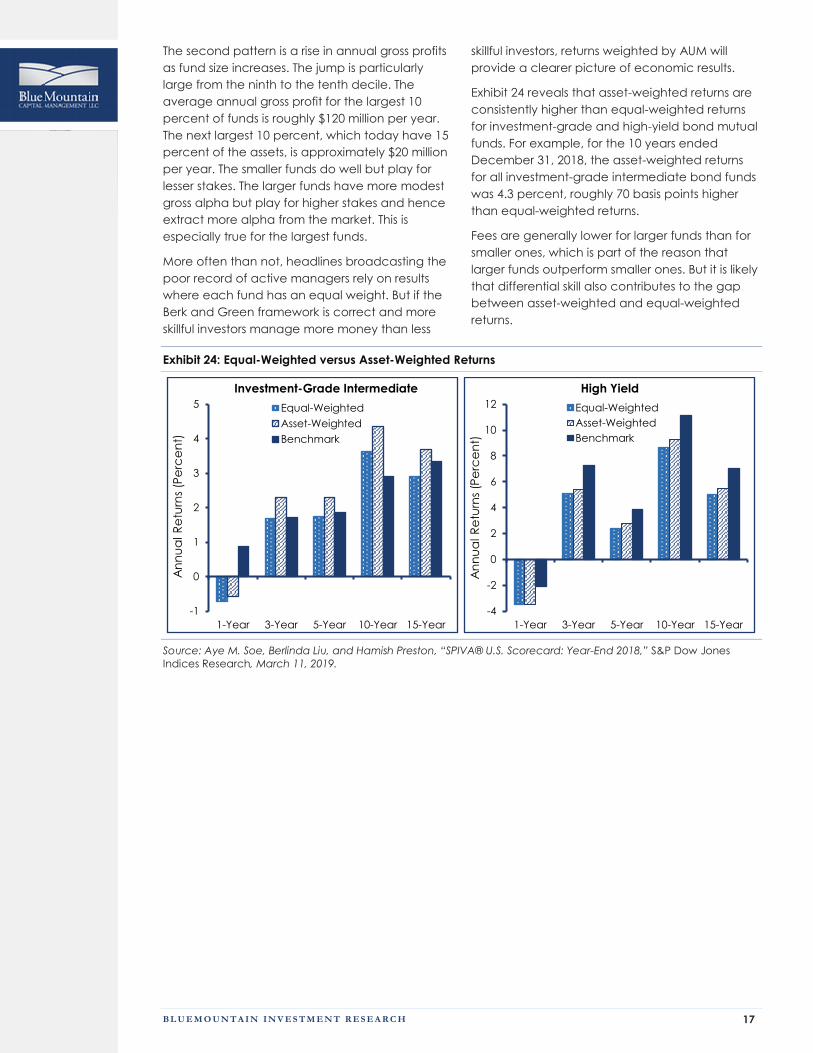
More often than not, headlines broadcasting the
poor record of active managers rely on results
where each fund has an equal weight. But if the
Berk and Green framework is correct and more
skillful investors manage more money than less
skillful investors, returns weighted by AUM will
provide a clearer picture of economic results.
Exhibit 24 reveals that asset-weighted returns are
consistently higher than equal-weighted returns
for investment-grade and high-yield bond mutual
funds. For example, for the 10 years ended
December 31, 2018, the asset-weighted returns
for all investment-grade intermediate bond funds
was 4.3 percent, roughly 70 basis points higher
than equal-weighted returns.
Fees are generally lower for larger funds than for
smaller ones, which is part of the reason that
larger funds outperform smaller ones. But it is likely
that differential skill also contributes to the gap
between asset-weighted and equal-weighted
returns.
Exhibit 24: Equal-Weighted versus Asset-Weighted Returns
Source: Aye M. Soe, Berlinda Liu, and Hamish Preston, “SPIVA® U.S. Scorecard: Year-End 2018,” S&P Dow Jones
Indices Research, March 11, 2019.
-1
0
1
2
3
4
5
1-Year 3-Year 5-Year 10-Year 15-Year
An
nu
al R
etu
rns
(Pe
rce
nt)
Investment-Grade Intermediate
Equal-Weighted
Asset-Weighted
Benchmark
-4
-2
0
2
4
6
8
10
12
1-Year 3-Year 5-Year 10-Year 15-Year
An
nu
al R
etu
rns
(Pe
rce
nt)
High Yield
Equal-Weighted
Asset-Weighted
Benchmark

B L U E M O U N T A I N I N V E S T M E N T R E S E A R C H 18
Conclusion
This report explored the shift from active to
passive investments in the bond market. Active
investors have fared much better in bonds than in
equities, in part because they have
outperformed passive alternatives at a much
higher rate than equity managers have. While a
large part of that outperformance can be
explained by exposure to traditional risk
premiums, the fact remains that fund investors
have realized higher returns owning active funds
than they would have owning passive funds.
While there has been a large move into passive
funds, active managers continue to contribute to
price discovery and liquidity, which are vital. But
active managers charge higher fees than do
passive vehicles, including traditional index funds
and ETFs. Passive managers charge lower fees
because they rely on active managers to make
markets efficient.
Mimicking indexes in bonds is not as
straightforward as it is in stocks. One reason is that
the most popular bond index, the Bloomberg
Barclays US Aggregate Bond Index, includes
more than 10,000 securities versus roughly 500 for
the S&P 500 index. As a result, it is very difficult to
create a passive fund that tracks the index with
negligible tracking error.
One crucial question in investing is how much
opportunity there is for active managers to
capture alpha. We describe a framework, based
on the work of professors Jonathan Berk and
Richard Green, to gauge the value that active
managers generate. We find that over the past
four decades, cumulative gross profit and fees
are roughly equal in equities but that gross profit
exceeds fees in bonds. This suggests investors in
bond funds have extracted more value from the
market than equity fund investors have.
Gross profit allows us to get away from the
misleading results of equal-weighted mutual fund
returns and provides figures for both the cost and
opportunity for active investment management.
B L U E M O U N T A I N I N V E S T M E N T R E S E A R C H 19
Appendix: Notes on Methodology
Active Share. Active share reflects how much a
fund differs from its index. Active share is zero
percent if a fund exactly matches the index and
100 percent if it is completely different. This
assumes no leverage or short sales. We calculate
active share as 100 percent less the sum of the
overlapping weights between the holdings of the
fund and the index.
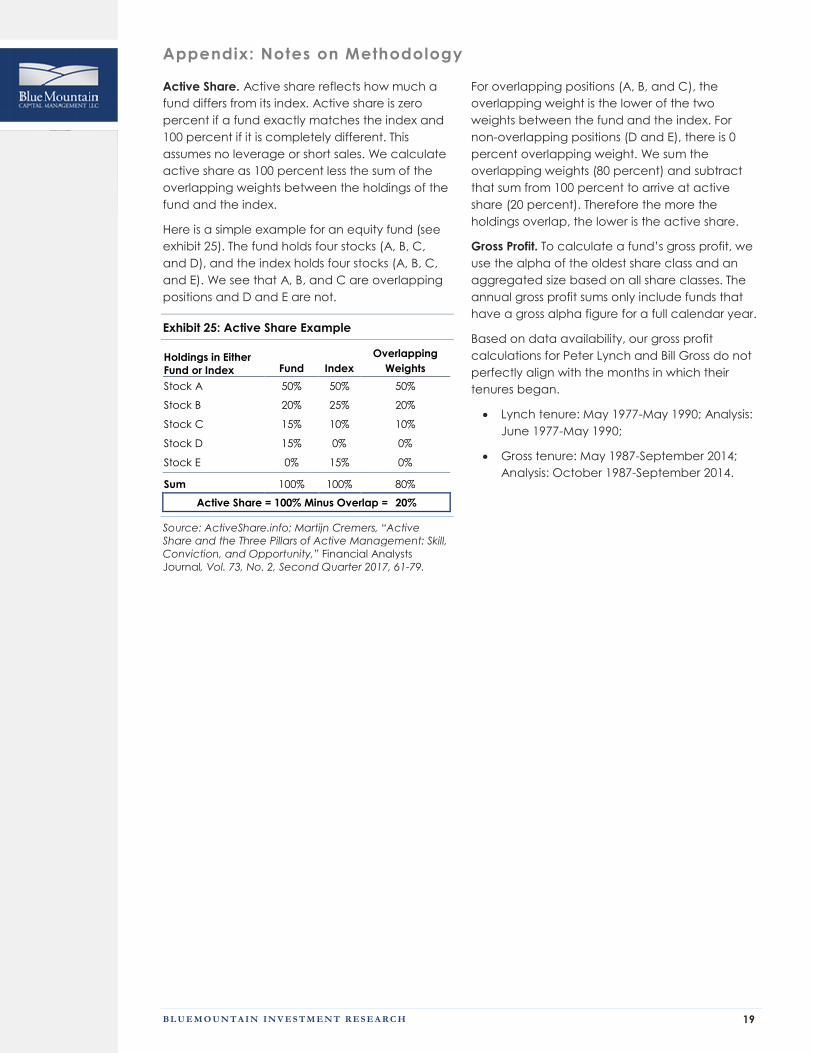
Here is a simple example for an equity fund (see
exhibit 25). The fund holds four stocks (A, B, C,
and D), and the index holds four stocks (A, B, C,
and E). We see that A, B, and C are overlapping
positions and D and E are not.
Exhibit 25: Active Share Example
Holdings in Either
Fund or Index Fund Index
Overlapping
Weights
Stock A 50% 50% 50%
Stock B 20% 25% 20%
Stock C 15% 10% 10%
Stock D 15% 0% 0%
Stock E 0% 15% 0%
Sum 100% 100% 80%
Active Share = 100% Minus Overlap = 20%
Source: ActiveShare.info; Martijn Cremers, “Active
Share and the Three Pillars of Active Management: Skill,
Conviction, and Opportunity,” Financial Analysts
Journal, Vol. 73, No. 2, Second Quarter 2017, 61-79.
For overlapping positions (A, B, and C), the
overlapping weight is the lower of the two
weights between the fund and the index. For
non-overlapping positions (D and E), there is 0
percent overlapping weight. We sum the
overlapping weights (80 percent) and subtract
that sum from 100 percent to arrive at active
share (20 percent). Therefore the more the
holdings overlap, the lower is the active share.
Gross Profit. To calculate a fund’s gross profit, we
use the alpha of the oldest share class and an
aggregated size based on all share classes. The
annual gross profit sums only include funds that
have a gross alpha figure for a full calendar year.
Based on data availability, our gross profit
calculations for Peter Lynch and Bill Gross do not
perfectly align with the months in which their
tenures began.
Lynch tenure: May 1977-May 1990; Analysis:
June 1977-May 1990;
Gross tenure: May 1987-September 2014;
Analysis: October 1987-September 2014.

B L U E M O U N T A I N I N V E S T M E N T R E S E A R C H 20
Endnotes
1 An exchange-traded fund (ETF) is an investment fund that trades on an exchange just as a stock
does. 2 “The Illusion of Active Fixed Income Alpha,” AQR Alternative Thinking, Fourth Quarter, 2018; Jordan
Brooks, Diogo Palhares, and Scott Richardson, “Style Investing in Fixed Income,” Journal of Portfolio
Management, Vol. 44, No. 4, Special Issue 2018, 127-139; Gjergji Cici, Scott Gibson, Rabih Moussawi,
“Explaining and Benchmarking Corporate Bond Returns,” SSRN Working Paper, June 2017; Paul M.
Bosse, Brian R. Wimmer, and Christopher B. Philips, “Active bond-fund excess returns: Is it alpha . . . or
beta? The Vanguard Group, September 2013; and Richard Dewey and Aaron Brown, “Bill Gross’ Alpha:
The King Versus the Oracle,” SSRN Working Paper, March 2, 2019. 3 Maureen O’Hara, “Presidential Address: Liquidity and Price Discovery,” Journal of Finance, Vol. 58,
No. 4, August 2003, 1335-1354 and Ekkehart Boehmer and Eric K. Kelley, “Institutional Investors and the
Informational Efficiency of Prices,” Review of Financial Studies, Vol. 22, No. 9, September 2009, 3563-
3594. 4 Charles Stein, “Shift From Active to Passive Approaches Tipping Point in 2019,” Bloomberg, December
31, 2018. 5 Antti Petajisto, “Inefficiencies in the Pricing of Exchange-Traded Funds, Financial Analysts Journal, First
Quarter 2017, 24-54. 6 William G. Droms and David A. Walker, “Performance Persistence of Fixed Income Mutual Funds,”
Journal of Economics and Finance, Vol. 30, No. 9, Fall 2006, 347-355 and Aye M. Soe and Ryan Poirier,
“Does Past Performance Matter? The Persistence Scorecard,” S&P Dow Jones Indices Research,
January 2018. 7 Michael J. Mauboussin, The Success Equation: Untangling Skill and Luck in Business, Sports, and
Investing (Boston, MA: Harvard Business Review Press, 2012), 53-58. 8 Michael J. Mauboussin, “Who Is On the Other Side? You Need Good BAIT to Land a Winner,”
BlueMountain Investment Research, February 12, 2019. 9 Jens Dick-Nielsen and Marco Rossi, “The Cost of Immediacy for Corporate Bonds,” Review of Financial
Studies, Vol. 32, No. 1, January 2019, 1-41 and Lasse Heje Pedersen, “Sharpening the Arithmetic of
Active Management,” Financial Analysts Journal, Vol. 74, No. 1, First Quarter 2018, 21-36. 10 Adriana Z. Robertson and Matthew Spiegel, “Better Bond Indices and Liquidity Gaming the Rest,”
SSRN Working Paper, November 15, 2017. 11 K. J. Martijn Cremers and Antti Petajisto, “How Active Is Your Fund Manager? A New Measure That
Predicts Performance,” Review of Financial Studies, Vol. 22, No. 9, September 2009, 3329-3365; Antti
Petajisto, “Active Share and Mutual Fund Performance,” Financial Analysts Journal, Vol. 69, No. 4,
July/August 2013, 73-93; and Martijn Cremers, “Active Share and the Three Pillars of Active
Management: Skill, Conviction, and Opportunity,” Financial Analysts Journal, Vol. 73, No. 2, Second
Quarter 2017, 61-79. 12 Robert S. Goldberg and Ehud I. Ronn, “Quantifying and Explaining the New-Issue Premium in the
Post-Glass-Steagall Corporate Bond Market,” Journal of Fixed Income, Summer 2013, 43-55. 13 Nicolae Gârleanu and Lasse Heje Pedersen, “Efficiently Inefficient Markets for Assets and Asset
Management,” Journal of Finance, Vol. 73, No. 4, August 2018, 1663-1712. 14 Alexander Dyck, Karl V. Lins, and Lukasz Pomorski, “Does Active Management Pay? New
International Evidence,” Review of Asset Pricing Studies, Vol. 3, No. 2, December 2013, 200-228. 15 Francis E. Warnock and Veronica Cacdac Warnock, “International Capital Flows and U.S. Interest
Rates,” NBER Working Paper 12560, October 2006. 16 Andrew Ellul, Chotibhak Jotikasthira, and Christian T. Lundblad, “Regulatory Pressure and Fire Sales in
the Corporate Bond Market,” Journal of Financial Economics, Vol. 101, No. 3, September 2011, 596-620;
Vikram Nanda, Wei Wu, and Xing Zhou, “Investment Commonality across Insurance Companies: Fire
Sale Risk and Corporate Yield Spreads,” Finance and Economics Discussion Series 2017-069,
Washington: Board of Governors of the Federal Reserve System, June 2017; Matthew Spiegel and Laura
Starks, “Institutional Rigidities and Bond Returns around Rating Changes,” Working Paper, November 19,
2016; and Giovanni Cespa and Thierry Foucault, “Illiquidity Contagion and Liquidity Crashes,” Review
of Financial Studies, Vol. 27, No. 6, June 2014, 1615-1660. 17 Eric Balchunas and Athanasios Psarofagis, “Bond Managers Sidestep Active Outflows,” Bloomberg
Intelligence, January 18, 2018. 18 Yong Chen and Nan Qin, “The Behavior of Investor Flows in Corporate Bond Mutual Funds,”
Management Science, Vol. 63, No. 5, May 2017, 1271-1656 and Jimmy Shek, Ilhyock Shim, and Hyun
Song Shin, “Investor Redemptions and Fund Manager Sales of Emerging Market Bonds: How Are They
Related?” Review of Finance, Vol. 22, No. 1, February 2018, 207-241.

B L U E M O U N T A I N I N V E S T M E N T R E S E A R C H 21
19Joshua Coval and Erik Stafford, “Asset Fire Sales (and Purchases) in Equity Markets,” Journal of
Financial Economics, Vol. 86, No. 2, November 2007, 479-512. 20 Patricia Oey, “Fund Fee Study,” Morningstar Research Services, April 26, 2018 and Greggory Warren,
“Asset Manager Observer,” Morningstar, March 2019. 21 Jonathan B. Berk and Richard C. Green, “Mutual Fund Flows and Performance in Rational Markets,”
Journal of Political Economy, Vol. 112, No. 6, December 2004, 1269-1295. 22 Tim Koller, Marc Goedhart, and David Wessels, Valuation: Measuring and Managing the Value of
Companies, Sixth Edition (Hoboken, NJ: John Wiley & Sons, 2015), 28-29. 23 Jonathan B. Berk and Jules H. van Binsbergen, “Measuring Skill in the Mutual Fund Industry,” Journal
of Financial Economics, Vol. 118, No. 1, October 2015, 1-20. 24 Jonathan B. Berk, “Five Myths of Active Portfolio Management,” Journal of Portfolio Management,
Spring 2005, 27-31 and Jonathan B. Berk and Jules H. van Binsbergen, “Active Managers are Skilled: On
Average, They Add More Than $3 Million Per Year,” Journal of Portfolio Management, Vol. 42, No. 2,
Winter 2016, 131-139. Also Jonathan B. Berk and Jules H. van Binsbergen, “Mutual Funds in Equilibrium,”
Annual Review of Financial Economics, Vol. 9, No. 1, 2017, 147-167. 25 Jonathan B. Berk and Jules H. van Binsbergen, “How Do Investors Compute the Discount Rate? They
Use the CAPM,” Financial Analysts Journal, Vol. 73, No. 2, Second Quarter 2017, 25-32. 26 Ĺuboš Pástor, Robert F. Stambaugh, Lucian A. Taylor, “Scale and Skill in Active Management,”
Journal of Financial Economics, Vol. 116, No. 1, April 2015, 23-45.

B L U E M O U N T A I N I N V E S T M E N T R E S E A R C H 22
Disclaimers:
This report is provided for informational purposes only and is intended solely for the person to whom it is delivered by BlueMountain
Capital Management, LLC (“BlueMountain”). This report is confidential and may not be reproduced in its entirety or in part, or
redistributed to any party in any form, without the prior written consent of BlueMountain. This report was prepared in good faith by
BlueMountain for your specific use and contains a general market update and information concerning looking for easy games in
bonds.
This report does not constitute an offer to sell or the solicitation of an offer to purchase any securities of any funds or accounts
managed by BlueMountain (the “Funds”). Any such offer or solicitation may be made only by means of the delivery of a confidential
offering memorandum, which will contain material information not included herein and shall supersede, amend and supplement this
report in its entirety. Information contained in this report is accurate only as of its date, regardless of the time of delivery or of any
investment, and does not purport to be complete, nor does BlueMountain undertake any duty to update the information set forth
herein.
This report should not be used as the sole basis for making a decision as to whether or not to invest in the Funds or any other fund or
account managed by BlueMountain. In making an investment decision, you must rely on your own examination of the Funds and
the terms of the offering. You should not construe the contents of these materials as legal, tax, investment or other advice, or a
recommendation to purchase or sell any particular security.
The returns of several market indices are provided in this report as representative of general market conditions and that does not
mean that there necessarily will be a correlation between the returns of any of the Funds, on the one hand, and any of these
indices, on the other hand.
The information included in this report is based upon information reasonably available to BlueMountain as of the date noted herein.
Furthermore, the information included in this report has been obtained from sources that BlueMountain believes to be reliable;
however, these sources cannot be guaranteed as to their accuracy or completeness. No representation, warranty or undertaking,
express or implied, is given as to the accuracy or completeness of the information contained herein, by BlueMountain, its members,
partners or employees, and no liability is accepted by such persons for the accuracy or completeness of any such information.
This report contains certain “forward-looking statements,” which may be identified by the use of such words as “believe,” “expect,”
“anticipate,” “should,” “planned,” “estimated,” “potential,” “outlook,” “forecast,” “plan” and other similar terms. Examples of
forward-looking statements include, without limitation, estimates with respect to financial condition, results of operations, and
success or lack of success of BlueMountain’s investment strategy or the markets generally. All are subject to various factors,
including, without limitation, general and local economic conditions, changing levels of competition within certain industries and
markets, changes in interest rates, changes in legislation or regulation, and other economic, competitive, governmental, regulatory
and technological factors affecting BlueMountain’s operations, each Fund’s operations, and the operations of any portfolio
companies of a Fund, any or all of which could cause actual results to differ materially from projected results.