Embed Size (px)
Citation preview

Wages and Related Benefits
PART I: 82 LABOR MARKETS
1962-63
• Occupational Earnings
0 Supplementary Practices
# Rate Structure Characteristics
Bulletin No. 1345-83
January 1964
UNITED STATES DEPARTMENT OF LABOR BUREAU OF LABOR STATISTICSW. W illard Wirtz, Secretary Ewan Clague, Commitiioner
For sale by the Superintendent of Documents, U.S. Government Printing Office, Washington, D.C., 20402 - Price 60 centsDigitized for FRASER http://fraser.stlouisfed.org/ Federal Reserve Bank of St. Louis

Digitized for FRASER http://fraser.stlouisfed.org/ Federal Reserve Bank of St. Louis

Preface
The Bureau of Labor Statistics program of annual occupational wage surveys in 82 m etropolitan areas p rovides data on occupational earnings, and establishment practices and supplementary wage provisions. It yields detailed data by selected industry divisions for m etropolitan area labor m arkets, four regions, and the United States. A m ajor consideration in the program is the need for greater insight into (a) the movement of wages by o c cupational category and skill level, and (b) the structure and level of wages among labor markets and industry divisions.
A prelim inary report and an individual area bulletin present survey results for each labor market studied. A fter com pletion of all of the individual area bulletins for a round of surveys, a two part summary bulletin is issued. This first part brings data for each of the labor markets studied into one bulletin. The second part w ill present inform ation projected from individual labor market data to relate to econom ic regions and the United States.
The present consolidated bulletin (Part I) com piles the results o f individual area surveys made during the period July 1962 through June 1963. A list of the bulletins for the areas surveyed appears on the last page.
ContentsPage
Industrial com position of the 82 areas______________________________ 1Comparability of area data----------------------------------------------------------------- 2
Tables:
1. Manufacturing em ploym ent________________________________ 42. Nonmanufacturing employment —_________________________________ 53. Percentage changes—all industries and
manufacturing, 1962—6 3 ------------ 74. Percentage increases—all industries and
manufacturing, 1953—6 3 ________________________________________ 8
A: Occupational earnings:Average weekly earnings for selected office occupations—
A - 1. A ll industries--------------------------------------------------------------- 9A -la . A ll industries—m en and women com bined—__________ 13A -2. Manufacturing------ -------------------------------------------------------- 15A -2a. Manufacturing—men and women com bined____________ 19A -3. Nonmanufacturing______ -_______________________________ 21A -3a. Nonmanufacturing—men and women com bined________ 25
A -5 . W holesale tra d e________________________________ 29
A -8 . S e rv ice s_______________________________ -_______________ 32
A verage hourly earnings for selected plant occupations—A -9. A ll in du stries____________________________ _____________ 33
A - 12. Public utilities-_______ -__________________________-_____ 45A - 13. W holesale tra d e_____________ _______ ______ _____ ______ 47
A - 15. F inance_______________ ____________________ .___________ 48A - 16. Ser v ic e s ------------------- ------------- ------- ------------------— ____ _ 4 8
Hi
Digitized for FRASER http://fraser.stlouisfed.org/ Federal Reserve Bank of St. Louis

Contents
Table s— Continued
Page
Establishment practices and supplementary wage provisions:
Minimum entrance salaries for women office w orkers—
B - 1. A ll industries____________B -2. M anufacturing —------ -—
Scheduled weekly hours—B -3. A ll industries---------B -4. Manufacturing-------B -5. Public u tilities____B -6. Wholesale trade----B -7. Retail tra d e -----------B -8. Finance------------------B -9. S erv ices---- ---- -------
Shift differentials, manufacturing— B-10. P rovisions- B - l l . P ra c t ic e s -----
4950
5658
Paid holidays—B -12. A ll indus tr ie s - B-12a. Paid holiday time—all industries. B - 13. Manufacturing B-14. Public utilities .B -15. W holesale trade- B -16. Retail tra d e .B -17. Finance- B -18. S ervices-
6062646668697071
ContinuedPage
Tables— Continued
Paid vacations—B - 19. A ll industries--------------------------------------------------------- 72B-20. Manufacturing-------------------------------------------------------- 74B-21. Public u tilities ------------------------------------------------------- 76B-22. Wholesale trade------------------------------------------------------ 78B-23. Retail trade------------------------------------------------------------ 79B-24. Finance------------------------------------------------------------------- 80
Health, insurance, and pension plans—B-26. A ll industries---------------- 82B - 2 7. Manuf actur ing —------- ----------------------------------------- — — 8 4B-28. Public u tilities----- ------------------------------------------- 86B-29. Wholesale trade____________________________________ 88B-30. Retail tra d e------------- —--------------------------------------------- 89
Rate structure ch aracteristics—B-33. All industries---------------------------------------------- -------- — 92
Appendixes:A. Scope and method of survey— ------- ----------------------- —- 101B. Occupational descrip tion s------------------------------------------------ 107
W
Digitized for FRASER http://fraser.stlouisfed.org/ Federal Reserve Bank of St. Louis

Wages and Related Benefits—
Part I: 82 Labor Markets, 1962-631
Introduction
This annual report sum m arizes in tabular form the results of surveys o f occupational earnings and related benefits conducted July 1962 through June 1963.2 It is the first part of a two part sum m ary bulletin and incorporates data for each of the 82 areas surveyed. Eighty of the 82 a re a s3 com prise an area sample from the 212 Standard M etropolitan Statistical Areas in the United States as established by the Bureau of the Budget through 1961. In the second part of the sum m ary bulletin, data will be presented on occupational earnings, wage trends, intercity d ifferences, and related benefits for all m etropolitan areas com bined.
Occupations w ere studied on a communitywide basis in each o f the 82 areas. The area surveys provide earnings data for the follow ing types of occupations: (a) Office clerica l, (b) professionaland technical, (c) maintenance and powerplant, and (d) custodial and m aterial m ovem ent. Data were also collected and summarized on shift operations and differentials, minimum entrance salaries for women o ffice w orkers, weekly work schedules, and supplementary wage benefits, such as paid holidays and paid vacations. These data, presented in detail in the individual area bulletins, are sum m arized in this bulletin. Wage data are presented for each of the 82 areas and supplementary wage benefits for the 39 areas in which the data w ere co llected . 4
Each o f the detailed area bulletins presents areawide in form ation com bining data for six m ajor industry groupings. Separate
* Prepared by Donald J. Blackmore and Kenneth J. Hoffmann in the Bureau's Division of Occupational Pay, under the general direction of L. R. Linsenmayer, Assistant Commissioner for Wages and Industrial Relations. Area studies were supervised by the Bureau's Assistant Regional Directors for Wages and Industrial Relations.
2 See list o f area bulletins on the last page. A directory o f area reports issued previously, A Directory o f Community Wage Surveys. 1948—June 1963. is available on request from the U. S. Department o f Labor, Bureau o f Labor Statistics, Washington, D. C ., 20210, or from any o f its six regional offices.
3 The program also covers two nonmetropolitan areas (Boise, Idaho, and Burlington, V t.). Data for these two areas are included in this summary bulletin, but will not be included in the second summary bulletin.
4 Beginning with surveys conducted in the winter of 1956-57, data on establishment practices and supplementary wage provisions are collected only biennially in some areas. See appendix A , p. 101.
data fo r each industry group are provided where feasible, depending largely on the relative size and im portance of the industry group within a given area. Thus, the sampling techniques provided for p res entation of separate data for manufacturing in each o f the 82 areas; public utilities in 80; retail trade in 22; finance and wholesale trade in 16; and serv ices in 8. The scope and method o f survey are presented in appendix A.
The establishments within the scope of the surveys in the 82 areas provided employment to about 13l/2 m illion w orkers. The 82 areas covered by this report had a combined population of about 85 m illion in I960— about half of the Nation’ s total. Forty-three States and the D istrict o f Columbia were represented, permitting some examination of intraregional as well as interregional variation in pay levels and associated practices.
Industrial Com position of the 82 Areas
Manufacturing. Within the scope o f employment surveyed in the 82 areas, the proportion of em ployees in manufacturing industries ranged from 14 percent in Washington, D.C., to 88 percent in Lawrence—Haverhill. In 50 o f the 82 areas, manufacturing employment was greater than in all nonmanufacturing industry groups combined. (See table 1, page 4 .) A large proportion o f such areas was located in the Northeast and North Central regions. Manufacturing employment exceeded nonmanufacturing in only 10 of 26 southern areas surveyed and 3 o f 12 western areas.
At least 80 percent o f the m easured employment in Allentown— Bethlehem—Easton, Canton, Lawrence—Haverhill, Muskegon—Muskegon Heights, Rockford, Waterbury, W aterloo, and York was in manufacturing establishments. In 11 other areas, the proportion ranged between 70 and 80 percent. Less than a third of the employment was in manufacturing establishments in Albuquerque, B oise, Jacksonville, Lubbock, Miami, New Orleans, Oklahoma City, San Antonio, and Washington, D. C.
1
Digitized for FRASER http://fraser.stlouisfed.org/ Federal Reserve Bank of St. Louis

2
There were also marked d ifferences among areas in the relative employment in various industry groups within the manufacturing division. For example, in 15 areas at least half o f the manufacturing employment was accounted for by one m ajor group as fo llow s: Transportation equipment— Fort Worth, Norfolk—Portsmouthand Newport News—Hampton, Seattle, and Wichita; food— Lubbock, Omaha, and Sioux F alls ; prim ary m etals— Birmingham and Pittsburgh; textiles— G reenville ; chem icals—-Charleston, W. Va. ; petroleum r e fining— Beaumont—Port Arthur; rubber and p lastics— Akron; m achinery (except e lectrica l)— Davenport—Rock Island—M oline; and e lectrica l m a chinery— Burlington. Of these 15 areas, 9 had at least ope secondary industry with 10 percent or m ore of manufacturing employment. In contrast, manufacturing activity in 17 of the 82 areas was diversified to the point that no single industry group accounted for as much as 20 percent of manufacturing employment.
Each o f the 21 tw o-digit industry groupings within the manufacturing division accounted for 10 percent or m ore of the m anufacturing employment in at least one area. In the Northeast and South, 17 of the 21 tw o-digit industry groupings were so represented; in the North Central, 12 of the 21 industry groupings were represented; and, in the West, only 11 of the 21 categories showed sim ilar concentrations. The industry groups which accounted for 10 percent or m ore of the manufacturing employment in the m ost areas within each region were as fo llow s: Northeast (20 areas)— electrica l machinery, 9 areas;prim ary m etals, 6 areas; and machinery (except e lectrica l), 5 areas; South (26 areas)— food, 20 areas; transportation equipment, 9 areas; and e lectrica l m achinery and chem icals, 7 areas; North Central (24 areas)—m achinery (other than electrica l), 18 areas; food, 14 areas; and transportation equipment, 12 areas; and West (12 areas)— food, 8 areas; transportation equipment, 7 areas; and lumber, 3 areas.
The food group accounted for 10 percent or m ore of the manufacturing employment in 45 o f the 82 areas. A sim ilar degree o f employment concentration was noted in transportation equipment in 32 areas; in m achinery (other than electrica l) in 27 areas; in e lectrica l m achinery in 26 areas; in prim ary metals in 16 areas; in fabricated m etal products in 15 areas; and in apparel manufacture in 10 areas. Other m ajor groups accounted for 10 percent or m ore of the manufacturing employment in from 1 to 8 areas.
As was expected, concentrations of certain m ajor groups were lim ited to one or m ore regions. For example, the tobacco group a c counted for 10 percent or m ore o f the manufacturing employment in two southern areas (L ouisville and Richmond). Similar concentrations in textiles and apparel were lim ited to areas in the Northeast and South.
Nonmanufacturing. Within th e nonmanufacturing industry groups studied, the proportion o f w orkers employed in public utilities ranged from less than a fifth o f total nonmanufacturing employm ent in San Antonio to alm ost half in Charleston, W. Va. (See table 2, page 5 .) In som e areas, e lectric , gas, or transit establishments are m unicipally operated and are excluded by definitions from the scope o f the surveys. (See table in appendix A .) The reta il trade group showed a sim ilar range employing a fifth or less of the w orkers in Los Angeles—Long Beach, Newark and Jersey City, New Haven, New York, and San Francisco, but employing over half of the nonmanufacturing w orkers in Waterloo. Either public utilities or retail trade accounted for the largest nonmanufacturing employm ent in 79 of the 82 areas studied.
A combination of wholesale trade and retail trade presented an im age of interarea stability. These com bined trades accounted for between 40 and 50 percent of nonmanufacturing em ploym ent in m ost areas and in no area accounted fo r less than one-fourth nor m ore than three-fifths of the nonmanufacturing employm ent. The finance and services groups displayed far less interarea stability. P rop ortionate values in the finance group varied from 2 percent o f nonmanufacturing workers in Green Bay to over 25 percent in Des M oines, W orcester, and New York. The proportion o f serv ices ranged from 3 percent in Burlington to 41 percent in Albuquerque.
The relative concentration o f nonmanufacturing industries within geographic areas also should be noted on the basis o f the area 's ratio o f nonmanufacturing employm ent to a ll-industry employm ent. For example, a com parison o f em ploym ent in the banking industry in New York (9 percent of nonmanufacturing) to that in Burlington (17 percent) would be entirely different based on all industries. Since Burlington's nonmanufacturing employm ent is less than a third o f its total, while that of New York is alm ost tw o-thirds o f the total em ployment (nonmanufacturing plus manufacturing), the im portance o f banking in relation to total employment would be 6 percent in New Y ork and 5 percent in Burlington.
Comparability of Area Data
Areawide (all industries) estim ates o f wage levels and related practices are affected to some extent by the industrial com position o f the area. As noted above, the proportion o f employm ent accounted, for, both by broad industry divisions and their subgroups, varied considerably among areas. The estim ates o f wage levels, therefore, must be viewed in term s of these interarea d ifferen ces. In a few areas, additional limitations on a rea -to -a rea com parisons arose from incom plete coverage of certain industries; these are indicated in the footnotes to the table in appendix A on page 106.
Digitized for FRASER http://fraser.stlouisfed.org/ Federal Reserve Bank of St. Louis

Changes in Geographic Coverage
The geographic coverage of the Chicago, New York, and Philadelphia Occupational Wage Surveys has been expanded this year by the Bureau to include for each of these cities the entire Standard Metropolitan Statistical Area. Limits of Standard Metropolitan Statistical Areas (SMSA) are established by the Bureau of the Budget to enable all Federal statistical agencies to use the same boundaries in publishing data. Since the expansion of coverage in these three areas, all 80 metropolitan areas studied conform to the SMSA definitions.
Coverage of the Chicago survey has been expanded from Cook County to Cook, DuPage, Kane, Lake, McHenry, and Will Counties. The New York survey was expanded from the five boroughs of Bronx, Kings, New York, Queens, and Richmond to include also Nassau, Rockland, Suffolk, and Westchester Counties. The Philadelphia SMSA consists of the previously studied Delaware and Philadelphia Counties in Pennsylvania and Camden County in New Jersey, plus the added counties of Bucks, Chester, and Montgomery in Pennsylvania and Burlington and Gloucester in New Jersey.
The individual area bulletins present earnings information for both the old and expanded areas. Wage and supplementary practices information in this bulletin relate to the expanded areas.
The salary and earnings trends are based on the m ore limited geographic coverage. Next year, the trends w ill reflect wage changes for each full SMSA, and to assure continuity, these data w ill be linked to the percentage changes shown in tables 3 and 4.
Further information regarding the industrial com position of the expanded areas is p re sented in the respective area bulletins.
A change in areas surveyed was also effected this year. Annual surveys of the Wilmington, D el.-N .J., area were discontinued, and the San Diego, Calif., area was added to the Bureau's program.
Digitized for FRASER http://fraser.stlouisfed.org/ Federal Reserve Bank of St. Louis

4
Table 1. Manufacturing Employment
(Proportion of workers within scope of survey 1 employed in manufacturing industries and the major groups within manufacturing in each of82 labor markets surveyed, July 1962 through June 1963)
Labor market
Manuf ac - turing
employment as percent
of total
M ajor industry groups 2 by percent o f all manufacturing employment Manufac
turingemployment
as percent of total
M ajor industry groups 2 by percent o f a ll manufacturing employment
50 percent
and over
40and under
50percent
30and under
40percent
20and under
30percent
10and under
20percent
Labor market 50percent
andover
40and under
50percent
-------3(5------and under
40percent
20and under
30percent
10and under
20percent
Northeast South— Continued
Albany—Schenectady—T roy --------- 59 _ _ 35 _ San Antonio--------- --------------------- 1 30 - - 20 - 23Allentown-Bethlehem—Easton___ 80 - - - 33 23 Savannah__ _ __ 60 - 26 - - 20 ,28 ,37Boston------- --------- _ 47 - - - 36 37 Washington __ ___ 14 - - 27 20 36B uffalo________ _ 66 - - - 33 37Burlington.___— . ____ 69 36 - - - - North CentralLawrence—Haverhill _ __ 88 - - - 31,36 19
74 - 31 22 36 Alcron . . . . ....... . ......... ^ 73 30 . _ _ 3460 36 20 ,28 ,35 Canton 80 _ 33 35 3463 _ _ 19 33, 37 Chicago •_ 51 _ _ 20 ,35 ,36
New York________________________ 35 _ . . _ 2 0 ,23 ,27 ,36 63 - - - - 20, 35,37Pate r s on—Clifton—Pas s a i c ______ 71 - . - _ 37, 38 Cleveland __ _ _ 60 - - - - 3 3 ,3 4 ,3 5 ,3 6 ,3 7Philadelphia_______ _ 60 36 Columhus 52 _ . _ _ 2 0 ,3 4 ,3 5 ,3 6 ,3 7Pittsburgh _ 63 33 - - - 36 Davenport—Rock Island—M oline.. 71 35 - - - 20,33Portland 46 26 20 34 Dayton 77 35, 36Providence—PawturWpt 74 _ 22, 39 Des Mrtines __ . _ .... 40 _ _ _ 35 20,27Scranton ............. . 69 . _ 23
30,35 ,3663 - 37 - 35
Trenton 71 - - - 34 Green Bay----------------------------------- 60 - 26 - 20 35W aterbury____ 85 - - - 34 30,33 ,38 Indianapolis_____________________ 57 - - - 37 2 0 ,35 ,36W orcester 75 35 32, 33 Kansas C ity ........ .. 46 19,20,37York __ _ . _ _ 80 _ _ _ 23, 35 Milwaukee _ 65 _ _ 35 20,36
Minneapolis—St. Paul___________ 45 - - - 2 0 ,2 6 ,3 5 ,3 8South Muskegon—Muskegon H eights---- 86 - - - 33,35 37
Omaha______. _______________ 41 20 - - - 36Atlanta 40 _ _ _ 37 20 Rockford _ 82 . _ _ 34,35 37,38B altim ore______________________ 59 _ _ _ 33 20,37 ISt. L ou is________________________ 57 - - - 20, 33 ,36 ,37Reaumont—Port Arthur 69 29 28 -IISioux Falls _ __ 51 20 _Birmingham . . . _ 53 33 34 South Bend 76 37 _ _ 30, 35Charleston, (W Va _ )___ 59 28 32 Toledo 61 _ _ 37 32, 35Charlotte __ __ _ 43 _ _ 22 20 W aterloo_________________________ 85 - 20,35 -Chattanooga __ __ . . . . 70 - - - 22 28,34 Wichita- ----------------- ----------------- 68 37 - - - -Dallas __ __ ___ ____ _ __ __ 40 - - - 36 20,23, 37Fort Worth _____ - _ 52 37 - - - 20G reenville__ — _ 18 22 - - 23 - WestHouston . . . . . 40 _ _ _ _ 2 0 ,2 8 ,2 9 ,3 4 ,3 5Jackson . 37 _ _ _ 20 25,36 Albuquerque____________________ 21 - - 19 20 32T a rtfirmvill p 28 20 26. 37 Boise _ __ __ __ __ ___ __ 25 20,37 24,27Little Rock—North Little Rock__ 40 _ _ _ 20 ,23 ,36 , 38 40 - - - 20,37Louisville ibii 59 _ _ _ _ 2 0 ,2 1 ,2 8 ,3 4 ,3 5 ,3 6 Los Angeles—Long B each_______ 55 - - - 36,37 -T .iiKKnrlf 23 20 Phoenix _ _ _ ____ 41 _ • 2 0 ,3 5 ,3 6 ,3 7XlAmpbifi 44 20 24 Portland _ _ ________ 45 _ _ _ 20 ,24 ,26M iam i--- ---------------- _ . . . 22 _ _ _ 20 23,34 ,37 Salt Lake City___________________ 39 - - - 19 20,35New Orleans____________________ 31 _ _ _ 20 23,37 San Bernardino—Riverside—Norfolk—Portsmouth and Ontario_______ _________________ 47 - - 33 37 32
Newport News—Hampton _ _ 51 37 _ _ _ _ San Diego_____________________ __ 57 - 37 19 - -Oklahoma City ______ 30 - - _ 20,36 34 San F ran cisco—Oakland—________ 35 - - - 20 34Pal pi grVft 38 20,22,36 Seattle _ 57 37R ich m o n d ______ _ 46 - - - 21 20 ,28 ,33 Spokane . . . . . ___ ___ _______ 36 - 33 20 24
1 Based on estimates o f employment derived from universe m aterials com piled prior to actual survey. F or estim ates based on the results o f the survey, and for scope o f the survey, see appendix A.
2 M ajor industry groups, shown with their 2-digit classification , are:
Proportions in various groups may d iffer from proportions based on the results o f the survey.
19 - Ordnance20 - Food21 - Tobacco22 - Textiles23 - Apparel24 - Lumber25 - Furniture
26 - Paper27 - Printing28 - Chemicals29 - Petroleum refining30 - Rubber and plastics31 - Leather32 - Stone, clay, and glass
33 - P rim ary m etals34 - Fabricated metals35 - M achinery (except e lectrica l)36 - E lectrica l m achinery37 - Transportation equipment38 - Scientific instruments39 - M iscellaneous manufacturing
Digitized for FRASER http://fraser.stlouisfed.org/ Federal Reserve Bank of St. Louis

5
Table 2. Nonmanufacturing Employment
(Proportion of workers within scope of survey1 employed in nonmanufacturing establishments and proportion of workers employed in nonmanufacturing by major industry groupand in selected industries2 in each of 82 labor markets surveyed, July 1962 through June 1963)
Percent distribution o f nonmanufacturing w orkers by m ajor industry group and in selected industries2
Labor m arket employment as percent Public utilities 3
Wholesaletrade
Retailtrade
Finance 4 Serviceso f total T ota l5 ____________________ Indu Btrv_____________________ T ota l5 Industrv T ota l5 Industry
40 42 48 40 60 63 70 72 73
Northeast
Albany-Schenectady—T r o y ------------- 41 31 10 2 12 4 10 30 13 6 5 16 3 2 9Allentown—Bethlehem—Eas t o n ____ 20 39 14 6 5 12 5 37 10 5 4 9 3 3 2B o sto n _____________________________ 53 19 3 2 8 4 13 28 22 7 11 18 3 2 9B u ffalo___— ________________________ 34 32 11 4 7 5 8 36 12 7 4 11 2 2 3Burlington _. __ 31 45 - 4 27 10 3 31 17 17 - 3 3 - -Lawr enc e—Have r hill 12 18 - 4 - 13 10 45 19 13 6 8 - 6 .M anchester------------------------------------- 26 37 1 12 12 10 13 25 18 5 11 7 2 4 1Newark and Jersey City_____ _____ 40 31 7 5 7 6 13 17 18 3 12 21 1 4 14New Haven---------------------------- ---------- 37 46 15 4 17 7 9 18 19 7 10 8 1 1 5New Y o r k ------ _ 65 24 3 1 9 3 12 20 26 9 8 18 3 2 9Paterson—Clifton—P assa ic — 29 31 3 8 8 6 13 37 8 5 2 12 ( 6) 3 7Philadelphia_______________________ 40 29 8 3 7 6 13 28 18 6 9 12 2 3 4Pittsburgh______________________ !___ 37 34 14 2 6 9 12 28 12 6 4 13 3 2 5Portland____________________________ 54 32 10 6 10 3 16 32 14 7 7 7 4 2 .Providence—Pawtucket _ 26 25 3 4 7 9 8 39 19 8 9 8 2 3 2Scranton 31 39 14 9 7 6 8 36 8 4 4 9 3 3 -Trenton _ — - 29 34 9 6 12 6 6 28 12 2 9 19 4 3 7W aterbury __ 15 34 3 5 10 12 5 37 17 13 3 7 2 - 4W orcester _ 25 21 3 3 6 7 5 43 26 9 16 5 2 3 1York - 20 40 5 14 10 10 6 36 8 6 2 10 4 2 1
South
Atlanta 60 29 5 8 6 3 17 30 14 4 7 10 2 3 4Baltim ore _ — 41 30 10 3 7 7 1 1 32 16 4 8 11 2 3 4Beaumont—Port A rthur------------------ 31 43 5 3 6 13 7 33 6 4 2 1 1 4 5 1Birmingham _ 47 30 9 6 7 7 17 30 15 4 8 8 2 3 2Charleston, (W. V a .)______________ 41 49 7 6 12 20 9 31 5 3 2 6 3 2 .Charlotte , „„ , , 57 33 3 15 8 5 20 26 13 6 5 9 2 3 2Chattanooga_______________________ 30 22 11 2 6 2 8 35 21 7 14 14 5 5 2D allas__ ___ 60 25 2 6 6 4 16 30 19 4 11 11 3 3 3F ort W orth ________________________ 48 29 12 1 6 5 12 38 10 4 5 10 3 3 2Greenville-__________________________ 22 25 5 7 8 3 5 43 15 4 7 13 3 7 1Houston . ..__ ................ .. , „ 60 29 6 6 5 7 18 31 12 3 5 10 2 2 3Jackson , 63 28 6 3 12 6 13 28 16 6 7 15 7 6 1Jacksonville 72 27 11 4 7 ( 6) 13 29 21 5 14 10 3 3 2Little Rock—North Little R o c k ____ 60 40 20 4 9 5 10 26 13 5 6 11 4 5 1L ou isv ille . _ 41 33 14 5 6 5 12 32 12 5 5 10 3 4 2Lubbock___ 77 32 5 8 11 5 7 45 7 5 2 9 3 3 1Memphi s m.i—,.. __ 56 24 8 8 5 ( 6) 20 31 12 5 5 12 3 5 2Miami . . . — 78 30 2 1 6 2 6 33 8 4 1 23 15 3 2New O rle a n s_______________________ 69 36 5 4 5 5 13 28 10 4 5 13 5 2 4Norfolk—Portsm outh and
Newport News—Hampton_________ 49 27 7 4 8 4 10 46 8 6 2 9 2 4 2Oklahoma C ity_____________________ 70 25 2 6 8 6 11 32 13 4 5 10 4 2 3Raleigh _ ... r_ . __ 62 30 10 1 6 7 15 29 19 3 13 7 3 3 1Pif»VirpoY|/l ... 54 28 11 5 8 3 14 31 18 7 10 9 3 3 2San A nton io------------------------------------- 70 17 5 3 6 1 12 45 11 5 3 15 5 6 3Savannah _ __ 40 44 23 3 10 7 6 28 9 6 2 13 5 6 _Washington - ___ 86 23 4 7 4 6 38 10 4 3 23 4 3 9
See footnotes at end of table,
Digitized for FRASER http://fraser.stlouisfed.org/ Federal Reserve Bank of St. Louis

6
Table 2. Nonmanufacturing Employment-----Continued
(Proportion of workers within scope of survey1 employed in nonmanufacturing establishments and proportion of workers employed in nonmanufacturing by major industry groupand in selected industries2 in each of 82 labor markets surveyed, July 1962 through June 1963)
Percent distribution o f nonmanufacturing w orkers by m ajor industry group and in selected industries 2
Labor market employment as percent
o f totalPublic utilities 3 Wholesale
tradeRetailtrade
Finance 4 Services
T ota l5 Industry T ota l5 Industry T ota l5 Industry40 42 48 49 60 53 70 72 73
North Central
A k ron _____________________________ 27 36 4 17 6 8 9 39 7 4 2 8 1 3 1r.antnn_____ _____ ______ 20 36 17 3 6 9 10 38 11 5 3 5 2 3 -Chicago — t_________________________ 49 27 11 3 6 4 16 26 16 5 7 16 3 3 6Cincinnati_________________ rr______ 37 34 11 7 8 5 13 28 13 4 7 12 3 3 4C leveland__________________ . . . ____ 40 26 9 4 7 4 18 31 13 6 4 12 3 3 5Columbus . ---------- -------- 48 25 9 3 6 5 10 31 16 3 10 17 3 3 3Davenport—Rock Island—Moline— . 29 38 16 6 8 8 9 31 14 5 8 8 4 2 ( 6)Dayton -t. ______________ ___tt- 23 25 2 3 8 8 8 45 7 4 2 15 3 3 6Des M oines_____ ____ _ 60 24 3 5 10 4 15 26 27 3 21 9 3 2 2Detroit— - _____ __ 37 25 5 4 8 7 12 33 16 6 6 14 2 3 6Green Bay. — 40 48 16 14 7 11 18 23 2 1 1 8 3 1 3Indianapoli s _____rrr,__.___T 43 25 7 6 6 3 15 33 16 4 10 11 2 4 2Kansas City . - 54 34 12 7 6 4 16 30 12 3 6 9 3 2 2M ilwaukee...___________ ___________ 35 27 6 5 6 7 13 35 14 5 7 11 2 3 3Minneapoli s—St. Paul__________— 55 28 10 4 5 4 16 30 15 4 7 10 2 2 3Muskegon—Muskegon H eights____ 14 41 5 9 16 11 8 36 9 7 1 6 3 2 .Omaha (61 data)______ _— --------- — 59 41 23 5 6 3 11 21 16 3 11 11 4 2 2Rockford , 18 24 1 3 9 9 9 44 13 6 7 10 4 3 3St. Louis Ii.....u..».rr.rr-.r-. . 43 34 13 5 6 6 16 25 13 5 4 12 3 3 4Sioux Falls— — -------------- ------— ---- 49 44 3 14 16 7 12 32 7 4 2 5 4 1 _South Bend ______ ____ ____ __!-------- 24 33 2 16 7 7 10 28 18 6 4 11 3 3 1T o l e d o _________ _ ____ 39 33 16 4 6 6 11 37 8 5 2 12 2 4 3Wate rlnn__ ______________________ 15 28 - 4 13 9 4 53 6 5 2 9 5 2 2W ich ita ------------------------------------------ 32 30 7 4 10 7 8 43 10 6 2 9 4 2 2
West
Albuquerque______________________ 79 25 5 5 9 4 5 22 7 4 2 41 4 3 2B o ise__rrr_,__________.._____________ 75 38 2 6 15 14 8 35 11 9 1 8 5 4 _D enver______ _ __ — — 60 29 5 6 8 4 14 33 11 4 4 13 3 3 2Los Angeles—Long B each______ __ 45 22 3 4 9 3 16 20 19 7 7 17 2 2 7Phoenix 59 27 2 4 10 7 7 40 14 7 4 13 6 3 3Portland ______________________________ 55 32 9 6 8 5 16 30 12 6 4 9 3 2 3Salt Lake City__________________ __ 61 31 8 8 8 5 14 33 10 5 3 12 3 2 3San Bernardino—
Riverside—O ntario______________ 53 47 27 ( 6) 10 9 8 27 10 7 3 8 4 2 1San D iego— ................................... . 43 23 1 2 10 7 5 37 14 6 3 20 7 4 7San Fran cisco—O akland__________ 65 30 5 3 8 4 16 20 21 7 9 13 3 2 6Se attle__________ — ____ — ________ 43 28 5 4 8 1 15 32 15 6 7 9 3 2 3Spokane --------- . 64 38 18 4 9 5 33 9 6 1 9 5 1 1
1 Based on estim ates o f employment derived from universe m aterials com piled prior to actual survey. F or estim ates based on the results o f the survey, and for scope o f the survey, see appendix A.
2 Industries, with their 2-digit classification , are:
Proportions in various groups may differ from proportions based on the results o f the survey.
60 - Banking 63 - Insurance carr iers70 - Hotels, rooming houses, camps, and other lodging places72 - Personal services73 - Miscellaneous business services
3 Transportation, communication, and other public utilities,4 Finance, insurance, and real estate.5 Includes industries in addition to those shown separately.5 Less than 0. 5 percent.
40 - Railroad transportation 42 - Motor freight transportation and
warehousing48 - Communications49 - E lectric, gas, and sanitary serv ices
Digitized for FRASER http://fraser.stlouisfed.org/ Federal Reserve Bank of St. Louis

(Percents of change1 in average earnings2 for selected occupational groups, 1962-633)
Table 3. Percentage Changes,1—All Industries and Manufacturing
7
JLabor m arket
All industries Manufacturing
Labor m arket
All industries ManufacturingO ffice
c le r ica l(men
andwomen)
Industrial
nurses(men
andwomen)
Skilledmainte
nancetrades(men)
Unskilledplantw ork
ers(men)
Officeclerica l
(menand
women)
Industrial
nurses(men
andwomen)
Skilledmainte
nancetrades(men)
Unskilledplantw ork
ers(men)
Officecler ica l
(menand
women)
Industrial
nurses(men
andwomen)
Skilledm ainte
nancetrades(men)
Unskilledplantw ork
ers(men)
O fficec le r ica l
(menand
women)
Industrial
nurses(men
andwomen)
Skilledmainte
nancetrades(men)
Unskilledplantwork
ers(men)
Northeast South— Continued
Albany—Schenectady—T roy -----—------ 3 .9 2 .0 3. 6 2.9 3 .4 2 .5 3 .5 1.9 San Antonio--------------------------- ------- 2 .9 <1 > (4) 2. 5 3 .6 <!> (4) 3.6Allentown—Bethlehem—Easton.-------- 2 .7 1. 5 1. 5 2 .6 2 .6 2 . 0 1 .6 1 . 1 Savannah- — _____ _— — ----------- 2. 3 (4) 1 .4 1. 3 (4) (4) (4) (4)B oston-. ---------------------- —---------------- 2. 5 3. 8 3. 5 3 .4 3. 1 4 .4 3. 5 2 . 2 Washington------------------------------------ 3. 3 2 .7 5. 1 4. 5 (4) (4) (4) (4)B u ffa lo__________________________ 3. 1 1.9 1.9 3.6 2.9 1.9 2 .0 3. 0Burlington----------- -------------------------- (4) (4) (4) (4) (4) (4) (4) (4)Lawr enc e—Have rh ill----------------------- 3 .4 6 . 3 2 .6 3. 5 4. 2 6 . 3 2 .7 3. 1 North CentralM anchester ------------------------------------- 4. 5 (4) 4. 4 5 .9 (4) (4) (4) (4)Newark and Jersey City----------------- 3. 1 6 .0 3. 1 4 .0 3. 0 7 .0 2 .9 3. 3 Akron--------- — -------------- ---------------- 3. 1 3. 0 2 . 8 3 :o 3. 2 3. 0 2.7 2 .4
2. 4 3. 5 2. 4 3. 8 1. 3 1. 5 2 . 2 2. 3 r.^nfnn _ . . ......... . 3 1. 5 1. 2 . 8 5—. 3 1. 5 1 . 0 7New York C ity------ -------------------------- 2 .9 3. 3 4. 3 4. 3 3. 1 4. 5 2 .7 2 .7 2. 3 2. 5 2 . 1 3. 8 2. 5 2 .0 1.9 Z. 5Pate r son—Clifton—Pas s a i c ------------- 2 .7 5 .8 2 .2 5.0 2.9 6 . 3 2 .5 2 .4 Cincinnati------------—---------------------- 3.0 3. 5 3 .9 2 .9 2.7 3.0 4. 0 3. 1Philadelphia . 2 . 8 3. 1 2 . 8 2 . 8 2 . 1 3. 1 3. 1 2 . 2 _ _ _ 2. 7 2. 9 3. 4 3. 1 2. 4 2. 9 3. 4 2 . 6Pittsburgh- ------- ------- — __ — ------ 1 .4 2 .4 . 7 2. 3 1. 8 2 .4 . 5 3 .4 1. 5 2 .7 2 .8 3. 5 2 .4 2.7 2 .4 1. 2Portland ----------------------- — — ------ 2. 3 1. 3 4. 1 .4 (4) (4) (4) (4) Davenport—Rock Island—M oline— 2 . 2 1. 4 2.7 2 .6 1.4 1.4 2 .6 1. 8Providenc e—Pawtucket-------------------- 3. 1 6 . 8 4 .6 2 .9 3. 2 6 . 2 5 .0 1 . 8 Dayton ____ _____________________ 3. 3 3 .8 2 . 6 2 .0 3 .2 3. 8 2.7 1 .8Sc r anton — ——— __— ———— — — _- 3 .3 2 .6 2.7 2 . 1 1 .6 2 .6 2 . 8 2 . 8 Des M oin es______________________ 3.0 3.6 2.9 3.2 3.7 (4) 2 .9 2.7Trenton _________— —______ ____ 2 . 2 5 .2 2. 3 4. 2 2. 3 5. 1 2 . 1 3. 7 D etroit —__—— _-____-_____ ——— 3.0 2. 7 2.9 3 .4 3 .4 3. 2 2.9 3.4Wat e rbu ry— — — — __—______ 2.7 3. 5 2 . 2 3. 5 3.0 3.0 2 . 1 3. 3 Green Bay----------------------- —----------- 2 . 2 (4) 4. 5 6 . 1 4. 2 (4) 5. 1 8 . 1W orcester- ------- ----------------- ------ 2 . 7 2 . 1 1 .6 4. 2 3. 2 1 .6 1.4 3. 3 Indianapolis_________________ -____ 2 .8 3 .9 4. 5 3. 0 3.0 3 .8 4. 0 3. 5Y o r k ______ — _________— ________— 2 . 0 (4) 2 . 8 4. 8 2 .4 (4) 2. 5 3 .0 Kansas City---------------------------------- 2 .6 4. 1 2 .8 1 . 1 2. 5 3.6 2 .5 1 .0
Milwaukee--------- ------------------------- - 3 .4 3 .6 3.9 3. 8 3 .4 3. 6 3.8 4.6South Minneapolis—St. P au l------------------ 2 .9 3. 7 4. 0 2. 7 2. 5 3 .2 3. 3 2 .0
Muskegon—Muskegon H eights------ 3 .0 3. 3 2 .6 3.9 3. 1 3. 3 2 . 6 4. 3Atlanta - — ------- ------------ —----------- 4. 2 3.0 3.0 2 . 3 3. 1 2 . 8 3. 3 . 3 Omaha— __—____ — ____ —— 3.6 1 .6 2 .6 2 . 0 3 .4 (4) 3. 7 2 . 1B altim ore _ ___ ______ _ ___ 2 . 8 3. 9 1 . 8 . 9 3. 1 3. 3 1. 1 2 . 2 Borlcford _ T 1. 9 2 . 8 1. 7 3. 6 1. 8 2 . 8 1. 5 3. 4Beaumont—Port A rth u r------------------ 4 .6 1. 3 4. 8 3. 2 5. 0 1. 3 4 .9 3. 2 St. L ou is -------------------------------------- 2 .6 2 . 6 2 . 6 3. 5 2 . 1 2 .6 2 . 2 3. 5Birm ingham ------------------------------------ 2. 7 . 5 . 7 1. 3 1.9 5—.5 .4 2 . 1 Sioux F a lls— ---- ---------------- (4) (4) (4) (4) (4) (4) (4) (4)Charleston, (W. V a .)______________ 2 . 1 4 .6 2 .6 3.0 1.9 4 .6 2. 5 3 .0 South Bend — ----------------------------— 2. 5 2. 5 2. 5 3. 8 2 . 1 2. 5 2. 3 3. 7C h a r lo t te ______ ______ 2 . 8 (4) 3. 8 . 4 3. 0 (4) 1. 8 1. 6 Tf>1«drt- T r - - - - 1. 9 4. 5 2. 3 2, 7 1 . 6 4. 4 2 . 0 3. 5Chattanooga------------------------------------- 3. 5 . 5 1 .8 2 .9 4. 2 . 5 1.9 2 . 8 W aterloo------------------------ ------— ---- . 8 (4) 2 .9 4 .0 2. 5 (4) (4) 3.7D alias —— ——— _——— —__— —_- 2 . 1 4. 3 1.9 2 .9 1. 2 3 .8 1.9 5 . 7 Wichita------------- ---------------------------- 1. 5 3. 8 1. 7 2.9 1.9 3. 8 .9 2. 7F ort Worth--------------------------------------- 3 .0 4 .9 2. 5 1 . 1 3. 2 4. 8 2 . 1 5 - 1 .0G reenville— — — _— —— —_—— 3. 3 4.7 1 . 1 1. 5 3. 5 4 .7 . 7 1 .6H ouston-------- ----------------- ----------------- 3. 3 1 .8 2 . 1 .9 5 .4 3. 1 1. 3 1. 5 WestJackson -------------------------------------------- 3 .4 (4) 3 .6 2.9 (4) (4) (4 ) (4)Jackson v ille ------------------------------------ 5. 1 (4) 3. 1 4 .8 (4) (4) (4) (4) Albuquerque------------------------------ — 1.9 (4) (4) 4 .7 (4) (4) (4) (4)Little Rock-N orth Little Rock------- 4 .9 (4) 3 .4 3. 1 4. 5 (4) 2 .6 2 .4 B o is e -------------------------------------------- 3 .9 (4) (4) 2 . 3 (4) (4) (4) (4)L ou isville — ---------------------------------- - 3 .4 2 . 0 3. 1 1.4 1.9 2 .5 3. 1 1. 3 Denver —_-___-__— __— — —— 4. 1 5. 2 3. 2 4. 3 3. 3 5 .7 3. 3 4. 6Lubbock-------------------------------------------- 2 .4 (4) (4) 3.9 (4) (4) (4 ) (4) Los Angeles—Long B each—---- -— 3. 3 4. 6 2.7 3. 8 3.7 4 .6 3. 0 3.6M pmphi a _ _ _ _ 2. 3 3. 9 3. 5 3. 0 1. 7 (4) 3. 5 2. 5 Phoenix____ __ _ ________ 4. 3 2 . 0 1. 1 7. 8 2 . 8 (4) (4) 4. 4M ia m i-------—--------------------—-------------- 2. 5 1.7 1 . 8 1. 7 1. 1 4 1. 3 1 . 1 Portland------------- -------------- -------— 2.9 5 10. 7 2 .9 3.7 1.5 6 1 2 . 1 2 .0 1. 1New O rleans— --------------------------- ----- 4. 5 1.5 4. 2 4. 3 5. 2 5—. 9 4. 3 3. 2 Salt Lake City---------------------------—, 4 .6 (4) 3. 4 . 8 (4) (4) 3. 1 2.7N orfolk—Portsm outh and San Bernardino—Riverside—
Newport News—Hampton--------------- 3 .4 (4) 5 .2 . 6 (4) (4) (4) 3 .6 Ontario__________________________ 2. 7 2 .9 2. 4 2 .9 * -..4 2 .9 2 . 1 2 .4Oklahoma C ity -------------------------------- 3 .0 (4) (4) 1 .8 2 . 2 (4) (4) * - . 1 San Fran cisco—Oakland---------------- 3. 2 3. 7 3 .2 4. 5 2. 4 4. 2 2 .9 3. 7Raleigh——— — — — ————— — —— 4 .6 (4) 4 .7 2 . 1 3. 1 (4) (4) 2. 3 Seattle— ______—____ ___— ——_ 3. 5 3 .5 2 .5 5. 5 3 .5 3.9 2. 3 3. 5Richmond 2. 5 1 .0 2 .6 3. 2 2 .0 1. 5 2. 7 3. 2 Spokane 3. 8 (4) 2 .2 2 . 1 (4) (4) 2 . 2 5—.4
1 Unless otherwise indicated, all are increases.2 Earnings o f o ffice c le r ica l w orkers and industrial nurses relate to regular straight-tim e salaries that are paid for standard workweeks. Earnings o f skilled maintenance trades and unskilled plant
w orkers relate to hourly earnings excluding premium pay for overtim e and for work on weekends, holidays, and late shifts.3 F isca l years ending June 30. In m ost cases the change is for 12 months. The exceptions are Columbus, 10 months; Albuquerque, Canton* Savannah, Sioux Falls, and Toledo, 11 months; San
Antonio and Wichita, 13 months; and Jacksonville, 14 months.4 Data do not m eet publication criteria .5 These unusual in crea ses o r d ecreases largely reflect changes in employment among establishments with different pay levels.
Digitized for FRASER http://fraser.stlouisfed.org/ Federal Reserve Bank of St. Louis

8
Table 4. Percentages Increases—All Industries and Manufacturing, 20 Labor Markets
(Percents o f increase in average earnings 2 for selected occupational groups, 1953—633) 1 2 3 *
Labor marketTime
interval(months)
All industries Manufacturing
Officec le r ica l(women)
Industrialnurses
(women)
Skilledmainte
nancetrades(men)
Unskilledplant
workers(men)
Officec ler ica l(women)
Industrialnurses
(women)
Skilledm ainte
nancetrades(men)
Unskilledplant
w orkers(men)
Northeast
R oaton______________________________ 115* 49.0 54.0 49.2 47 .3 45.7 52. 0 48 .8 44 .9Buffalo ..... ....... . 116 44.3 49.9 48. 5 51.6 46.2 50.4 48 .0 51.7Newark and Jersey C ity ---- 123 49.6 57.5 50. 5 52.7 49.6 58.3 49 .9 58.2New York City______________________ 122 47.6 53.5 51.4 51.4 49,2 66.7 51. 1 54.7Philadelphia________________________ 121 51.7 56.4 52.7 51.9 50.8 55.8 50.9 49.3Providence—Pawtucket __ __ ---- 125 46.8 47 .0 51.4 39.8 51.8 46. 1 49 .8 29.5
South
Atlanta_____ ___ __ 122 47 .0 56.5 51.4 54.4 50.3 61.4 48.6 54.0Baltim ore , 121 53.2 61.7 60.6 66.7 58.0 63.1 60.9 73.7Dallas . 123 48.0 45 .4 52.6 45. 5 40.9 40.7 44 .9 45 .8Memphis--— — - — — 120 42.6 55.4 53.4 55.6 42. 5 (4) 46. 1 44 .4
North Central
Chicago______________ 121 44.3 52.2 50.3 47.7 46 .4 52.9 49 .6 44.9C leveland----------------------------------------- 119 47.7 59.5 52.7 54.0 51.5 57.9 53.0 51.9Kansas City ------ . . . ---- 121 51.8 58.6 56.4 51.2 54.9 56.2 55.7 54. 1Milwauke e______ ________ ______ __ . 1 2 0 45.6 59. 1 54. 0 46.3 51. 1 59.7 54.3 49.0Minneapolis—St. Paul — _ 122 46.0 54.4 52.7 58. 1 44.6 52.3 49.3 51.8St. L ou is ------------------------------------------ 118 46.4 60.0 53. 1 53.4 47.2 6 0 .0 51.6 53.3
West
Denver______________ 121 51.4 60.8 6 6 . 1 72.7 54.4 (4) 65.2 80 .4Los Angeles—Long B each---------------- 121 50.7 51.6 51.4 51.3 51.0 52.7 51.2 47.2P ortland. — . __ . . 128 46.1 60.5 52.5 50. 1 43.5 59.4 51.3 45. 1San F rancisco—Oakland------------------ 120 47.0 6 1 .2 50.4 57. 1 43.6 62.3 52.7 54.0
1 Lim ited to the 20 areas which w ere surveyed in both 1953 and 1963.2 Earnings o f o ffice c ler ica l w orkers and industrial nurses relate to regular straight-time salaries that are paid fo r standard
workweeks. Earnings o f skilled maintenance and unskilled plant w orkers relate to hourly earnings excluding prem ium pay for overtim e and w ork on weekends, holidays, and late shifts.
3 F isca l years ending June 30. Wage indexes for the years 1954 through 1961 are presented in Wages and Related Benefits, Metropolitan A reas, United States and Regional Summaries, 1960-61 (BLS Bulletin 1285-84, 1962), pp. 36-39.
* Data do not m eet publication criteria .
Digitized for FRASER http://fraser.stlouisfed.org/ Federal Reserve Bank of St. Louis

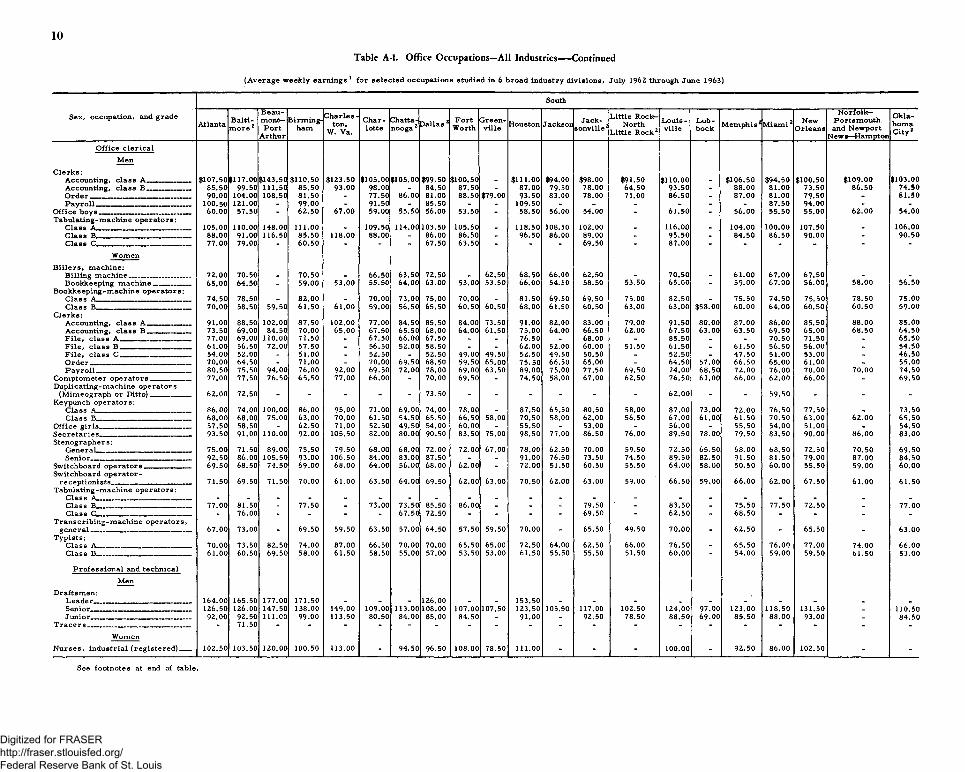
A: Occupational EarningsTable A-l. Office Occupations—All Industries
9
(Average weekly earnings 1 for selected occupations studied in 6 broad industry divisions, July 1962 through June 1963)
Sex, occupation, and grade
NortheastA lban y-Schenec-
tady—T roy
Allentown—Bethlehem—Easton
B oston2 Buffalo B urlington
Lawrence—
Haverhill
Manchester
Newarkand
JerseyCity*
NewHaven
NewY ork 2
Paterson— C lifton - Pass aic
Ph iladelphia
P ittsburgh
P ortland
P rov id en ce - Paw - tucket
Scranton Trenton W ater-
buryW orces
ter York
O ffice c le r ica lMen
Clerks:Accounting, c la ss A ___________ $ 1 1 0 .0 0 $141.00 $101. 50 $118.00 |>100. 50 - $83.50 $ 1 0 9 .0 0 $108.50 $104.50 $113. 50 $ 1 0 0 .0 0 $121.50 $103. 50 $9 8 .50 $105. 50 $108.50 $105. 50 $119.50 $109.50Accounting, c la ss B _______ —__ 8 9 .0 0 1 1 2 . 00 79. 50 95. 50 79. 50 - - 94.50 104.00 81. 50 97. 50 8 8 .0 0 105. 50 - 73. 50 _ 98.00 84. 50 77. 50Order 91. 50 - 93. 50 103.00 - - - 1 0 1 .0 0 107.00 8 6 . 50 85.50 103. 50 113.00 79.50 81.00 _ 110.50 _ 106.00 84.00P ayroll - 132.50 94.50 1 2 1 .0 0 85. 50 - - 97.00 - 97. 50 97. 50 97. 50 114.50 _ _ _ _ 8 6 . 50O ffice boys 61. 50 8 8 . 50 55.00 68.50 58.50 - - 64.00 63. 50 62.00 63.00 6 1 .0 0 63.50 57. 50 56. 00 64.00 63. 50 65.00 54.00
Tabulating-m achine operators: sC lass A _________________________ 107.00 125.00 98. 50 115.00 - $94.00 - 107.00 112.50 109. 00 117.00 106. 50 117.00 . _ _ 1 1 9 .0 0 99.00 _C lass B _ _ _ ____ _________ 8 8 .0 0 105. 00 82.50 104.50 106.50 - 71.00 94.50 90. 00 9 2 .0 0 * 96.50 87.00 1 0 1 .0 0 72. 50 84.00 85. 50 99.00 87.50 80. 50 _
73. 50 - 69.50 93.00 - - - 77.50 - 75. 00 - 72. 50 82.50 - - 78.00 73. 50 -W omen
B ille rs , machine:Billing machine 65. 50 60. 50 71. 50 79.00 - 63. 50 - 73. 00 75. 00 76. 50 69.00 78. 00 76.00 48. 50 6 1 .0 0 62.00 65.00 69. 50 67. 50 64. 50Bookkeeping m ach ine__________ - 63.50 61.00 61. 50 - - 64. 50 6 8 . 50 6 8 . 50 77. 50 _ 65. 50 6 8 . 50 _ 57.00 _ _ _
Bookkeeping-machine operators:C lass A _________________ ________ 83.50 64.50 78.00 84.50 - - - 79.00 76.50 8 6 . 50 9 1 .0 0 78. 50 79.00 - 68.50 75. 50 82.50 _ 81.00 70.00Class B ____________ ____________ 61. 50 57.00 65. 50 58.50 62.00 60. 00 64.00 69. 50 63.00 75. 50 6 8 . 50 64. 50 67.50 54.00 60. 00 56.00 69. 50 59. 00 62.00 56. 00
Clerks:Accounting, c la ss A 9 2 .0 0 94. 00 85. 00 9 8 .0 0 87. 50 83.00 78. 50 91. 50 95.00 9 6 .0 0 102.50 85. 00 94. 50 78. 00 82. 50 89. 50 8 6 . 50 91.00 90.00 87. 00Accounting, c la ss R 72. 00 79.00 6 8 .0 0 73.50 70. 50 70. 50 59. 50 75. 50 72. 50 75. 50 73. 50 6 8 . 50 77.50 62. 50 64.50 73.00 71.00 69. 50 67. 50 67.00F ile , cla ss A _ ..... 79. 00 . 87.00 69. 50 76.50 - - - 74. 50 - 83.00 75. 50 72. 50 84. 50 _ 76.00 _ _ 80. 50 75.00 _F ile , cla ss B 59. 50 76. 50 59. 00 58. 50 - - - 6 1 .0 0 62. 50 6 8 . 50 65.00 59.00 65.50 . 60. 00 59. 50 58.00 63. 50 57.00 51.00F ile , cla ss C -----------,— _____ 56.00 73.00 55. 00 52.50 - - 49.00 59.50 57. 50 6 1 .0 0 54.00 52. 50 59. 50 51.00 52.00 54.00 53. 50 52.00 50. 50O rder— 74. 00 - 71.50 76.00 - 81.00 62. 50 74.50 79.50 73. 50 67.00 6 9 .0 0 79. 50 61.00 64.00 6 1 .0 0 70.00 76. 50 78.00 65.00P a yroll 78. 00 6 8 .0 0 74. 50 81.00 77.00 71. 50 60.50 86.50 78.50 8 8 .0 0 85.00 77. 50 85.00 70.00 70. 50 59.00 80.00 81. 50 72.00 6 8 . 00
Com ptom eter operators___________ 82.00 78. 00 71.00 73.50 - - 60. 50 82.00 79.00 81. 50 79.00 73.00 78.00 73.00 71. 50 78.00 _ 72. 50D uplicating-machine operators
(M im eograph or Ditto)-------- -------- - - 62. 50 - - - - 6 8 .0 0 - 6 9 .0 0 - 64 .00 72. 50 _ _ _ . 71. 50 _ _Keypunch operators:
Class A _ _ 81. 50 89. 00 74.00 85. 00 - 74.00 - 83.50 81.00 84.00 8 8 .0 0 79. 50 8 6 . 50 84.00 72.00 _ _ 81.00 81. 50 72.00 _Class B _ 73.00 80.50 65. 50 70.00 57.00 - 54.00 70.00 71. 50 72. 50 67.00 67. 50 74.00 53.00 63.00 79. 00 68.50 70.00 64.00 64. 50
O ffice g irls _ 57. 50 75. 00 54. 50 58.50 - - - 62.50 60.00 62.00 - 55. 50 61. 50 _ 51. 50 57. 50 59. 50 56.00S e cre ta r ies________________________ 95. 00 8 8 .0 0 8 9 . 00 9 8 . 00 89.00 8 9 .0 0 77.00 98.50 9 2 .0 0 1 0 1 .0 0 97. 50 94. 00 99.00 76. 50 80.00 79.00 95.00 98.00 90. 50 89.00Stenographers:
G enera l__________________ _____ 77.00 73. 50 72.00 77.50 - 71. 50 59. 50 78. 50 76. 00 80.50 76.50 74. 00 82.00 64.00 63. 50 63.00 73. 50 77. 50 74.00 71.50Senior _ _ - 81.00 79. 50 93.00 - - 67.00 8 8 . 50 80. 50 92. 50 8 6 .0 0 84. 00 91.00 _ 76. 50 65.00 82.00 92.00 74. 50
Switchboard operators_____ _______ 72. 50 73. 50 72. 50 75. 00 60. 50 71. 50 64. 50 79.50 73. 50 81. 50 80.00 73.00 78.00 56.50 63.00 56. 50 63.50 73. 50 70. 00 67. 50Switchboard op erator-
receptionists __ 70. 00 64.00 71.00 74.00 70. 50 65. 00 59. 50 78. 00 73. 50 79. 50 75. 00 69. 50 76. 50 60.50 65. 00 54. 50 74.50 73. 50 67. 50 64.00Tabulating-m achine operators:
Class A _ _ _ _ _ _ _______ _ _ - - 93.00 - - - - 99. 00 - 104.00 - 1 0 1 .0 0 107.00 _ _ _ _ _ _ _Class B _________________________ - - 77.00 90.50 - - - 9 1 .0 0 9 2 .0 0 84. 50 - 82. 50 9 1 .0 0 . 83.00 _ 8 6 .0 0 92. 50 8 6 . 50 _Class C -------r--------- II nr ■ II in-...-.---n - - 64.50 76.50 - - 52.50 67. 50 - 74. 50 64. 50 69. 00 72.00 _ 63.00 _ 65.00 72. 50
T ranscribing-m achine operators,general _ _____ ___ 70.00 - 69. 50 71.00 - - - 72.00 72.00 79. 00 72.00 6 8 . 00 72.00 56. 50 67.00 _ 74. 50 74.00 65. 50 6 6 .0 0Typists:
C lass A _________________________ 80. 50 81.50 72. 50 77. 50 72.00 6 9 .0 0 58. 50 78. 50 72.00 78.00 78.00 77. 50 79. 50 65.50 6 6 . 50 82. 50 75. 50 75. 50 6 8 . 50 6 8 .0 0Class B _________________________ 60.00 67.50 6 1 .0 0 62.00 57. 50 61. 50 53. 00 65. 50 63.00 6 8 . 50 67.00 60. 50 68.50 53.00 55. 00 54. 50 65. 50 65. 50 6 0 .0 0 59. 50P rofession a l and technical
MenDraftsmen:
Leader ___ _ - 1 6 0 .0 0 154.00 159.00 - - - 158.00 155. 50 179. 50 - 173. 50 170.00 - 155. 50 _ 161.50 _ 156.50 144. 50Senior —,------------------ -. --------- - 126.00 129. 00 134.50 - 114.00 115.50 1 2 9 .0 0 121.50 132.50 132.50 131. 00 141. 50 123. 50 113.00 103.00 133.50 124. 50 1 2 0 .0 0 112.50Ju n ior ____ . . . - 108.00 95. 00 104.00 - - - 97.50 - 96.50 104. 50 101. 50 1 0 9 .0 0 - 8 6 . 50 77. 50 98. 50 94.00 93.00 91. 50T ra ce rs -------------------------------------------- - - 66.50 - - - - - - - 87. 50 63. 50 78.00 - - - - - -
W omenN urses, industrial (reg is te re d ).... 104. 50 99.50 95. 50 105.00 - 93.00 - 105. 50 101. 50 108.00 1 0 9 .0 0 1 0 0 .0 0 107.00 81.00 8 6 .0 0 80. 00 1 0 2 .0 0 102.50 95. 50 -
See footnotes at end of table.
Digitized for FRASER http://fraser.stlouisfed.org/ Federal Reserve Bank of St. Louis
10
Table A-l. Office Occupations—All Industries— Continued
(Average weekly earnings 1 for selected occupations studied in 6 broad industry divisions, July 1962 through June 1963)
South
Sex, occupation, and gradeAtlanta Balti
m o re 2
Beaumont—Port
Arthur
Birmingham
Charleston,
W. Va.Charlotte
Chattanooga 2 D allas2 F ort
WorthGreenville Houston Jackson Jack-
sonville1Little R ock -
NorthLittle R ock 2
Louis - v ille
Lubbock M em phis2 M iam i2 New
Orleans
N orfolk— Portsm outh and Newport
N ew s—Hampton
OklahomaC ity2
O ffice c le r ica l Men
Clerks:Accounting. d a sa A. _ -----Accounting, class B ____________
$107.5085.50
$117.0099.50
$143.50111.50
$110.5085.50
$123.5093.00
$105.0098.00
$105.00 $99.5084.50
$100.5087.50
$1 1 1 .0 087.00
$94.0079.50
$98.0078.00
$91.5064.50
$1 1 0 .0 093.50
- $106.508 8 .0 0
$94.5081.00
$100.5073.50
$1 0 9 .0 086.50
$103.0074.50
O rder ----- 9 0 .0 0 104.00 108.50 81.50 - 77.50 8 6 .0 0 81.00 88.50 $79.00 93.50 83.00 78.00 71.00 86.50 - 87.00 81.00 79.50 - 81.50Payroll __ _ 100.50 1 2 1 .0 0 - 99.00 91.50 - 85.50 - - 109.50 _ _ _ . - - 87.50 94.00 - -
O ffice boys 60.00 57.50 - 62.50 67.00 59.00 55.50 56.00 53.50 - 58.50 56.00 54.00 - 61.50 - 56.00 55.50 55.00 62.00 54.00Tabulating-machine operators:
1 1 6 .0 0 106.00Class A____ ,_r_________________ 105.00 1 1 0 .0 0 148.00 1 1 1 .0 0 - 109.50 114.0C 103.50 105.50 118.50 108.50 1 0 2 .0 0 - - 104.00 1 0 0 .0 0 107.50 -Class B — 8 8 .0 0 9 1 .0 0 116.50 85.50 118.00 8 8 .0 0 _ 8 6 .0 0 86.50 96.50 8 6 .0 0 8 9 .0 0 _ 95.50 _ 84.50 86.50 90.00 _ 90.50Class C . __ 77.00 79.00 - 60.50 - - - 67.50 63.50 - - 69.50 - 87.00 - - - - - -
WomenB illers , machine:
Billing m achine_________________ 72.00 70.50 _ 70.50 _ 66.50 63.50 72.50 _ 62.50 68.50 6 6 .0 0 62.50 - 70.50 - 61.00 67.00 67.50 - -Bookkeeping machine ^ 65.00 64.50 _ 59.00 53.00 55.50 64.00 63.00 53.00 53.50 6 6 .0 0 54.50 58.50 53.50 65.00 - 59.00 67.00 56.00 58.00 56.50
Bookkeeping-machine operators:69.50Class A_ . _ 74.50 78.50 - 82.00 - 70.00 73.00 75.00 70.00 81.50 69.50 75.00 82.50 - 75.50 74.50 75.50 78.50 75.00
Class B . . ___ 70.00 58.50 59.50 61.50 61.00 59.00 56.50 65.50 60.50 60.50 6 8 .0 0 61.50 60.50 63.00 63.00 $58.00 60.00 64.00 60.50 60.50 59.00Clerks:
9 1 .0 0 88.50 1 0 2 .0 0 87.50 1 0 2 .0 0 77.00 84.50 85.50 84.00 73.50 91.00 82.00 83.00 79.00 91.50 80.00 87.00 8 6 .0 0 85.50 8 8 .0 0 85.00Accounting, class B 73.50 6 9 .0 0 84.50 70.00 65.00 67.50 65.50 6 8 .0 0 64.00 61.50 75.00 64.00 66.50 62.00 67.50 63.00 63.50 69.50 6 5 .0 0 68.50 64.50F ile , class A ---- ------------------------ 77.00 6 9 .0 0 1 1 0 .0 0 71.50 - 67.50 6 6 .0 0 67.50 - _ 76.50 - 6 8 .0 0 - 85.50 - - 70.50 71.50 - 65.50F ile , cla ss B ____ ______________ 61.00 56.50 72.00 57.50 _ 56.50 52.00 58.50 _ _ 62.00 52.00 60.00 51.50 61.50 _ 61.50 56.50 56.00 54.50F ile , class C _ ____ 54.00 52.00 _ 51.00 _ 52.50 _ 52.50 49.00 49.50 52.50 49.50 50.50 _ 52.50 _ 47.50 51.00 53.00 _ 46.50Order _ . „ _______ _ __ 70.00 64.50 - 71.00 - 70.00 69.50 68.50 59.50 65.00 75.50 66.50 65.00 - 64.50 57.00 66.50 65.00 6 1 .0 0 - 55.00Payroll... .............. . 80.50 75.50 94.00 76.00 9 2 .0 0 69.50 72.00 78.00 69.00 63.50 8 9 .0 0 75.00 77.50 69.50 74.00 68.50 72.00 76.00 70.00 70.00 74.50
Comptometer operators 77.00 77.50 76.50 65.50 77.00 6 6 .0 0 - 70.00 69.50 - 74.50 58.00 67.00 62.50 76.50 6 1 .0 0 6 6 .0 0 62.00 6 6 .0 0 - 69.50Duplicating-machine operators
(Mimeograph or Ditto) 62.00 72.50 - - - - - 73.50 - - - - - - 62.00 - - 59.50 - - -Keypunch operators:
Class A_______ _________ 8 6 .0 0 74.00 1 0 0 .0 0 8 6 .0 0 95.00 71.00 69.00 74.00 78.00 - 87.50 65.50 80.50 58.00 87.00 73.00 72.00 76.50 77.50 73.50Class B _ 6 8 .0 0 6 8 .0 0 75.00 63.00 70.00 61.50 54.50 65.50 66.50 58.00 70.50 58.00 62.00 56.50 67.00 61.00 61.50 70.50 63.00 62.00 65.50
O ffice g ir ls . ____ 57.50 58.50 _ 62.50 71.00 52.50 49.50 54.00 60.00 _ 55.50 _ 53.00 _ 56.00 _ 55.50 54.00 51.00 54.50Secretaries 93.50 9 1 .0 0 1 1 0 .0 0 92.00 105.50 82.00 80.00 90.50 83.50 75.00 98.50 77.00 86.50 76.00 89.50 78.00 79.50 83.50 90.00 8 6 .0 0 83.00Stenog raphe r s :
6 8 .0 0 67.00 62.50 6 8 .0 0General _ ---- 75.00 71.50 89.00 75.50 79.50 6 8 .0 0 72.00 72.00 78.00 70.00 59.50 72.50 65.50 68.50 72.50 70.50 69.50S eni o *** , 92.50 8 6 .0 0 105.50 93.00 106.50 84.00 83.00 87.50 - _ 9 1 .0 0 76.50 73.50 74.50 89.50 82.50 91.50 81.50 79.00 87.00 84.50
Switchboard operators_____________ 69.50 68.50 74.50 6 9 .0 0 6 8 .0 0 64.00 56.00 6 8 .0 0 62.00 - 72.00 51.50 60.50 55.50 64.00 58.00 50.50 60.00 55.50 59.00 60.00Switchboard operator-
receptionists ... _ _ 71.50 69.50 71.50 70.00 61.00 63.50 64.00 69.50 62.00 63.00 70.50 6 2 .0 0 63.00 59.00 66.50 59.00 6 6 .0 0 62.00 67.50 61.00 61.50Tabulating-machine operators:
Class A_ _ _ ___ _ _ - - - - - - - - - - - - - - - - - - - _ -Class B _ 77.00 81.50 - 77.50 - 73.00 73.50 85.50 8 6 .0 0 - - - 79.50 - 83.50 - 75.50 77.50 72.50 . 77.00Class C__ __ ____ _ _ 76.00 _ _ - - 67.50 72.50 - _ - - 69.50 - 62.50 - 68.50 - - _ _
Transcribing-m achine operators,65.50general . . 67.00 73.00 - 69.50 59.50 63.50 57.00 64.50 57.50 59.50 70.00 - 65.50 49.50 70.00 - 62.50 - - 63.00
Typists:64.00 6 6 .0 0 65.50Class A . _ . ----- ---- 70.00 73.50 82.50 74.00 87.00 66.50 70.00 70.00 65.50 65.00 72.50 62.50 76.50 - 76.00 77.00 74.00 6 6 .0 0
Class B . __ - . 61.00 60.50 69.50 58.00 61.50 58.50 55.00 57.00 53.50 53.00 61.50 55.50 55.50 51.50 60.00 54.00 59.00 59.50 61.50 53.00
Professional and technical Men
Draftsmen:Leader ____ 164.00 165.50 177.00 171.50 1 2 6 .0 0 153.50Senior , : , ,, , , ....... 126.50 1 2 6 .0 0 147.50 138.00 149.00 109.00 113.00 108.00 107.00 107.50 123.50 105.50 117.00 102.50 124.00 97.00 123.00 118.50 131.50 _ 110.50Jnninr , ,,, , 92.00 92.50 1 1 1 .00 99.00 113.50 80.50 84.00 85.00 84.50 _ 9 1 .0 0 _ 92.50 78.50 88.50 6 9 .0 0 85.50 8 8 .0 0 93.00 _ 84.50
T racers ____ __ _ ... - 71.50 - - - - - - - - - - - - - - - - - - -Women
N urses, industrial (registered) 102.50 103.50 1 2 0 .0 0 100.50 113.00 - 94.50 96.50 108.00 78.50 1 1 1 .0 0 - - - 1 0 0 .0 0 - 92.50 8 6 .0 0 102.50 - -
See footnotes at end of table.
Digitized for FRASER http://fraser.stlouisfed.org/ Federal Reserve Bank of St. Louis

(Average weekly earnings 1 fo r selected occupations studied in 6 broad industry divisions, July 1962 through June 1963)
Table A-l. Office Occupations—All Industries— Continued
11
Sex, occupation, and grade
Southit—Conti nued North Central
Raleigh Richm ond2
San An
tonio 2Savan
nah2Washington2 Akron Canton Chicago 2 Cincin
natiC leveland2 Columbus
D avenport- Rock Island-
MolineDayton Des
Moines D etroit2 GreenBay
Indianapolis 2
KansasCity Milwaukee
Minneapolis— St. Paul
Muskegon—MuskegonHeights
O ffice c le r ica lMen
Clerks:Accounting, c la ss A ____________ $8 6 .0 0 >109.50 $89.00 $115.50 >1 0 0 .0 0 >125.50 $119.50 $112.50 $103.00 $113.50 $105.50 $115.00 $117.00 >107.00 $132.00 $108.50 >1 1 0 .0 0 $107.00 $119.50 $105.50 $119.50Accounting, c la ss B 72.00 8 8 .0 0 76.50 90.50 81.50 82.0C 94.50 81.50 93.00 85.50 87.50 93.50 90.50 96.50 89.00 90.00 83.00 89.50 8 6 .0 0O rder - 87.50 77.50 - 99.00 117.50 1 0 2 .0 0 113.50 102.50 108.00 93.00 100.50 90.50 92.00 1 2 1 .0 0 _ 8 9 .0 0 99.00 105.50 100.50 _P a yro ll. - - 8 8 .0 0 - - - 95.50 115.00 104.00 - 107.00 - - 103.00 _ 121.50 _ 118.50 98.00 113.00 1 0 1 .0 0 _
O ffice boys - 58.50 51. 50 67.00 60.50 62.50 67.00 62.50 68.50 63.00 63.00 56.50 71.50 _ 59.00 57.00 63.50 61.50 _Tabulating-m achine operators:
Class A _ - 105.50 106.00 - - 115.00 1 1 9 .0 0 115.00 111.50 118.50 116.50 1 1 2 .0 0 131.00 98.50 126.00 _ 112.50 114.00 119.50 103.50 _Class B 86.50 94.00 70. 50 - 91.50 105.50 102.50 9 6 .0 0 92.00 1 0 2 .0 0 93.00 96.50 108.50 8 8 .0 0 104.00 86.50 90.50 95.50 99.00 9 1 .0 0 99.00Class C __ ________ _ - 68.50 57.00 - 87.00 76.00 - 8 6 .0 0 71.50 84.00 82.00 - - 69.50 9 0 .0 0 - 73.00 79.00 81.50 75.50
WomenB ille rs , machine:
B illing machine _ ___________ __ - 61.50 61.00 - 60.50 77.50 79.50 68.50 73,50 75.00 60.50 74.50 65.00 83.00 68.50 74.00 70.00 6 8 .0 0Bookkeeping m achine__________ - 62.50 51.00 - 68.50 62.00 71.00 73.50 61.50 _ 58.50 • 6 9 .0 0 . 66.50 64.00 73.00 67.00 _Bookkeeping-m achine operators:
Class A _ 71.50 71.50 69. 50 - 82.00 79.00 - 93.00 81.00 88.50 76.50 84.00 88.50 76.00 89.50 _ 84.00 87.00 85.00 80.50 _Class B - _ _ _____ ___
Clerks:63.00 61.50 53.00 56.50 67.00 64.50 54.50 77.00 67.50 70.00 60.50 63.50 76.50 64.00 73.00 56.50 65.50 65.00 68.50 63.00 64.50
Accounting, cla ss A_________ __ 75.00 84.00 79.50 89.00 89.00 98.50 85.00 98.00 91.00 97.00 83.00 98.00 94.00 77.00 104.50 81.00 87.00 91.50 95.50 85.00 92.50Accounting, c la ss B______ _____ 6 1 .0 0 70.00 59. 50 65.50 70.00 75.00 83.00 77.50 69.50 77.00 66.50 74.00 70.50 66.50 76.00 64.50 69.50 69.00 74.00 6 8 .0 0 83.50F ile , class A_______________ ____ - 73.50 - - 77.50 84.50 - 80.00 ' 74.00 81.50 74.00 83.00 87.00 62.50 92.50 _ 78.50 75.00 75.50 73.00F ile , cla ss B — 51.00 60.50 55.00 - 68.50 6 1 .0 0 58.50 67.00 59.50 64.50 59.50 62.50 67.00 53.50 64.50 _ 58.00 59.50 62.00 59.00 _F ile , cla ss C .. . - 51.50 - - 57.50 - - 59.00 53.50 60.00 53.00 53.50 _ 49.00 59.50 49.50 54.50 52.00 54.50 51.00 _O rder - 72.00 - - 73.00 6 6 .0 0 77.50 78.00 74.00 75.00 72.50 69.50 65.50 62.50 80.00 „ 65.50 72.50 6 9 .0 0 71.50P ayroll- 72.50 78.00 67.00 88.50 81.50 92.00 85.50 89.00 81.00 87.00 77.00 83.00 87.50 74.00 95.00 74.50 81.00 82.50 81.00 78.00 75.00Com ptom eter operators____ _____ 59.00 66.50 6 6 . 50 - 81.00 78.00 73.50 80.50 73.50 79.50 80.50 70.50 79.50 73.00 89.50 . 77.50 76.00 71.00 72.50 80.00Duplic ating - m achine operators
(M im eograph or Ditto)___:_____ __ - 65.50 - - - - - 74.50 70.50 70,50 6 6 .0 0 _ _ 72.00 _ 63.00 _ 67.00 63.50 _Keypunch operators:
C lass A ______ ____ 72.50 78.50 63. 50 - 84.50 93.00 83.00 84.50 82.50 84.50 77.00 90.50 94.00 69.00 9 2 .0 0 - 78.50 81.50 81.00 74.00 _Class B _ _____ ___ 56.00 69.50 58.00 70.50 70.00 77.50 73.50 76.50 71.50 79.00 6 8 .0 0 77.00 74.50 59.50 87.50 55.00 71.00 74.00 70.00 6 8 .0 0 67.00O ffice g ir ls _______ «m.______ ________ - 53.50 - - 58.50 59.50 - 64.00 56.00 61.00 57.00 62.00 62.00 55.00 64.50 _ 6 0 .0 0 58.50 60.00 52.50Secretaries _ _ _____ ___
Stenographe r s :84.50 87.50 80.50 89.50 94.50 103.00 89.50 101.50 9 8 .0 0 1 0 1 .0 0 89.00 101.50 101.50 84.50 1 1 0 .0 0 85.50 98.50 95.00 96.50 89.50 91.5064.00 76.00 64.00 80.00 83.50 80.00 73.00 8*.50 72.00 80.50 78.00 76.50 81.50 6 6 .0 0 87.00 65.00 81.50 76.50 76.00 74.00 70.00Senior _______ __ 73.00 82.50 75.00 85.00 96.50 92.50 87.50 9 2 .0 0 8 9 .0 0 93.00 87.00 90.00 103.50 79.00 1 0 1 .0 0 _ 8 8 .0 0 8 8 .0 0 89.50 80.00 90.50Switchboard op era tors .. 51.50 64.50 57.50 57.50 65.50 75.50 74.50 80.00 77.50 77.50 70,50 65.50 74.50 63.00 84.00 _ 6 9 .0 0 68.50 73.50 69.50 64.50Switchboard operator-
receptionists ----- 61.00 66.50 57. 50 - 74.50 75.50 71.50 81.00 72.50 76.00 66.50 65.00 74.00 6 6 .0 0 77.50 69.00 6 9 .0 0 70.00 73.50 6 9 .0 0 71.50Tabulating-m achine operators:C lass A __ _ - - - - - - - - _ _ _ _ _ 123.50 _ _ _ _ _Claes B _________ _ - 77.00 - - 84.00 100.50 - 94.00 81.00 93.50 84.00 96.00 97.00 75.00 96.50 > _ 89.50 83.50 82.00 _Class C ___ - ' 62.00 69.00 - 75.00 76.00 - 83.50 67.00 80.00 74.00 «. 80.00 60.00 8 6 .0 0 _ 68.50 71.50 73.00 64.00 _
T ranscribing-m achine operators,gen era l^ .. ,__
Typists:57.50 66.50 - - 75.00 76.50 72.50 80.00 70.50 75.00 6 6 .0 0 70.00 73.00 63.00 79.00 60.50 66.50 67.50 72.00 68.50 -
Class A -------------- _ _ _ 62.50 68.50 63.00 80.50 77.50 79.00 75.50 80.00 75.00 81.00 73.50 87.50 85.00 64.00 94.00 73.50 78.00 77.00 81.00 70.50 85.50Class B _ ____ 51.50 59.00 51.50 61.00 66.50 6 9 .0 0 57.50 69.00 64.00 67.00 59.50 66.50 71.50 54.50 74.50 58.00 6 1 .0 0 62.50 65.50 61.50 62.00P rofession a l and technical
Draftsmen:Leader - - - - - 1 6 8 .0 0 154.00 1 6 1 .0 0 155.50 166.50 - 141.00 147.50 _ 199.50 _ 146.00 _ 170.50 142.50 _Senior _ - - n r_, 123.00 129.50 95. 00 1 2 0 .0 0 122.50 139.00 131.00 134.50 133.00 134.50 1 2 0 .0 0 1 2 0 .0 0 134.00 1 2 2 .0 0 164.50 123.00 132.00 120.50 129.50 1 1 9 .0 0 123.50Junior _ ___, 8 6 .0 0 83.00 76.50 - 88.50 1 0 6 .0 0 1 1 0 .0 0 1 0 2 .0 0 105.50 1 0 6 .0 0 9 1 .0 0 1 0 0 .0 0 108.00 88.50 128.00 . 107.00 9 8 .0 0 107.00 93.50 102.50T ra ce rs___ _________ __ - - - - - - - 80.50 - - - - - - 94.00 - - - 82.50 75.50
W omenN urses, industrial (reg istered )___ - 1 0 1 .0 0 - - 95.50 104.00 1 0 1 .0 0 103.50 104.00 105.00 95.00 107.00 109.00 1 0 0 .0 0 113.00 - 107.00 101.50 101.50 98.00 93.00
See footnotes at end of table.
Digitized for FRASER http://fraser.stlouisfed.org/ Federal Reserve Bank of St. Louis
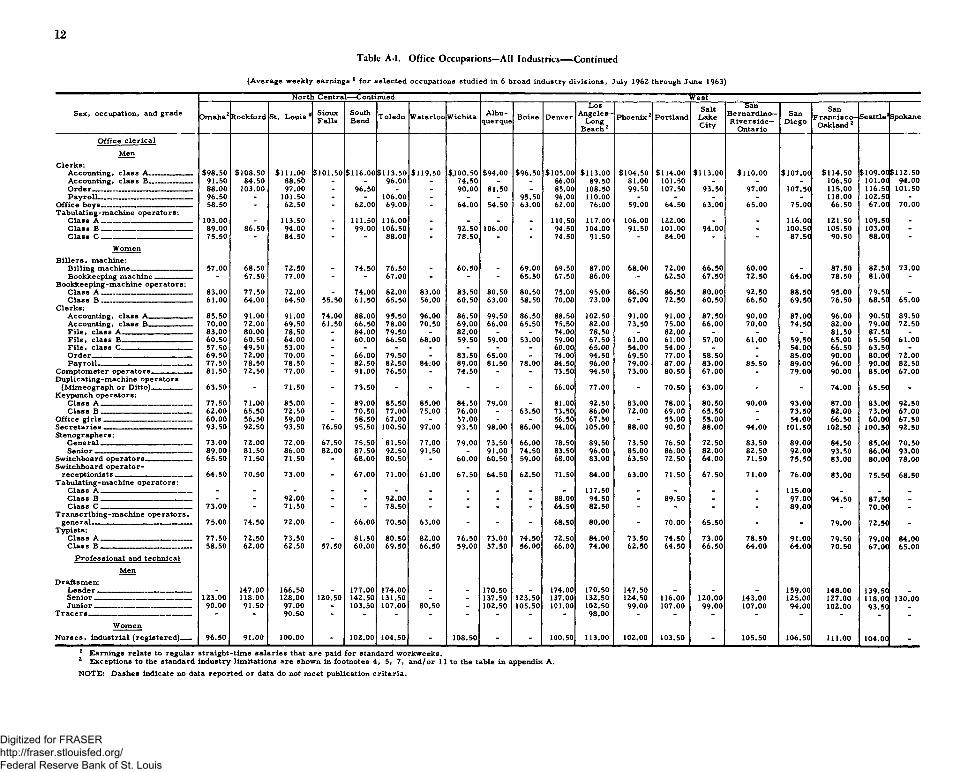
12
Table A-l. Office Occupations—All Industries— Continued
(Average weekly earnings 1 for selected occupations studied in 6 broad industry divisions, July 1962 through June 1963)
North Central— Continued w rSex, occupation, and grade Omaha2 Rockford St. Louis 2 Sioux
FallsSouthBend Toledo Waterloo Wichita Albu
querque Boise DenverLos
A n geles-Long
Beach2
Phoenix 2 PortlandSalt
LakeCity
SanBernardino—R iverside—
Ontario
SanDiego
SanF ra n cisco -
Oakland 2Seattle2Spokane
O ffice c le r ica l Men
Clerks:Accounting, class A .. ____ $98.50 $108.50 $ 1 1 1 .0 0 $101.50 $ 1 1 6 .0 0 $113.50 $119.50 $.100.50 $94.00 $96.50 $105.00 $113.00 $104.50 $114.00 $113.00 $ 1 1 0 .0 0 $107.00 $114.50 $109.00 $112.50Accounting, class B . . . 91.50 84.50 88.50 - - 9 6 .0 0 _ 74.50 - - 8 6 .0 0 89.50 81.00 101.50 - - - 106.50 1 0 1 .0 0 94.00O rder___________________________ 8 8 .0 0 103.00 97.00 - 96.50 - - 90.00 81.50 - 85.00 108.50 99.50 107.50 93.50 97.00 107.50 115.00 116.50 101.50P a yroll __ _ _ _ _ _ 96.50 - 101.50 - - 106.00 - - - 95.50 9 6 .0 0 1 1 0 .0 0 - - - - - 118.00 102.50 -
O ffice boys . . . . — 58.50 - 62.50 - 62.00 69.00 - 64.00 54.50 63.00 62.00 76.00 59.00 64.50 63.00 65.00 75.00 66.50 67.00 70.00T abulating - machine ope r ato r s :
Class A ___- ... .......- ______ 103.00 - 113.50 - 111.50 1 1 6 .0 0 - - - - 110.50 117.00 • 106.00 1 2 2 .0 0 - - 1 1 6 .0 0 121.50 109.50Class B 8 9 .0 0 86.50 94.00 - 99.00 106.50 - 92.50 106.00 - 94.50 104.00 91.50 1 0 1 .0 0 94.00 - 100.50 105.50 103.00 -Class C — 75.50 - 84.50 - - 8 8 .0 0 - 78.50 - - 74.50 91.50 - 84.00 - - 87.50 90.50 8 8 .0 0 -
WomenB illers , machine:
Billing m achine— _ „ 57.00 68.50 72.50 - 74.50 76.50 - 60.50 - 6 9 .0 0 69.50 87.00 6 8 .0 0 72.00 66.50 60.00 - 87.50 82.50 73.00Bookkeeping m achine---------------- - 67.50 77.00 - - 67.00 - - - 65.50 67.50 8 6 .0 0 — 62.50 67.50 72.50 64.00 78.50 81.00 -
Bookkeeping-machine operators:Class A _________________________ 83.00 77.50 72.00 - 74.00 82.00 83.00 83.50 80.50 80.50 75.00 95.00 86.50 86.50 80.00 92.50 88.50 95.00 79.50 -Clas 8 B _________________________ 6 1 .0 0 64.00 64.50 55.50 61.50 65.50 56.00 60.50 63.00 58.50 70.00 73.00 67.00 72.50 60.50 66.50 69.50 76.50 68.50 65.00
Clerks:Accounting, class A___________ 85.50 9 1 .0 0 91.00 74.00 8 8 .0 0 9^.50 9 6 .0 0 86.50 99.50 86.50 88.50 102.50 9 1 .0 0 9 1 .0 0 87.50 9 0 .0 0 87.00 9 6 .0 0 90.50 89.50Accounting, class B____________ 70.00 72.00 69.50 61.50 66.50 78.00 70.50 6 9 .0 0 6 6 .0 0 65.50 75.50 82.00 73.50 75.00 6 6 .0 0 70.00 74.50 82.00 79.00 72.50F ile , class A 83.00 80.00 78.50 - 84.00 79.50 - 82.00 - - 74.00 78.50 - 82.00 - - - 81.50 87.50 -F ile , class B___________________ 60.50 60.50 64.00 - 60.00 66.50 6 8 .0 0 59.50 59.00 53.00 59.00 67.50 6 1 .0 0 6 1 .0 0 57.00 6 1 .0 0 59.50 65.00 65.50 6 1 ,0 0F ile , class C_______________________ 57.50 49.50 53.00 - - - . - - - 60.00 65.00 54.00 54.00 - - 54.00 66.50 63.50 -O H «>r__-__________________________,___ 69.50 72.00 70.00 - 6 6 .0 0 79.50 - 83.50 65.00 - 74.00 94.50 69.50 77.00 58.50 - 85.00 90.00 80.00 72.00P a y ro ll-,, ________________________ 77.50 78.50 78.50 - 82.50 82.50 84:00 8 9 .0 0 81.50 78.00 84.50 9 6 .0 0 79.00 87.00 83.00 85.50 89.00 9 6 .0 0 9 0 .0 0 82.50
Comptometer operators___________ 81.50 72.50 77.00 - 9 1 .0 0 76.50 - 74.50 - - 73.50 94.50 73.00 80.50 67.00 - 79.00 9 0 .0 0 85.00 67.00Duplicating-machine operators
(Mimeograph or Ditto) 63.50 - 71.50 - 73.50 - - - - - 6 6 .0 0 77.00 - 70.50 63.00 - - 74.00 65.50 -Keypunch operators:
C lass A _ _______ ___ __ 77.50 71.00 85.00 - 89.00 85.50 85.00 84.50 79.00 - 81.00 92.50 83.00 78.00 80.50 9 0 .0 0 93.00 87.00 83.00 92.50Clas s B _________________________ 62.00 65.50 72.50 - 70.50 77.00 75.00 76.00 - 63.50 73.50 8 6 .0 0 72.00 69.00 65.50 - 73.50 82.00 73.00 67.00
O ffice g ir ls ________________________Secretaries ____ ___ — . _Stenographers:
General . . . . .
60.00 56.50 59.00 - 58.50 67.00 - 57.00 - - 56.50 67.50 - 55.00 55.00 - 54.00 66.50 60.00 67.5093.50 92.50 93.50 76.50 95.50 100.50 97.00 93.50 98.00 8 6 .0 0 94.00 105.00 8 8 .0 0 90.50 8 8 .0 0 94.00 101.50 102.50 100.50 92.50
73.00 72.00 72.00 67.50 75.50 81.50 77.00 79.00 73.50 6 6 .0 0 78.50 89.50 73.50 76.50 72.50 83.50 89.00 84.50 85.00 70.50Senior ___ . . . 8 9 .0 0 81.50 8 6 .0 0 82.00 87.50 92.50 91.50 - 9 1 .0 0 74.50 83.50 9 6 .0 0 85.00 8 6 .0 0 82.00 82.50 9 2 .0 0 93.50 8 6 .0 0 93.00
Switchboard operators— 65.50 71.50 71.50 - 6 8 .0 0 80.50 - 60.00 60.50 59.00 6 8 .0 0 83.00 63.50 72.50 64.00 71.50 75.50 83.00 80.00 78.00Switchboard operator-
reception ists --------------------------------------- 64.50 70.50 73.00 - 67.00 71.00 61.00 67.50 64.50 62.50 71.50 84.00 63.00 71.50 67.50 71.00 76.00 83.00 75.50 68.50T abulating - mac hine operators:
C lass A ____________ __________ — - - - - - - - - - - - 117.50 - - - - 115.00 _ _Class R ___ —..... - __ ______ - - 9 2 .0 0 - - 92.00 - - - - 8 8 .0 0 94.50 - 89.50 - - 97.00 94.50 87.50 -Class C -- - — ...— ___ 73.00 - 71.50 - - 78.50 - - - - 64.50 82.50 - - - - 89.00 70.00 -
Transcribing-m achine operators,general. ______ _ __ 75.00 74.50 72.00 - 6 6 .0 0 70.50 63.00 - - - 68.50 80.00 - 70.00 65.50 - - 79.00 72.50 -
Typists:Class A 77.50 72.50 73.50 - 81.50 80.50 82.00 76.50 73.00 74.50 72.50 84.00 73.50 74.50 73.00 78.50 9 1 .0 0 79.50 79.00 84.00Class B ----------------------------------------------- 58.50 62.00 62.50 57.50 60.00 69.50 66.50 59.00 57.50 56.00 6 6 .0 0 74.00 62.50 64.50 66.50 64.00 64.00 70.50 67.00 65.00
Professional and technical Men
Draftsmen:Leader — — S en ior__ . — _ 123.00
147.00118.00
166.50128.00 120.50
177.00142.50
174.00131.50
- _170.50137.50 123.50
174.00137.00
170.50132.50
147.50124.50 1 1 6 .0 0 1 2 0 .0 0 143.00
159.00125.00
148.00127.00
139.50118.00
-130.00
Jun ior_____________________ ____ _ 9 0 .0 0 91.50 97.00 - 103.50 107.00 80.50 - 102.50 105.50 1 01 .00 102.50 99.00 107.00 99.00 107.00 94.00 1 0 2 .0 0 93.50 -T racers __ — _ __ - - 90.50 - - - - - - - - 9 8 .0 0 - - - - - - -
WomenN urses, industrial (reg istered)____ 96.50 9 1 .0 0 1 0 0 .0 0 - 1 0 2 .0 0 104.50 - 108.50 - - 100.50 113.00 1 0 2 .0 0 103.50 - 105.50 106.50 1 1 1 .0 0 104.00 -
1 Earnings relate to regular straight-tim e salaries that are paid for standard workweeks.2 Exceptions to the standard industry limitations are shown in footnotes 4, 5, 7, and /or 11 to the table in appendix A.NOTE: Dashes indicate no data reported or data do not meet publication criteria.
Digitized for FRASER http://fraser.stlouisfed.org/ Federal Reserve Bank of St. Louis

Table A-la. Office Occupations—All Industries—Men and W omen Combined
(Average weekly earnings 1 for selected occupations studied in 6 broad industry divisions, July 1962 through June 1963)
13
Northeast
Occupation and grade Albany—Schenec
tady—T roy
Allentown—Bethlehem—
EastonB oston2 Buffalo B url
ington
Lawrence—
H averhill
Manchester
Newarkand
JerseyCity*
NewHaven
NewY o rk 2
Paterson—Clifton—Passaic
Philadelphia
P ittsburgh
P ortland
P ro v idence—Pawtucket
Scranton Trenton W ater-
buryW orces
ter York
Bookkeeping-machine operators:$78.50Class A _ ................................ $86.50 $65.50 $78.00 $84.50 - - - $79.00 $76.50 $87.50 $92.00 $79.00 - $68.50 $75.50 $82.50 - $81.00 $71.00
Class B -------- 61.50 57.50 65.50 59.00 $62.00 $60.00 $64.00 70.00 63.00 7 5.00 69.00 64.50 68.00 $54.00 60.00 56.00 69.50 $59.00 62.00 56.50Clerks:
Accounting, cla ss A __ __Accounting, c la ss B . . . —
101.50 131.50 90.50 109.00 94.00 83.50 79.50 98.00 100.00 100.00 107.00' 90.50 113.50 86.50 85.50 96.50 96.50 94.00 100.00 96.5074.50 94.50 70.00 77.50 71.50 71.00 60.00 79.50 79.50 77.50 78.00 73.00 85.50 67.50 65.00 86.50 73.50 69.50 69.50 69.00
F ile , class A____________________ 80.00 106.00 70.00 76.50 - - - 75.00 - 83.50 76.00 73.50 87.50 - 77.00 - - 82.00 78.00 -F ile , class B_ __ 60.00 83.00 59.50 59.00 - - - 61.00 62.50 68.50 65.00 59.00 66.00 - 60.00 64.50 58.00 63.50 57.00 51.00F ile , class C _ _______ ___ 56.00 74.50 55.00 52.50 - - 49.00 59.50 57.50 61.00 54.00 53.00 60.00 51.00 52.00 54.00 53.50 52.00 50.50 -O rder . 80.00 - 82.50 86.50 - 81.00 64.00 84.50 94.00 79.50 73.50 79.50 92.00 68.50 67.50 64.50 83.00 90.00 95.00 73.50p a y r o l l n ..................... 81.50 80.00 76.00 88.50 79.50 71.50 61.50 87.50 79.00 90.00 87.5(1 81.50 96.00 73.50 71.00 60.00 80.00 82.00 73.00 72.50
Com ptom eter operators___________Keypunch operators:
82.00 82.00 71.00 73.50 “ “ 60.50 82.50 79.00 81.50 79.00 73.00 78.50 73.00 71.50 78.50 ■ " 72.50 ■
Class A ,, , i - i 81.50 89.00 74.00 85.00 - 74.00 - 83.50 81.00 84.00 87.50 79.50 87.00 83.00 73.00 - 81.00 81.50 72.00 -Class P .... . 73.00 80.50 65.50 70.00 57.00 - 54.00 70.00 72.00 72.50 67.00 67.50 75.00 53.00 63.00 80.50 68.50 70.00 64.00 64.50
O ffice boys and girls 59.50 79.00 55.00 63.50 58.50 - - 63.50 62.00 62.00 65.50 59.50 63.00 55.50 54.50 61.50 62.00 65.50 55.00 -S e cre ta r ie s _______ _____________ ____ ____ 95.00 88.50 89.00 98.00 89.00 89.00 77.00 99.00 92.50 101.00 97.50 94.00 99.00 76.50 80.00 79.00 95.00 98.00 90.50 89.00Stenographers:
64.00 63.50G eneral — 77.50 74.00 72.00 77.50 - 71.50 59.50 79.00 76.50 80.50 76.50 74.50 82.00 63.50 73.50 77.50 74.00 72.50Senior «. ____ _ _ - 83.00 79.50 93.00 - - 67.00 89.00 80.50 92.50 86.00 84.50 91.00 - 76.50 65.00 82.00 92.00 74.50 -
Switchboard operators ____ 72.50 74.00 72.50 75.00 60.50 71.50 64.50 79.50 73.50 81.50 80.00 73.00 78.00 56.50 63.50 56.50 63.50 74.50 70.50 67.50Tabulating-m achine operators,
c la ss B Typists:
C lass A _ ___ _______
84.00 104.50 80.00 98.00 101.50 - 73.00 94.00 90.50 89.00 92.50 86.00 97.50 69.50 83.50 84.00 92.50 90.50 83.00 -
80.50 81.50 72.50 78.00 72.00 69.00 58.50 78.50 72.50 78.50 78.00 77.50 79.50 65.50 67.00 84.00 75.50 75.50 69.00 68.00Class B ____ _____________ ______ — 60.50 67.50 61.00 63.00 57.50 61.50 53.00 66.00 63.00 68.50 67.00 61.00 68.50 53.00 55.00 56.00 65.50 65.50 60.00 59.50
South
Bookkeeping-machine operators:Class A ---------------------------——— .Class B ------------------------------------
C lerks:Accounting, c la ss A___________Accounting, c la ss B----------------F ile , class A__________________F ile , c la ss B__________________F ile , cla ss C__________________O rder__________________________P a yro ll________________________
Com ptom eter operators_____ ____Keypunch operators:
Class A ________________________Class B ________________________
O ffice boys and g ir ls -------- ------- ----S ecre ta r ies_______________________Stenographers:
G en era l_________ ______________S en ior ---------------------------------------
Switchboard operators___________Tabulating-m achine operators,
cla ss B__________________________Typists:
Class A ____ ____-_____________C lass B ______ _________________
Atlanta B altim o r e 2
Beaumont—Port
Arthur
Birm ingham
Charleston,
W. Va.Charlotte
Chattanooga 2 Dallas 2 Fort
WorthGreen
ville Houston Jackson Jacksonville2
Little R ock - North
Little R ock 2
Louisville
Lubbock Memphis 2 Miami 2 New
Orleans
N orfolk— Portsmouth and Newport
N ews—Hampton
OklahomaC ity2
$75.00 $78.50 $84.00 $70.00 $78.50 $75.00 $70.00 $82.00 $69.50 $71.50 $68.50 $82.50 $78.00 $74.50 $75.50 $78.50 $75.5070.00 59.00 $63.00 61.50 $60.50 59.00 56.50 65.50 6 1 .0 0 $60.50 6 8 .0 0 61.50 61.50 59.00 63.00 $58.00 60.50 64.00 61.50 60.50 60.00
98.50 1 0 0 .0 0 134.00 95.50 115.50 83.50 93.00 9 1 .0 0 9 1 .0 0 81.50 1 0 1 .0 0 85.50 88.50 83.50 1 0 1 .0 0 81.50 9 6 .0 0 8 9 .0 0 9 6 .0 0 98.50 94.0076.50 72.50 90.50 71.00 73.50 72.50 66.50 70.50 67.00 62.00 78.00 65.50 67.50 62.50 71.50 63.00 6 6 .0 0 71.00 67.00 72.00 65.5078.00 69.50 114.50 74.50 - 6 8 .0 0 70.00 67.50 - - 78.50 - 6 8 .0 0 - 85.00 - - 70.50 73.00 - 65.5061.50 57.00 73.00 58.50 . 56.50 52.00 58.50 - - 62.00 52.00 61.50 52.50 61.50 - 61.50 56.50 56.00 - 55.0054.00 52.50 - 51.00 - 52.50 - 52.50 49.00 49.50 52.50 49.50 50.50 - 52.50 - 48.50 51.00 53.50 - 47.0078.00 74.50 99.50 77.00 117.00 75.50 76.50 75.00 67.50 71.00 8 9 .0 0 75.50 71.00 66.50 70.00 60.00 74.50 73.00 71.50 - 70.0084.50 85.00 1 0 2 .0 0 80.50 99.00 72.00 72.50 78.50 72.00 63.50 94.00 76.50 79.50 72.50 76.00 70.00 73.50 78.00 76.00 72.00 78.5076.50 77.50 76.50 65.50 79.00 6 6 .0 0 - 70.00 70.00 - 74.50 58.00 67.00 62.50 76.50 61.00 6 6 .0 0 62.00 67.00 - 69.50
87.00 74.00 1 0 0 .0 0 86.50 97.00 72.00 6 9 .0 0 73.50 78.00 _ 87.50 65.50 80.50 58.00 87.00 73.00 72.00 76.50 77.50 _ 73.506 8 .0 0 6 8 .0 0 75.00 63.00 70.00 61.50 55.00 65.00 66.50 58.00 70.50 58.00 62.00 56.50 67.50 60.50 61.50 70.50 62.50 62.00 65.5059.00 58.00 71.50 62.50 68.50 56.50 53.00 55.50 56.00 - 57.50 55.00 53.50 56.00 59.50 - 55.50 55.00 54.00 59.50 54.0093.50 9 1 .0 0 110.50 92.50 105.50 82.00 80.00 9 0 .0 0 84.00 75.00 99.00 77.00 8 8 .0 0 76.50 89.50 79.00 80.00 83.50 9 0 .0 0 86.50 83.50
75.50 71.50 8 9 .0 0 76.00 79.50 68.50 68.50 72.00 72.00 6 8 .0 0 78.00 63.00 71.00 59.50 72.50 65.50 68.50 68.50 73.00 70.50 70.0092.50 8 6 .0 0 105.50 93.00 106.50 84.00 84.00 87.50 - - 9 1 .0 0 76.50 73.50 75.00 89.50 82.50 9 2 .0 0 81.50 79.50 87.00 84.5070.00 68.50 74.50 6 9 .0 0 6 8 .0 0 64.00 56.00 6 8 .0 0 62.50 - 72.00 51.50 60.50 55.50 64.50 58.00 50.50 60.00 55.50 59.00 60.00
83.50 8 8 .0 0 108.00 82.00 1 0 2 .0 0 80.00 74.00 8 6 .0 0 86.50 78.00 96.50 77.50 85.00 - 89.00 - 80.50 83.50 84.50 8 8 .0 0 8 6 .0 0
70.00 73.50 82.50 75.00 87.00 66.50 70.00 70.00 6 6 .0 0 65.00 73.00 64.00 62.50 6 6 .0 0 76.50 _ 67.00 76.50 77.00 74.00 6 6 .0 063.00 60.50 69.50 59.50 61.50 60.00 55.00 57.50 54.00 53.00 61.50 56.50 56.50 51.50 60.00 56.00 59.00 59.50 61.50 53.00
See footnotes at end o f table,
Digitized for FRASER http://fraser.stlouisfed.org/ Federal Reserve Bank of St. Louis

14
Table A-la. Office Occupations—All Industries—Men and Women Combined-----Continued
(Average weekly earnings 1 for selected occupations studied in 6 broad industry divisions, July 1962 through June 1963)
Occupation and grade
South— Continued North Central
Raleigh R ichmond 2
SanAntonio2
Savannah2
Washington 2 Akron Canton Chicago 2 Cincin
natiC leveland2 Columbus
Davenport- Rock Island-
MolineDayton Des
Moines D etroit2 GreenBay
Indianapolis 2
KansasCity Milwaukee
Minneapolis— St. Paul
Muskegon—Muskegon
Heights
Bookkeeping-machine op erators :C lass A -------------------------------------- $72.50 $71.50 $69.00 - $82.00 f>79.00 - $94.00 $82.00 $88.50 $76.50 $84.00 $88.50 $76.00 $90.50 - $8 6 .0 0 $8 6 .0 0 $85.00 $81.50 -Class B -------------------------------------- 61.00 62.00 53.00 $59.00 67.50 64.50 $54.00 77.00 68.50 70.00 60.50 63.50 76.50 63.00 73.00 $56.50 6 6 .0 0 65.50 68.50 63.00 $64.50
C lerk s :Accounting, class A — ----------- 80.00 94.50 84.00 103.50 92.50 108.00 104.00 104.50 95.50 104.50 89.50 107.00 104.50 8 6 .0 0 1 2 0 .0 0 96.50 95.50 99.00 108.00 94.00 106.50Accounting, class B------------------ 63.00 73.00 6 1 .0 0 70.00 71.50 75.50 8 8 .0 0 80.50 71.00 79.50 6 8 .0 0 75.50 73.50 70.00 78.50 67.50 71.00 70.50 75.50 71.00 83.00File, class A----------------------------- - 80.00 _ - 79.50 84.50 . 80.50 76.00 83.00 74.50 85.50 87.50 63.00 93.50 - 78.50 76.50 76.00 73.50 -F ile, class B— -------------------------- 52.50 63.00 55.00 _ 6 8 .0 0 61.00 58.50 67.50 59.50 65.00 59.50 62.50 67.50 53.50 65.50 - 58.00 60.50 62.50 59.00 -F ile, class C----------------------------- _ 51.50 - - 57.50 - . 59.00 53.50 60.00 53.00 53.50 - 49.00 59.50 49.50 54.50 52.50 54.50 51.00 -O rder--------- — -------- — — ------ _ 82.00 74.50 _ 88.50 1 0 1 .0 0 91.50 96.00 8 6 .0 0 93.50 81.50 85.50 80.50 74.50 104.00 89.00 77.00 85.00 81.00 92.00 103.50P ayroll- ,,___ ___ —___r—T,___ 78.00 80.00 70.00 94.00 82.50 92.50 96.00 91.50 82.50 90.00 78.00 85.50 89.50 75.50 1 0 1 .0 0 81.00 84.50 85.50 84.50 80.00 76.50
Com ptom eter operators----------------- 60.50 66.50 66.50 - 81.00 78.00 73.50 81.00 73.50 79.50 80.50 71.50 79.00 73.00 89.50 - 77.50 75.50 71.00 72.50 80.00Keypunch op era tors :
Class A — — — ---------------- 72.50 78.00 6 8 .0 0 - 86.50 92.50 83.00 85.00 83.00 84.50 77.00 90.50 94.00 69.50 92.50 - 78.50 81.50 81.00 74.00 -Class B _________________________ 56.00 70.00 58.00 70.50 70.50 74.50 73.50 76.50 71.50 79.00 6 8 .0 0 77.50 74.50 59.50 87.50 55.00 71.00 73.50 70.00 6 8 .0 0 67.00
O ffice boys and g ir ls— -. ---------- 54.00 56.50 51.50 67.00 60.50 61.50 . 6 6 .0 0 60.00 65.50 59.50 63.00 62.50 55.50 69.00 - 59.50 58.00 61.50 56.00 -S ecre ta r ies ------------------------------------- 85.00 88.50 81.00 91.50 94.50 103.00 89.50 101.50 98.50 101.50 89.00 101.50 101.50 84.50 1 1 0 .0 0 8 6 .0 0 98.50 95.50 97.00 89.50 92.00Stenographers:
64.00 77.00 65.00 80.50 84.00 80.00 73.00 83.50 72.00 80.50 78.00 76.50 81.50 66.50 87.00 6 8 .0 0 81.50 77.00 76.00 74.00 70.00Senior — ------- ------------ --------- - 73.50 82.50 75.00 8 6 .0 0 96.50 92.50 87.50 92.50 89.00 93.50 87.00 90.00 103.50 79.00 1 0 1 .0 0 - 8 8 .0 0 8 8 .0 0 89.50 80.00 90.50
Switchboard operators- . — ------ 51.50 65.00 57.50 57.50 65.00 77.00 74.50 80.00 77.50 77.50 71.00 65.50 75.50 63.00 84.00 - 69.00 68.50 73.50 69.50 64.50Tabulating-machine operators,
cla ss B___________ ________________ 82.50 85.00 74.00 - 89.50 104.50 97.50 95.50 87.00 99.50 89.50 96.50 104.50 83.00 1 0 2 .0 0 87.00 90.50 94.00 94.00 89.00 96.50T yp ists:
Clas s A ______________________ 62.50 68.50 63.00 82.00 78.00 79.00 76.00 80.00 75.00 81.00 74.00 87.50 85.00 64.00 94.00 73.50 78.50 77.50 81.00 70.50 85.50C lass B -------------------------------------- 51.50 59.00 53.00 61.00 67.00 69.00 57.50 69.00 64.50 67.00 60.00 66.50 71.50 54.50 74.50 58.00 61.50 62.50 65.50 61.50 62.00
North Central— Continued West
Omaha2Rockford St. Lou is2 SiouxFalls
SouthBend Toledo W aterloo Wichita Albu
querque B oise DenverLos
A n geles-Long
B each2Phoenix2 Portland
SaltLakeCity
SanBernardino—R iverside—
Ontario
SanD iego
SanF ran cisco—
Oakland 2Seattle^ Spokane
Bookkeeping-machine op erators :$96.00Class A -------------------------------------- $80.50 $80.00 $73.00 _ $74.00 $82.00 $82.00 $83.50 $80.50 $81.50 $75.50 $95.00 $87.50 $86.50 $81.00 $92.50 $88.50 $79.50 -
Class B ------------------------------------ 61.00 64.00 64.00 $55.00 61.50 65.50 56.00 60.50 63.00 58.50 70.00 73.00 67.00 72.50 60.50 66.50 69.50 77.00 68.50 $65.00C lerk s :
Accounting, cla ss A ------------------ 90.50 98.00 99.50 88.50 101.00 106.00 106.50 91.50 97.50 89.00 94.00 105.50 95.00 102.00 100.50 96.00 89.50 103.00 97.00 101.00Accounting, class B------------------ 73.50 73.50 74.00 66.00 71.50 80.50 77.00 70.00 66.50 65.50 77.00 82.50 74.50 77.50 - 72.00 76.00 85.00 79.50 76.50File, class A----------------------------- 84.50 80.00 82.00 _ 85.50 79.50 _ 83.50 - - 74.50 79.50 - 82.50 82.00 - - 82.00 87.50 -File, class B----------------------------- 60.50 61.00 65.50 _ 60.00 66.50 68.00 60.50 61.00 53.00 59.50 68.00 61.00 61.50 57.50 61.00 60.00 65.50 65.50 61.00File, class C----------------------------- 57.50 49.50 54.00 _ _ - _ 66.50 _ _ 60.00 66.00 54.50 54.00 - - 54.00 68.50 63.50 -
L„, , , i- i n | 77.50 83.00 83.00 _ 83.50 80.50 _ 87.50 75.50 75.00 80.00 105.00 86.00 88.50 81.50 86.00 96.50 108.00 93.50 87.50Payroll*i , 80.50 79.50 82.00 _ 84.50 87.00 93.00 89.50 83.50 85.50 85.50 99.00 80.00 88.00 86.50 86.50 92.50 99.50 92.50 84.50
Comptometer operators----------------- 81.50 72.50 77.00 - 91.00 76.50 - 74.50 - - 73.50 95.50 73.00 80.50 67.00 - 79.50 90.00 86.00 67.00Keypunch op era tors :
78.00 71.00 86.00 _ 89.00 85.50 85.00 84.50 79.00 _ 82.00 92.50 83.00 78.00 80.50 90.00 93.00 87.00 83.00 92.50Class B —__-____________________ 62.50 65.50 74.00 _ 70.50 77.00 75.00 76.00 - 63.50 73.50 86.50 72.00 69.00 65.50 - 73.50 82.00 73.00 67.00
O ffice boys and g ir ls ---------------------- 59.00 59.00 61.00 _ 60.50 66.50 _ 61.00 55.50 60.50 59.50 72.00 58.50 57.50 59.00 67.50 61.50 66.50 64.00 68.50S ecre ta r ies --------------- ------ — ------Stenographers:
G eneral_________________________
94.00 92.50 94.50 76.50 95.50 100.50 97.50 93.50 98.00 86.00 94.00 105.00 88.00 91.00 88.50 94.50 101.50 102.50 100.50 92.50
74.00 72.00 72.50 67.50 75.50 81.50 77.00 79.00 74.00 66.00 79.00 89.50 73.50 77.50 73.50 83.50 89.00 84.50 85.00 70.50S en ior--------------------------- ------- - 89.50 81.50 86.00 82.00 87.50 92.50 91.50 - 91.50 74.50 84.00 96.50 85.00 86.00 82.00 82.50 92.00 93.50 86.50 93.50
Switchboard operators-------------------Tabulating-machine operators,
65.50 71.50 71.50 - 68.00 80.50 - 60.00 60.50 59.00 68.50 83.00 63.50 72.50 64.00 71.50 75.50 83.00 80.00 78.00
class B— — _____— — __________ 89.50 87.50 93.00 - 98.50 103.00 99.00 92.50 105.00 - 93.50 100.00 91.00 94.50 90.50 10T.50 99.00 101.00 95.50 -T yp ists :
91.00Class A ___________ -_________, 77.50 72.50 74.00 _ 81.50 80.50 82.00 77.00 73.50 74.50 74.00 84.00 73.50 74.50 73.50 78.50 79.50 79.00 85.00C lass B -------------------------------------- 58.50 62.00 63.00 57.50 60.00 70.50 68.50 59.00 57.50 5b. 00 66.00 74.00 62.50 65.00 66.50 64.00 64.00 70.50 67.00 65.00
Earnings relate to regular straight-tim e salaries that are paid for standard workweeks.2 Exceptions to the standard industry limitations are shown in footnotes 4, 5, 7, and /or 11 to the table in appendix A.
NOTE: Dashes indicate no data reported or data do not meet publication criteria.
Digitized for FRASER http://fraser.stlouisfed.org/ Federal Reserve Bank of St. Louis

15
Table A-2. Office Occupations—Manufacturing
(Average weekly earnings 1 for selected occupations studied, July 1962 through June 1963)
NortheastSex, occupation, and grade Albany-
Schenectady—Troy
Allentownr-Bethlehem—
.EastonBoston Buffalo Burl
ington
Lawrence—Haver
hill
Manchester
Newarkand
JerseyCity
NewHaven
NewYork
Paterson—C lifton-P assa ic
Philadelphia
P ittsburgh
P ortland
"Providence—Pawtucket
Scranton Trenton W ater-
buryW orces
ter York
Office c ler ica lMen
Clerks:Accounting, class A.___________Accounting, class B . „
$112.0082,00
$152.00117.50
$104.0078.5089.5092.5056.50
101.0087.0073.00
$123.50102.00
$107.00 - _ $107.5093.0095.00 94.50
$107.50 $107.5088.5085.50
102.0062.50
$115.0092.50
$105.0092.50
101.50 102.0062.50
108.5091.5075.50
$128.00107.50119.50116.50
69.50
120.50109.50
93.50
$112.00 $109.00 $105.50 $123.00Order . ... 91.50 109.50 - - - 93.00 - 86.50 $75.50Payroll- 125.50 “ * - $80.00 - 110.50 - 107.50 84.00
O ffice boys 62.00 cc nn 61.50
118.0099.00
- - - - - - 85.50T abulating - machine operators:
Class A 108.50 125.00111.50
DD.UU 59.00 63.50 “ 55.50 “
Class B “ 96!50An
“ ~ - 120.00 - - -Class C ___ _ _______ ___ ~ - - - 99.00 - 88.00 -78.50 “ 70.00 - - - - - ' - -
WomenB illers , machine:
Billing machine 66.50
83.50
60.50 69.50
86.5072.50
82.50
90.50 70.00
*70 CA 69.00
92.507A CA
78.00
O 0 CA
65.00
76.5062.00
$55.00 86.00 81.00
86.00
65.50Bookkeeping m achine__Bookkeeping-machine operators:
Class A- - - 69!50 -
f o.DO 77.00
70.5074.50
" -
69.00 60.00 74.50 76.50 65.00 ftn*nnoj«dU70.50 “
60.00- - 70.00
Clerks: 8 .00 “ 80.00 - 72.00 62.00Accounting, class A------------------Accounting, class B—______ ____F ile , class A__
89.5071.00
93.0081.00 93.00
86.5072.0074.0065.0062.0074.0074.0072.00
63.00
74.5068.00 55.0090.50
100.5081.00 69.50
$81.5073.00
$81.0058.00
95.50 81.0073.0067.5063.5079.00
83.5076.00
98.0079.50OA CA
100.5079.50
87.5073.5077.5063.5056.50
110.5087.5089.50 77.00
80.5069.00
85.50 68.0072.0060.0053.0070.0070.5075.00
75.0060.00
89.0079.00
89.5071.00
98.5070.50 70.50
F ile , class B. . 67.50 71.0070.DU70.0071.0076.00
“ ~ ■59.0058.0071.00 82.50
- 82.5062.00 63.50F ile , class C, - ” “
47.00 57.5059.00
70.00Order . _ , _ 80.50
84.0072.00
84.0071.50
62.5057.50
83.00 “ 90.5090.50
76.50- -
Payroll— _ 1_ 76.00 67.50 87.00 77 fiAcn77.0079.0079.00
71.0063.50
79.00 65.0067.50Comptometer operators 82!oO
If* PU75.00 87*50
86.50 82.50 73.00Duplicating-machine operators
(Mimeograph or Ditto)86.50
74.00
91.0084.0067.00
106.00
78.00 ”
Keypunch operators: Class A ... . 82.00
81.0092.5083.50
94.50
85.5079.5060.50 99.00
04. on on nn 86.00 81.0069.0060.5097.00
74.5066.0051.0082.00
71.50
Class B __ . o itsu68*50
yu.uu “ " 81.00 82.50 73.0067.5056.50
-O ffice girls _ _
93.50 95.00 89.50 71.506 7 ! 00Qo nn -
74 50 64.00
70.50
99.00 86.50 80.50
78.00 71.00 67.00
Stenographers: 77.UU 91.00 105.00 98.00 99.50 93.50 92.50General 80.50 71.50
89.00 82.00
64.50
75.50 80.00 80.00
72.50
87.00
69.50
80.5095.0085.00
76.50
94.00
79.00
71.50 81.00 77 nn 79.0086.00 84.50
75.0085.0081.00
89.0091.50 88.00
76.00
97.00
76.50
65.50 68.5081.5065.00
65.00
83.50
68.50
60.5067.50
77.50 78.50 78.00 73.00Senior * 84 50 97.00Switchboard operators . 86.50
74.00
81.50
78.50
88.00
74.00
78.00 “ 85.00 93.50 74.5076.50
68.00
-Switchboard operator-
receptionists _ . . . . . . . 67.00 60.50 72.50 55.00
84.00
75.50
82.00
75.00 64.50Tabulating - machine ope r ato r s :Ciass A -----Class B
-98.00
81.00
_88.50
_
Transcribing-m achine operators, general. .................. 69.50 71.50 74.50
92.50
76.00
90.50 ”
Typists: 75.00 73.00 “ " 70.50 68.50Class A . ... _ ... ................. 79.00
74.5071.0065.50
82.5067.50
69.0062.50
79.50 73.5066.00
a) cn 01 en 84.0077.00
67.5057.00
78.0068.50
75.5066.00
69.0062.00
67.5062.50Class B ----------- —.... ,,,,____ 65.50 - 54.00 69^50
06.3U71.50
79 00 70.00
81.5U64.00 - 56.00
P rofessional and technical
MenDraftsmen:
Leader _ . _ 160.50 125.00108.50
145.50129.50
93.00
155.50121.50
171.501 oA cn 171.00
143.50111.50
155.50117.50
161.50131.50
98.00
156.50120.00
146.00Senior . . . 136.00105.50
114.00 116.50 126!0094.50
l i t KA * ”103.5079.00
126.00Junior 93*50 104*50IfiO.DU
97.00 “ 114.00
Women95.00 93.00 97.00
Nurses, industrial (registered)___ 104.00 99.50 95.00 106.00 - 93.00 - 106.00 97.00 111.50 1 1 0 .0 0 100.50 107.50 81.00 85.50 80.00 103.00 101.50 95.00 -
See footnote at end of table.
Digitized for FRASER http://fraser.stlouisfed.org/ Federal Reserve Bank of St. Louis

16
Tabic A-2. Office Occupations—Manufacturing---- Continued
(Average weekly earnings 1 for selected occupations studied. July 1962 through June 1963)
South
Sex. occupation, and gradeAtlanta Balti
m ore
Beaumont—Port
Arthur
Birm ingham
Charleston,
W. Va.Charlotte
Chattanooga Dallas Fort
WorthGreen
ville Houston Jackson Jacksonville
Little R ock - North
Little RockL ou is
ville Memphis Miami NewOrleans
Norfolk—-----Portsmouth and Newport
News—Hampton
OklahomaCity
O ffice c le r ica lMen
Clerks:Accounting, class A $104.50 (121.0C (148.00 $117.50 $130.00 (107.5C (104.00 (120.00 - - - - - $115.00 $110.50 - $107.50 $117.00 -Accounting, class B___________ 80.00 97.50 116.00 85.50 - - - 86.00 98.00 - - - - - . 91.50 90.00 - 83.00 90.00 -O rder . „ 92.50 - - - - - - 85.50 $79.00 $99.50 - - - - - $85.50 82.50 - $80.00Payroll__________ ___ 97.00 121.50 - 100.50 - - - - * - - - - - - - - - 104.50 - -
O ffice boys 63.00 60.50 - - - - 56.00 - - - - - - 63.00 53.00 - 56.50 - 55.50T abulating - machine operators:
Class A _________________________ - 114.50 149.50 - - - 124.00 107.00 112.00 - - - - 117.50 - - - - -Class B ...... ........................... ........... 104.00 100.50 • - - $87.50 - 99.00 100.50 - - - - 97.50 - - 93.50 - -Class C - 88.50 - - - - - - - - - - " - - - - - -
WomenB ille rs , machine:
Billing machine _ __ _ - - - 83.00 - - 63.00 71.00 - 61.50 - - - - 69.00 60.50 64.00 - -Bookkeeping machine _ . 67.50 - - - - - - 74.50 - - - - - - - - - - - -
Bookkeeping-machine operators:Class A ___ 77.00 83.50 - - - - - 78.50 - - - - 83.50 - 72.50 75.50 - -Class B-, -.— .. __________ 75.00 - - - - 62.00 - 73.00 65.50 65.50 69.50 - - $66.00 68.50 68.00 72.50 64.50 66.00 -
Clerks:Accounting, class A _ 100.50 104.00 110.00 95.50 115.50 78.50 87.50 89.50 93.00 78.50 94.50 $86.50 $83.00 76.00 95.00 95.00 79.00 88.00 93.50 -Accounting, class B____________ 75.50 78.50 98.50 75.00 94.00 66.50 70.50 71.50 69.00 62.00 79.00 - 66.00 67.00 73.50 67.50 66.50 70.50 75.50 72.50F ile , class A ___________________ - - - 86.00 - - j - - - - - - - 77.50 . . _ _ _F ile , class B _ 71.00 65.50 - 73.00 - - - 64.50 - - - - - . _ _ _ _ _F ile , class C . . . - - - - - - - 54.00 - - - - - - - _ _ _ - _OrriAr 68.50 77.50 - - - 70.50 72.50 - 66.50 - - - - 80.50 71.00 - _ _ _P a yroll_________________________ 78.00 79.00 109.50 80.00 106.50 69.00 72.00 75.00 76.50 63.50 93.00 - - 70.50 76.00 75.50 73.50 70.00 71.00 78.00
Comptometer operators----------------- 89.00 85.00 75.00 - - - 78.50 75.00 - - - - 77.50 - 63.00 - - 73.00Duplicating-machine operators
(Mim eograph or Ditto) - - - - - - - - - - - - - - - - - - - -Keypunch operators:
Class A - 77.50 102.00 - - - 71.50 77.00 96.50 94.00 - - - 81.00 - - 87.00 - -Class B 86.00 81.50 - 77.00 - 66.00 62.50 69.50 75.00 59.50 75.00 - - - 74.50 69.00 _ _ _ 66.50
O ffice g irls 55.50 - - - - - 59.00 - - - - - - 62.50 - - - - -Secretaries 97.00 99.00 120.00 99.50 119.50 85.00 82.50 93.00 96.00 78.50 103.00 83.00 89.00 74.50 93.50 84.50 80.50 95.50 97.50 91.50Stenographers:
G enera l___ ,_____________________ 77.00 78.00 97.50 88.50 86 00 75.00 67.50 77.00 81.00 65.50 87.50 61.50 72.50 - 73.00 68.50 65.50 80.50 77.00 71.50Senior 95.50 91.00 111.50 84.00 110.50 - . 88.00 90.50 - - 102.50 - - - 87.50 94.00 73.00 81.50 _ 85.50
Switchboard operators--- ---------------- 91.50 84.50 96.00 91.50 91.50 - - 76.00 87.50 83.00 - - - 73.50 - 65.50 - - -Switchboard operator-
reception ists_____________________ 70.00 72.00 83.50 74.50 - 61.50 66.50 68.50 64.50 63.50 74.50 - - 63.50 70.50 66.00 63.00 70.00 - -Tabulating-machine operators:
Class A ---- --- - - - - - - - - - - - - - - - - - - - -Class B _________________________ - - - - - - - - - - - - - - - - - - - _
Transcribing-m achine operators,general 66.50 75.50 - 72.50 - - - 67.00 - - - - - - 72.00 59.00 - - - -
Typists:Class A _________________________ 79.00 79.00 90.00 - - 77.50 74.50 78.50 - 80.50 - - 62.50 75.00 79.50 - 82.50 - 68.00Class B -------------------------------------- 64.50 70.50 74.00 66.00 70.50 60.00 58.00 65.50 56.50 54.00 63.50 - 59.50 52.00 62.00 56.50 56.00 69.00 67.00 55.50
P rofessiona l and technical
MenDraftsmen:
Leader ........ ______________________ - 165.50 177.00 172.50 - - - 125.50 - - 153.50 - - - - - - - - -S e n io r .............. . „ ............. __ _ 134.50 128.50 150.00 140.00 149.00 104.50 113.00 107.50 114.00 - 125.50 - 129.50 - 125.00 128.00 113.50 134.00 - 107.00Junior . . . 97.50 96.00 110.50 100.00 114.00 77.50 84.00 85.50 91.00 - 89.00 - - - 88.50 87.00 86.00 90.50 - -
WomenN urses, industrial (reg istered)___ 109.00 106.00 120.00 102.50 113.00 - 94.50 95.00 110.00 78.50 117.50 - - 101.00 - - 106.50 - -
See footnote at end of table.
Digitized for FRASER http://fraser.stlouisfed.org/ Federal Reserve Bank of St. Louis

(Average weekly earnings 1 for selected occupations studied. July 1962 through June 1963)
Table A-2. Office Occupations—Manufacturing---- Continued
17
Sex. occupation, and grade
South— Continued North Central
Raleigh R ich mond
SanAntonio
Savannah
Washington Akron Canton Chicago Cincin
natiC leve
land ColumbusD avenport-
Rock Island— Moline
Dayton DesMoines D etroit Green
BayIndianapolis
KansasCity Milwaukee
Minneapolis— St. Paul
Muskegon—Muskegon
Heights
O ffice c le r ica lMen
Clerks:Accounting, cla ss A____________ - $115.00 $88.00 $113.50 $106.00 $131.00 $125.50 $116.50 $103.00 $115.50 $110.50 $117.00 $117.50 $116.00 $134.00 $108.50 $113.00 $113.50 $122.00 $100.50 $121.00Accounting, cla ss B____________ - 93.00 - - - - - 98.00 78.50 94.00 81.00 88.00 - _ 102.00 _ 86.50 92.50 92.50 84.50O rd er. ________ - - - - - 127.0C - 112.00 97.50 116.50 100.00 - . 93.50 - 129.00 _ 100.50 102.00 107.50 103.00 _P a yroll_____ . . ___ - - - - - - 115.00 103.00 - 108.00 - - 103.00 126.50 - 118.00 93.50 111.50 _
O ffice boys — __ _ - - - - - 62.50 68.50 63.00 70.00 65.00 - - 57.00 79.00 _ 62.00 59.00 63.50 57.50 _Tabulating-m achine operators:
C lass A . . ___ - - - - - 117.00 - 115.00 112.00 119.50 - 112.50 133.00 - 129.50 _ 115.50 - 120.50 102.00 _C lass B _ - 101.50 - - - 108.50 103.00 98.00 93.00 104.00 96.50 98.50 111.00 - 109.50 - 97.50 99.50 100.50 91.00 104.00
- - - - - - - 83.00 - 88.50 - - - - 95.00 - - - - -W omen
B ille rs , machine:B illing machine - - - - - 77.50 - 78.50 67,50 78.00 _ 64.50 76.50 - 81.50 _ 81.50 - 73.50 _ _Bookkeeping m achine __ - 75.50 - - - - - _ _ 80.00 _ _ _ _ _ _ _ _
Bookkeeping-machine operators:Class A _ - 74.50 69.50 - - - - 93.00 84.50 92.50 86.00 - 87.50 _ 101.00 _ _ 83.00 88.00 _ _Class B 67.50 “ - - 71.50 67.50 83.50 72.00 75.50 73.50 - 86.50 70.00 86.00 - 74.00 75.00 75.50 71.50 -Accounting, cla ss A - 83.50 88.00 97.50 90.50 104.00 83.00 99.50 97.50 100.00 87.50 106.00 96.00 88.50 119.00 80.00 94.50 97.50 99.50 87.00 82.00Accounting, cla ss R $61.50 81.50 63.00 65.00 76.00 80.00 87.00 79.00 69.50 81.00 73.00 83.00 77.50 75.00 90.50 64.50 79.00 69.00 78.50 69.00 82.50F ile , c la ss A_ - - - - - - - 81.50 78.50 82.50 - - _ _ _ _ 82.00 - 82.00 74.50F ile , c la ss B - 67.00 - - - 71.50 68.50 60.50 68.00 64.00 • 73.50 _ _ 81.00 _ 62.50 70.50 62.50 _F ile , c la ss C - - - - - - - 61.00 - 70.00 - - - - 64.50 _ 67.00 - 53.00 _O rd er.. --------- - - - - 82.50 67.00 - 78.00 73.00 79.50 72.50 73.00 65.00 65.50 92.00 _ 72.50 77.50 77.00 76.00 _P ayroll 65.50 84.50 68.50 - - 95.00 89.00 89.50 81.50 90.00 81.00 87.00 88.50 80.50 102.50 75.00 84.00 81.00 80.50 75.00 75.00Com ptom eter operators___________ - 66.00 - - - 88.00 74.50 85.00 72.00 83.50 91.50 - 95.50 97.00 . 80.50 79.00 77.50 77.00 80.00D uplicating-machine operators
(M im eograph or D itto)__ - - - - - - - 73.00 _ 75.50 _ _ _ _ 76.00 _ _ 68.00Keypunch operators:C lass A _________________________ - 89.00 - - - 96.50 83.50 86.50 88.50 87.00 85.00 91.00 96.50 80.50 103.00 _ 83.50 86.00 83.50 78.50 _Class B __ - 67.50 - - - 82.50 73.50 76.50 75.50 81.50 75.50 82.50 76.50 - 95.50 58.50 86.00 72.50 75.50 67.00 70.50O ffice g ir ls _ — - - - - - - - 65.00 - 64.50 - 61.00 - . 92.00 _ 68.00 52.00Secretaries _ 81.00 90.50 79.50 90.50 94.50 108.50 96.50 103.00 102.00 106.00 94.50 107.50 103.00 85.50 119.50 89.50 108.50 97.00 98.50 90.50 93.00Stenog raphe r s :G eneral - 74.50 67.50 75.00 82.50 73.50 83.00 74.00 83.50 83.00 83.00 82.50 71.50 92.50 67.50 85.50 81.00 79.00 71.00 71.00S en ior 71.00 88.00 78.00 - - 93.50 84.00 96.50 90.00 93.50 91.50 100.00 105.00 77.50 103.50 . 93.50 94.00 92.50 77.00 90.50Switchboard operators_____________ - 80.50 - - - 91.00 85.50 83.50 89.50 78.50 - 91.50 97.50 _ 86.50 82.50 87.50 78.50Switchboard operator-
re c e p tio n is ts ----- - 67.50 63.50 - 73.00 76.00 73.50 81.50 73.00 77.00 69.50 68.50 77.50 70.00 82.00 70.00 69.50 71.00 76.50 70.00 70.50Tabulating-m achine operators:Class A _ __ ----- - - - - • - - - - _ _ - _ _ 123.00 _ _ _ _Class B - - - - - 101.50 100.00 87.50 _ _ . 95.50 114.50 _ _ _ _ _
T ranscribing-m achine operators.g e n e ra l
Typists:- 67.00 - - - - * 81.00 71.50 77.50 71.00 - 75.50 73.50 93.50 - 69.50 70.00 76.00 74.00 -
Class A - 75.50 - - - 85.50 77.00 80.50 80.00 85.00 81.50 91.50 89.50 73.00 99.00 _ 82.50 81.50 87.00 71.50 87.00Class B 60.50 65.50 “ 63.50 69.00 75.50 60.00 70.00 68.00 72.00 67.00 72.00 76.00 66.00 87.00 58.50 67.00 68.50 70,00 62.00 63.00P rofession a l and technical
MenDraftsmen:
L e a d e r _ . _ - - - - - 169.00 153.50 154.50 - 167.00 - 146.50 148.00 _ 200.50 - 145.00 _ 171.00 142.00 _Senior 123.00 124.50 94.00 116.50 125.50 139.00 131.50 127.50 126.00 136.00 119.50 119.00 134.50 123.50 166.50 123.00 135.00 121.50 129.50 117.50 123.50Ju n ior 84.50 80.50 76.00 - 84.50 105.50 111.50 94.00 105.00 105.00 94.00 100.00 108.00 88.00 133.50 - 111.50 100.00 107.00 92.50 102.50
WomenN urses, industrial (reg istered )___ - 103.00 - - - 104.50 100.50 103.50 102.00 105.00 95.50 107.00 109.00 114.00 - 110.50 101.50 101.50 97.50 93.00
See footnote at end of table.
Digitized for FRASER http://fraser.stlouisfed.org/ Federal Reserve Bank of St. Louis

18
(Average weekly earnings 1 for selected occupations studied, July 1962 through June 1963)
Table A-2. Office Occupations—Manufacturing— Continued
North Central— Continued West
Sex, occupation, and gradeOmaha Rockford St. Louis Sioux
FallsSouthBend Toledo W aterloo Wichita Albu
querque Boise DenverLos
A n geles-LongBeach
Phoenix PortlandSaltLakeCity
SanBernardino—R iverside—
Ontario
SanDiego
SanF ran cisco—
OaklandSeattle Spokane
O ffice c le r ica l Men
Clerks:Accounting, class A _ . __ __ $109.50 $107.00 $115.50 - $118.00 $116.50 $121.50 $101,50 . _ $104.50 $114.00 $109.00 $103.50 $111.00 . _ $118.00 $114.00 $118.50Accounting, class B ___________ 94.50 - 97.50 - - 103.50 - - - - 83.00 89.50 - - - . . 112.00 - -Order _ _ _ - 101.00 97.50 - - - - - - - 91.50 110.50 106.50 113.50 _ . . 118.00 - -P a y ro l l___ __ - - 100.50 - - 106.50 - _ . . _ 104.50 _ . . _ _ _ 101.00 _
O ffice b o y s ____ _______________ __ - - 62.50 - 63.00 64.00 - 69.00 _ _ 58.00 81.00 - . _ _ _ 67.00 70.50 .Tabulating-machine operators:
Class A ______ — - - 111.00 - 110.00 116.00 - - . - 1 0 9 .0 0 119.50 - . . _ $115.50 124.00 - -Class B - 88.50 94.50 - 102.00 108.50 - _ - _ 95.00 105.50 _ 100.50 . _ 100.50 107.00 101.00 _Class C ______ — ...................... - - 82.00 - - - - 82.50 - - - 94.00 - - - - - - - -
WomenB illers , machine:
Billing m a ch in e________________ - 71.00 71.50 - - - - - - _ _ 83.50 _ 70.50 _ . - - _Bookkeeping m achine---------------- - - - - - - - - - - - - - - - - - - 92.00 -
Bookkeeping-machine operators:C lass A -------------------------------------- - - 88.50 - 88.50 86.50 83.50 - - - 77.00 94.50 - 88.50 _ - . 91.00 - -Class B _________________________ 69.50 69.00 77.00 . 73.50 74.50 _ 72.00 _ _ 72.50 9 0 .0 0 80.00 79.00 . . _ 88.00 83.00 .
Clerks:Accounting, class A ___________ 84.50 90.50 93.50 - . 94.50 106.50 94.50 - - 93.00 102.00 92.50 96.50 98.00 $95.00 95.00 102.00 101.50 89.50Accounting, cla ss B ________ 71.50 69.50 72.00 - 72.00 83.00 75.50 73.50 $72.00 - 77.50 84.00 77.50 77.50 73.00 72.50 82.00 91.00 89.50 83.50F ile , class A _________ _________ - - 75.50 . - - . - - _ . 92.50 _ . _ . _ 84.00 _ -F ile , class B _ _ - 64.50 65.00 - 67.50 74.00 - _ - _ - 78.50 - 62.50 _ . _ 74.50 80.50 .F ile , class C _______________ ___ . - 52.00 - . _ . . _ . . 74.00 _ _ _ _ _ _ . _Order _______________ _ 65.50 72.00 72.50 - - 84.00 _ _ - _ 79.50 89.50 80.00 74.00 . . . 90.50 9 0 .0 0 _P a y ro l l____ ___ _ ________ 81.00 78.50 75.50 - 84.00 86.50 85.50 - - _ 84.50 95.00 79.50 85.00 86.00 89.50 97.00 94.00 90.50 85.00
Comptometer o p e ra to rs_____ __ 82.50 77.00 77.50 - 92.00 80.00 - - - - 74.50 98.00 74.50 85.50 - - 90.50 92.00 96.00 -Duplicating-machine operators
(Mimeograph or D i t t o ) ________Keypunch operators:
~ " " " " " " ■ ~ “ • 80.00 * " ■ - 73.00 -Class A . 80.00 71.00 82.50 - 89.00 86.50 - 89.50 - . 83.00 96.50 88.50 77.00 . 91.00 95.00 87.50 85.00 _Class B . ................... 68.00 67.00 71.00 _ 77.00 80.50 77.50 83.00 _ _ 81.50 88.00 77.00 70.00 72.50 _ . 82.00 74.50 _
O ffice g ir ls _____________________ __ _ 57.00 57.50 - _ - - _ _ _ _ 71.00 - 57.00 _ _ _ 68.00 - -S ecre ta r ies ------------------------------------- 97.00 92.50 95.50 - 105.00 102.50 101.50 99.50 95.50 - 94.50 105.50 95.50 87.50 88.50 99.00 109.50 107.00 105.00 108.00Stenographers:
$67.50General _ _ ---- 71.50 72.50 73.00 - 79.00 81.00 81.50 81.50 - 82.00 93.00 77.00 77.50 74.50 84.50 93.00 87.50 87.50 -Senior „„„ „ . , 84.00 81.50 87.00 _ 91.50 92.50 93.00 . . _ 86.00 97.00 83.00 88.50 _ . 98.50 97.50 89.50 _
Switchboard operators - 79.00 82.50 - 81.00 90.00 - 82.50 - - 84.00 95.00 83.50 • 65.50 71.00 - 90.00 89.50 86.50 -Switchboard operator-
reception ists_____ ____ _ _____ 74.50 73.50 72.00 - 69.00 71.50 - _ - - 70.50 84.00 66.50 74.50 67.00 74.00 80.00 83.00 79.50 _Tabulating-machine operators:
Class A __ ____________ ___ - - - - - - - - - - - 120.50 - - - - 117.50 - - -Class b ____ . - . 91.00 - - . _ - - . - 106.50 - 88.00 - - 100.50 101.50 98.00 .
Transcribing-m achine operators,g e n e ra l_r_____ .__________________ 74.00 74.50 72.00 - 70.50 74.50 - - - - 76.00 83.00 - 76.50 - - - 86.00 - -
Typists:Class A ______ __ ________ _ - 72.50 78.00 . 84.50 80.50 84.00 84.00 - - 77.00 89.00 - 76.50 76.50 80.50 95.00 85.00 83.00 -Class B _________________________ 66.00 63.50 66.00 - 69.00 68.00 68.50 70.50 - - 68.50 83.50 70.50 64.50 - 64.00 83.50 77.50 74.00 -
P rofessiona l and technical Men
Draftsmen:Leader mmiiiiimii . 145.50 167.00 _ 180.50 174.00 _ _ . - . 162.00 149.50 - . . - 151.50 . .Senior ,, M„, , i,,,,,,,, , _!■■■■■-!-i- 115.50 118.00 127.00 $121.00 143.50 131.50 - . . 128.00 125.00 126.50 125.00 114.00 119.00 144.00 118.00 125.50 115.50 130.50Junior____ - ____________ 91.50 90.50 92.50 - 104.00 107.00 - - - 109.00 100.00 100.00 99.00 103.50 98.50 - 92.00 97.50 89.50 -
WomenN urses, industrial (reg istered )...- - 91.00 100.00 102.00 105.50 - 1 0 9 .0 0 - - 101.50 113.00 - 102.00 - 108.00 106.50 112.00 106.50
1 Earnings relate to regular straight-tim e salaries that are paid for standard workweeks. NOTE: Dashes indicate no data reported or data do not meet publication criteria .
Digitized for FRASER http://fraser.stlouisfed.org/ Federal Reserve Bank of St. Louis

Table A-2a. Office Occupations—Manufacturing—Men and W omen Combined
(Average weekly earnings1 for selected occupations studied* July 1962 through June 1963)
19
Northeast
Occupation and grade A lbany-Schenec-
tad y -T roy
Allentown-Bethlehem—
EastonBoston Buffalo Burl
ington
Lawrence—Haver
hill
Manchester
Newarkand
JerseyCity
NewHaven
NewYork
Pater son - Cliftonr- Passa ic
Philadelphia
P ittsburgh
P ortland
Provi-"*dence—Pawtucket
Scranton Trenton W ater-
buryW orces
ter York
Bookkeeping-machine operators;$8 6 .0 0$9 0 .0 0 - $86.50 $90.50 - - - $85.50 - $93.00 $93.00 $83.50 $70.50 - $76.50 - - - $71.00
Class B ________ ________ 6 9 .0 0 $61.00 72.50 70.00 $74.50 - - 76.50 $65.00 80.50 76.00 71.00 74.50 - 62.00 $6 0 .0 0 $80.00 - 72.00 62.50Clerks:
1 0 2 .0 0 ' 139.50 9 2 .0 0 112.50 100.50 $83.00 $84.00 99.50 9 0 .0 0 102.50 107.50 94.00 125.00 $97.00 8 6 .0 0 79.50 99.50 $9 2 .0 0 108.50 .Accounting. c la ss B_ 73.50 9 8 .0 0 73.00 86.50 75.00 74.50 59.00 83.00 83.50 82.00 82.00 80.50 95.50 6 9 .0 0 6 9 .0 0 62.50 81.00 71.00 73.00 72.00F ile , c la ss A _ . 113.00 74.00 - - - - 73.00 - 9 8 .0 0 - 78.50 9 1 .0 0 - 72.50 - - - 87.00 -F ile , c la ss B 6 8 .0 0 _ 65.00 72.00 - _ _ 67.50 _ 70.50 - 64.00 78.00 _ 6 0 .0 0 59.00 70.00 t>2 .0 0 64.00F ile , c la ss C ______ _____ ,____ _ _ 62.00 . - . - 63.50 _ 72.50 _ 57.00 _ _ 53.00 47.00 58.00 • ..O rder ..... 87.50 - 80.50 9 0 .0 0 - 82.50 62.50 84.50 96.50 78.50 83.00 84.50 106.00 - 73.00 6 2 .0 0 93.00 9 2 .0 0 9 6 .0 0 73.50Payroll 79.50 80.00 76.00 92.50 - 71.50 57.50 8 8 .0 0 78.50 9 0 .0 0 8 9 .0 0 83.50 102.50 72.00 71.00 60.00 82.50 82.50 74.00 72.50
Com ptom eter operators - - 72.00 72.00 - - - 82.00 75.00 87.50 - 79.00 86.50 63.50 75.00 - - - 78.00 -Keypunch operators:
8 6 .0 0Class A 82.00 92.50 75.00 85.50 - - - 84.50 75.00 9 0 .0 0 81.50 9 1 .0 0 - 74.00 - 81.00 82.50 73.00 -Class B 81.00 83.50 6 8 .0 0 79.50 . . . 72.00 69.50 74.50 70.50 6 9 .0 0 85.00 _ 6 6 .0 0 - 78.00 71.00 67.50 67.00
O ffice hoys and g ir ls 63.00 _ 56.00 63.00 _ . _ 64.50 56.50 63.00 63.50 6 2 .0 0 68.50 _ 55.50 _ 63.00 • 56.00 .S ecretaries _ 93.50 95.00 90.50 99.00 95.00 89.50 71.50 99.00 9 1 .0 0 105.00 99.50 97.50 1 0 6 .0 0 86.50 82.00 80.50 9 8 .0 0 99.50 ^3.50 92.50Stenographers:
81.00 72.00 . 75.50 80.50 - 71.50 . 81.00 78.00 84.50 79.00 75.00 8 9 .0 0 65.50 68.50 60.50 77.50 78.50 78.00 73.00_ 91.50 80.00 95.00 - - - 89.50 78.50 97.00 86.50 85.00 91.50 - 81.50 67.50 85.00 93.50 74.50 -
Switchboard operators 86.50 82.50 80.00 85.00 - - - 81.50 - 85.50 84.50 81.50 8 8 .0 0 - 65.00 - 84.00 82.50 77.50 .Tabulating-machine operators,
c la ss B - 109.00 87.00 1 0 2 .0 0 - - - 92.50 - 97.00 99.00 9 1 .0 0 105.00 - 84.50 - 9 8 .0 0 92.50 89.50 _Typists:
C lass A ....... _ 79.00 71.00 82.50 - 6 9 .0 0 - 79.50 73.50 82.50 79.00 81.50 85.00 - 67.50 - 78.00 75.50 69.50 67.5065.50 74.50 65.50 6 8 .0 0 * 62.50 54.00 69.50 6 6 .0 0 72.00 70.00 64.00 77.50 * 57.00 56.00 68.50 6 6 .0 0 62.00 62,50
South
Atlanta Baltim ore
fleau-monfc-Port
Arthur
Birm ingham
Charleston,
W. Va.Charlotte
Chattanooga Dallas F ort
WorthGreenville Houston Jackson Jack
sonvilleLittle R ock -
North Little Rock
Lou isv ille Memphis Miami New
Orleans
-----N orfo lk ------Portsmouth and Newport
N ew s—Hampton
OklahomaCity
Bookkeeping-m achine operators:$76.00 $83.50Class A - - - - - $78.50 - - - - - - $83.50 - $72.50 $76.00 - .
C lass B nr.......... ___ ____ ____ 75.00 - - - - $6 2 .0 0 - 72.50 $65.50 $66.50 $69.50 • - $6 6 .0 0 6 9 .0 0 $6 8 .5 0 72.50 69.00 $66.50 _Clerks:
Accounting* cla ss A . 103.00 113.50 $142.50 $108.50 $1 2 6 .0 0 80.00 $96.50 94.50 1 0 1 .0 0 84.50 1 0 9 .0 0 $88.50 $89.50 85.00 105,50 105.00 81.00 101.50 107.50 $9 2 .0 0Accounting, c la ss B 76.50 84.00 106.00 77.50 99.00 67.50 71.00 75.00 76.00 62.00 82.50 73.50 67.50 67.00 78.00 71.50 67.00 75.00 80.50 73.00F ile , c la ss A - . 125.50 8 8 .0 0 - - - «. . . , - . _ , 77.50 _ _ _ _■File* c la ss B 73.50 65.50 - 75.50 - _ _ 64.50 _ . _ _ . _ _ _ _ _Fite, c la ss C_______ ___________ - . - . - _ ' - 54.00 _ - _ _ _ _ . _ _ _ _ _O rder _ ----- - - 80.00 80.50 - 84,50 . 76.00 72.00 76.50 85.00 72.50 99.50 _ 76.00 8 6 .0 0 75.00 79.50 _ _ 79.00P ayroll ........... _ ^ 84.00 92.50 117.00 87.00 1 1 1 .0 0 71.50 72.50 75.00 78.00 63.50 98.5Q _ _ 71.00 78.50 77.00 75.00 81.00 73.50 84.Q0
Keypunch operators:87.00 85.00 " 75.00 ” ~ • 78.50 75.00 ■ - " “ - 77.50 - 63.50 - - 73.00
Class A - 77.50 1 0 2 .0 0 - 1 0 2 .0 0 - 71.50 77.00 96.50 - 94.00 . - - 82.00 _ . 87.00 _ _Class B _____ ______ _ 84.00 81.50 - 77.00 . 6 6 .0 0 63.00 69.50 75.00 59.50 75.00 _ . . 74.50 6 9 .0 0 _ _ 66.50
O ffice boys and g ir ls _ 59.50 60.50 75.00 75.00 77.00 . 59.00 57.00 60.50 _ 62.50 - _ _ 63.00 52.50 _ 57.00 „ 55.50
Stenographers:. 97.50 99.00 1 2 0 .0 0 1 0 0 .0 0 119.50 85.00 82.50 92.00 96.50 78.50 103.00 83.00 8 9 .0 0 75.00 94.00 85.00 81.00 95.50 97.50 91.50
General __ . ... ------- _ . 77.00 78.00 97.00 88.50 8 6 .0 0 75.00 67.50 77.00 81.00 65.50 8 8 .0 0 61.50 72.50 - 73.00 68.50 65.50 80.50 77.00 71.50Senior _ . 95.50 9 1 .0 0 111.50 84.00 110.50 - 8 8 .0 0 90.50 - - 102,50 „ - _ 87.50 94.00 73.00 81.50 _ 85.50
Switchboard operators .......1IT 9 2 .0 0 84.50 9 6 .0 0 91.50 91,50 - - 76.00 87.50 _ 83.00 .. _ _ 73.50 . 65.50 _ _ _Tabulating-m achine operators,
c la s s B 103.50 100.50 - - - 81.00 81.50 98.00 1 0 0 .0 0 - - _ - * 89.00 _ 92.50 _ _Typists:
C la s s A 79.00 79.50 - 9 0 .0 0 - - 77.50 74.50 79.00 - 80.50 - - 62.50 74.50 82.00 72.00 82.50 _ 6 8 .0 0C la s s B ____________________ _ 65.50 70.50 74.00 70.00 70.50 6 0 .0 0 58.50 65.50 56.50 54.00 63.50 “ 59.50 52.00 62.00 57.50 56.00 69.50 67.00 55.50
See footnote at end of table.
Digitized for FRASER http://fraser.stlouisfed.org/ Federal Reserve Bank of St. Louis

2 0
(Average w eekly earnings1 for selected occupations studied, July 1962 through June 1963)
Table A-2a. Office Occupations—Manufacturing—Men ancl Women Combined— Continued
South— Continued North Central
Occupation and gradeRaleigh R ich
mondSan
AntonioSavan
nahWashington Akron Canton Chicago Cincin
natiC leve
land ColumbusD avenport-
Rock Island— Moline
Dayton DesMoines D etroit Green
BayIndianapolis
KansasCity Milwaukee
Minne - apolis— St. Paul
Muskegon—Muskegon
Heights
Bookkeeping-machine operators:Class A $74.50 $70.00 - - _ - $95.50 $84.50 $92.50 $8 6 .0 0 - $87.50 - $ 1 0 1 .0 0 - $91.50 $83.00 $8 8 .0 0 $86.50 -Class B t------ 1...I--------r--------- .------- . 67.50 60.00 - - $71.50 $67.50 83.50 73.00 75.50 74.50 - 86.50 $70.00 8 6 .0 0 _ 74.00 75.00 75.50 71.50 -
Clerks:Accounting, class A ____________ $85.00 106.50 8 8 .0 0 $106.00 $98.00 114.00 106.00 107.00 99.50 108.00 98.50 $113.00 106.50 106.00 130.00 $94.50 103.50 108.00 113.50 94.00 $109.00Accounting, class B 63.50 86.50 64.50 70.00 78.00 80.00 9 2 .0 0 82.50 71.00 83.00 74.00 84.00 79.00 85.00 93.50 69.00 80.00 73.00 81.00 73.00 83.00F ile , class A .______ —------------— „ _ _ _ _ - 82.00 80.00 82.50 - - - _ - - 82.00 71,00 82.00 74.50 -F ile , class B___________________ 67.00 _ _ _ 71.50 - 68.50 60.50 6 8 .0 0 64.00 73.50 _ . 81.50 - _ 63.00 71.50 62.50 _F ile , class C___________________ - _ _ _ _ _ _ 61.50 _ 70.00 _ _ . _ 64.50 _ 67.00 _ _ 53.00 _O rder----------------- --------- ------------- _ 90.50 80.00 . 8 8 .0 0 112.50 _ 89 .50 ' 81.00 95.50 80.00 81.00 83.50 72.00 111.50 _ 81.00 93.50 92.50 91.50 103.50Payr o il ----------------------------- -------- - 67.00 85.00 74.00 88.50 82.50 96.50 99.50 92.50 83.50 93.50 81.50 89.50 91.50 81.00 108.50 76.00 88.50 83.50 84.50 77.00 76.00
Comptometer operators---- --------- —Keypunch operators:
- 6 6 .0 0 - - 8 8 .0 0 74.50 85.00 72.50 83.50 91.50 80.50 95.50 ■ 97.00 - 80.50 79.00 77.50 77.00 80.00
Class A _... . 89.00 _ . - 96.50 83.50 86.50 89.50 87.00 85.00 9 1 .0 0 96.50 80.50 103.00 - 83.50 8 6 .0 0 83.50 78.50 -Class R - _ 67.50 _ _ . 82.50 73.50 76.50 75.50 81.50 75.00 83.00 76.50 - 95.50 58.50 8 6 .0 0 72.50 75.00 67.00 70.50
O ffice boys and girls - . _ _ - 63.00 - 67.00 61.50 6 8 .0 0 64.00 64.00 69.00 58.50 81.50 _ 64.00 57.50 65.00 55.00 _
Stenographers:81.00 90.50 79.50 90.50 94.50 108.50 96.50 103.00 1 0 2 .0 0 106.00 94.50 107.50 103.00 85.50 119.50 89.50 108.50 97.00 98.50 90.50 93.50
General —---- . . . -------- —------------- — • 74.50 67.50 75.00 - 82.50 73.50 83.00 74.00 83.50 83.00 83.00 82.50 72.00 92.50 67.50 85.50* 81.00 79.00 71.00 71.50S en ior----------------------------------------- 71.00 8 8 .0 0 78.00 _ _ 93.50 84.00 97.00 90.00 93.50 91.50 1 0 0 .0 0 105.00 77.50 103.50 . 93.50 94.00 92.50 77.00 90.50
Switchboard operators Tabulating-machine operators,
• 80.00 - 9 2 .0 0 ~ 85.50 83.50 89.50 78.50 " 91.50 - 97.50 - 86.50 82.50 87.50 78.50 -class B - 98.00 - - - 107.00 99.50 98.50 9 1 .0 0 103.00 98.00 99.50 105.00 - 110.50 - 98.50 98.00 96.50 89.50 103.00
Typists:Class A - 75.50 - - - 85.50 77.50 80.50 80.00 85.00 82.00 91.50 89.50 73.00 99.00 . 82.50 81.50 87.00 71.50 87.00Class B -------------------------------------- 60.50 65.50 63.50 69.00 75.50 60.00
—i--------70.50 6 8 .0 0 72.00 67.00 72.00 76.00 6 6 .0 0 87.00 58.50 67.00 68.50 70.00 62.00 63.00
North Central— Continued West
Omaha Rockford St. Louis SouthBend Toledo W aterloo Wichita Albu
querque Boise DenverLo8
A n geles-Long
BeachPhoenix Portland
SaltLakeCity
SanBernardino^R iverside—
Ontario
SanDiego
SanF ran cisco—
OaklandSeattle Spokane
Bookkeeping-machine operators:Class A $79.50 - $90.00 $88.50 $86.50 $83.50 - . - $77.00 $94.50 - $88.50 - - _ $91.00 _ _Class re_____ __________________ 69.50 $69.00 76.50 73.50 74.50 - $72.00 _ . 72.50 9 0 .0 0 $80.00 79.00 _ . _ 8 8 .0 0 $83.00 _
Clerks:Accounting, cla ss A------------------ 95.00 98.50 103.50 113,50 109.50 114.50 97.50 . _ 97.50 105.50 98.50 99.50 $106.00 $99.50 $97.00 110.50 108.00 $104.00Accounting, class B 80.00 71.00 76.00 74.00 87.00 75.50 74.00 $72.00 - 78.00 84.50 78.50 78.00 - 73.50 82.50 97.50 91.00 87.50F ile , class A___—— — -------------- - - 76.00 . - - - _ - _ 92.50 - - - _ _ 84.00 _ _
F ile, class B .-------------- ------------- . 65.50 65.00 67.50 74.00 - . _ _ . 79.0 0 _ 62.50 . - _ 75.00 80.50 _
F ile, class C . - 52.00 - - - _ _ - _ 74.50 - - _ _ _ _ _ _
Order 73.50 80.00 85.00 92.50 83.50 - 85.50 83.00 - 86.50 105.00 94.00 88.50 8 6 .0 0 . 101.50 107.50 96.00 _
Payr '"'ll — ,.. 85.50 78.50 78.00 85.50 9 1 .0 0 95.50 - _ - 85.00 96.50 80.50 8 6 .0 0 90.00 90.00 98.00 98.50 94.00 8 8 .0 0Comptometer operators 82.50 77.00 77.50 9 2 .0 0 80.00 - - - - 74.50 1 0 1 .0 0 74.50 85.50 - - 90.50 92.00 97.00 _
Keypunch operators:Class a -------- -------------------- 80.00 71.00 83.00 89.00 86.50 - 89.50 - - 83.00 96.50 88.50 77.00 - 9 1 .0 0 95.00 87.50 85.00 _
Class B 6 8 .0 0 67.00 71.00 77.00 80.50 77.50 83.50 _ . 81.50 8 8 .0 0 77.00 70.00 72.50 _ _ 82.00 74.50 _
O ffice boys and g ir ls— ___ . . ._____ - 60.00 60.50 62.50 62.50 . 71.50 - - 57.00 76.50 . 58.50 59.50 _ 78.00 67.50 69.00 _
S e cre ta r ies ------ . .. .. . 98.00 92.50 95.50 105.00 102.50 1 0 2 .0 0 99.50 95.50 - 94.50 105.50 95.50 87.50 89.00 99.50 109.50 107.00 105.00 108.00Stenographer8 :
General - 71.50 72.50 73.50 79.00 81.00 81.50 81.50 - $67.50 82.00 93.00 77.00 77.50 74.50 84.50 93.00 87.50 87.50 _S e n io r ------------------ , . . . . ^ 84.00 81.50 87.00 91.50 92.50 93.00 - - _ 8 6 .0 0 97.00 83.00 88.50 _ _ 98.50 97.50 89.50 _
Switchboard operators - 79.00 82.50 81.00 90.00 - 82.50 _ - 84.00 95.00 83.50 65.50 71.00 _ 90.00 89.50 86.50 _
Tabulating-machine operators,class r e--------------------- ------------------------------------------- • 8 8 .0 0 93.00 101.50 104.00 - . - _ 96.00 105.50 - 95.50 _ . 100.50 105.00 1 0 0 .0 0
Typists:Class A - 72.50 78.00 84.50 80.50 84.00 84.00 - - 76.50 89.00 . 76.50 77.50 80.50 95.00 85.00 83.00 _Class B . 6 6 .0 0 63.50 6 6 .0 0 69.00 68.50 69.00 70.50 " - 68.50 83.50 70.50 64.50 64.00 83.50 77.50 74.00 -
1 Earnings relate to regular straight-tim e salaries that are paid for standard workweeks.
NOTE: Dashes indicate no data reported or data do not meet publication criteria .
Digitized for FRASER http://fraser.stlouisfed.org/ Federal Reserve Bank of St. Louis

Table A-3. Office Occupations—Nonmanufacturing
(Average weekly earnings 1 for selected occupations studied, July 1962 through June 1963)
21
Northeast
Sex, occupation, and grade Albany—Schenec
tady—T rov
Allentown—Bethlehem—
EastonBoston2 Buffalo Burl
ington
Lawrence—H aver
hill
Manchester
Newarkand
JerseyC ity2
NewHaven
NewY ork 2
Paterson—Clifton—P assa ic
Ph ila delphia
P ittsburgh
P ortland
P rov id en ce - Paw - tucket
Scranton Trenton W ater-
buryW orces
ter York
O ffice c le r ica l
MenC lerks:
Accounting, cla ss A_______ ____ $107.50 $109.50 $100.50 $ 1 1 0 .0 0 - - $80.50 $ 1 1 0 .0 0 - $103.00 - $96.00 $109.00 $97.00 $104.50 - _ - - -Accounting, cla ss B____________ 93.00 - 79.50 - $73.50 - - 96.00 - 80.50 - 82.00 102.50 - - - - _ - .Order _ _ 95.50 - - . _ 107.00 - 87.00 - 105.00 97.00 - - - _ . _ _P ayroll _ _ _ _ . _ _ _ . 95.00 _ 84.50 107.50 _ _ _ _ _ _ _
O ffice bny « ----- -------------- T. ------ 60.50 - 54.50 - - . - 64.00 $69.00 61.50 $6 6 .0 0 60.50 60.50 58.50 53.50 - - - . -Tabulating-machine operators:
Class A _ _ 97.00 - - - _ 108.00 117.00 106.00 - 102.50 109.00 _ _ _ _ _ _ _Class B ___________________ _ 83.50 _ 80.50 _ - ' _ _ 94.50 91.50 90.50 91.50 83.00 92.50 _ 82.50 $87.50 _ _ $70.50 _Class C 73.50 - 6 8 .0 0 - - - - 76.50 - 75.00 * 71.00 73.50 - - - - - - -
WomenB illers , m achine:
Billing machine _ _ 72.00 _ _ _ . 77.50 . 75.50 s 78.00 73.50 48.00 53.50 _ _ _Bookkeeping m ach ine__________ . - 58.50 - - - - 6 8 .0 0 - 77.50 - 62.50 67.50 - 53.00 - _ _ _ _
Bookkeeping-machine operators:C lass a — ---------------- ----- - - 72.00 - - - - 75.00 70.50 85.00 - 74.00 - - _ - $74.50 - _ _Class B 59.50 56.00 64.00 56.50 58.50 $58.00 61.50 6 6 .0 0 60.50 75.00 6 6 .0 0 62.50 6 6 .0 0 54.00 57.50 54.00 61.00 _ 58.50 $53.00
C lerks:Accounting, class A -___________ 94.50 - 84.00 93.00 86.50 86.50 77.50 89.00 1 0 1 .0 0 95.00 105.50 83.00 85.50 77.50 77.50 98.50 80.50 $ 1 0 0 .0 0 74.00 _Accounting, class B 72.00 70.00 67.00 6 6 .0 0 70.50 68.50 60.00 71.50 70.50 74.50 6 8 .0 0 67.00 71.00 61.00 61.50 78.00 . 64.50 65.00 58.50F ile , cla ss A___________________ _ _ 6 8 .0 0 - - - - 75.50 - 80.50 - 69.00 79.00 _ 81.50 _ _ _ _ .F ile , cla ss B 56.00 _ 58.00 51.50 . _ _ 60.00 62.50 6 8 .0 0 60.00 57.00 61.00 _ 59.50 _ _ _ 54.00 .F ile , cla ss C 55.00 _ 53.50 51.50 - _ 48.50 57.00 56.50 59.50 62.50 50.50 57.00 51.00 52.00 58.00 _ 49.50 48.50 _Order _ _ 69.50 - - - - 69.50 - 70.50 61.50 63.50 72.50 _ 58.00 _ _ _ _ _P ayroll 80.00 70.50 75.00 72.50 76.50 - 75.50 85.50 81.00 88.50 79.00 75.00 78.50 69.00 70.50 58.00 74.00 _ 69.50 _
Com ptom eter operators 83.00 - 70.00 75.50 - - - 82.50 81.50 79.50 77.00 70.00 75.00 78.50 67.00 - - _ _ _D uplicating-machine operators
(Mimeograph or Ditto) - - - - - - - 63.50 - 67.50 - 60.50 - - - - - - . -Keypunch operators:
Class A - - 73.50 84.50 - - - 82.00 85.00 82.50 93.50 77.50 82.00 - 70.50 . _ _ _ _Class B 6 6 .0 0 76.50 64.50 62.50 - . _ 6 8 .0 0 72.50 71.50 64.50 6 6 .0 0 66.50 52.50 59.50 82.50 _ _ 62.00 _
O ffice g ir ls _ 55.00 _ 54.00 - _ . _ 61.00 60.00 62.00 _ 53.00 57.00 _ 52.50 _ _ _ _ _
Secretaries 97.00 69.00 8 8 .0 0 94.50 82.50 84.00 80.50 98.50 93.50 99.50 91.50 89.50 9 2 .0 0 73.00 77.00 76.50 8 6 .0 0 87.50 83.50 75.00Stenographers:
General 73.00 81.50 70.00 72.00 - 71.50 57.00 77.00 75.50 79.00 71.50 73.00 73.50 63.50 60.00 65.50 62.50 _ 67.50 64.00S en ior ........_ _ _______ ______— _ _ 79.50 8 8 .0 0 _ _ _ 87.50 83.00 8 8 .0 0 _ 81.50 90.00 _ 72.50 60.50 _ _ _
Switchboard operators-------------------- 6 6 .0 0 65.00 70.50 67.00 56.50 64.50 65.50 78.00 72.50 80.50 74.00 69.50 74.00 53.50 62.50 53.50 58.00 57.50 65.00 _
Switchboard operator-receptionists 66.50 - 69.50 71.00 - - - 77.00 74.50 81.00 73.00 68.50 77.50 64.00 6 6 .0 0 52.50 _ _ 6 6 .0 0 62.50
Tabulating-machine operators:Class B - - 74.00 - - - - - . 83.00 - 80.00 85.50 _ 81.50 _ _ _ _ .C lass C _ _ 62.50 _ _ _ . _ _ 74.00 _ •65.50 _ _ 59.00 _ _ _ _ _
T ranscribing-m achine operators,general 70.50 - 69.50 62.50 - - - 70.00 72.00 78.50 . 65.50 71.00 56.50 61.00 _ _ _ 62.50 _
Typists: *Class A 72.00 - 73.00 65.50 - - - 76.50 71.00 77.00 - 73.50 77.00 65.50 64.50 . . _ 67.50Class B 58.50 56.50 59.00 58.00 - - 52.50 63.50 60.50 6 8 .0 0 63.00 59.00 63.00 53.00 54.00 53.00 58.50 62.00 55.50 -
P rofessiona l and technicalMen
Draftsmen:Leader _ . 158.00 - - - - 163.00 _ 181.00 _ - . _ _ _ _ _ _Senior _ _ 1 2 9 .0 0 126.00 _ _ _ 136.50 _ 131.00 _ 140.00 131.50 _ _ _ _ _ _ _Junior - - 98.00 - - - - 1 0 2 .0 0 - 98.50 - 109.00 1 0 1 .0 0 - - - - - - -
WomenN urses, industrial (reg istered )___ - - 96.00 - - - 103.00 - 104.00 - 95.00 - • - - - - - - -
See footnotes at end of table.
Digitized for FRASER http://fraser.stlouisfed.org/ Federal Reserve Bank of St. Louis
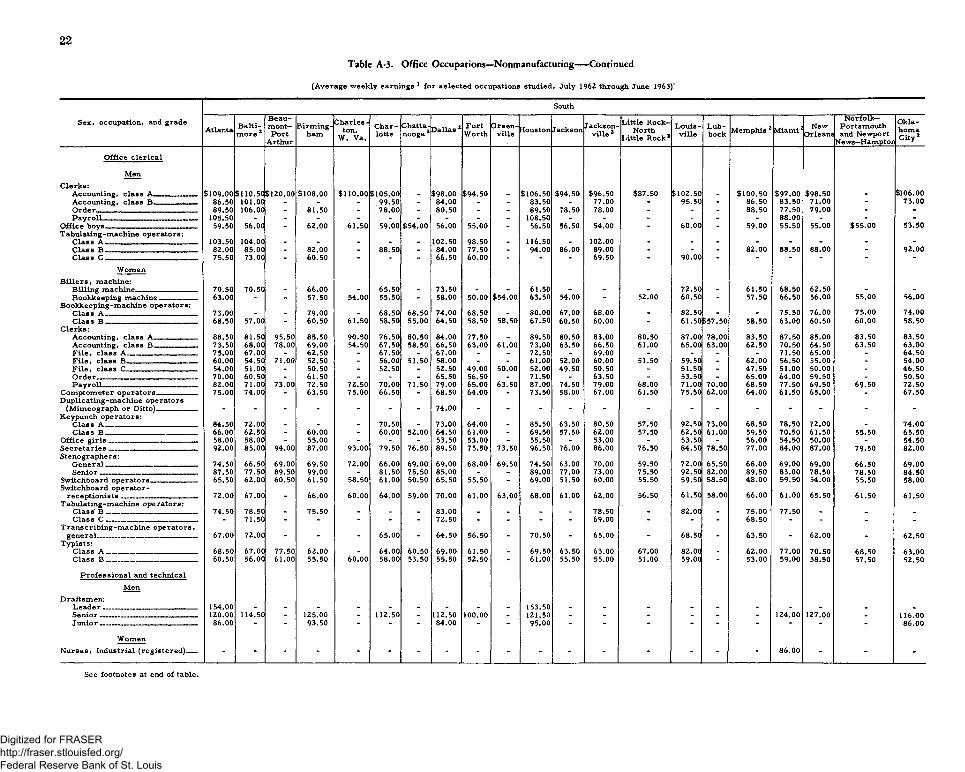
22
Table A-3. Office Occupations—Nonmanufacturing---- Continued
(Average weekly earnings 1 for selected occupations studied, July 1962 through June 1963)'
South
Sex, occupation, and gradeAtlanta Balti
m ore 2
Beaumont—Port
Arthur
Birm ingham
Charles - ton,
W. Va.Charlotte
Chattanooga2 Dallas 2 Fort
WorthGreen
ville Houston Jackson Jacksonville 2
Little R ock - North
Little R ock 2
Louis - v ille
Lubbock Memphis 2 M iam i2 New
Orleans
Norfolk— Portsm outh and Newport
News—Hamptor
OklahomaC ity 2
O ffice c le r ica l
MenClerks:
Accounting, class A _ $ 1 0 9 .0 0 $110.50 $1 2 0 .0 0 $108.00 $ 1 1 0 .0 0 $105.00 $98.00 $94.50 - $106.50 $94.50 $96.50 $87.50 $102.50 - $100.50 $97.00 $98.50 - $106.00Accounting, class B— — 86.50 1 01 .0 0 - - - 99.50 - 84.00 - - 83.50 - 77.00 - 95.50 - 86.50 83.50 71.00 - 73.00O rder _ 89.50 106.00 - 81.50 - 78.00 - 80.50 - - 89.50 78.50 78.00 - - - 88.50 77.50 79.00 - -Payroll__ ___ _____ 105.50 - - - - - - - - - 108.50 - - - - - - 8 8 .0 0 - - -
O ffice boys ____ ___ 59.50 56.00 - 62.00 61.50 59.00 $54.00 56.00 55.00 - 56.50 56.50 54.00 - 60.00 - 59.00 55.50 55.00 $55.00 53.50Tabulating-machine operators:
C lass A ___ 103.50 104.00 - - - - 102.50 98.50 - 116.50 - 1 0 2 .0 0 - - - - - - - -C lass B _________________________ 82.00 85.00 - 82.00 - 88.50 . 84.00 77.50 - 94.00 8 6 .0 0 89.00 - - - 82.00 88.50 8 8 .0 0 - 92.00Class C ....................... .. . . 75.50 73.00 - 60.50 - - - 66.50 60.00 - - - 69.50 - 9 0 .0 0 - - - - - -
WomenB ille rs , machine:
Billing m achine-------------------------- 70.50 70.50 6 6 .0 0 - 65.50 - 73.50 - - 61.50 - - - 72.50 61.50 68.50 62.50 - -Bookkeeping machine _ ____ ___ 63.00 - - 57.50 54.00 55.50 - 58.00 50.00 $54.00 63.50 54.00 - 52.00 60.50 57.50 66.50 56.00 55.00 56.00
Bookkeeping-machine operators:Class A . ____ 73.00 - - 79.00 - 68.50 68.50 74.00 68.50 - 80.00 67.00 6 8 .0 0 - 82.50 - 75.50 76.00 75.00 74.00Class B . . . . . . 68.50 57.00 - 60.50 61.50 58.50 55.00 64.50 58.50 58.50 67.50 60.50 60.00 - 61.50 $57.50 58.50 63.00 60.50 60.00 58.50
Clerks:Accounting, class A___________ 88.50 81.50 95.50 85.50 90.50 76.50 80.50 84.00 77.50 - 89.50 80.50 83.00 80.50 87.00 78.00 83.50 87.50 85.00 83.50 83.50Accounting, class B------------------ 73.50 6 8 .0 0 78.00 6 9 .0 0 54.50 67.50 58.50 66.50 63.00 61.00 73.00 63.50 66.50 61.00 65.00 63.00 62.50 70.50 64.50 63.50 63.00F ile , class A___________________ 75.00 67.00 - 62.50 - 67.50 - 67.00 - - 72.50 - 6 9 .0 0 - - - - 71.50 65.00 - 64.50F ile , class B — - _ - 6 0 .0 0 54.50 71.00 52.50 - 56.00 51.50 58.00 - - 61.00 52.00 60.00 51.50 59.50 - 62.00 56.50 55.00 - 54.00F ile , class C _ ______ 54.00 51.00 - 50.50 - 52.50 - 52.50 49.00 50.00 52.00 49.50 50.50 - 51.50 47.50 51.00 50.00 - 46.50O rder , .... ....: _ 70.00 60.50 _ 61.50 - - - 65.50 56.50 _ 71.50 - 63.50 - 53.50 65.00 64.00 59.50 - 50.50P ayroll__ _ 82.00 71.00 73.00 72.50 72.50 70.00 71.50 79.00 65.00 63.50 87.00 74.50 79.00 6 8 .0 0 71.00 70.00 68.50 77.50 69.50 69.50 72.50
Com ptom eter operators_____ _____ 75.00 74.00 63.50 75.00 66.50 - 68.50 64.00 - 73.50 58.00 67.00 61.50 75.50 62.00 64.00 61.50 65.00 - 67.50Duplicating-machine operators
(Mim eograph or Ditto)___________ - - - - - - - 74.00 - - - - - - - - - - - - -Keypunch operators:
Class A _ ___ _ __ 84.50 72.00 - - 70.50 - 73.00 64.00 - 85.50 63.50 80.50 57.50 92.50 73.00 68.50 78.50 72.00 - 74.00Class B ._ ___ . _____ ____ 6 6 .0 0 62.50 60.00 - 60.00 52.00 64.50 61.00 - 69.50 57.50 62.00 57.50 62.50 6 1 .0 0 59.50 70.50 61.50 55.50 65.50
O ffice girls 58.00 58.00 55.00 - - - 53.50 53.00 - 55.50 - 53.00 - 53.50 56.00 54.50 50.00 - 54.50Secretaries _ _____ _ 9 2 .0 0 85.00 94.00 87.00 93.00 79.50 76.50 89.50 75.50 73.50 96.50 76.00 8 6 .0 0 76.50 84.50 78.50 77.00 84.00 87.00 79.50 82.00Stenographers:
General _ . __ 74.50 66.50 69.00 69.50 72.00 6 6 .0 0 6 9 .0 0 6 9 .0 0 6 8 .0 0 69.50 74.50 63.00 70.00 59.50 72.00 65.50 6 8 .0 0 6 9 .0 0 6 9 .0 0 66.50 6 9 .0 0Senior __ ____ ____ 87.50 77.50 89.50 99.00 - 81.50 75.50 85.00 - _ 8 9 .0 0 77.00 73.00 75.50 92.50 82.00 89.50 83.00 78.50 78.50 84.50
Switchboard op erators..___________ 65.50 62.00 60.50 61.50 58.50 6 1 .0 0 50.50 65.50 55.50 - 6 9 .0 0 51.50 60.00 55.50 59.50 58.50 48.00 59.50 54.00 55.50 58.00Switchboard operator-
receptionists _ _ • __ 72.00 67.00 - 6 6 .0 0 60.00 64.00 59.00 70.00 6 1 .0 0 63.00 6 8 .0 0 61.00 62.00 56.50 61.50 58.00 6 6 .0 0 6 1 .0 0 65.50 61.50 61.50Tabulating-machine operators:
Class' B . _ — __ 74.50 78.50 - 75.50 - - - 83.00 - - - - 78.50 - 82.00 - 75.00 77.50 - _ _Class C ____________ _ _________ - 71.50 - - - - _ 72.50 . _ - - 6 9 .0 0 - - - 68.50 - - _ _
Transcribing-m achine operators,general___________________________ 67.00 72.00 - - - 65.00 - 64.50 56.50 - 70.50 - 65.00 - 68.50 - 63.50 - 62.00 - 62.50
Typists:Class A __ __ __ __ __ 68.50 67.00 77.50 62.00 - 64.00 60.50 6 9 .0 0 61.50 - 69.50 63.50 63.00 67.00 82.00 - 62.00 77.00 70.50 68.50 63.00Class B _________________________ 60.50 56.00 6 1 .0 0 55.50 60.00 58.00 53.50 55.50 52.50 - 61.00 55.50 55.00 51.00 59.00 - 53.00 59.00 58.50 57.50 52.50
P rofessiona l and technical Men
Draftsmen:L ea d er______________ ______ __ 154.00 - - - - - - - - - 153.50 - - - - - - - - _ _Senior _________ __ __ __ 1 2 0 .0 0 114.50 - 125.00 - 112.50 - 112.50 1 0 0 .0 0 - 121.50 - - - - - - 124.00 127.00 _ 1 1 6 .0 0Junior __ _ . _____ 8 6 .0 0 “ " 93.50 - - 84.00 - - 95.00 - - - - - - “ - 8 6 .0 0
WomenN urses, industrial (reg istered)___ - - - " " - - - - - - - - - - - - 8 6 .0 0 - - -
See footnotes at end of table.
Digitized for FRASER http://fraser.stlouisfed.org/ Federal Reserve Bank of St. Louis

23
(Average weekly earnings1 for selected occupations studied, July 1962 through June 1963)
Table A-3. Office Occupations—Nonmanufacturing-----Continued
South-Continued North Central
Sex, occupation, and gradeRaleigh R ich
m ond2San
Antonio2Savannah2
Washington2 Akron Canton Chicago2 Cincin
natiCleveland2 Columbus
D avenport- Rock Island—
MolineDayton Des
Moines D etroit2 GreenBay
Indianapolis 2
KansasCity Milwaukee
Minneapolis— St. Paul
Muskegon—Muskegon
Heights
O ffice c le r ica l
MenClerks:
Accounting, cla ss A . . . . $8 6 .0 0 $104.00 $89.50 $116.50 $98.00 $109.50 - $ 1 1 0 .0 0 $104.00 $109.50 $95.50 $106.50 $114.00 $99.50 $126.50 $108.50 $106.50 $101.50 $115.00 $108.00 -Accounting, cla ss B_ 72.00 83.00 - - 80.50 - - 92.50 - 92.00 9 0 .0 0 - . 81.00 9 2 .0 0 - 93.50 79.00 8 6 .0 0 87.00 -Order . 82.50 - _ 99.50 _ _ 114.00 107.00 103.00 88.50 - _ _ 117.50 _ 86.50 97.00 103.00 1 0 0 .0 0 -P ayroll _ _ _ _ _ _ _ 107.00 _ _ _ _ _ _ 106.50 _ _ - _ _ _
O ffice boys _ 57.50 51.50 - 60.50 - - 67.00 61.00 67.00 62.00 - - 56.00 63.50 _ 58.00 56.50 - 63.00 -Tabulating-raachine operators:
Class A ------------ . _ _ _ _ _ - 115.00 - 116.00 1 1 1 .0 0 _ - 98.50 117.00 - 106.50 1 1 0 .0 0 _ 105.00 -Class B _________________________ . 89.50 71.00 _ 89.50 _ _ 95.00 9 0 .0 0 99.00 90.50 - - 8 6 .0 0 98.00 85.50 8 8 .0 0 94.00 95.50 90.50 .Class C - 61.50 57.00 - 85.50 - - 8 8 .0 0 - 79.50 83.00 - - 63.50 8 6 .0 0 - 69.50 78.00 - 74.00 -
WomenB illers , machine:
Billing m a ch in e ..... .. .. .— —— — 60.00 80.50 71.00 70.50 61.00 84.50 64.50 6 8 .0 0Bookkeeping m ach ine---------------- - 58.50 48.00 - 66.50 - - 70.50 - 6 8 .0 0 61.50 - - - 63.50 - - 62.50 70.00 67.50 -
Bookkeeping-machine operators:Class A . . 71.50 69.00 - _ 82.00 73.50 - 92.50 78.50 84.00 70.50 81.50 90.50 74.00 85.00 - 83.50 89.50 82.00 79.50 _C lass B 61.50 60.50 52.50 56.00 67.00 61.50 $52.00 75.50 6 6 .0 0 6 8 .0 0 58.00 62.00 6 6 .0 0 62.00 69.50 - 62.50 62.00 64.00 61.50 -
C lerks:Accounting, cla ss A 74.00 84.00 76.00 79.50 89.00 87.50 - 97.00 82.00 93.50 81.50 87.50 86.50 75.50 95.50 82.00 83.50 89.50 92.50 84.50 _Accounting, cla ss B 61.00 68.50 59.00 65.50 69.00 67.50 64.00 77.00 69.50 74.50 64.00 6 8 .0 0 62.00 65.00 72.00 64.00 66.50 69.00 72.00 6 8 .0 0 $84.50F ile , cla ss A— — — ________ . 73.00 _ . 76.50 - - 79.00 - 81.00 71.00 83.00 - 62.50 82.00 - 76.50 77.00 - 72.00 -F ile , class B__________________ 51.00 59.50 54.50 _ 6 8 .0 0 57.50 _ 66.50 59.00 63.00 58.50 58.50 .58.00 53.00 59.50 _ 57.50 59.00 58.00 58.50 _F ile , cla ss C _ 51.00 _ _ 57.50 _ _ 58.00 53.00 56.00 50.50 53.00 - 49.00 58.00 50.00 53.00 52.00 53.50 50.50 _Order _T----- _ _ _ _ 67.00 _ _ 78.50 75.50 69.50 _ _ 6 6 .0 0 _ 72.00 _ 60.00 71.00 6 6 .0 0 69.00 _P ayr<vn.„..... _____ _____ . . . . . . . . . . _ 74.50 6 6 .0 0 _ 80.00 82.50 _ 8 8 .0 0 80.50 83.50 73.50 73.00 83.50 70.00 84.50 _ 77.50 84.00 81.50 80.50 _
Comptometer operators— — __ 59.50 66.50 67.00 - 81.50 65.50 - 79.00 75.00 76.00 72.00 - 67.50 71.00 78.00 - 75.50 74.00 68.50 71.00 -D uplicating.m achine operators
(M im eograph or Ditto) - 67.00 - - - - - 76.50 - 65.00 - - - - - - 61.00 - - - - .Keypunch operators:
Class A ------ - - 72.00 70.50 63.50 _ 83.50 85.00 - 83.00 75.50 79.50 69.50 - - 64.00 85.00 _ 74.00 77.50 77.50 72.00 _Class B ___ 55.50 70.00 58.00 _ 69.50 6 8 .0 0 _ 76.50 64.50 77.50 64.50 69.00 67.00 59.00 77.50 _ 64.50 74.50 65.00 68.50 60.00
O ffice g i r ls ------------- ----------------— - _ 53.00 _ _ _ _ _ 63.50 56.50 59.00 56.00 62.50 _ 54.50 58.50 _ 57.00 59.50 57.00 52.50 _Secretaries ---- 85.50 85.00 81.00 88.50 94.50 93.00 80.00 1 0 0 .0 0 93.50 94.50 86.50 90.50 97.00 83.50 96.50 77.50 89.00 94.50 94.00 88.50 86.50Stenographers:
General . . ____ _____ 64.00 77.00 61.50 8 6 .0 0 83.50 71.00 72.50 83.50 69.00 77.50 73.00 66.50 79.50 65.00 79.00 62.00 77.50 73.50 72.50 75.00 _Senior . . . . . ------ ----- ------------------- 73.50 80.00 74.50 _ 96.00 83.50 _ 8 9 .0 0 82.50 9 2 .0 0 76.50 77.50 98.50 79.50 9 2 .0 0 _ 79.50 84.00 83.00 83.00 _
Switchboard operators 52.00 61.50 57.00 53.50 65.00 68.50 66.50 78.00 73.00 71.00 67.50 58.50 6 6 .0 0 59.00 74.00 - 60.00 65.50 66.50 67.50 -Switchboard operator-
55.50receptionists 59.00 65.50 - 75.00 74.'50 _ 80.50 72.00 74.50 65.00 60.50 65.00 64.00 73.50 - 69.00 69.00 70.00 6 8 .0 0 -Tabulating.m achine operators:
Clas s B _________ _ 76.50 _ _ 83.00 _ _ 9 2 .0 0 74.50 90.50 80.50 - _ 73.50 87.00 - - 8 8 .0 0 83.50 81.50 -Clas s C __________ . 62.50 _ _ _ - _ 82.50 65.00 79.00 - _ - 57.50 - _ 6 6 .0 0 _ 72.00 65.00 -
Trans cribing-m achine operators, general . — 57.50 6 6 .0 0 75.00 67.00 _ 79.00 69.00 72.00 65.00 . _ 61.00 73.50 6 6 .0 0 6 6 .0 0 68.50 66.50
Typists:Class A _____ 60.50 66.50 60.50 - 78.00 70.50 - 79.50 68.50 76.00 70.00 70.50 73.00 61.00 84.00 - 71.50 73.50 71.00 70.00 .Class B ------------------------------------ 50.00 58.00 51.50 - 66.50 59.50 54.00 68.50 60.00 63.50 57.50 58.50 61.00 54.00 65.50 56.50 59.50 59.50 61.00 61.00
P rofessiona l and technical Men
Draftsmen:L ea d er__________ ____ ___ _______ . - _ _ _ _ - 171.00 _ _ _ _ - - - _ _ _ _ _ _S en ior________ _ . 138.50 _ _ 120.50 _ 1 2 9 .0 0 149.00 - 125.00 _ - - - 148.00 _ 110.50 117.50 _ 125.50 _Junior . . . - - - - 9 1 .0 0 - - 119.50 - 116.50 85.50 - - - 106.00 - 84.00 - - 97.00 -
WomenN urses, industrial (reg istered )___ - - - - - - - 103.00 - - " - - 1 104.50 - - - -
See footnotes at end of table.
Digitized for FRASER http://fraser.stlouisfed.org/ Federal Reserve Bank of St. Louis

24
(Average weekly earnings 1 for selected occupations studied, July 1962 through June 1963)
Table A-3. Office Occupations—Nonmanufacturing— Continued
North Central— Continued West
Sex, occupation, and gradeOmaha2 Rockford St. Louis2 Sioux
FallsSouthBend Toledo W aterloo Wichita Albu
querque B oise DenverLos
A n geles-Long
B each2
Phoenix2 PortlandSaltLakeCity
SanBernardino—
R iverside—Ontario
SanD iego
SanFrancis c o -
Oakland 2Seattle2 Spokane
O ffice c le r ica l Men
C lerk s :Accounting, class A—---------------- $93.50 $106.50. $113.00 _ $1 0 0 .0 0 $94.50 $105.00 $111.50 $99.50 $120.50 $114.00 _ $108.00 $111.50 $106.50 $ 1 1 0 .0 0Accounting, cla ss B-------------- --- _ _ 85.00 _ _ _ _ _ - - 87.50 9 0 .0 0 - 1 0 1 .0 0 - - - 100.50 - -O rder— ------- -------------- ---- _ _ _ 97.00 _ _ - _ _ - 83.50 107.50 94.00 104.50 92.00 $95.50 - 114.00 115.00 -P ayroll-— - .— — — — — — — — — _ - 102.50 _ - - - - - - - 116.50 - - - - - 112.50 - -
O ffice boy8 ----------------- ------------- 58.00 - 63.00 _ _ $76.50 - - - - 63.00 73.00' 58.50 66.50 - - - 6 6 .0 0 64.50 -Tabulating-machine operators:
1 2 0 .0 0Ola88 A _________________________ _ _ 115.50 _ _ _ - - - - 111.50 114.00 - - - - - - -Class B .............................- ............. 88.50 _ 93.50 _ _ _ _ _ - - 94.50 103.00 - 1 0 2 .0 0 94.50 - 1 0 1 .0 0 105.00 106.00 -Class C ..........- ................................
WomenB illers , machine:
75.50 74.00 8 8 .0 0 84.00 90.00
Billing m achine— -------------- ------ 56.50 $65.00 72.50 _ _ _ _ _ - - 69.50 88.50 6 8 .0 0 72.50 67.50 - 91.00 8 6 .0 0 70.50Bookkeeping m achine---------------- _ - - - - - - - - $64.50 64.50 8 6 .0 0 - 62.50 67.00 - 59.00 80.50 75.50 -
Bookkeeping-machine operators :87.50 98.00 78.00Class A -------- — — ------- — - 8 6 .0 0 6 6 .0 0 * 65.50 _ 73.50 80.00 78.00 73.00 96.00 84.50 84.00 80.50 - -
Class B — ------- — ------- ------ 59.00 _ 59.00 $53.50 59.50 62.00 $52.50 57.00 63.00 58.00 69.50 70.50 64.50 70.50 6 0 .0 0 66.50 6 8 .0 0 75.00 67.00 63.50C lerk s :
97.odAccounting, class A—--------------- 8 6 .0 0 91.50 89.50 73.00 85.00 - 83.00 1 0 0 .0 0 93.00 87.00 102.50 90.50 87.50 83.50 87.00 84.50 94.00 8 8 .0 0 89.50Accounting, class B—---- ---- ------ 69.50 75.50 6 8 .0 0 57.50 63.50 74.00 65.50 66.50 63.50 65.00 74.50 80.00 72.00 74.00 63.50 6 8 .0 0 72.50 79.50 76.00 69.50File, class A_---------------------------- 83.00 _ 84.00 _ _ _ - - - - 74.00 73.00 - 82.00 - - - 81.00 78.00 -File, class B----------------------------- 60.50 58.00 63.00 _ _ 62.00 _ . 54.50 59.00 53.00 59.00 64.00 58.50 61.00 54.00 54.50 57.50 65.00 57.00 57.50File, class C----------------------------- 57.50 53.00 _ _ _ _ . - - 6 0 .0 0 62.50 54.00 53.00 - - 53.00 66.50 61.50 -Orde I*,,,,, ............a 73.50 _ 6 8 .0 0 _ _ _ _ _ - - 73.00 96.50 - 78.50 57.00 - 87.00 90.00 75.50 -P ayroll____ ____ 74.00 _ 85.00 _ 75.00 75.00 _ " _ 83.50 _ 84.50 97.50 79.00 8 8 .0 0 81.50 79.50 82.00 97.00 90.00 81.00
Comptometer operators----------------- 81.00 - 76.50 - - 72.50 - 70.50 - - 73.00 92.50 71.00 76.00 66.50 - 74.50 88.50 81.50 64.50Duplicating-machine operators
74.50 74.50 62.50(Mimeograph or Ditto)-----------------Keypunch operators:
64.00 - 72.50 - “ “ “ “ “ “ “ " "C lass A ................................ .......... 77.00 _ 87.50 _ _ _ _ - - - 80.50 89.00 - 79.00 79.50 - 84.50 86.50 77.50 -Class B ___- ___________ _______ 61.00 _ 74.00 _ _ 72.50 _ 67.00 _ 69.00 71.00 84.50 69.50 68.50 63.00 - 70.50 82.00 72.50 67.00
O ffice g ir ls ------- — — — — —Secretaries — -------- —— — -----------—
57.50 _ 60.50 _ 57.50 _ _ _ _ . 57.00 65.00 - 54.00 53.50 - 52.00 65.50 60.00 67.5092.50 91.50 92.00 - 81.50 93.50 83.50 81.00 98.50 85.00 93.50 104.00 83.00 93.50 87.50 88.50 91.50 1 0 0 .0 0 93.50 84.50
Stenographers:73.50 71.00 71.00 61.50 68.50 83.00 63.50 74.50 72.50 65.50 76.50 8 6 .0 0 72.50 76.00 71.50 83.00 72.50 83.00 75.00 70.50
Senior ____mamm 93.00 _ 84.50 _ 76.50 90.00 _ _ - 74.50 82.00 95.50 9 0 .0 0 84.00 79.00 80.50 80.50 91.50 85.50 9 1 .0 0Switchboard operators------------------- 64.00 66.50 66.50 - 59.00 73.50 - 52.00 59.00 58.00 64.50 78.50 59.00 74.00 62.50 62.50 66.50 81.50 78.50 74.50Switchboard operator-
69.50 67.50 67.00 74.50reception ists------------- ------- ----------- 58.50 62.00 73.50 - 64.50 70.00 - 62.50 65.00 - 72.50 83.50 61.50 82.50 73.50 6 8 .0 0Tabulating -machine ope r ato r s :
92.50 9 0 .0 0 91.50Class B .......................... ........... _ _ 92.50 _ _ _ - - - - - - - - - 82.50 -Class C ...................................... 72.00 - 70.00 - - - - - - - 64.50 81.00 - - - - - - 67.50 -
Transcribing-m achine operators,66.50 68.50 62.50 78.00general___________„ _______ _______ 75.00 - 72.00 - - - - - - - 78.50 - - - 72.00 -
T yp ists :78.50 69.00 70.50 80.00 75.00 75.50 70.50 80.00 69.00 73.00 69.50 _ 72.50 78.50 73.00 83.50
Class B — — — ------- ------Professional and technical
57.50 56.00 59.50 54.50 58.50 71.00 “ 53.50 57.50 55.00 65.00 6 8 .0 0 58.50 64.50 59.00 64.00 59.00 69.00 64.00 58.50
MenD raftsm en:
L ea d er--------------------------------------- - - _ - - - - - - - - - - - - - - - - -S en ior---------------------------------------- _ _ 136.50 _ _ - _ - - - 145.00 150.00 - 123.00 - - - 130.50 141.00 -
88.50 - 1 1 1 .0 0 - - - - - 105.00 103.00 103.00 120.50 - 112.50 - - “ 108.00 124.00 -Women
Nurses, industrial (reg istered)---- - - - - - - - - - - - 1 1 2 .0 0 - - - - - -
1 Earnings relate to regular straight-tim e salaries that are paid fo r standard workweeks.2 Exceptions to the standard industry limitations are shown in footnotes 4, 5, 7, and /or 11 to the table in appendix A. NOTE: Dashes indicate no data reported or data do not m eet publication criteria .
Digitized for FRASER http://fraser.stlouisfed.org/ Federal Reserve Bank of St. Louis

Table A-3a. Office Occupations—Nonmanufacturing—Men and Women Combined
(Average weekly earnings 1 for selected occupations studied, July 1962 through June 1963)
25
Northeast
Occupation and grade Albany—Schenec
tady—T roy
Allentown—Bethlehem—
EastonBoston2 Buffalo B url
ington
Lawrence—H aver
hill
Manchester
Newarkand
JerseyCity*
NewHaven
NewYork2
Paterson—Clifton—Passa ic
Ph ila delphia
P ittsburgh
P ortland
P ro v i-dence—Paw tucket
Scranton Trenton W ater-
buryW orces
ter York
Bookkeeping-machine operators:C lass A ___ - - $72.00 - - - - $75.00 $70.50 $86.50 - $74.00 - - _ . $74.50 - - -Class B $59.50 $56.50 64.00 $57.00 $58.50 $58.00 $61.50 6 6 .0 0 61.00 74.50 $6 6 .0 0 62.50 $6 6 .0 0 $54.00 $58.00 $54.00 61.00 _ $58.501, $53.50
Clerks:Accounting, c la ss A __________ 1 0 1 .0 0 108.00 89.50 103.00 85.00 85.50 78.00 97.50 104.00 99.00 105.50 87.50 98.50 82.50 84.50 105.50 83.00 $ 1 0 2 .0 0 77.00A cc o u n tin g r c la s s R ----- 74.50 78.50 6 9 .0 0 6 8 .0 0 71.00 6 9 .0 0 60.50 77.00 76.50 76.50 74.50 6 9 .0 0 78.50 67.50 61.50 91.50 _ 64.50 65.50 61.50F ile - c la s s A _ - 68.50 - - - _ 75.50 _ 80.50 _ 70.00 83.50 _ 81.50 _ _ _ _ _F i l e , c la s s R _______________________ 56.00 - 58.50 51.50 - - _ 60.00 62.50 6 8 .0 0 60.00 57.00 61.50 _ 59.50 _ _ _ 54.00 _F i l e , c la s s C _______________________ 55.00 - 53.50 51.50 - - 48.50 57.00 57.00 59.50 52.50 50.50 57.00 51.00 52.00 58.00 _ 49.50 48.50 .O rder - - 83.50 - - - - 84.50 - 80.00 67.00 76.00 78.00 _ 59.50 - _ _ . _P a yroll — 83.50 80.00 76.50 78.50 76.50 - 76.50 87.00 81.00 89.50 83.00 76.00 84.50 74.00 72.00 59.00 74.50 _ 70.00 _
Com ptom eter operators 83.00 - 70.00 75.50 - - - 82.50 81.50 79.50 77.00 70.50 75.00 78.50 67.00 - - - - .Keypunch operators:
C lass A _________________________ - - 73.50 84.00 - - - 82.00 85.00 82.50 92.50 77.50 83.50 - 71.50 - _ _ . _C la s s R ___ _________________________ 66.50 76.50 64.50 62.50 _ - 68.50 73.00 71.50 64.50 6 6 .0 0 66.50 52.50 59.50 84.50 _ _ 62.00 _
O ffice boys and g i r l s __________ ___ 57.00 _ 54.50 - - - _ 63.00 64.50 61.50 68.50 58.50 59.50 56.00 53.00 69.50 _ _ _ _S e c r e ta r ie s 97.00 69.50 8 8 .0 0 94.50 82.50 84.00 80.50 98.50 95.00 99.50 91.50 9 0 .0 0 9 2 .0 0 73.00 77.00 76.50 8 6 .0 0 87.50 83.50 75.00Stenographers:
G en era l__ 73.50 83.00 70.00 72.00 - 71.50 57.00 77.50 75.50 79.00 71.50 74.00 73.50 63.50 60.00 6 6 .0 0 62.50 _ 67.50 6 8 .0 0S en io r _ _ 79.50 88.50 _ . _ 87.50 83.00 88.50 _ 81.50 90.00 _ 72.50 60.50 _ _ _
S w itchb oard o p e ra to rs 6 6 .0 0 65.00 70.50 67.50 56.50 64.50 65.50 78.50 72.50 80.50 74.00 69.50 74.00 53.50 62.50 53.50 58.00 57.50 65.00 .Tabulating-m achine operators,
c la ss B 79.50 - 77.00 - - - - 95.00 92.50 87.50 85.50 82.00 89.50 - 82.50 86.50 - - 70.00 -Typists:
C la s s A_ ______________________ 72.00 - 73.00 67.00 - . - 77.00 72.00 77.50 - 73.50 76.50 65.50 64.50 . _ . 67.50 _C lass B 59.00 56.50 59.00 59.50 - - 1 52.50 64.00 60.50 6 8 .0 0 63.50 59.00 63.00 53.00 54.50 56.50 58.50 62.00 56.00 -
South
Atlanta B altim ore 2
Beaumont—Port
Arthur
Birm ingham
Charleston,
W. Va.Charlotte
Chattanooga2 Dallas2 Fort
WorthG reen
ville Houston Jackson Jacksonville 2
Little R o ck - North
Little R o ck 2
Louisville
Lubbock Memphis 2 M iam i2 New
Orleans
N orfo lk ------Portsmouth and Newport
N ews—Hampton
OklahomaC ity 2
Bookkeeping-machine operators:C lass A $74.50 - - $82.50 - $68.50 $75.00 $73.50 $68.50 - $80.50 $67.00 $6 9 .0 0 - $82.00 - $81.50 $75.00 $75.50 $75.00 $73.00Class R 68.50 $57.50 - 60.50 $60.50 58.50 55.00 64.00 59.00 $58.50 67.50 60.50 61.00 - 61.50 $57.50 58.50 63.00 61.00 60.00 59.50
Clerks:Accounting, c la ss A ___________ 97.00 89.00 $107.00 89.50 100.50 84.00 85.50 9 0 .0 0 8 6 .0 0 77.00 9 8 .0 0 84.50 88.50 $82.50 94.50 80.00 89.00 9 1 .0 0 94.00 87.00 94.50Accounting, c la ss B 76.50 70.50 79.50 69.50 58.00 73.00 61.50 6 9 .0 0 64.50 61.00 76.00 65.00 67.50 61.00 6 9 .0 0 63.00 64.00 72.00 6 6 .0 0 64.00 63.50F ile , c la ss A ___________________ 76.00 67.50 - 64.50 - 68.50 - 67.00 - - 73.50 _ 6 9 .0 0 _ _ _ - 71.50 65.50 _ 64.50F ile , c la ss B __________________ 60.00 54.50 71.00 53.00 - 56.00 51.50 58.00 - - 61.00 52.00 61.50 52.00 60.00 _ 62.00 56.50 55.00 _ 54.00F ile , c la ss C ___________________ 54.00 51.00 - 50.50 _ 52.50 - 52.50 49.00 50.00 52.00 49.50 50.50 _ 51.50 _ 48.50 51.00 50.00 . 47.00O rder ________ __ 77.50 73.00 8 8 .0 0 75.00 - 75.50 _ 74.50 62.00 _ 83.50 72.50 70.50 63.00 59.00 59.00 74.50 6 9 .0 0 70.00 _ 62.00P a yroll _ _ _ 85.00 71.50 75.50 72.50 75.00 73.00 72.00 80.50 6 9 .0 0 64.00 92.00 76.50 81.50 74.50 72.50 72.00 69.50 79.50 71.50 71.00 75.50
Com ptom eter o p e r a to r s__________Keypunch operators:
75.00 74.00 - 63.50 75.00 66.50 - 68.50 64.00 - 73.50 58.00 67.00 61.50 75.50 62.00 64.00 61.50 6 6 .0 0 " 67.50
C lass A _______________________ 85.50 72.00 - - - 71.50 - 73.00 64.00 - 85.50 63.50 80.50 57.50 92.50 73.00 68.50 78.50 72.00 - 74.00Class B _ 6 6 .0 0 62.50 - 60.00 _ 60.00 52.00 64.50 61.00 _ 6 9 .0 0 57.50 62.00 57.50 64.00 60.50 59.50 70.50 61.50 55.50 65.50
O ffice boys and g ir ls . 59.00 56.50 _ 58.50 62.00 56.50 50.00 55.00 54.00 - 56.50 55.50 53.50 56.50 57.00 - 56.50 55.00 53.50 53.50 54.00Sftcretarift#Stenographers:
General ----
9 2 .0 0 85.00 94.00 87.50 93.00 79.50 77.00 89.50 76.50 73.50 97.00 76.00 87.50 77.00 84.50 79.50 77.50 84.00 87.50 80.50 82.00
75.00 66.50 6 9 .0 0 70.00 72.50 66.50 70.00 6 9 .0 0 6 8 .0 0 72.50 74.50 63.00 71.00 59.50 72.00 65.50 6 8 .0 0 6 9 .0 0 69.50 67.50 69.50S en io r 8 8 .0 0 77.50 9 1 .0 0 99.00 _ 81.50 78.00 85.50 - - 89.00 77.00 73.00 76.00 92.50 82.00 90.50 83.00 79.00 78.50 84.50
Switchboard o p e r a to r s ____________ 6 6 .0 0 62.00 60.50 61.50 58.50 61.00 50.50 6 6 .0 0 55.50 - 6 9 .0 0 51.50 60.00 55.50 60.00 58.50 48.00 59.50 54.00 55.50 58.00Tabulating-machine operators,
c la s s R Typists:
C lass A _________________________
78.50 82.50 - 78.50 - 79.00 - 84.00 78.00 - 94.00 77.00 84.50 - 84.00 - 78.50 84.50 80.50 - 86.50
68.50 67.00 77.50 63.00 _ 64.00 60.50 6 9 .0 0 61.50 _ 70.00 63.50 63.00 67.00 82.00 _ 62.00 77.00 70.50 68.50 63.00Class B 63.00 56.00 61.00 56.50 60.00 60.00 54.00 56.00 53.00 52.50 61.00 56.50 56.50 51.00 59.00 55.50 59.50 58.50 57.50 53.00
See footnotes at end o f table.
Digitized for FRASER http://fraser.stlouisfed.org/ Federal Reserve Bank of St. Louis

26
Table A-3a. Office Occupations—Nonmanufacturing—Men and Women Combined- Continued
(Average weekly earnings1 for selected occupations studied, July 1962 through June 1963)
Occupation and grade
South— Continue d North Central
Raleigh Richm ond2
SanAntonio2
Savannah2
Washington2 Akron Canton Chicago 2 Cincin
natiC leveland2 Columbus
Davenport- Rock Islandr-
MolineDayton Des
Moines D etro it2 GreenBay
Indianapolis 2
KansasCity Milwaukee
Minneapolis— St. Paul
Muskegon—Muskegon
Heights
Bookkeeping-machine operators:Class A $71.00 $6 9 .0 0 $67.50 - $82.00 $73.50 - $93.00 $80.00 $84.50 $70.50 $81.50 $90.50 $74.50 $85.50 - $83.50 $8 8 .0 0 $82.00 $79.50 -Class B 59.50 61.50 52.50 $58.50 67.50 61.50 $52.00 75.00 66.50 68.50 58.00 62.00 6 6 .0 0 61.50 69.50 - 62.50 62.50 64.00 61.50 -
Clerks:Accounting, class A--------- -------- 79.00 9 0 .0 0 82.00 101.50 91.50 93.50 - 103.00 8 8 .0 0 99.00 83.50 94.00 99.50 80.50 105.50 $98.00 9 0 .0 0 94.00 102.50 94.00 -Accounting, class B__________ 63.00 70.00 60.50 70.50 70.00 68.50 64.00 79.50 71.50 77.00 65.50 6 8 .0 0 67.00 66.50 73.50 67.00 6 8 .0 0 69.50 73.00 70.50 $83.50F ile , class A ... - 80.00 _ - 79.00 _ - 80.00 _ 84.00 71.50 84.00 - 63.00 82.50 - 76.50 78.00 69.50 73.50 -F ile , class B 52.00 62.00 54.50 _ 67.50 57.50 67.50 59.00 63.50 58.00 58.50 59.50 53.00 60.50 _ 57.50 60.00 58.00 58.50 -F ile , c la ss C ----- . . 51.00 _ _ 57.50 „ - 58.50 53.00 56.00 50.50 53.00 - 49.00 58.00 50.00 53.00 52.00 53.50 50.50 -QyHftr - 79.00 72.00 - 88.50 67.50 - 1 0 0 .0 0 92.50 91.50 83.00 9 1 .0 0 77.00 78.00 1 0 0 .0 0 _ 75.50 82.00 74.50 9 2 .0 0 -PayrolL— 85.50 76.50 67.00 100.50 81.00 83.50 _ 90.50 81.00 84.50 74.50 73.50 83.50 71.50 87.50 8 6 .0 0 79.00 87.00 85.00 83.00 -
Comptometer operators. 60.50 66.50 67.00 - 81.50 65.50 - 79.50 75.00 76.00 72.00 - 67.50 71.00 77.50 - 75.50 74.00 68.50 71.50 -Keypunch operators:
Class A . ___ _ 72.00 70.00 68.50 - 85.00 85.00 - 83.50 75.50 79.50 69.50 - - 64.50 85.00 - 74.00 77.50 77.50 72.00 -Class B _________________________ 55.50 70.00 58.00 _ 69.50 65.00 _ 77.00 64.50 77.50 64.50 6 9 .0 0 67.00 59.00 78.00 _ 64.50 7 4.10 65.50 68.50 60.00
O ffice boys and girls 54.00 56.00 52.00 _ 60.50 _ - 65.50 59.00 63.00 58.00 61.50 52.50 55.00 61.00 _ 57.50 ,0 58.50 56.00 -Secretaries 86.50 87.00 81.50 92.50 94.50 93.00 80.00 100.50 93.50 9 6 .0 0 86.50 90.50 97.00 83.50 97.00 79.50 8 9 .0 0 95.00 94.50 88.50 86.50Stenographers:
General _ 64.00 78.50 63.00 86.50 84.00 71.00 72.50 83.50 6 9 .0 0 77.50 73.00 67.00 79.50 65.00 79.00 6 8 .0 0 78.00 74.00 72.50 75.00 -74.50 80.00 74.50 _ 9 6 .0 0 83.50 _ 89.00 82.50 93.50 76.50 77.50 98.50 79.50 9 2 .0 0 _ 79.50 84.00 83.00 83.00 -52.00 61.50 57.00 53.50 64.50 68.50 66.50 78.00 73.00 71.00 6 8 .0 0 58.50 67.50 59.00 74.00 - 6 0 .0 0 65.50 66.50 67.50 -
Tabulating-machine operators,class B _ __ __ 83.00 81.50 74.50 - 8 8 .0 0 - - 94.00 82.50 9 6 .0 0 8 6 .0 0 89.50 - 81.50 94.00 85.50 8 8 .0 0 92.50 89.50 89.00 -
Typists:Claes A _ _ _ 60.50 66.50 60.50 - 78.00 70.50 - 79.50 69.00 76.00 70.00 70.50 73.00 6 1 .0 0 84.50 - 72.00 74.00 71.50 70.00 -Class B 50.00 58.00 53.00 " 66.50 59.50 54.00 68.50 61.50 64.00 58.00 58.50 6 1 .0 0 54.00 65.50 56.50 6 0 .0 0 6 0 .0 0 6 1 .0 0 61.00
North Central— Continued West
Omaha2 Rockford St. Louis2 SiouxFalls
SouthBend Toledo Waterloo Wichita Albu
querque Boise DenverLos
A ngeles-Long
B each2
Phoenix2 PortlandSaltLakeCity
SainBernardino—
R iverside—Ontario
SanDiego
SanF ran cisco—
Oakland 2Seattle2 Spokane
Bookkeeping-machine operators:Class A . . _ „ $81.00 - $6 6 .0 0 - $65.50 - - $74.50 $80.00 $78.00 $74.00 $9 6 .0 0 $8 6 .0 0 $84.00 $81.00 - $87.50 $99.00 $78.00 -Class B . 59-00 - 59.00 $53.00 59.50 $62.00 $52.50 57.00 63.00 57.50 69.50 70.50 65.00 70.50 60.00 $6 6 .0 0 68.50 75.00 67.00 $63.50
Clerks:Accounting, class A______—____ 88.50 $96.50 9 6 .0 0 87.50 94.00 97.00 - 8 8 .0 0 97.50 95.00 93.00 105.00 92.50 103.00 98.00 94.00 87.00 99.00 94.00 1 0 0 .0 0Accounting, class B --------- ----- 70.50 77.50 72.50 64.00 70.50 75.00 78.00 67.50 64.50 65.00 76.50 81.00 72.50 77.50 - 71.00 74.50 81.00 76.00 72.00F ile , class A___________________ 84.00 - 9 0 .0 0 _ _ - - - _ _ 74.50 75.00 - 83.00 - - - 81.50 78.00 _F ile , class R_ 60.50 58.00 65.50 - _ 62.00 - 54.50 61.00 53.00 59.00 64.00 58.50 61.50 54.00 54.50 58.50 65.00 57.00 57.50F ile , class C ..______ 57.50 - 54.50 - - - - _ - _ 60.00 63.50 54.50 53.00 - - 53.00 68.50 61.50 -Order,.„n ................ .............. 80.00 - 81.50 - 80.00 - - - 72.00 82.50 78.50 105.00 78.50 8 8 .0 0 80.00 84.00 94.00 108.00 93.00 8 6 .0 0PayrolL 76.00 - 89.00 - 79.50 78.00 - - 84.00 93.00 85.50 1 0 1 .0 0 79.00 90.00 85.00 82.00 8 8 .0 0 1 0 0 .0 0 90.50 81.50
Comptometer operators 81.00 - 76.50 - - 72.50 - 70.50 - - 73.00 92.50 71.00 76.00 66.50 - 75.00 88.50 81.50 64.50Keypunch operators:
77.50 - 88.50 - - - - - - - 81.50 8 9 .0 0 - 79.00 79.50 - 84.50 86.50 77.50Class B 61.50 _ 77.00 _ _ 72.50 - 67.00 _ 6 9 .0 0 71.00 84.50 69.50 68.50 63.00 - 70.50 82.00 72.50 67.00
O ffice boys and g ir ls______________ 58.00 _. 62.00 _ 58.50 72.50 - 53.50 _ 63.00 60.00 69.50 58.00 57.00 59.00 6 6 .0 0 55.00 6 6 .0 0 6 2 .0 0 66.50S e c r e ta r ie s 92.50 91.50 93.50 - 81.50 93.00 83.50 81.00 98.50 85.00 93.50 104.50 83.00 94.00 88.50 89.00 91.50 1 0 0 .0 0 94.00 85.00Stenog raphe r s ;
General ----------------- 75.00 71.00 71.50 61.50 68.50 83.50 63.50 74.50 73.00 65.50 77.00 8 6 .0 0 72.50 77.00 72.50 83.50 72.50 83.50 75.50 70.50S enior 93.00 - 85.00 - 76.50 9 0 .0 0 - - - 74.50 82.50 95.50 90.00 84.00 79.00 80.50 80.50 91.50 8 6 .0 0 91.50
Sw itchboard o p e ra to rs ............ 64.00 66.50 66.50 - 59.00 73.50 - 52.00 59.00 58.00 65.00 78.50 59.00 74.00 62.50 62.50 66.50 81.50 78.50 74.50Tabulating-machine operators,
c la s s B ... ............. 89.50 - 93.00 - - - - - - - 92.50 97.50 - 94.00 90.50 - 97.50 99.50 9 1 .0 0 -Typists:
Class A ____ 78.50 _ 69.50 _ 70.50 80.00 - _ 75.00 75.50 72.50 80.00 6 9 .0 0 73.00 69.50 - 73.50 78.50 73.00 84.00Class B 57.50 56.00 60.50 54.50 58.50 72.50 67.00 53.50 57.50 55.00 65.00 6 8 .0 0 58.50 65.00 59.00 64.00 59.00 6 9 .0 0 64.00 58.50
1 Earnings relate to regular straight-tim e salaries that are paid for standard workweeks.2 Exceptions to the standard industry lim itations are shown in footnotes 4, 5, 7, and /or 11 to the table in appendix A.
NOTE: Dashes indicate no data reported or data do not m eet publication criteria .
Digitized for FRASER http://fraser.stlouisfed.org/ Federal Reserve Bank of St. Louis

Table A-4. Office Occupations—Public Utilities1
(Average weekly earnings 2 for selected occupations studied, July 1962 through June 1963)
27
Northeast
Sex, occupation, and grade A lban y-Schenec-_
tady—T roy
Allentown—Bethlehem—
EastonBoston3 Buffalo Burl
ingtonMan
chester
Newarkand
JerseyCity
NewHaven
NewY ork 3
Paterson— C lifton - Pass aic
Philadelphia
P ittsburgh Portland
P rov id en ce - Paw - tucket
Scranton W orcester York
MenClerks:
Accounting, c la ss A___________ - $119.00 - $114.50 - - $106.50 - $109.50 _ $122.50 $126.00 _ _ _ _ _Accounting, c la ss R - - - - - - _ - 8 8 .0 0 _ 105.50 114.50 _ _ _ _ _
O ffice boys ___ - - $59.00 - - - 79.50 _ 6 6 .0 0 _ _ 80.00 _ _ _ _ _Tabulating-m achine operators,
c la ss B _ _ - - - - - - 103.00 - 102.50 - 98.50 105.50 - - - - -Women .
B ille rs , machine (billingmacWnft). ---- __ _ - - - - - 78.00 _ 9 2 .0 0 _ _ _ _ _ .
C lerks:Accounting, class A____________ - - 99.00 - $86.50 _ 99.50 _ 100.50 _ 88.50 _ _ $8 6 .0 0 _ _ _Accounting, class B____________ - - 78.50 - - - - $76.50 82.50 - 80.00 98.50 $72.00 70.50 _ . _F ile , class B___________________ - - - - - - 71.00 - 74.00 _ 66.50 _ _ _ _ _P ayroll---------------------------------------- - - 92.00 - 75.00 _ _ 85.00 93.00 _ 79.00 97.50 _ _ _ _ _
Com ptom eter operators___________ - - - - - - 87.00 - 8 9 .0 0 _ _ _ _ _ _Keypunch operators, cla ss A _____ - - 90.50 - - - 91.50 - 9 1 .0 0 _ > 8 6 .0 0 _ _ _ _ _Keypunch operators, c la ss B_____ - 86.50 75.50 76.00 - - - . 73.50 _ 71.00 76.00 _ _ _ _ _O ffice g irls — ---- --- --- - - - - - - - - 61.50 . . _ _ _ _Secretaries —,__ ______ ____________ $118.00 - 1 0 2 .0 0 1 1 1 .0 0 85.50 - 101.50 108.50 105.50 $106.50 1 1 9 .0 0 107.00 8 6 .0 0 91.50 $72.00 $9 6 .0 0 $81.50Stenographers, gen era l___________ 81.50 9 0 .0 0 8 8 .0 0 96.50 - - 80.50 81.50 86.50 73.50 87.50 85.00 80.50 76.50 89.50Stenographers, senior - - 105.50 - - - 85.00 - 95.50 _ 80.50 97.50 _ _Switchboard operators __ _ - - 8 8 .0 0 90.00 - - 91.50 - 89.50 _ 9 1 .0 0 9 0 .0 0 _ _ _ _ _Switchboard operator-
receptionists - - - - - - 81.50 _ _ 70.00 _ _ _ _ _T yp ists, c la ss A -------- 72.50 93.00 8 9 .0 0 - - - 78.00 - 84.00 - 89.50 94.00 _ _ _ _ _T yp ists , class B ________ _ _ - 62.50 74.00 71.00 “ $6 1 .0 0 75.00 - 75.50 74.50 79.50 72.00 6 1 .0 0 - - - -
South
Atlanta B altim o r e 3
Beaumont—Port
Arthur
Birm ingham
Charleston,
W. Ya.Charlotte
Chattanooga 3 Dallas Fort
Worth Houston Jackson Jacksonville3
Little R ock - North
Little RockLouis - ville
Lubbock Memphis 3M iam i3 New
Orleans
N orfo lk - Portsmouth and Newport
News—Hampton
OklahomaCity
MenClerks:
Accounting, class A $ 1 1 0 .0 0 - - - - $105.00 - $98.50 $97.50 $106.00 _ _ _ $115.00 _ _ _ $93.00 $103.50Accounting, class B____________ 90.50 - - - - 88.50 - 93.00 - 8 8 .0 0 - - _ _ _ _ $95.00 6 9 .0 0O ffice b oy s .. __ _ _____ _ 70.00 - - - - - - 6 0 .0 0 _ 60.50 _ _ _ 82.00 _ _ 63.50 _
Tabulating-m achine operators, ,c la ss B------------------------------------------ 83.00 - - - - - - 94.50 - 1 0 2 .0 0 - - - - - - - - - -
WomenB ille rs , machine (billing
machine) _ ___ _ _ - - - $72.00 - - _ _ - _ _ _ _ _ _ _ _ _Clerks:
Accounting, class A_ ----- 99.50 - - 104.00 - 84.00 - 98.00 9 2 .0 0 100.50 _ _ _ 94.50 $81.50 _ 98.50 87.50 _ _Accounting, class B 73.50 - - - - - - 83.00 75.50 78.50 - _ _ 76.50 _ _ 75.50 _ 73.00F ile , cla ss B __________ _ 74.00 - - - - . . 62.00 _ 74.50 _ _ _ _ _ _ _ _P a yro ll_____ ______.......... n—______ 90.50 - - - - 74.50 - 9 2 .0 0 - 91.50 _ $84.00 _ _ _ 84.50 _ _ _
Com ptom eter operators - - - - - - - 83.50 - 78.00 _ - _ _ _ „ 73.50Keypunch operators , c la ss A_____ 95.50 - - - - - - 82.00 - 91.50 - _ _ _ _ _ 87.50 83.50Keypunch operators, c la ss B_____ 6 8 .0 0 - - 65.00 - 61.50 - 83.00 _ 69.50 _ 71.00 _ 79.50 _ _ _O ffice g ir ls _ ------- - $57.50 - - - - - 63.50 - 60.00 . _ _ _ _ _ _S ecretaries _ _ _ 108.50 101.50 $ 1 0 9 .0 0 104.50 $104.50 8 8 .0 0 - 1 0 2 .0 0 9 1 .0 0 1 0 1 .0 0 $97.00 99.50 $91.50 104.50 89.50 $94.00 93.50 9 1 .0 0 $84.00 92.50Stenographers, gen era l___________ 83.00 - - 76.00 84.50 70.50 $87.00 73.00 75.00 75.50 70.50 80.00 78.00 87.00 78.00 94.00 82.00 69.50 _ 67.50Stenographers, senior 84.50 - - - - - - 88.50 - 87.00 _ - 83.50 _ 92.00 _ 9 0 .0 0 79.00 _ 80.50Switchboard operators_____________ 91.50 76.00 - - 81.00 76.00 - 77.00 _ 83.00 _ _ _ _ 81.00 75.00 _Switchboard operator-
receptionists _ __ _ 88.50 - - - - _ _ 86.50 _ 67.00 _ _ _ _ _ _ 74.50 _ _T yp ists, class A ---- --- 8 9 .0 0 63.50 - - - - - 73.50 68.50 72.00 67.50 74.00 _ 85.50 _ _ 81.00 73.00 70.00 _T ypists, class B - _ ___ __ 79.00 65.00 - 60.00 - - - 63.50 60.50 64.00 - - - - - - 76.00 60.00 61.00 -
See footnotes at end of table.
Digitized for FRASER http://fraser.stlouisfed.org/ Federal Reserve Bank of St. Louis

2 8
(Average weekly earnings2 for selected occupations studied, July 1962 through June 1963)
Tabic A - 4 . Office Occupations—Public Utilities1— Continued
Sex, occupation, and grade
South— Continued North Central
Raleigh Richm ond3
SanAntonio3
Savannah3
Washington Akron Chicago3 C leve
land3 ColumbusDavenport-
Rock Island— Moline
DesMoines D etroit3 Green
BayIndianapolis 3
KansasCity Milwaukee
Minneapolis— St. Paul
Muskegon—Muskegon
Heights
MenC lerk s :
Accounting, cla ss A— . . . — — - $107.50 - - $109.00 $107.00 $116.50 $113.50 - - - $124.00 - $113.00 $107.50 _ $119.50 -Accounting, cla ss B------------------- - 9 0 .0 0 - - - - 104.00 98.00 - - - 102.50 - 1 0 1 .0 0 - $93.50 94.50 -
O ffice boys ------- — — ----------------- . 76.00 - _ 70.00 - 76.00 82.00 _ - - 69.50 - 72.50 66.50 _ 80.00 _Tabulating-machine operators,
cla ss B------------------------------------------- - - - - - - 105.00 1 0 2 .0 0 - - - 111.50 - - 95.50 - 97.00 -Women
B illers , machine (billing machine)—. _ _ _ _ _ - 8 6 .0 0 86.50 _ - _ 91.50 _ _ _ _ _ _C lerk s :
Accounting, cla ss A-------------------- _ _ . . 96.00 9 2 .0 0 106.00 90.00 $8 8 .0 0 _ $82.00 103.00 - 89.50 - 94.00 -Accounting, cla ss B_____________ _ 79.50 _ _ . 77.50 89.50 80.50 79.50 _ - 86.50 - 6 8 .0 0 7*9.00 _ 74.50 $84.50F ile, cla ss B------------------------------- _ _ - _ _ 69.50 83.00 - - - - 76.50 - 60.50 67.00 6 8 .0 0 68.50 _P ayroll_______________________ ___ _ _ _ . 9 1 .0 0 _ 97.50 8 8 .0 0 - - - 93.00 - 85.00 90.50 85.50 93.50 -
Comptometer operators------------------ - - - - - - 94.00 96.50 - - - 95.50 - 71.00 89.50 - 93.50 -Keypunch operators, class A--------- - - - - 1 0 1 .0 0 85.00 91.50 84.00 - - - 1 0 0 .0 0 - - - - T 4.50 -Keypunch operators, class B--------- - 80.50 _ - 74.50 70.50 8 8 .0 0 9 2 .0 0 77.50 - 66.50 81.50 - 67.50 82.00 72.00 82.50 -O ffice g ir ls -------------------------------------- _ - „... . - _ - 6 8 .0 0 - . . 64.00 _ - '• _ - . -S ecreta r ies . . . . . . . . . . . . . — — ------- $94.00 104.00 $90. oih. $103.50 1 0 2 .0 0 106.00 111.50 109.50 1 0 1 .0 0 - - 105.50 - 98.00 103.50 1 1 1 .0 0 93.50Stenographers, gen era l------------- — 6 8 .0 0 96.50 80.00' 94.50 92.00 . 79.00 98.00 9 0 .0 0 81.00 $81.50 75.50 92.50 _ 88.50 82.50 81.00 89.50Stenographers, senior--------------------- 80.50 85.50 . - - J 83.00 93.50 1 0 0 .0 0 - - 94.00 - - 81.50 90.00 - 99.50Switchboard operators--------------------- . 82.50 . - 82.50 - 94.00 89.50 81.00 - - 96.00 - 90.50 8 9 .0 0 81.00 93.001Switchboard operator- !
receptionists — ------- . . --------- . - - - 84.00 - 8 6 .0 0 - - - - 78.00 - 80.50 78.00 - 70.00;Typists, class A ----------------------------- . 73.00 - - - 73.50 90.50 80.50 73.50 - - 94.50 - 77.00 78.50 77.50 79.00 -Typists, class B ------------------------------ - 6 8 .0 0 - - 74.00 77.00 71.50 71.50 - 63.50 74.50 $58.00 66.50 6 8 .0 0 65.00 81.00 -
North Central— Continued West
MenC lerks:
Accounting, class A— Accounting, cla ss B—
O ffice b o y s -Tabulating-machine operators,
C lerk s :Accounting, cla ss A _ ---- —Accounting, cla ss B--------File, cla ss B----------------—P a y ro ll-
Comptometer operators----------Keypunch operators, class A - Keypunch operators, class B -O ffice g ir ls ___________________Secretaries -Stenographers, general.. Stenographers, s e n io r ... Switchboard operators— Switchboard operator-
reception ists------------- —Typists, class A .Typists, cla ss B ------------
Omaha3 Rockford St. Louis SiouxFalls
SouthBend Toledo W aterloo Wichita Albu
querque Boise DenverLos
Angeles—Long
B each3
Phoenix3 PortlandSaltLakeCity
SanBernardino—
R iverside—Ontario
SanD iego
SanF ran cisco—
Oakland 3Seattle3 Spokane
$97.00 $113.50 $108.50 $115.00 $125.00 $119.00 $110.50 $114.50_ _ 103.00 _ _ _ _ . _ _ . 95.00 - 106.50 - _ . 108.00 -
- - 81.50 - - - - - - - 81.00 - - - - 82.00 - -
- - 108.00 - - - - - - - - 107.00 - - - - - 1 0 9 .0 0 - -
- - 95.50 - - - - - - - - 8 6 .0 0 - 95.50 - - - 108.50 99.50 -
8 8 .0 0 . 101.50 $92.50 _ _ _ _ _ 99.00 104.50 _ _ _ _ - 110.50 90.00 _
78.50 _ 83.50 $61.00 _ _ $69.50 $80.00 _ _ 90.00 79.50 - 90.50 - - - 8 6 .0 0 76.00 89.50_ _ . _ _ _ _ _ _ . 64.00 87.00 _ 84.00 - - - 88.50 _ _
8 6 .0 0 _ 9 1 .0 0 _ . _ _ _ _ - 99.00 102.50 - 99.50 - - - 1 1 0 .0 0 90.00 -
93.00 _ . _ _ _ - - . 101.50 - - - - - 1 0 0 .0 0 _ _
92.50 _ 96.00. _ _ _ _ _ _ - 9 1 .0 0 103.00 - 87.00 - - - 104.00 _ -_ _ 89.50 _ _ _ _ 79.00 _ _ 77.00 79.00 - 81.00 - - - 93.00 73.00 __ _ 71.50 _ _ _ _ _ _ . _ _ _ - - - 77.00 63.50 _
94.00 $103.00 105.50 _ 93.00 $89.50 _ 92.50 $92.50 $97.50 1 02 .0 0 1 1 0 .0 0 $98.00 104.00 $95.00 $103.50 $ 1 0 0 .0 0 109.50 104.00 95.5076.00 _ 85.00 67.50 83.50 99.00 _ 82.00 71.00 _ 87.00 93.50 - 93.00 83.50 93.50 77.00 92.50 87.00 ._ _ 95.50 _ _ _ _ _ _ _ 94.00 103.00 _ 97.00 - - . 107.00 89.50 95.00
- - 93.50 - - - - - - - 94.50 90.50 - 92.50 - - - 1 0 1 .0 0 90.50 91.50
82.00 _ . _ _ _ _ 8 6 .0 0 98.50 _ 79.50 _ _ _ 97.50 83.00 __ _ 83.00 _ _ _ _ _ _ _ 80.50 86.50 - 76.00 74.50 - 74.50 89.50 71.50 _
59.50 - 74.00 - - 78.00 - - “ - 75.50 79.00 “ 74.00 - 70.00 “ 76.50 78.50 -
1 Transportation, communication, and other public utilities. Excludes taxicabs, serv ices incidental to water transportation, and municipally operated establishm ents.2 Earnings relate to regular straight-tim e salaries that are paid for standard workweeks.3 Exceptions to the standard industry limitations are shown in footnote 4 in appendix A.NOTE: Dashes indicate no data reported o r data do not m eet publication criteria .
Digitized for FRASER http://fraser.stlouisfed.org/ Federal Reserve Bank of St. Louis

(Average weekly earnings 1 for selected occupations studied, July 1962 through June 1963)
Table A-5. Office Occupations—Wholesale Trade
29
Northeast South North Central West
Sex, occupation, and gradeBoston
Newarkand
JerseyCity
NewYork Philadelphia Pittsburgh Atlanta Baltim ore Houston Washington Chicago Cleveland Detroit
Minneapolis—
St. PaulSt. Louis
LosA n geles-
LongBeach
SanF ra n cisco -
Oakland
Men
Clerks:Accounting, c la ss A_____ $113.50 $126.50 $103.00 $99.50 $105. 50 $111.50 - $108.00 - $118.50 $115.00 $137.50 $95.50 $ 1 0 2 .0 0 $105.50 $117.50Accounting, cla ss B _ ---------------- 84.00 - 83. 50 81.00 - 89.50 - 83.50 - 90. 50 93.00 - 81.50 - - -O rder . . . - — — 95.50 1 1 0 .0 0 89.00 105.50 97.00 89.50 $107.50 91.50 $99 . 0 0 1 1 6 .0 0 103.00 118.50 100.50 1 0 0 .0 0 108.00 113.50
O ffice b o y s -------- ---------------—----------- 58.00 - 62.50 6 1 .0 0 - 57.50 - - - 70.50 - - 60.00 - 74. 00 -Tabulating-machine operators,
9 6 .0 0 106.50c la ss B ----------------------------------------- 89 .50 - 90. 50 89. 50 - 87.00 - 93.50 - 91. 50 “ 101.50 9 0 .0 0 1 1 1 .0 0
Women
B illers , m achine (billingmachine) 75.00 - 78.50 68.50 74. 50 - 80.00 65.00 - 69.50 6 8 .0 0 87. 50
Bookkeeping-machineoperators:
C lass A - - 93.00 75.00 - 74. 00 - 80. 50 - 89.50 - - 85.00 - 98.00 104.00Class B __ __ 70. 50 76.00 82.00 74.50 72.00 72.00 63.00 67.50 - 78. 00 6 6 .0 0 75.50 67.00 73. 00 9 1 .0 0 81.50
Clerks:Accounting, c la ss A ___________ 85.50 - 98. 50 92.00 8 6 .0 0 - - 96.50 - 99.50 99.50 1 1 0 .0 0 85.00 94. 50 9 8 . 00 94. 50Accounting, c la ss B ______ ____ 70.00 71.50 78.00 76.00 80. 50 83. 50 88.50 77.00 - 80.00 77. 50 75.50 72.00 6 9 .0 0 83. 00 83.50F ile , c la ss A - - 80. 00 73.50 - - - - - 79.50 - - - - - -F ile , c la ss B 63.50 _ 6 9 .0 0 62.00 67. 50 65.00 61.00 - - 70. 00 6 1 .0 0 - 61.50 67.00 69. 50 73.50F ile , c la ss C __________________ 59.00 _ 61.00 _ - - - - ' - - - - 51.00 54.00 72. 00 _O rder 75. 50 73.00 71.50 64. 00 - 73.50 - - 77. 50 84.00 79. 00 77.50 81.00 6 8 . 50 100. 50 98.50P ayroll 85. 50 _ 94. 50 8 8 .0 0 9 0 .0 0 87.00 - 1 0 0 .0 0 - 87.50 8 6 .0 0 - 84. 00 - 96. 50 1 0 2 .0 0
Com ptom eter operators — Keypunch operators:
72.50 84. 50 84.00 69.50 73.50 76.50 ■ 77.00 81.00 77.50 71. 50 88.50 70. 50 72.50 93.00 8 8 .0 0
C lass A 77.50 _ 84. 50 _ - 84. 00 - 8 6 . 50 - 83.50 73. 50 - - 8 8 .0 0 93. 00 9 6 .0 0Class B _________________________ 6 9 .0 0 84. 00 75.00 72. 00 62.50 75.50 - 73.00 - 77.50 70. 50 8 8 . 50 6 8 .0 0 78. 50 9 0 . 00 77.00
S e cre ta r ies________________________ 89.50 102.50 101.50 92. 00 92. 50 93.50 9 0 .0 0 1 0 1 .0 0 103.00 1 0 2 .0 0 94. 50 107.50 90. 50 8 8 .0 0 104.50 1 0 6 . 00Stenographers:
General , 71 .50 78.50 85.00 78.00 73.00 75.00 74.50 78.00 - 83.00 76.00 85.00 75.00 71.50 9 1 . 00 8 8 .0 0S e n i o r . , ...... „ , 87 .50 9 8 .0 0 88.50 92.50 94. 50 95.50 - 95.50 - 9 6 .0 0 8 8 . 50 - 80. 50 8 8 .0 0 92. 50 95.50
Switchboard operators 76.00 85. 50 83.50 79.50 - - - - - 85. 50 80.00 81.00 - - 91.50 90. 50Switchboard operator-
receptionists ------------------- -— — — 72.00 78.00 83.00 70.50 76.50 73.50 67.50 69.00 76. 50 80.00 75.00 75.00 71.50 72.00 85. 50 85.00Transcribing-m achine operators,
Typists:82.00 " 82.50 73.00 75.50 69. 00 90.50 “ - 82.00 71.00 “ 71.00 76. 50 ■ 79.50
C lass A . . _ 81.50 80. 00 80. 00 - 86.50 71.50 - 72. 50 - 82.00 80.00 97. 50 75.00 _ 8 8 . 50 80.50C lass B . 64.50 67. 50 74. 00 63.00 6 9 .0 0 62.00 65.00 64.00 68.50 63. 50 77.50 60. 50 60. 50 76. 00 75. 00
1 Earnings relate to regular straight-tim e salaries that are paid for standard workweeks.
NOTE: Dashes indicate no data reported or data do not meet publication criteria,
Digitized for FRASER http://fraser.stlouisfed.org/ Federal Reserve Bank of St. Louis

30
(Average weekly earnings 1 fo r selected occupations studied, July 1962 through June 1963)
Table A-6. Office Occupations—Retail Trade
Northeast South North Central West
Sex, occupation, and gradeBoston
Newarkand
JerseyCity*
NewYork
Philadelphia
Pittsburgh
P rov idence—
Pawtucket
Atlanta Baltim ore Dallas Houston Miami NewOrleans
Washington2 Chicago C leve
land D etroit Indianapolis
Minneapolis— St. Paul
Denver PortlandSan-
F ra n cisco -Oakland
Seattle
Women
B illers , machine (bookkeepingm achine). ------ - - . . . . . . . $57.50 $64.50 $75.50 $62.50 $64.50 $54.00 - $56.50 - $61.00 $56.50 $59.00 $67.00 - $55.50 - - 1 6 2 .0 0 - $81.00 $78.00
Bookkeeping-machine operators:Clas s A _______________________ . - . . - - - - . - - - . 8 8 .0 0 - . - _ 73.50 . - -Class B -------------------------------------- 6 1 .0 0 - 77.50 6 6 .0 0 - 57.00 $67.50 $57.50 6 6 .0 0 $6 6 .0 0 69.00 55.00 72.50 73.50 _ 72.00 $57.50 $63.50 72.00 $73.50 - -
C lerk s :Accounting, class A------------------ 84.00 _ 94.50 80.00 87.00 - 79.50 76.00 78.00 83.50 78.00 81.50 82.00 91.50 _ 91.50 82.50 78.50 79.50 87.00 1 0 0 .0 0 8 6 .0 0Accounting, class B ------- . . — 64.00 72.50 73.00 61.50 69.00 59.00 66.50 60.00 64.00 67.50 67.00 60.50 6 6 .0 0 72.50 $6 6 .0 0 63.50 66.50 61.50 64.00 71.50 79.50 77.50File, cla ss B----------------------------- 54.00 _ 61.00 55.00 _ _ 54.50 50.00 _ - . - _ 66.50 _ - - 56.00 57.50 - 69.50 -File, c la ss C___________________ 54.00 _ 56.00 47.50 _ _ _ _ . _ - _ 51.50 58.50 47.50 - 54.50 - 58.00 - - -Ord e r ________ _________ _ 60.50 61.50 69.50 61.00 68.50 53.00 62.00 55.50 62.00 _ _ 65.00 _ 67.50 - _ _ 56.50 62.50 - 75.00 76.50P ayroll- ---------------------- — ------ 69.50 89.00 77.50 69.50 77.00 58.50 73.50 68.50 69.50 70.00 73.50 67.00 76.00 81.00 69.00 74.00 64.00 71.00 77.50 78.50 8 8 .0 0 87.00
Com ptom eter operators------------- . 65.50 78.50 75.50 67.50 75.00 60.50 71.00 70.00 68.50 70.00 60.00 58.50 77.00 76.50 65.50 71.50 73.50 64.50 66.50 72.50 83.50 81.50Keypunch operators:
Clas s A ________________________ 70.00 - 78.00 . - _ - . - - - - - 75.00 - - - - - - 83.00 -Class B -------------------------------------- 57.50 _ 69.50 65.50 _ _ 60.00 61.00 - - 59.00 54.50 - 73.50 - 73.00 - 59.00 _ - - 79.00
O ffice g i r ls ------------------------------------- 54.00 . _ _ _ _ - - - - - - - 64.50 - 53.50 - 52.50 54.00 - . -S ecre ta r ies -------------------------------------Stenographers:
87.00 94.00 9 8 .0 0 82.50 82.00 6 6 .0 0 85.50 78.50 80.50 87.00 78.00 78.00 89.00 97.00 86.50 90.50 81.50 85.50 87.00 87.50 98.50 90.50
6 8 .0 0 _ 76.50 6 6 .0 0 73.00 _ 67.00 _ 69.50 70.50 65.00 60.00 _ 78.50 68.50 71.00 65.00 64.50 70.50 _ _ _Senior ____________________________ _ - _ _ _ _ - - - - - - - - - - - 75.00 71.50 - - -
Switchboard operators— ---- -------- 64.50 68.50 72.50 60.00 64.00 55.50 63.00 55.00 55.00 60.00 57.50 49.00 64.00 69.00 56.50 64.50 53.50 58.50 61.00 62.50 78.00 73.50Switchboard operator-
reception ists------------- ------- ------ 61.50 - 80.00 61.00 - - - - 65.50 63.00 59.50 64.00 - 74.50 - - 66.50 60.50 67.00 63.00 - 70.00T yp ists :
Class A ~ ______________________ . - 75.00 - - - 58.00 - - - - - 78.50 79.50 - - - 63.00 74.00 - - .Class B --------------- ------- — ------ 59.50 61.50 6 6 .0 0 57.50 64.00 52.50 58.00 55.50 63.50 60.00 55.00 55.50 64.00 70.00 56.00 62.50 59.50 55.00 61.00 " 75.00 75.50
1 Earnings relate to regular straight-tim e salaries that are paid fo r standard workweeks.2 Exceptions to the standard industry limitations are shown in footnote 5 to the table in appendix A.
NOTE: Dashes indicate no data reported or data do not m eet publication criteria .
Digitized for FRASER http://fraser.stlouisfed.org/ Federal Reserve Bank of St. Louis

Table A-7. Office Occupations—Finance1
(Average weekly earnings2 for selected occupations studied, July 1962 through June 1963)
31
Northeast South North Central West
Sex, occupation, and gradeBoston
Newarkand
JerseyCity
NewYork Philadelphia Pittsburgh Atlanta Baltim ore Dallas Washington Chicago Cleveland Detroit
Minne - apolis— St. Paul
St. LouisLos
A n geles-LongBeach
SanF rancisco—
Oakland
Men
Clerks: JAccounting, c la ss A $84.00 $95.00 $98.00 $87.00 $97.00 $99.50 $9 8 .0 0 $98.50 - $102.50 - - - - $108.50 $ 1 0 0 .0 0Accounting, cla ss B____________ - 70.50 77.50 75.50 - 171.00 - 68.50 - 85.50 - $81.00 - $6 6 .0 0 - -
O ffice boys____________________ ___ _ 54.00 61.50 62.00 53.00 55.00 '56.50 54.50 55.00 $56.00 64.50 $65.00 62.50 $52.50 51.00 65.50 63.50Tabulating-m achine operators:
Class A _________________________ 8 6 .0 0 102.50 100.50 90.50 - 1 0 1 .0 0 - 95.50 - 109.50 - - 1 0 1 .0 0 - 109.50 -Class B 74.00 89.50 8 9 .0 0 71.00 83.00 75.00 78.50 78.00 81.50 92.50 - 91.50 87.50 - 97.00 97.00Class C ------------------------------------------------ 63.50 72.00 74.00 62.50 " - 64.00 64.50 - - - - 71.50 - 83.50 86.50
Women
Bookkeeping-m achine operators:Class A 67.00 - 79.50 74.00 - 74.50 - 67.50 79.50 - - 77.00 - - - -Class B _______________________________ 62.00 62.50 71.50 58.00 65.00 64.00 55.00 61.50 6 6 .0 0 74.00 6 9 .0 0 64.50 - 53.50 65.50 70.00
Clerks:Accounting, cla ss A__ 79.50 82.50 90.50 79.00 - 81.00 80.50 76.00 87.00 93.00 91.50 89.50 8 6 .0 0 76.50 9 8 .0 0 8 8 .0 0Accounting, cla ss B __ 63.50 71.50 69.50 62.50 61.50 64.00 60.50 59.50 66.50 72.00 72.00 67.00 67.50 57.50 75.50 73.50F ile , c la ss A__ 65.00 71.00 80.50 6 8 .0 0 - 70.50 63.50 66.50 - 77.00 - 75.00 70.00 - 70.00 75.50F ile , c la ss B 56.50 57.00 6 9 .0 0 54.00 60.50 56.50 52.50 56.00 61.50 62.50 63.00 58.00 56.00 58.50 62.00 60.50F ile , c la ss C__ 52.50 53.50 60.00 50.00 - 52.50 50.00 50.50 58.00 57.50 57.00 58.00 49.50 51.00 59.50 57.50P a yro ll. 72.50 8 8 .0 0 92.50 71.00 - 77.00 - 78.00 77.50 92.50 - - - - 87.50 94.50
Com ptom eter operators Keypunch operators:
" " 77.50 ‘ ■ _ ■ 76.00 6 9 .0 0 ■ ■ “
Class A _______________________________ 70.50 77.50 80.00 66.50 - 71.50 6 9 .0 0 6 8 .0 0 - 78.50 - 76.00 73.00 74.00 82.00 80.00Class B 59.50 65.00 71.00 6 1 .0 0 63.50 65.00 56.50 58.50 6 8 .0 0 72.50 69.50 6 8 .0 0 6 1 .0 0 61.50 80.50 71.50
O ffice g ir ls 54.00 57.00 62.50 52.50 - 57.50 - 50.50 - 60.50 - 56.50 50.50 51.50 62.00 62.50Secretaries 84.50 9 2 .0 0 98.50 82.50 8 9 .0 0 83.50 79.50 85.00 93.00 97.50 90.50 89.50 86.50 81.50 99.50 9 6 .0 0Stenographe r s :
G eneral 65.50 70.50 74.50 6 6 .0 0 70.00 66.50 62.00 64.50 74.50 78.00 67.00 67.50 63.00 62.00 81.00 79.00S enior 74.50 85.00 86.50 77.50 - 81.00 76.50 81.00 - 91.50 83.50 80.50 76.50 69.50 90.50 8 6 .0 0
Switchboard operators _ 70.00 72.00 81.50 66.50 73.50 71.00 65.50 68.50 60.00 83.00 76.00 74.50 6 9 .0 0 63.00 77.00 78.50Switchboard operator -
receptionists 6 9 .0 0 74.00 79.00 67.50 - 6 1 .0 0 - 70.00 - 80.50 - 6 9 .0 0 70.50 70.00 76.00 77.00Tabulating-m achine operators:
Class B 76.00 - - 75.50 - - - - - 88.50 - - - - 93.50 9 1 .0 0Class C _____________ ____________ 62.00 - - - - - - - - . - - _ - - -
T ranscribing-m achine operators,general _ — — 65.00 67.50 77.00 61.50 - 63.50 63.50 63.00 76.00 74.00 64.50 72.00 63.00 67.00 76.00 77.50
Typists:C lass A . 71.00 74.50 74.50 64.50 64.50 65.00 63.00 6 6 .0 0 75.50 76.00 74.50 75.50 65.00 62.50 77.50 75.00Class B 57.00 60.00 6 6 .0 0 57.50 58.50 57.00 55.00 54.00 64.50 66.50 61.50 6 1 .0 0 58.00 53.50 65.00 67.00
1 F inance, insurance, and rea l estate.2 Earnings relate to regular straight-tim e salaries that are paid for standard workweeks.
NOTE: Dashes indicate no data reported or data do not meet publication criteria.
Digitized for FRASER http://fraser.stlouisfed.org/ Federal Reserve Bank of St. Louis

32
Tabic A-8. Office Occupations—Services
(Average weekly earnings1 for selected occupations studied, July 1962 through June 1963)
Northeast South North Central West
Sex, occupation, and gradeBoston
Newarkand
JerseyCity
New York Philadelphia Washington Chicago DetroitLos
A n g e les -Long
B ea ch 1 2
O ffice c le r ica l
Men
C lerks, accounting, cla ss A .-------- $ 100.50 . $ 104.50 - _ _ . $99 . 50O ffice boys— ___ — 53.00 - 58. 50 $ 52. 50 $ 58.00 $63 .00 $62 . 50 72.00
Women
Bookkeeping-machine operators, class B __ 80.50 81.00 99.00
Clerks:Accounting, class AA cco u n tin g , c la s s RF ile , c la ss A—_________________
87.0071.50
$ 100.50 67. 50
93.5071.50 80.00
69.0092. 50 70.00
99.00 76. 5079.00
9 1 .50 72. 50
97. 50 78.00
F ile , cla ss B . . 61.50 - 6 6 . 50 65. 50 74. 00 64. 50 - 60. 50F ile , cla ss C——____ ___________ - - - - 63.00 - - -P ayroll— — _ —
Com ptom eter operators___________74.00 83.00 8 6 .0 0
82.00 _ 77. 50 84.50 77. 50
87.00 95. 50
Keypunch operators:Class A - - 83.50 - - - 77.50 93.00Class B _________________________ 6 8 . 50 - 6 8 .0 0 - 69. 00 81.50 75.50 82. 50
Secretaries 8 8 . 00 102.50 9 6 .0 0 85. 50 92. 50 98. 50 97.00 100.50Stenogr aphe r s :
G enera l— — _____Senior — _
Switchboard operators_____________
70. 50 80. 50 64.50
84.00
71. 50
80. 50
75. 00
73. 50
59. 50
83. 50
65. 00
81.50 84.00 67. 50
72. 50
67. 50
85. 00 93. 50 67.00
Switchboard operator-receptionists 70.00 75. 00 79. 00 6 8 . 50 79. 50 82.50 73. 50 80. 50
Transcribing-m achine operators,general - - - - - 78.00 - -
Typists:Class A — __— _________________ 73.00 78. 50 82.00 71. 50 77. 50 85.00 8 6 . 50 77. 50Class B . 62. 50 71. 50 69.00 60.50 6 8 . 50 69. 50 6 6 .0 0 69. 50
P rofessiona l and technical
Men
Draftsmen:Senior — 128.50 130.50 130.50 142. 00 115.00 154.00 148.00 150.50Junior 97. 50 100.50 99. 50 109. 50 83.00 125. 00 104.00 “
1 Earnings relate to regular straight-tim e salaries that are paid for standard workweeks.2 Excludes data for m otion picture production and allied serv ices ; data for these industries are included, how ever, in
"a ll industries" and "nonmanufacturing. "
NOTE: Dashes indicate no data reported or data do not meet publication criteria.
Digitized for FRASER http://fraser.stlouisfed.org/ Federal Reserve Bank of St. Louis

Tabic A-9. Plant Occupations—All Industries
(Average hourly earnings 1 for selected occupations studied in 6 broad industry divisions, July 1962 through June 1963)
33
Occupation 2
NortheastAlbany—
Schenectady—T roy
Allentown—Bethlehem—
EastonBoston 3 Buffalo B u rl
ington
Lawrence— H aver-
hill
Manchester
Newark and
Jersey City 3
NewHaven
NewY ork3
Paterson—Clifton—P assaic
P h iladelphia
P ittsburgh
P ortland
P ro v id en ce - Paw - tucket
Scranton Trenton Water -
buryW orces
ter York
Maintenance and powerplant
Carpenters ............... . , _ $2 .8 6 $2.82 $2.89 $2.96 $2.27 $2.61 $2 .2 0 $3.05 $2.57 $3.00 $3.00 $3.03 $3.13 $2.37 $2.38 $2.38 $2.77 $2 .6 6 $2.64 $2.56E lectricians __ 3.06 2.87 2.95 3.19 2.67 2 .8 8 2.24 3.19 2.79 3.18 3.11 3.05 3.18 2.54 2.63 2.84 2.98 2 .9 0 3.00 2 .6 8Engineers, stationary----------------t— 2.81 2.99 2.82 2.87 - 2.79 - 3.45 2.64 3.31 3.06 '2 .6 3 3.06 2.36 2.69 _ 2 .8 8 2.87 2.89 _F irem en , stationary b o i le r _______ 2.34 2.35 2.43 2.58 2.05 2.49 1.62 2 .9 0 2.28 2.70 2.50 2.46 2.79 1 .9 0 2 .2 0 1.67 2.39 2 .0 2 2.33 2.19H elpers, tra d es___________________ 2.39 2.54 2.35 2.51 - 2.14 1.79 2.37 2.33 2.49 2.34 2.49 2.71 2.18 1 .8 8 2.36 2.41 2.13 2.13M achine-tool operators,
too lroom — — __ - - 2.84 3.23 - 2.74 - 3.17 2.60 2.93 _ 2.93 3.28 2.36 2.52 _ _ _ 2.60 2.73M achinists _ — 3.03 2.94 2 .9 2 3.22 2.52 2 .6 8 2 .2 1 3.17 2 .6 8 3.28 3.01 3.07 3.42 2.71 2.64 2.63 3.01 2 .9 0 2.79 2.72M echanics, a u tom otiv e___________ 2.78 2.81 2.77 2.83 2.41 2.49 2.25 2.99 2.83 3.09 2.84 2.89 3.16 2.30 2.63 2.64 2.96 2.71 2.67 2.65M echanics ............ 2.78 2 .8 6 2.72 3.10 2 .8 6 2.78 2.32 3.18 2.87 3.14 2 .8 6 2.92 3.11 2.50 2.56 2.67 2.73 2.80 2.81 2.62M illwrights 3.04 3.07 2.82 3.18 - 2.71 - 3.12 2.65 3.12 3.17 3.05 3.32 _ 2.56 - 3.15 2.82 2.70 2.78O ilers _________________ _______ 2.36 2.53 2.26 2.74 - 2.18 - 2 .6 6 2.19 2.58 2.47 2.36 2 .6 8 - 1.87 - 2.36 2.42 2.41 2.15P a in ters____________________ ______ 2.81 2.82 2.57 2 .8 8 2.05 - - 2.96 2.54 2.71 2.87 2.82 2.94 2.05 2.40 - 2.82 2.50 2.87 2.24P ipefitters _ . 3.12 2.81 2.94 3.09 - 2.74 _ 3.21 2.81 3.04 3.08 3.07 3.09 _ 2.50 - 2.98 _ 2.95 2.63Plum bers ___________ ______________ - - 2.85 - - - _ 2.96 - 2 .8 6 2 .9 2 2.81 3.00 - _ _ 2.75 _Sheet-m etal w o r k e r s ______________ 3.04 - 2 .9 0 3.18 _ _ . 3.18 2.70 3.10 3.06 2.97 3.15 _ 2.82 _ _ 2 .9 0 2 .9 2 _T ool and die m a k ers____ __________ - 2.96 3.14 3.37 - 3.08 - 3.22 2 .8 8 3.25 3.34 3.25 3.32 2.82 3.12 2.99 3.38 2 .9 8 2.76 2.84
Custodial and m aterial movem ent
Elevator operators, passenger(men) 1.32 - 1.46 - - - - 1.97 - 1.99 _ 1.77 1.94 - 1.26 . . _ _ _
Elevator operators , passenger(women) 1.36 - 1.31 1.31 - - - 1.54 - 1.83 - 1.52 1.73 1 .0 1 1.30 1.13 1 .1 1 - 1.28 _
Guards and watchmen 2 .1 0 2.24 1.79 2.24 - 2.13 1.45 1.84 1.76 1 .9 6 2.19 1.79 2.32 1.79 1.62 1.55 2.14 2.15 2.05 1.83Janitors, p orters , and cleaners
(m en )_____ XT_____ ________________ 1.85 1.97 1.80 2 .1 1 1.69 1.67 1.43 2 .0 0 1.67 1 .9 2 2 .0 2 1.91 2.08 1.72 1.63 1.54 1.93 1 .9 0 1.89 1.70Janitors, p orte rs , and cleaners
(wom en)- ____ __ 1.50 1.99 1.45 1.55 - 1.72 - 1 .6 6 1.77 1.73 2 .0 1 1.48 1.65 1.35 1.40 1 .11 1.35 1.55 1.53 1.48L a b orers , m aterial handling_____ 2.15 2.40 2.14 2.43 1.81 2.09 1.69 2.54 2 .1 1 2.43 2.34 2 .2 1 2.45 1.84 1.95 2.06 2.08 2 .2 0 2.09 2.04O rder f i l le r s _______________________ 2.36 1.76 2.15 2.59 - - 1.59 2.55 2 .2 2 2 .2 2 2.43 2.37 2 .6 6 2.09 1.94 _ 2.27 2 .9 2 2 .1 1 2.05P a ck ers , shipping (men)__________ 2 .0 1 1.65 2.03 2.37 2.04 2.19 1.67 2.32 2.04 2 .0 0 2 .2 1 2.05 2.17 _ 1.77 1 .6 8 2.18 2.42 2.31 1.94P a c k e r s T sh ipping (w om en ) - - 1.60 2.13 - 1.49 1.51 1.81 - 1.91 1.71 1.63 1.87 1.90 1.60 _ _ 1 .9 0 _ 1.73Receiving c le r k s ----- ..------------ ,-------- 2.17 2.18 2 .1 2 2.48 2.04 2.08 1.75 2.38 2 .2 0 2.34 2.70 2.26 2.56 2 .1 1 1.93 2 .0 1 2.24 2.23 2 .1 2 2 .2 1Shipping c le r k s . . . . . . 2.47 2.41 2.24 2.74 2.17 2 .1 2 1.97 2.56 2.18 2.48 2.69 2.37 2 .6 6 2.17 2.03 1.87 2 .2 2 2.13 2.35 2.38Shipping and receiving c l e r k s ------- 2.44 2 .2 0 2 .2 2 2.56 - 2.09 2.07 2.50 2.37 2.47 2.48 2.46 2.54 2.17 1.93 2.13 2.35 2.45 2 .0 0 1.87T ruckdrivers 4 ___________ __________ 2.78 2.62 2.56 2.74 2.33 2.48 2 .2 1 3.07 2.55 3.02 2.84 2.75 2.95 2.16 2.65 2.55 2.73 2.42 2.45 2.44
Light (under lV2 tons)__________ 2.08 2.15 2 .1 1 2.59 - - 1.57 2.73 2.03 2.43 2.67 2.44 2.71 1 .9 0 1.61 2.27 _ 2.09 1.99 1.55Medium (1V2 to and
including 4 to n s )---------------------- 2.72 2.18 2.42 2.53 2 .2 1 2.31 1.98 3.05 2.58 2.96 2.78 2.75 2.91 1.80 2.32 2.61 2.50 2 .1 2 2.17 2 .1 0Heavy (over 4 tons,
tra iler type)_____ _ 2.93 2.79 2.77 2*92 - - 2.42 3.16 2.76 3.06 3.04 2.80 3.18 2.32 2 .8 8 _ 2 .9 2 2.61 2.69 2.48Heavy (over 4 tons, other
than tra iler ty p e )--------------------- 2.91 2.54 2.60 2.74 - - - 2.70 _ 3.27 2.73 2.76 2.84 2.16 2.49 _ 2.47 2.30 2.64 _T ru ck ers, power (forklift) 2.42 2.44 2.42 2.59 2.07 2.44 2.03 2 .6 6 2.18 2.69 2.49 2.39 2 .6 6 2.04 2 . 1$ 2.17 2.38 2.63 2.42 2.23T ru ck ers , power (other
than fork lift)______________________ " " 2.37 2 .6 1 “ " 2.34 2.28 2.63 2.85 2.30 2 .9 2 ■ 2.03 _ 2.44 2.29 2.60 -
See footnotes at end of table.
Digitized for FRASER http://fraser.stlouisfed.org/ Federal Reserve Bank of St. Louis

34
Table A-9. Plant Occupations—All Industries— Continued
(Average hourly earnings1 for selected occupations studied in 6 broad industry divisions, July 1962 through'June 1963)
South
Occupation 2Atlanta Balti
m ore 3
Beaumont—P ort
Arthur
Birm ingham
C harleston,
W. Va.Charlotte
Chattanooga 3 Dallas3 F ort
WorthG reen
ville Houston Jackson Jacksonville3
Little R ock - North
Little R ock 3
L ou isv ille
Lubbock Memphis 3 M iam i3 New
Orleans
N orfolk— Portsmouth and Newport
News—Hampton
OklahomaC ity 3
Maintenance and powerplant
Carpente r ........ . $2.59 $2.80 $3.40 $3.00 $3.32 $2.30 $2.28 $2.69 $2 .6 0 $1.81 $3.22 - $2.61 $2.28 $3.19 _ $2.40 $2.58 $2.70 $2.75 -E lectricians 3.08 2.92 3.41 3.45 3.36 2.56 2.70 2.85 3.11 1.99 3.27 $2.72 2.81 2.42 3.30 - 2.97 2.53 3.07 3.06 $2.73Engineer*, stationary ............. ..... 2.79 2.74 3.25 3.18 3.25 2.49 2.71 2.44 2.77 2 .0 0 2.54 2.56 2.60 2.27 3.11 - 2 .6 2 2.26 2.38 2.56 2.26Firem en, stationary b o i le r ---------- 1.89 2.47 3.17 2.71 - 1.58 1.64 2.18 - 1.34 - - - - 2 .6 8 - 1.59 - 2 .2 0 1.89 -H elpers, tra d es .. ................... 2 .1 1 2.42 2.85 2.61 2.69 1.60 2.13 1.82 1.92 1.46 2.44 - 2 .1 6 1.78 2.38 _ 1.83 1.80 2.13 2.35 1.97M achine-tool operators,
toolroom . _ _ - 2.92 _ - - - - - - - 2.98 - - - 3.24 - - - - - -Machinists 2.89 3.21 3.46 3.48 3.37 2.46 2.69 2.56 3.02 1 .9 6 3.30 2.63 2.77 2.70 3.29 - 2 .8 8 3.12 3.09 3.10 -M echanics, autom otive.. _ _____ 2.78 2.82 2.94 2.70 2.93 2 .6 6 2.14 2 .6 8 2.26 2.36 2.72 2.45 2.43 2.63 2 .8 6 - 2.76 2.40 2.62 2.60 2.56M echanics. __ 2.59 3.05 3.29 3.19 3.42 2 .2 1 2.61 2.60 2.47 2.18 2.98 2.47 2.43 2.41 3.17 - 2.69 2.38 2.87 2.79 2.58M illwrights . 3.03 _ 3.22 3.35 - - - 2.73 - 3.39 - - - 3.05 - 2.90 - 3.30 - -O ilers 2 .1 0 2.71 2.85 2.64 - 1.48 2.24 2.27 2.39 1.39 2.52 - 2.13 - 2.63 - 2.28 - 2.41 - -P a in ters . 2.43 2.67 3.40 2.97 3.27 2.48 2.50 2 .6 6 1 .6 8 3.18 - 2.35 _ 3.15 - 2.37 2.32 2.52 - -P ip e fitters . _ __ 3.14 2.91 3.48 - 3.38 - 2 .9 2 - - - 3.43 - 3.06 - 3.35 - 3.02 - 3.09 - -Plum bers - - - - - - - - - - - - - - - - - - - - -Sheet-m etal w orkers - 3.00 3.45 - 3.38 - - - - - 3.49 - - - 3.27 - - - - - -Tool and die m a k e r s . ----- — - — 3.29 3.21 - 3.02 - - - 3.00 3.17 - 3.19 - - 2 .9 0 3.56 - 3.13 2.62 3.42 -
Custodial and m aterial movement
Elevator operators, passenger( m e n ) ....... . _ . 1 .0 2 1.18 - - - - - 1 .2 2 - - - - - - 1.09 - .80 .94 .91 - -
Elevator operators, passenger(w om en) .70 1.16 - .78 .83 - .6 8 1 .1 2 .94 - 1 .1 0 .79 - .79 1.06 - .78 .94 .83 .96 .91
Guards and watchmen^. 1.62 1.79 2.73 1.91 2.70 1.56 1.82 1.54 2.05 1.29 1.74 1.50 1.38 1.38 1.97 $1.25 1.52 1.58 1.35 1.85 1.50Janitors, porters, and cleaners
(men) — 1.43 1.60 1.92 1.62 1 .9 0 1.30 1.43 1.40 1.51 1.25 1.47 1.25 1.33 1.34 1.80 1.30 1.37 1.36 1.18 1.55 1.37Janitors, porters, and cleaners
(women) _ 1.05 1.39 1.36 1 .0 2 1.45 1.19 1.19 1.13 1.16 1.08 1.23 1.13 1.13 .96 1.58 - 1.05 1.26 .94 .98 1.25L aborers, m aterial handling 1.77 2 .2 0 2 .1 1 1.76 2.58 1.65 1.75 1.77 1 .6 8 1.38 1.64 1.41 1.65 1.46 2.25 1.43 1 .6 8 1.72 1.65 1.77 1.93O rder fille rs 1 .8 8 2.08 1.60 1.55 - 1.59 1.83 1.80 1.58 1.42 1.91 1.35 1.69 1.44 2.19 1.60 1.65 1.77 1.53 - 1 .6 8P ackers, shipping (men) 1.69 1.84 - 2.19 2 .0 2 1.49 1.38 1.70 1.78 1.42 1.58 - 1.62 1.40 2.15 - 1.89 1.54 1.42 1.70 1.82P ackers, shipping (wom en)____ __ 1.55 1.48 - - - 1 .2 2 - 1.35 - 1.24 - - - - 1.78 - 1.39 - - -Receiving c lerks 2.03 2.33 2.30 2.13 2.94 1 .8 6 1.84 2 .0 2 1.67 1.63 2 .1 2 1.62 1.87 1.57 2.34 1.84 1.85 2.03 1.83 2.38 2.13Shipping clerks 2.34 2.46 2.41 2.82 - 2 .0 0 2.07 2 .1 2 1.96 1.85 2.31 - 1.85 1.75 2.44 - 1.98 2.46 2.05 - -Shipping and receiving r le r k s 2.47 2.33 2.79 2.83 2 .6 2 1.95 - 2.04 - 1.76 2.24 2 .1 0 2 .2 1 1.84 2.23 - 2.08 2.28 2 .1 1 1.91 2.04T ru ckd rivers4 2.40 2.49 2.54 2 .1 1 2 .6 8 2.14 1.97 2.30 1 .8 6 1.92 2.18 1.80 1.92 1.93 2 .6 2 1.76 2.15 2 .1 0 1.94 1.75 2.23
Light (under 1V2 ton s)-------------- 1.52 2.23 2.45 1.45 - 1.61 1.47 1.65 1.43 - 1.63 1.27 1.43 1.52 1.76 1.51 1.49 1.76 1.43 1.30 1.47Medium ( 1V2 to and
including 4 to n s)---------------------- 2.47 2.31 2.60 2.06 2.58 2.33 2 .0 1 2.47 1 .6 8 1.40 2.25 1.87 1.94 1.69 2.32 1.93 2.16 2.07 1.95 1.65 2.27Heavy (over 4 tons,
tra iler type)_______ _______ __ 2.80 2.69 2.33 2.26 - 2.80 1.95 2 .2 0 2.04 2 .6 8 2.52 2.41 2 .2 0 2.67 2.94 1.81 2.48 2.37 2.31 2.17 2.33Heavy (over 4 tons, other
than tra iler type)..__________ _ - 2.52 - 1.99 2.75 - - - - 2.18 2.80 - - - 2.85 - 1 .8 6 2.23 2.06 - -T ruckers, pow er (forklift) 2 .2 0 2.57 2.85 2 .2 1 2.74 2.03 1.84 1.91 2 .1 0 1.57 2 .2 0 1.49 1.71 1 .6 8 2.45 1.62 1.82 1.74 2.16 1.76 2.17Truckers, pow er (other
than forklift)______________________ 2.40 2.47 " 2.16 " “ 1.81 2.30 " “ 1.54 ■ 2.23 ~ 2.40 ~ 2.50 " 2 .2 0 1.87 “
See footnotes at end of table,
Digitized for FRASER http://fraser.stlouisfed.org/ Federal Reserve Bank of St. Louis

(Average hourly earnings1 for selected occupations studied in 6 broad industry divisions, July 1962 through June 1963)
Table A-9. Plant Occupations—All Industries— Continued
35
O ccupation2
South— Continued North Central
Raleigh Richm ond3
SanAntonio3
Savannah3
Washington3 Akron Canton Chicago 3 Cincin
natiC leveland Columbus
D avenport- R ock Island—
MolineDayton Des
M oines D etroit3 GreenBay
Indianapolis 3
KansasCity Milwaukee
Minneapolis.— St. Paul
Muskegon—Muskegon
Heights
Maintenance and powerplant
Carpenters _ $2.77 $2 .2 1 $2.87 $2 .8 6 $3.21 $2.91 $3.33 $2.94 $3.07 $2.89 $3.09 $3.21 $3.13 $3.24 _ $2.93 $3.02 $3.04 $3.02 $2.85E lectricians $2.59 3.04 2.63 3.08 2.93 3.24 3.12 3.38 3.09 3.22 3.09 3.38 3.26 3.24 3.45 $2.70 3.21 3.26 3.38 3.28 2.93Engineers, stationary - 2.64 2.67 - 2.97 3.24 2.91 3.30 3.17 3.09 2.91 3.08 3.15 2.71 3.35 2.69 3.04 2.99 3.04 3.02 _
1.36 1.96 - 2 .2 0 1 .8 6 2.99 2.80 2.70 2.70 2.78 2.35 2 .2 2 2 .6 6 2.58 3.13 2.34 2.25 2.41 2 .6 8 2.75 2.51H elpers, trades . 2.31 1 .8 8 2.33 2.26 2.65 2.62 2.54 2.26 2.58 2.34 2.60 2.44 2.72 2 .6 8 2 .2 1 2.41 2.60 2.56 2.61 2.64M achine-tool operators,
toolroom - - - - - - 3.25 3.22 3.13 3.17 3.16 3.23 3.28 3.30 3.48 _ 3.23 3.07 3.39 2.78 3.16M achinists - 3.03 - 3.19 3.02 3.13 3.23 3.33 3.08 3.13 3.20 3.40 3.31 3.24 3.44 2.80 3.16 3.29 3.41 3.27 2 .9 6M echanics, autom otive_____________ 2.46 2.40 2.58 2 .6 8 2.75 3.04 2.78 3.27 2.83 3.04 2.93 2.98 2.82 2.89 3.15 2.71 2.91 2 .8 8 3.10 3.01 2.85M echanics 2.31 2.87 2.58 2.73 3.15 3.26 2.96 3.11 2.89 3.13 2.76 3.25 3.06 3.03 3.39 2.59 3.20 3.05 3.12 2.94 2.90Millwrights . - - - - 3.24 3.09 3.26 3.15 3.21 2.93 3.24 3.25 _ 3.38 2.81 3.26 3.25 3.18 3.11 2.87
- 2 .0 2 - 2.39 - 3.02 2.53 2.57 2 .6 8 2 .6 8 2.47 2 .6 6 2.60 2.70 2.77 2.39 2.57 2.63 2.80 2.72 2.59Painters - 2.69 - 2.78 2.47 3.06 2.93 3.40 2.93 2.90 2.83 2.89 3.00 2.98 3.20 2.46 2.80 3.03 3.17 3.21Pipefitters . 3.15 - 3.09 - 3.24 3.09 3.34 3.21 3.13 3.09 3.30 3.30 _ 3.38 2.74 3.18 3.22 3.27 3.24 2.90Plum bers . - - - . - _ 3.47 _ _ _ _ 3.04 _ 3.18 _ _ _ _ _ _Sheet-m etal w ork era_______________ - 3.14 - _ _ 3.30 _ 3.25 3.19 3.18 3.18 3.28 3.34 _ 3.38 _ 3.29 3.19 3.32 _ _T ool and die m akers - - - - 3.41 3.16 3.50 3.31 3.44 3.43 3.58 3.57 3.24 3.60 - 3.37 3.20 3.65 3.36 3.19
Custodial and m aterial m ovem ent
Elevator operators, passenger(men) - - - - 1.16 - - 2.24 - - - - - _ 1.59 _ 1 .2 0 _ _ 1.64 _
E levator operators, passenger(women) - .85 .92 - 1.24 - - 1.44 1 .2 1 1.24 1.05 .95 _ 1 .1 1 1.39 _ .89 1.28 1.39 1.59
Guards and w atch m en .....—. . . . . . —. — 1.39 1 .8 8 1.70 1 .9 0 1.60 2.53 2.47 1 .9 2 2.29 2.14 2.05 2.40 2.51 2.32 2.40 1.94 2.14 1.98 1.92 2 .1 0 2.42Janitors, p orters , and cleaners
(men) . . . —------- ----------------------- ------— 1.26 1.50 1 .2 2 1.42 1.46 2.43 2.16 2 .0 2 1.91 2.05 1.77 2 .1 2 2.08 1.93 2.27 2.03 1.73 1.83 2.16 1.99 2.28Janitors, porters , and cleaners
(wom en)-------- — .................... ......— 1.13 1.25 1 .0 1 1 .2 0 1.28 1 .9 6 1.64 1.78 1.47 1.56 1.48 1.81 1.85 1.38 1.65 1.61 1.56 1.57 1.71 1 .6 6 1.82L a borers, m aterial handling______ 1.42 1 .6 6 1.47 1.71 2.05 2.71 2.36 2.38 2.36 2.46 2 .1 1 2.39 2.36 2.23 2.57 2.31 2.24 2.23 2.44 2.49 2.37O rder f i l l e r s ___—.— ——__. . . . 1.61 1.82 1.26 1 .9 2 1.99 2.59 2.40 2.35 2 .1 2 2.35 2 .1 2 2.32 2.27 2.49 2.53 2.26 2.14 2.32 2.53 2.50 2.53P a ck ers, shipping (m en)._________— 1.33 1.52 1.28 - 1.67 2.72 2.48 2 .2 2 1.85 2.39 1.94 2.61 2.32 2.41 2.51 _ 2 .0 1 2.05 2.46 2.42 2.56P a ck ers, shipping (w om en)________ - - - - - 1.99 _ 1.82 2.05 1 .8 8 1.72 _ 1.83 _ 2.35 _ 1.57 1.70 1.94 1.83Receiving clerks 1.74 2.15 1.71 - 1.98 2.51 2.38 2.49 2.19 2.37 2 .2 1 2.26 2.33 2.47 2 .6 8 2.34 2.30 2.29 2.57 2.50 2.55Shipping clerks - 2 .1 1 1.96 - 2.19 2.78 2.59 2.53 2.19 2.42 2.27 2.60 2.51 2.49 2.80 _ 2.46 2.32 2.71 2.65 2.71Shipping and receiv ing c lerks ——. . . - 2.16 1.83 - 2.30 2.78 2.31 2.61 2.36 2.53 2.24 2.29 2.34 2.27 2.71 _ 2.43 2.71 2.57 2.52T ru ck d rivers4 — 1.87 1 .8 8 1.74 1.96 2.30 2.93 2.50 3.04 2.85 2 .8 6 2.54 2.40 2.75 2 .6 8 2.93 2.65 2.50 2.65 2.89 2.82 2.61Light (under IV2 tons) 1.33 1 .9 0 1.31 1.48 1.61 2 .8 6 2.24 2.89 2 .6 8 2.61 2.15 1.75 2.30 2.06 2.48 _ 2.03 1.94 2.63 2 .6 8
Medium ( 1V2 to and including4 tons).-------— — ----------------------- 1.89 1.78 1.85 2.15 2.28 2^82 2.48 2.99 2.69 2 .8 6 2.36 2.26 2.48 2.32 2 .8 6 2.62 2.39 2.57 2.62 2.83 2.62Heavy (over 4 tons,tra iler type) —------------------- — - 2.30 1.83 - 2.61 3.02 2.78 3.15 2.89 2.97 2.82 2.56 _ _ 2.98 _ 2.81 2.78 3.10 2.87
Heavy (over 4 tons, otherthan tra iler type) - • - - - 2.46 - _ 3.11 2 .8 8 2.90 2.85 2.35 2.45 2.39 3.04 _ _ 2.93 2.73
T ru ckers, pow er (fo rk lift)_________ 1.70 1.84 1.48 2.19 1.93 2.96 2.46 2.54 2.67 2.61 2.39 2.65 2.58 2.46 2.70 2.35 2.49 2.48 2.67 2.58 2.47T ruckers, pow er (other thanforklift) “ “ " 2 .0 0 * ■ 2.52 2.46 2.33 2.83 2.18 2.62 2.44 - 2.76 - 2.54 2.60 2.58 2.51 2.45
See footnotes at end of table.
Digitized for FRASER http://fraser.stlouisfed.org/ Federal Reserve Bank of St. Louis

36
(Average hourly earnings 1 for selected occupations studied in 6 broad industry divisions, July 1962 through June 1963)
Table A*9. Plant Occupations—All Industries— Continued
Occupation2
North Central— Continued West
Omaha 3 Rockford St.Louis 3
SiouxFalls
SouthBend T oledo W aterloo Wichita Albu
querque Boise DenverLos
A n geles-Long
Beach3
Phoenix 3 PortlandSalt
LakeCity
SanBernardino—R iverside—
Ontario
SanDiego
SanFrancis c o -
Oakland 3Seattle3 Spokane
Maintenance and powerplant
Carpenters _ $2.97 $2.52 $3.12 _ $3.20 $3.15 $2.96 $2.61 . _ $3.04 $3.13 $2.93 $3.21 $2.99 $2.89 $3.05 $3.58 $2.94 $3.22E lectr ic ia n s__ 3.14 2.95 3.26 - 3.25 3.29 3.22 2.91 $3.25 - 3.16 3.37 3.36 3.28 3.04 3.21 3.37 3.47 - 3.38Engineers, stationary_____________ 2.70 2 .6 1 3.13 - 3.10 3.20 3.01 •2.63 2.94 - 2.97 3.44 2 .9 0 3.10 - - 3.21 3.43 3.06 2.96Firem en, stationary b o i le r _______ 2.35 2.24 3.01 - 2.94 2.71 2.79 - - - 2.43 3.03 - 2.63 2.47 2.55 - 2.87 2.63 2.53H elpers, tra d es___________________ 2 .2 0 2.31 2.74 - - 2.77 2.39 - 2.58 - 2.37 2.65 2.16 2.51 2.57 2.55 2.54 2.73 2.39 -M achine-tool operators,
tnnlronrri_____________ ___________ - 2.90 3.20 - 3.05 3.29 - - - - - 3.17 3.09 3.05 - - - 3.34 - -Machinists ____________________ ___ 3.14 2.82 3.34 - 3.01 3.31 - 2.89 - - 3.02 3.34 3.38 3.22 3.05 3.20 3.24 3.46 3.08 3.29M echanics, automotive — . 2 .8 6 2.53 3.05 $2.52 3.10 3.00 2.89 2.72 3.13 $2.99 3.06 3.26 3.11 3.10 2.92 3.12 3.06 3.48 3.03 3.09M echanics _ _ 2 .9 2 2.75 2.95 - 3.24 3.14 3.05 2.72 3.07 - 2.99 3.13 3.15 3.12 3.06 3.01 3.11 3.36 3.01 3.28M illw rights________________________ 3.68 2.73 3.25 - 3.21 3.07 - - - - - 3.31 - 3.23 - - - 3.45 3.00 -O ilers 2.72 2.38 2.74 - 2.80 2.62 - - 2.48 - 2.48 2.60 2.39 2.53 - 2.73 2.48 2.82 2.44 2.63Painters __ ___ 2.80 2.54 3.07 - 3.20 3.00 - 2.71 - - 2 .8 6 3.07 - 3.28 2.99 2 .8 6 2.92 3.51 3.00 3.26Pipefitters 3.09 2.94 3.23 - 3.31 3.32 3.06 2.92 - - 3.13 3.35 - 3.28 3.06 3.09 - 3.39 - -Plumbe r s .-n.......... ___ - - - - - - - - - - - 3.21 - - - - 3.02 - - -Sheet-m etal w orkers______________ 3.12 - 3.31 - 3.28 3.25 - - - - - 3.13 - 3.31 - - - 3.32 - -T ool and die makers _ . . . 3.02 3.13 3.48 - 3.47 3.40 3.34 3.01 - 3.23 3.36 3.30 3.29 3.26 3.33 3.32 3.74 3.16 -
Custodial and m aterial movement
Elevator operators, passenger(men) . . - - 1.26 - - - - - - - - 1.69 - - - - - 2.14 - -
E levator operators, passenger(women) .93 - 1.33 - 1 .1 0 - .98 - - 1.33 1 .6 6 - 1.43 1.06 - 1.50 2.17 1.64 -
Guards and watchmen_____________ 1 .8 6 1 .8 8 1.99 - 2.50 2 .2 0 2.42 2.25 2 .8 8 1.64 2 .2 2 2.39 2.08 2 .1 6 2.03 2.43 2.53 2 .1 6 2.40 2.50Janitors, p orters, and cleaners
(men) „ ,_________________ 1.85 1.96 1.87 1.72 2.27 2.16 2 .1 2 1.77 1.56 1.73 1.80 2.03 1.64 2 .0 0 1.67 2 .0 0 1.97 2.29 2.09 2 .0 1Janitors, p orters, and cleaners
(worn e n)______ _ 1.46 1.60 1.39 - 1.49 1.80 2.04 1.47 1.57 - 1.65 1.80 1.41 1.78 1.26 - 1.59 2.23 1 .8 6 1.48L a borers, m aterial handling-------- 2.31 2.07 2.35 2.17 2.56 2.44 2.47 2.16 2.27 2.45 2.42 2.58 2 .2 2 2.55 2 .1 6 2.06 2.55 2.80 2.59 2.54O rder f i l le r s _____________ ___ _____ 2 .0 1 2.03 2.55 1 .9 0 2.55 2.47 - 2 .1 1 1.97 - 2.25 2.54 2.43 2.63 2 .0 2 1.99 2.49 2.80 2.59 2.60P a ck ers, shipping (men)---------------- 2 .2 2 2.03 2.29 - 2.58 2.42 - 2 .2 2 1.62 - 2.15 2.34 2.19 2.53 1.73 2.47 2.62 2.63 2.42 2.47P a ck ers, shipping (women) _ 1.91 2.08 1.99 - - 1.75 - - - - - 2.06 - - - - - 1.99 2 .2 2 -Receiving clerks __ ------ 2 .2 1 2.17 2.54 - 2.54 2.48 - 2.14 2.26 2 .2 0 2.13 2.58 2.09 2.59 2 .1 6 2.30 2.30 2 .8 6 2.45 2 .6 8Shipping clerks _ _ ---- 2.42 2.24 2.42 - 2.55 2.49 2 .6 1 2.13 - - 2.38 2.65 - 2.78 2 .2 0 - 2 .6 8 2.98 2.75 2.75Shipping and receiving c le r k s ------- 2.27 2.32 2.57 - - 2.55 - 2.24 - - 2.49 2.55 - 2.75 2.17 - 2.50 2.95 2.67 2.83T ruckdrivers 4 _____________________ 2.38 2.44 2.87 2.18 2.81 2.81 2.62 2.40 2.24 2.63 2.56 2.90 2.39 2.90 2.48 2.60 2.84 3.21 2.94 2.83
Light (under 1 l/z tons). 1.93 2 .0 0 2.34 - 2.50 2.48 - 1.71 1.99 1.97 2.18 2 .6 6 1 .8 6 2 .6 6 2.14 1.95 2.41 3.09 2.63 -Medium (lV z to and
including 4 tons) 2.38 2.36 2.89 2.35 2 .6 6 2.77 2.80 2.33 2.34 2.69 2.59 2 .8 6 2.42 2.85 2.53 2.28 2.57 3.19 2.80 2.77Heavy (over 4 tons,
tra iler type) _ 2.55 2 .6 8 2 .9 0 - 2.82 3.02 - 2 .6 1 2.36 2.98 2.74 2.99 2.55 2.98 2.59 2.87 2.92 3.31 3.06 2.96Heavy (over 4 tons, other
than tra iler type)-,------------------ 2.46 - 2 .8 8 - - - - - 2.15 - 2.41 2.90 - 3.05 2.47 2.70 3.19 3.26 3.01 3.15T ru ckers, power (fork lift)___ 2.29 2.33 2.58 - 2.67 2.50 2.54 2.33 2.41 2.25 2.42 2.75 2.27 2.60 2.24 2.50 2.58 2.82 2.62 2.76T ru ckers, pow er (other
than fork lift)______________________ 2.48 “ 2.43 " " 2.49 " " “ 2.42 2.74 " 2.54 “ " " 2.87 2.43 2.35
1 Excludes premium pay for overtim e and for w ork on weekends, holidays, and late shifts.2 Data lim ited to men w orkers except where otherwise indicated.3 Exceptions to the standard industry limitations are shown in footnotes 4, 5, 7, and /or 11 to the table in appendix A.4 Includes a ll drivers regardless o f type and size of truck operated.
NOTE: Dashes indicate no data reported or data do not meet publication criteria.
Digitized for FRASER http://fraser.stlouisfed.org/ Federal Reserve Bank of St. Louis

Table A-10. Plant Occupations—Manufacturing
(Average hourly earnings 1 for selected occupations studied, July 1962 through June 1963)
37
Northeast
O ccupation2 Albany—Schenec
tady—Troy
Allentown—Bethlehem—
EastonBoston Buffalo B u rl
ington
Lawrence—H aver
hill
Manchester
Newarkand
JerseyCity
NewHaven
NewYork
Patersonr-Cliftonr-Passa ic
Philadelphia
P ittsburgh
P ortland
P rov idence—Pawtucket
Scranton Trenton W ater-
buryW orces
ter York
Maintenance and pow er plant
$2. 94 3 .04
$2. 85 2. 87
$2. 77 2.96
$3.01 $2. 30 $2.61 $2. 17 $3.01 $2. 56 $3.09 $2.98 $2.98 $3. 14 _ $2. 33 $2. 33 $2.81 $2 . 66 $2.56 $2.60E lectricians --------- —— — -----------— . 3. 19 2.67 2 .8 8 2 .24 3. 16 2 . 80 3.24 3. 11 3.05 3.22 $2. 58 2.51 2.80 2.96 2 . 8 8 3.00 2 .6 8Engineers, station ary-------------------- 2 . 8 8 3.01 2 .9 0 2.91 - - - 3.44 2 . 66 3.50 3.02 2.71 3. 11 - 2. 38 - 2.81 2 . 86 2 . 90 -
2. 53 2.42 2. 38 2 . 60 2.05 2.43 1.61 2.91 2 . 26 2.94 2. 50 2.50 2 . 82 1.97 2.05 1.62 2.43 2.03 2.32 2 .2 12 . 39 2.31 2. 54 2. 13 1.75 2. 31 2.46 2. 32 2.53 2.76 2 . 16 1.87 2. 31 2. 33 2 . 11 2 . 16
M achine-tool operators,2. 36 2.60fnnl r o o m ________________________________ _ . 2. 84 3.23 - 2.74 - 3. 17 2.60 2.93 - 2.93 3. 28 2.52 - - - 2.73
3. 02 2. 95 2.91 3.22 2. 52 2 .6 8 2 .2 1 3. 17 2.63 3.28 3. 00 3.07 3.44 2.71 2. 64 2.62 2.98 2.90 2.79 2.722. 70 3.07 2 . 81 2.91 3. 27 _ 3. 17 2. 96 2.93 3. 30 2 . 20 2. 58 _ 2.85 2 . 80 2. 532. 78 2 . 86 2 .6 8 3. 10 2 . 86 2. 76 2.31 3. 17 2 . 86 3. 13 2 . 86 ‘ 2.91 3. 11 2.47 2.49 2.69 2.71 2.76 2 . 80 2 . 60
M illw rights ----------------------------------------------- 3.01 3.07 2 . 82 3. 18 2.71 3. 12 2 . 6 5 3. 12 3. 17 3.05 3. 32 - 2 .56 - 3. 15 2.82 2.70 2.78___ .... ____________ 2. 36 2.53 2.26 2.75 _ 2. 15 - 2.63 2 . 20 2.58 2. 45 2.34 2 .6 8 - 1.87 - 2. 36 2. 42 2.41 2. 15
_ _______________ 2. 83 2. 84 2.78 2.95 _ _ _ 2.90 2.47 2.95 2.91 2.92 2.93 2. 38 - 2 . 88 2. 54 2.83 2. 24P ip e fitte rs ------------------------------------------------ 3. 10 2 . 81 2.94 3.09 - 2 .74 - 3. 15 2 . 81 3.05 3.08 3. 07 3.09 - 2.50 - 2.96 - 2.95 2.63Plum bers --------------------------------------------------- _ _ 2 . 89 _ _ _ - - - 2.94 2. 93 2.85 - - - - - 2 .75 - -Sheet-m etal w ork ers ---------------------------- 3.03 _ 2.91 3.19 _ - - 3. 18 - 3. 10 3.06 2. 97 3. 17 - 2.82 - - 2 . 90 2.92 -T’nnl nH rnaV*?rS _ 2.96 3.15 3.37 _ 3.08 _ 3.21 2 . 88 3.25 3. 34 3.25 3. 36 2.82 3. 12 2 . 99 3.38 2 . 98 2. 76 2.84
Custodial and m aterial movement
Elevator operators,pa ... ... ............. 2.26 2.06 1 .9 2 _
Guards and watchmen--------------------- 2. 15 2.28 2. 13 2.46 _ 2. 15 1.46 2 .2 1 2. 04 2. 24 2. 30 2 . 18 2 . 59 1 . 80 1.67 1.56 2.23 2. 17 2.07 1.84G uards---------------------------------------- 2. 33 2. 53 2 .2 0 2.62 _ . _ 2.36 2 . 20 2.42 2. 56 2. 38 2.63 - 1.96 1.78 2.43 2. 23 2 . 18 -W atchmen----------------------------------- 1.90 1.76 2.03 2.08 - 1. 84 1.48 2.05 1.85 1.95 1.98 1.84 2.25 - 1.64 1.47 1.70 2 . 11 1.89 -
Janitors, porters , and cleaners
Janitors, p orters, and cleaners1 .9 8 . 2. 05 1.95 2.32 1.83 1.70 1. 44 2 . 16 1.92 2 .04 2.09 2.05 2.28 1.87 1.63 1.70
1.37
2 . 06 2.05 1.99
1.73
1.82
1.621.57 2.04(wom 6 &) m_ _jt M|L_* „,.,x 1.71 _ 1.77 2 .0 2 _ - - 1.93 - 1.89 - 1.78 2.05 - -L aborers, m aterial handling---- — 1.97 2.31 2 .0 0 2.44 1.82 2. 05 1.57 2. 56 2 .0 2 2. 38 2.09 2 . 19 2.49 1. 83 1.72 1.79 2.05 2 .24 1 .8 8 1. 88O rder f i l l e r s ----------------------------------- 2.31 1. 80 2 . 19 2.46 _ - 1.49 2. 58 2 . 29 2.07 2 . 19 2.26 2.41 1.95 1.85 - 2.27 3. 04 2 .1 0 2 .2 1Packers, shipping (men) 2 . 10 1.65 2 . 10 2.39 _ 2 . 19 1.67 2. 36 2.09 1.98 2 .2 0 2. 17 2 . 18 _ 1.81 1.69 2 .2 0 2. 42 2. 30 2 .0 0Packers, shipping (w om en)-------------- 1.61 2.33 - 1.49 1.51 1.87 - - 1.74 1.78 - - 1.58 - - 1.90 - 1.73Receiving c le r k s ------------------------------------ 2.31 2. 13 2. 17 2.57 2.41 2 . 10 1 .6 8 2.41 2.27 2.48 2.62 2.41 2.61 - 1.91 1.94 2.37 2 . 22 2.25 2. 31Shipping c le r k s --------------------------------------- 2 .44 2.43 2.27 2.75 2 .2 1 2 . 19 1.98 2.58 2 . 10 2.53 2.53 2.43 2.76 2 .2 1 1.93 1.87 2 .2 2 2 . 18 2 . 37 2.40Shipping and receiv ing c le r k s --------- - 2. 23 2. 27 2.50 - 2 . 10 2. 05 2. 45 2. 33 2.49 2.42 2.39 - - 1.96 1.77 2. 37 2 .44 1.99 1.99Truckdrivers 3 ---------------------------------------- 2. 50 2.46 2.53 2 .6 8 2 . 11 2. 34 1. 85 3.40 2.28 3.25 2.56 2.75 3.00 1.85 2 .0 1 2 .2 1 2 . 39 2. 35 2.29 2 . 06
Light (under l l/z tons)---------------Medium (1 Vz to and
- 2.27 2.37 2.61 - - 2 . 39 ” 2 .2 2 “ 2. 47 2.79 1. 89 1.64 “ ” 2 . 12 1.96
1.95
1.63
including '4 tons)— —----------------Heavy (over 4 tons,
2 .64 2. 14 2.60 2.47 “ ■ 1.75 3. 50 3.25 2 . 59 2. 83 3. 15 “ 2.07
2.23“ 2.07 2.07
_ 2. 51 2.61 _ _ „ 3. 37 2.40 2.94 2. 57 2.76 2.83 - - 2. 42 2.51 - -Heavy (over 4 tons, other
2.56 2.82 2.73than tra iler type)--------------------- _ 2.52 2.38 2.84 _ - - 2. 70 - 3.64 - - - - - - -Truckers, pow er ( fo rk lift )------------T ruckers, pow er (other
2. 38 2.47 2.38 2. 57 2. 07 2.09 2.62 2. 15 2 .6 8
2.63
2.42 2.33
2 . 28
2.60
2.93
2 . 10 2.06
1.98
2 . 12 2. 38 2.63
2 . 29
2.43
2.60
2 . 16
than fork lift)---------------------------------- - - 2.36 2.71 “ " “ 2. 32 2.28 2 .85' “
2.44’
See footnotes at end of table.
Digitized for FRASER http://fraser.stlouisfed.org/ Federal Reserve Bank of St. Louis

38
Table A-10. Plant Occupations—Manufacturing— Continued
(Average hourly earnings1 for selected occupations studied, July 1962 through June 1963)
South
O ccupation2Atlanta Balti
m ore
Beaumont—Port
Arthur
Birm ingham
Charleston,
W. Va.Charlotte
Chattanooga Dallas Fort
WorthGreenville Houston Jackson Jack
sonvilleLittle R ock -
North Little Rock
L ou isville
Lubbock Memphis Miami New
Orleans
N orfo lk - Portsmouth and Newport
New 8—Hampton
OklahomaCity
Maintenance and powerplant
C arpenters._______________ ________ $2.53 $2.84 $3.42 $3.07 $3.34 $2.19 $2.26 $2.57 $2.85 $1.81 $3.30 _ _ _ $3.21 $2.26 . $2.90 _ .E lectricians . _________ 3.11 2.94 3.43 3.48 3.36 2.56 2.70 2 .8 6 3.15 1.99 3.30 $2 .6 6 $2.81 $2.34 3.36 - 2.99 $2.38 3.13 $3.05 $2.71Engineers, stationary.___ 3.08 2.85 3.42 3.36 3.26 - 2.87 2.71 3.08 1 .9 8 2.84 - - 2.18 3.18 - 2.75 2.46 2.73 _ 2.45Firem en, stationary b o i le r _______ 1.92 2.54 3.22 2.91 - 1.62 1 .6 6 2.18 - 1.39 - - - - 2.73 - 1.55 - 2.38 1185 -H elpers, trades _____ 2 .2 0 2.44 2.90 2 .6 8 - 1.56 2 .1 2 1.83 2.18 1.47 2.49 - 2 .1 1 1.56 2.45 - 1.73 1.85 2 .2 1 - -M achine-tool operators,
to o lr o o m _________________________ - 2.92 - - - - - - - - 2.98 - - - 3.24 - - - _ _ _M achinists____ . . . . .— ___ . 2 .8 8 3.21 3.46 3.50 3.38 2.46 2.69 2.63 3.03 1.96 3.25 2.63 2.78 2.62 3.29 _ 2 .8 8 _ 3.12 3.08 _M echanics, automotive™--------------- 2.46 2.83 3.15 2.70 3.01 1.97 2.07 2.31 2.31 - 2.82 - 2.23 2.05 2.84 - 2.37 2.14 2.53 2.33 2.37M ech an ics_________________________ 2.54 3.05 3.31 3.24 3.43 2.18 2 .6 1 2.56 2.55 2.18 3.02 2.42 2.41 2.37 3.20 _ 2.70 2.26 2.89 2.78 2.49M illw rights___ __ _____ ____ ._ - 3.03 - 3.22 3.35 - - - 2.73 - 3.39 - - - 3.05 - 2.90 - 3.30 _ _O ile r s ______ _ _______ ____ ___ 2 .1 0 2.71 2.85 2.64 - 1.48 2.24 2.27 2.39 1.39 2.52 - 2.13 - 2.64 . 2.32 - 2.48 _ _Pa inters__ _. ______ 2.96 2.83 3.42 2.97 3.28 - 2.48 2 .6 6 2 .8 8 1.63 3.37 - - - 3.20 - 2.57 _ 2 .9 2 _ _Pipefitters ________ ___________ _____ 3.13 2.90 3.48 - 3.38 - 2.92 - - - 3.43 - 3.11 - 3.35 - 3.02 - 3.09 _ _Plumbers ____ _________ __ - - - - - - - - - - - - - - - - - - _ - -Sheet-metal w ork ers______________ - 3.00 3.46 - 3.38 - - - - - 3.49 - - - 3.27 - - _ _ _ _Tool and die m a k ers .------------- ------- 3.29 3.21 - 3.02 - - 3.00 3.17 - 3.20 - - 2.90 3.56 - 3.13 2.62 3.42 - -
Custodial and m aterial movement
Elevator operators,p a ssen ger___________ ____________ - - - - - - - - - - - - - - 1.09 - - - - - -
Guards and w atchm en_____________ 2.19 2 .2 1 2.84 2.18 2.85 1.65 1.85 1.83 2.27 1.33 2.24 1.51 1.50 1.41 2.34 _ 1.80 1.34 1 .8 8 2 .0 6 1.75Guards ----------- . . -- ------ 2.65 2.41 2.93 2.53 2.93 - 2.03 2.16 2.59 1.45 2.69 - - - 2.65 _ 2.49 1.37 2.27 _ _W atchmen__________________ _— 1.55 1.65 1.91 1.72 - 1.29 1.50 1 .61 1.35 1.32 1.51 1.29 1.40 1.39 1.83 _ 1 .2 2 1.30 1.51 1.35 1.34
Janitors, porters, and cleaners(men) _________ ________ „_________ 1.85 1.99 2.32 2 .0 0 2.27 1.36 1.59 1.64 1.85 1.27 2.03 1.46 1 .61 1.45 2.13 $1.30 1.58 1.49 1.78 1.99 1.48
Janitors, porters, and cleaners(women) ,, 1.39 1.73 - 1.64 - 1.25 1.26 - - 1.17 1 .6 6 - - 1 .2 0 1 .9 6 - 1.41 1.25 1.37 _ _
L aborers, m aterial handling-------- 1 .6 1 2.30 2.18 1.96 2.63 1.30 1.79 1.72 1 .9 6 1.29 1.67 1.37 1.53 1.43 2 .2 2 1.38 1.61 1.55 1.75 1.93 1.83Order f ille rs . . . ____ 1.91 1.85 - 2.34 - 1.52 2 .0 1 1.98 1.72 1.40 1.95 - - 1.59 2.51 - 1.83 _ 1.55 _ 1.74Packers, shipping (men) 1.80 1.63 - - - 1.40 1.38 1.62 1.93 1.43 - - - 1.44 2.33 - 2.05 1.52 1.42 1.69 _Packers, shipping (women) . . . 1.57 - - - - 1 .2 2 - 1.35 - 1.24 - - - - 1.80 - 1.40 _ _ _ _Receiving c le r k s --- --------- -------------- 2.18 2.40 2.73 2.48 3.01 1.74 1.94 2.24 2.09 1.54 2.56 - - - 2.56 - 1.93 _ 2.27 2.94 _Shipping clerks ---- -------------- ----------- 2.37 2 .6 1 - 2.96 - 2.03 2.27 2.29 2.24 1.93 2.48 - - - 2.56 _ 2 .2 2 2.39 2.24 _ _Shipping and receiving clerks ™ _ . 2.53 2.55 3.03 3.09 - 1.93 - 2.04 - 1.76 2.35 - - 1 .8 6 2.39 - 2 .1 0 2.29 2.25 _ _Truckdrivers 3 ____________________ 1.74 2.46 2.77 2.29 2.78 1.43 1 .8 8 1 .8 8 1.95 1.43 1.87 1.48 1.64 1.81 2.58 1.65 1.63 1.79 2 .0 1 1.95 2.32
Light (under IV2 tons)--------------- 1.47 2.63 2 .8 6 - - 1.37 1.54 1.54 1.42 - 1.90 - - 1.80 2.19 - 1.45 1.84 1 .6 1 _Medium (IV 2 to and
including 4 tons).™___—__. . . . . . 1.77 2.18 2.78 2.05 2.71 1.38 1.81 1.95 1.72 1.38 1.89 1.34 1.54 1.41 2.77 1.82 1.62 1.54 2 .0 0 2 .0 2 1.92Heavy (over 4 tons,
tra ile r ’ type)____ ______ _______ - 2.43 - - - - - 2.18 2.18 - 1.69 - 1.69 - 2.77 - 1.64 1.72 2.29 - _Heavy (over 4 tons, other
than tra iler type) . . - 2 .6 0 - - - - - - - - - - - - - - - 2 .1 0 - _ _Truckers, power (forklift) _ . . . 2.19 2.58 2.89 2.34 2.71 1.67 1 .8 6 1.92 2.13 1.39 2.35 1.46 1.78 1.53 2.45 1.49 1.95 1.63 2.32 1.97 2.15T ruckers, power (other
than fork lift)_____________________ " 2.47 “ 2.42 “ ■ 1.70 2.31 “ - - “ “ 2.48 ” 2.53 “ 2 .2 0 1.87 -
See footnotes at end of table,
Digitized for FRASER http://fraser.stlouisfed.org/ Federal Reserve Bank of St. Louis

(Average hourly earnings 1 fo r selected occupations studied* July 1962 through June 1963)
Table A-10. Plant Occupations—Manufacturing---- Continued
39
O ccupation2
South——Continued North Central
Raleigh Richmond
SanAntonio
Savannah
Washington Akron Canton Chicago Cincin
natiC leve
land ColumbusD avenport-
Rock Island— Moline
Dayton DesMoines D etroit Green
BayIndianapolis
KansasCity Milwaukee
Minneapolis— St. Paul
Muskegon—Muskegon
Heights
Maintenance and powerplant
Carpenter s —— ——— — _____ ______ $2.85 - $2.92 _ $3.21 $3.00 $3.04 $2 . 86 $3.05 $2.91 $3. 10 $3. 19 _ $3.30 _ $3. 13 $3.03 $3.08 $3.01 $2.85E lectr ic ia n s______ -____ — — — . - 3.04 - 3.07 - 3.24 3. 13 3. 31 3.09 3 .24 3.09 3. 39 3.26 $3.24 3.46 $2.65 3.23 3.26 3. 32 3.27 2.93Engineers, station ary—___-_______ - 2.67 - - $3.01 3.27 2.93 3.25 3. 30 3.29 3.07 3. 22 3. 12 3. 15 3.48 2.49 3. 12 3. 16 3. 13 3.05Firem en, stationary b o i le r _______ $1.36 2. 07 - 2 .24 - 3.01 2.80 2.61 2 .74 2.80 2. 56 2.48 2.64 2.85 3.21 2.29 2. 33 2.40 2.74 2.79 2.60H elpers, tra d e s ------------------------------ - 2 .28 $2 .2 0 2.33 - 2 .6 6 - 2.48 2. 31 2.60 2. 25 2.60 2.40 2.72 2.71 2 .2 1 2. 36 2.65 2.41 2.59M achine-tool operators, '
too lroom _____ _ . - _____ — ____ - _ - - - - 3.25 3.22 3. 13 3. 17 3.20 3.23 3.28 _ 3.48 3.23 3.07 3.40 2.78 3. 16M achinists ------ — - ------- ------ - 3.03 - 3.19 - 3. 13 3.23 3. 33 3. 12 3. 13 3.20 3.40 3. 31 3.25 3.46 2.79 3.20 3.29 3.41 3.27 2.94M echanics, automotive — — ----- - 2. 32 2.28 2.59 2.71 3. 16 2.90 3.23 2.87 3.05 2.80 3. 15 2.93 2.90 3.27 2.65 2.95 3.07 2.99 2.80M echanics- ____ ________ — ____ 2 .2 0 2 .8 6 2.59 2.72 3. 18 3.26 2.94 3.07 2.91 3. 13 2.73 3.25 3.01 3.01 3.40 2 .58 3.23 3 .0 0 3. 10 2.90 2.90M illw rights— — ____ — — — - - - - - 3.24 3.09 3. 26 3. 15 3.21 2.93 3. 24 3. 25 _ 3. 38 2.81 3.26 3.25 3. 18 3. 11 2. 87O ilers ---- — - — _________ — _ - 2 .0 2 - 2.39 - 3.02 2.53 2. 54 2.70 2 .6 8 2.46 2 .6 6 2.60 2.70 2.77 2.42 2.58 2.63 2.80 2.72 2 . 59Painters — —_________ _____________ - 2.89 - 2.78 - 3.08 2 .94 3. 11 3.02 3.07 2.98 2.89 3.06 _ 3.28 2.48 3.07 3.05 3. 16 3.04Pipefitters — — — — — — — - - 3. 15 - 3.09 - 3.24 3. 10 3.29 3. 21 3. 13 3.07 3. 30 3.31 _ 3. 37 2.74 3.20 3.23 3.27 3.25 2.90Plum bers ------- ------------ ------- - - - - - - - 3. 33 - - _ _ 3.04 . _ _ _ _ _ _Sheet-m etal w ork ers______________ - 3. 14 _ - - 3.30 _ 3.26 3. 27 3.21 3.20 3.28 3 .34 _ 3. 39 . 3.29 3. 19 3. 31 _ _Tool and die m a k e rs ---------------------- - - - - - 3.41 3. 16 3. 50 3. 31 3.44 3.43 3.58 3. 57 3.24 3.60 - 3. 37 3.20 3.65 3.36 3. 19Custodial and m aterial movem ent
Elevator operators,passenger — — — — — — — - - - - - - - - - - - - - - - - - - - _ _
Guards and watchmen— — ------------- 1.44 2.04 1.82 1.87 - 2 .6 6 2.62 2 . 18 2 .35 2.49 2. 30 2.42 2t. 53 2.50 2 . 80 2 .0 1 2.51 2.51 2. 42 2.39 2.45G uards__________________________ - _ _ 2 . 11 - 2.79 2.65 2.35 2.55 2.62 2.49 2.63 2.64 _ 2.85 _ 2.59 2.67 2 .54 2.43 2. 50W atchmen___________________1----- - 1.76 1. 37 1 .6 6 - 2 . 20 2 .2 0 1.94 1.75 2.09 1.73 1.75 1 . 80 _ 2. 14 1.93 1 .8 8 2 . 11 2.23 2. 13
Janitors, p orters, and cleaners(men) — — — . 1 .34 1.73 1.39 1.58 1.67 2.57 2 . 29 2.09 2 . 11 2 . 28 1.95 2.29 2.24 2 . 19 2.51 2 . 10 2.06 2. 17 2.28 2 . 16 2. 36
Janitors, porters , and cleaners(wr>m,»r>)----------------------------------------- - 1.38 _ - - 2.30 2.04 1.93 1.81 1.98 1.72 2 . 18 2.24 _ 2 . 16 1.77 2. 17 1.71 2.09 1 .9 0 2 . 0 a
L aborers, m aterial handling_____ 1.33 1.71 1.45 1 .6 8 2.04 2. 57 2.39 2.26 2 .34 2 .44 2 . 18 2.41 2,41 2. 38 2.61 2 .2 0 2.23 2 .24 2. 43 2. 33 2.38O rder f i l l e r s _______________________ . 2 . 10 1.51 1.92 - 2.91 2.46 2.27 2. 13 2. 50 2.27 2.27 2.48 2. 34 2.65 2 . 12 2 . 19 2.43 2. 44 2.33 2.45Pack ers, shipping (m en)---------------- 1.37 1.76 1.36 - - 2 .84 2 . 49 2 . 20 1.89 2.47 2.07 2.62 2.39 _ 2.58 _ 2 . 19 1.99 2.51 2. 27 2.55P ack ers, shipping (w om en)----------- - . - - - - - 1 .9 0 2 .05 2 .0 0 1.72 - 1.90 _ 2.55 _ 1.70 1.74 2.08 2 .0 1 _Receiving c lerk s —-------------------------- - 2. 36 1.74 - - 2 .85 2 .6 6 2.47 2.25 2.45 2. 15 2. 30 2.45 2.40 2.79 _ 2.45 2.51 2. 55 2.50 2.55Shipping c le r k s ------------------------------- - 2 . 18 - - - _ 2.59 2. 57 2 . 26 2.51 2. 27 2 .6 6 2. 53 2.49 2 . 82 _ 2.60 2 . 39 2.73 2.59 2.71Shipping and receiv ing c lerk s — — . 2. 13 2.04 - - 2.79 2 . 29 2.58 2. 35 2.58 2 . 29 - 2.40 2.47 2.72 2.46 2.70 2. 58 2.52 _T ru ck d rivers3 — — — ------- ------ 1. 34 1.71 1.63 1.83 2.35 2.85 2.63 2.99 2.61 2.81 2. 32 2.37 2 .58 2. 38 2.93 - 2. 30 2 .74 2.75 2.80 2.58
Light (under IV2 tons)--------------- - _ 1.39 - 2.06 . _ _ 2.33 2.67 2 .44 1.64 2.41 _ 2.60 _ 2 . 11 2 , 10 2. 56 2.84 _Medium (1 V2 to and
including 4 tons)---------------------- . 1.62 1.67 1.97 2 .2 0 2.74 . 2 .8 6 2. 53 2.67 . - 2.51 _ 3.07 2.26 2.76 2. 53 2.85 _Heavy (over 4 tons,
tra iler typ e )----------------------------- - 1 .8 6 1.58 - - - 2,70 3. 12 2.79 2.91 - 2.70 - - 2.89 - - 2 .6 6 2.94 2.82 _
Heavy (over 4 tons, other \than tra iler type)--------------------- - . . - . - - 3.04 _ _ _ _ 2.45 _ _ _ _ _ 2.58 _
T ruckers, pow er ( fo rk lift ) ------------ 1.55 1.84 1.54 2. 15 1.73 2.98 2.48 2. 52 2 .6 8 2 . 60 2.35 2.67 2.57 2.46 2.69 2.32 2.48 2.61 2. 67 2.45 2.48Truckers, pow er (other 1
than fork lift)---------------------------------- " “ “ 1.97 “ " 2 .52 2.45 2.29 2.99 2 . 16 2.65 2 .44 “ 2 . 86 " 2 .74 2.71 2.58 2.54 2.45
See footnotes at end of table.
Digitized for FRASER http://fraser.stlouisfed.org/ Federal Reserve Bank of St. Louis

40
Table A-10. Plant Occupations—Manufacturing— Continued
(Average hourly earnings 1 for selected occupations studied, July 1962 through June 1963)
Occupation2 3
North Central— Continued West
Omaha Rockford St. Louis SiouxFalls
SouthBend Toledo W aterloo Wichita Albu
querque Boise DenverLos
A ngeles-LongBeach
Phoenix PortlandSaltLakeCity
SanBernardino—
R iverside—Ontario
SanDiego
SanF ran cis c o -
OaklandSeattle Spokane
Maintenance and powerplant
Carpenters $3.15 $2.55 $3.16 - $3.19 $3.26 - $2.73 - _ $3.08 $3.16 - $3.14 $3.00 $3.03 $3.03 $3.36 $2.89 $3.07Electricians — ------- ------ — 3.12 2.94 3 .'24 - 3.25 3.25 $3.22 2.93 - - 3.14 3.37 $3.35 3.28 3.06 3.20 3.29 3.49 - 3.35Engineers, stationary 2.81 2 .6 2 3.30 - 3.24 3.35 - 2.69 - - 3.15 3.57 3.07 3.13 - - 3.22 3.57 3.06 3.13Firem en, stationary boiler 2.49 2.27 2.95 - 2.94 2.72 - - - - 2.69 - - 2 .6 1 - 2.69 - 2.89 2.63 -H elpers, trades 2 .1 1 2.38 2.75 - - 2.84 - - - - 2.31 2 .6 8 2.04 2.48 2.59 - 2.49 2.79 2.39 -M achine-tool operators,
toolroom --- -------r------ - 2 .9 0 3.20 - 3.05 3.31 - - - - - 3.17 3.09 3.05 - - - 3.34 - -M achinists______ ____ _____ _____ 3.16 2.82 3.31 - 3.01 3.31 - 2.87 _ - 3.01 3.33 - 3.26 3.06 3.21 3.25 3.46 3.08 3.29M echanics, automotive____________ 2.70 2.53 3.10 - 3.13 2.98 3.00 2.60 $2.73 - 3.07 3.25 3.24 3.03 2.78 3.13 3.11 3.49 2.89 3.14M echanics. 2.98 2.72 2.94 - 3.24 3.13 3.04 2.70 3.07 _ 2.99 3.14 3.17 3.12 3.08 3.02 3.09 3.37 3.02 3.26Millwrights i rl 3.08 2.74 3.25 - 3.21 3.08 - . - - - 3.31 - 3.23 - - - 3.46 3.00 -O ilers 2.76 2.28 2.78 - 2.80 2.62 _ . _ _ 2.48 2.60 2.39 2.53 _ 2 .6 6 2.48 2.80 2.44 2.63P a inters. ____ 2.93 2.55 3.14 - 3.20 3.11 - 2 .6 8 _ - 3.13 3.10 - 3.22 _ 2.90 2 .8 6 3.34 2.98 _Pipefitters 3.18 2.94 3.20 - 3.31 3.31 - 2 .9 2 - - 3.13 3.38 - 3.28 - 3.09 - 3.39 - -Plum bers - - - - - - - - - - - 3.17 - - - - 3.01 - - -Sheet-metal w orkers_____ __________ 3.12 - 3.33 - 3.28 3.27 - - - - - 3.22 - 3.27 - - - - _ -Tool and die makers 3.02 3.13 3.48 - 3.47 3.40 3.34 3.01 - - 3.23 3.35 3.30 3.29 3.26 3.33 3.32 3.74 3.16 -
Custodial and m aterial movement
Elevator operators,passen ger------------------------------------- - - - - - - - - - - - - - - - - - - • -
Guards and watchmen.... ....... ..... ....... 2.08 1 .8 8 2.35 - 2.57 2.51 2.43 2.39 - $1.64 2.42 2.52 2.40 2 .2 0 2.09 2.45 2.59 2.52 2.43 2.64Guards 2.45 _ 2.50 - 2.65 2.52 - 2.44 - _ 2.54 2.56 2.55 _ _ 2.52 2.60 2.57 2.49 _Watrhmen ---- 1 .6 8 1.87 2.13 - 2.14 2.46 2.19 - 1.64 2.03 2.30 1.87 2.13 2 .1 0 - _ 2.48 2.18 _
Janitors, porters, and cleaners(men) _ 2.03 2 .0 2 2.17 $1.99 2.45 2.26 2.28 2 .0 0 1.83 1.75 2.17 2.25 1 .9 2 2.14 1.92 2 .1 2 2.18 2.49 2 .2 0 2.43
Janitors, porters, and cleaners1.69 1.69 1.78 - 2 .1 1 2 .0 2 2.07 1.82 - - - 2 .1 1 - 1.84 - - . 2.29 _ _
L aborers, m aterial handling ----- 2.19 1.97 2.25 2.13 2.53 2.41 2.48 2 .2 0 2 .0 2 1.97 2.39 2.39 2.07 2.32 2.07 2.14 2.69 2.65 2.43 2.51Order fille r s ......... .................... ......... 2.07 2 .0 2 2.52 2.04 2.74 2.55 - - 2 .2 0 - 2.34 2.39 - 2.56 _ _ _ 2.79 2.69 _Packers, shipping (men) 2.30 2.03 2.28 - 2.58 2.46 - 2.43 - - 2.25 2.34 2.25 2.19 - 2.50 _ 2.59 2.27 .Packers, shipping (w o m e n ). 2.18 2.08 1.99 - - - - - - - - 2.25 - - - - - - _ -
- 2.19 2.51 - 2 .6 1 2.56 - - - - 2.36 2.56 2.18 2.63 - - - 2 .8 6 2.33 _2.50 2.27 2.39 - 2.60 2.52 2 .6 2 - - - 2.45 2.59 - 2.82 - - 2 .6 6 2.96 2.72 2 .6 8
Shipping and receiving rlsrlcs — 2.31 2.38 2.56 - - 2.53 - - - - 2.46 2.46 - 2 .8 6 2.31 - 2.58 2 .8 8 2.80 _2.42 2.38 3.08 2.25 2.63 2.71 2.65 2.45 2.13 2 .2 1 2.49 2.89 2.13 3.01 2.34 2.78 3.01 3.21 3.02 2.93
Light (under l x/z t o n s ) - . .-___ — 2 .0 1 2.15 - - - 2.41 - - - - 2.28 2.53 1 .9 0 - 2.27 - - 3.17 -Medium ( 1V2 to and
2.53 2.32 3.16 - 2.57 2.85 - 2.26 2.08 - 2.53 2 .9 2 - 3.02 2.25 2.31 2.52 3.23 3.00 2.67Heavy (over 4 tons,
2.49 2.65 - - - 2.69 - - 2.09 - 2.77 3.06 - 3.01 - 2.89 3.00 3.29 3.12 _Heavy (over 4 tons, other
than tra iler type) 2.36 - - - - - - - 2.15 - - 2.87 - - - - - 3.18 3.11 _
Truckers, p«w er (fnrlclift)------------ 2.29 2.32 2.53 - 2 .6 8 2.47 2.55 2.28 - - 2.37 2.65 2.27 2.48 2.19 2.44 2.53 2.79 2.53 _
Truckers, pow er (other2.55 " 2.43 “ “ ■ “ “ “ “ “ 2 .6 2 “ 2.54 “ “ “ 2.96 2.42 2.28
1 Excludes premium pay for overtim e and fo r work on weekends, holidays, and late shifts.2 Data lim ited to men w orkers except where otherwise indicated.3 Includes all drivers regardless of type and size o f truck operated.
NOTE: Dashes indicate no data reported or data do not meet publication criteria.
Digitized for FRASER http://fraser.stlouisfed.org/ Federal Reserve Bank of St. Louis

Table A-ll. Plant Occupations—Nonmanufacturing
(Average hourly earnings 1 for selected occupations studied. July 1962 through June 1963)
41
Northeast
O ccupation2 Albany—Schenec
tady—T roy
Allentown—Bethlehem—
EastonBoston3 Buffalo Burl
ington
Lawrence—H aver
hill
Manchester
Newarkand
JerseyC ity3
NewHaven
NewY ork 3
Paterson—Clifton—P assaic
Philadelphia
Pitts - burgh
P ortland
P rov idence—Pawtucket
Scranton Trenton W ater-
buryW orces
ter York
Maintenance and pow er plant
Carpenters __ _ __ $2 .65 . $3.05 $2.76 _ _ $3. 17 _ $2.95 $3.04 $3. 16 $3.07 _ $2. 58 _ _ .E lectr ic ia n s________________________ 3. 15 - 2.93 - - - - 3.38 - 3.07 _ 3.05 3.00 3. 13 _ _ _ _ _Engineers, station ary_____________ 2 .64 - 2.69 2. 67 - . - _ 3.46 $2. 57 3. 17 _ 2.46 2.96 _ _ _Firem en, stationary b o i le r _______ 1.95 - 2. 50 - - - - 2.87 _ 2.51 _ 2. 15 2. 54 . 2.63 _ _ _ _H elpers, trades - - 2.46 2. 37 - - - 2.46 2.40 2. 51 2.38 2. 35 2. 50 _ 2. 33 _ _ $2 .1 6 _M achinists _ - - 3.06 - - - _ _ 2.85 _ 3.05 2. 99 _ „ _ _M echanics, aiitnmotivi;.___________ 2 .83 $2 .6 6 2.76 2.78 - $2.35 $2.25 2 . 90 2.84 3.07 2.81 2.87 3. 02 $2.35 2.64 $2 .6 8 $3.03 $2.74 2. 63 $2.71Me chanic s_________ ____________ __ - - 2.92 - - - - 3.23 _ 3. 18 2 .8 8 2.94 _ _ 3.01 _ _ _Painters __ - - 2.33 - - - _ 3 .13 _ 2.64 _ 2. 64 2 . 98 _ _ _ _P ip e fitte rs_________ _______________ - - - - - - - 3.61 _• _ _ 3. 16 3.06 _ _ _ _ _ _Plum bers — - - - “ - - - - - 2 .82 - 2.78 2 .8 6 - - - - - - -Custodial and m aterial movem ent
E levator operators, passenger(men) - - 1.45 - - - - 1.81 - 1.97 _ 1.69 - _ 1.23 _ _ _ _ _
Elevator operators, passenger(women) 1.24 - 1.30 1.29 - - - 1.53 . 1.83 - 1.44 1.69 1 .0 0 1.27 _ 1 . 11 _ 1.28 _
Guards and watchmen_____ _ _ 1.97 - 1.63 1.52 - - - 1. 57 1.40 1. 90 1 .8 8 1.42 1.67 1.79 1. 51 1.50 _ 1.94 _Jan itors, p orte rs , and cleaners
(m en )__- 1.65 1.70 1.67 1.57 $1.43 1.54 1.42 1.75 1.52 1.89 1.79 1.75 1.83 1. 51 1.63 1.36 1 .6 1 1. 51 1. 58 1.33Janitors, p orte rs , and cleaners
(women) 1.41 1.44 1.42 1.33 - - - 1. 55 1.75 1.72 _ 1.40 1. 55 1.30 1.35 _ 1 . 18 1.33 1.29 1.30L a borers , m aterial handling_____ 2.46 2 .6 6 2.27 2.41 1.80 2.32 1.80 2.52 2.25 2.46 2. 50 2.24 2. 38 1.84 2.26 2. 33 2.26 2 . 08 2. 33 2. 56O rder f i l l e r s ______________ _____ __ - - 2. 14 2.67 - - - 2 .53 2. 19 2.32 2.73 2.43 2. 78 2 . 18 _ _ _P a ck ers, shipping (men)__________ - , - 1.94 - - - - 1.98 2.03 2.29 1.69 2. 14 1.54 _ _ _ _P a ck ers, shipping (women) - - 1. 56 - - - - . 1.83 1.57 _ _ _ _ _ _ _R e c e iv in g c le r k s 2 .0 1 - 2 . 10 2.35 1.62 - 1.82 2.33 . 2.23 2.82 2.08 2. 50 2 . 16 1.97 2.08 r _ 1.85 1.98Shipping c lerks ____________________ - - 2 .2 1 - - - - 2. 50 - 2.44 - 2 .24 2.46 2. 13 2 .29 _ _ _Shipping and receiv ing c le r k s ____ - - 2 . 18 2.64 - - - 2. 57 - 2 .44 . 2.52 2. 52 2. 13 1.89 _ 2.30 _ _ _T r u c k d r iv e r s 4 _ 2 .8 6 2.72 2.56 2.76 2.46 2.60 2.36 2.90 2.61 2.91 2.93 2 .75 2. 93 2 .2 0 2.82 2. 57 2.90 2. 50 2. 58 2. 55Light (under l 1/; tons) - - 1.82 - - - - _ 2.06 2. 51 2.71 2.41 2. 67 1.91 1.84
Medium ( l 1/* to andincluding 4 tons) _ . 2 .75 - 2.35 2.57 - - - 2.77 2.74 2 .84 2.83 2.70 2.77 1.78 2.48 2.65 _ _ 2.27 _
Heavy (over 4 tons,tra iler typ e )___________________ 2. 93 2. 83 2.78 2 . 96 - - - 3. 10 2.79 3. 12 3. 13 2.81 3.24 2.34 2.93 _ 3.06 2.77 _
Heavy (over 4 tons, otherthan tra iler type)____ ________ - - 2 .63 - - - - 2 .70 _ 3.05 . 2.85 2.90 2 .2 1 _ _ 2. 30 2 .6 1 _
T ru ck ers , pow er {fo rk lift )__ 2 .65 - 2.52 2.74 . - - 2.77 _ 2.72 2. 57 2.64 3. 15 _ _ _ _T ru ckers, pow er (other
than fork lift) _ . . * ■ “ " " ■ “ - - - - - 2.75 - - - - - - -
See footnotes at end of table.
Digitized for FRASER http://fraser.stlouisfed.org/ Federal Reserve Bank of St. Louis

42
Table A-U. Plant Occupations—Nonmanufacturing— Continued
(Average hourly earnings 1 for selected occupations studied. July 1962 through June 1963)
South 5
O ccupation2Atlanta Balti
m o re 3
Beaumont—Port
Arthur
Birm ingham
C harleston,
W. Va.Charlotte
Chattanooga3 Dallas 3 Fort
WorthGreenville Houston Jackson Jack
sonville3
Little Rock- 1 North
Little Rock3
Lou isv ille
Lubbock M emphis3 M iami3 New
Orleans
N orfolk— Portsmouth and Newport
N ews—Hampton
OklahomaC ity 5
Maintenance and powerplant
Carpenters-------------------------------------- $2.63 $2.61 _ $2 . 16 _ $2.42 _ $2.94 $2 .0 1 _ $2.83 _ _ _ $3. 10 _ $2. 52 $2 . 59 $2.45 _ -E lectr ic ia n s------------------------------------ 2.96 _ - _ - - - 2.84 - - - - - - 3. 10 - - 2 .69 2.79 - -Engineers, stationary------ ----------- 2 .44 2. 34 - 2. 36 - - $2. 53 2.28 2. 36 - 2 .44 - $2.39 - - - 2. 37 2 .09 2. 17 - $2.08Firem en, stationary b o i le r ---------- - - - - - - - - - - - - - - - - - - - - -H elpers, tra d e s -------------------------- — . 2 .0 1 2.26 $ 1 .6 1 1 .8 8 - - - 1.77 - - 2.23 - 2.25 - 2. 32 - 1.98 - 2 .0 1 $2. 36 -M achinists ----------------------------------------------- _ _ - _ - - - - - - - - - - - - - 3. 30 - - -M echanics, automotive----------------------- 2.83 2 . 82 2.59 2.71 $2 .8 8 2.77 2 . 28 2.77 2. 24 $2.52 2.67 $2.46 2.48 $2.78 2. 87 - 2 . 88 2 . 61 2.65 2.69 2.60M echanics- ---------------------------------------- - 2.76 3.03 3.06 2.70 _ 2. 34 _ 2.89 2.25 - 2.74 - 2.56 - 2. 83 - - 2. 76 2.69 2 .84 2 .8 6Painte r s ____ ____________ _____ ___ 2.05 2. 30 - - - - - 2.42 - - 2.43 - - - - - 2.07 2. 32 2. 14 - -Pipefitters --------- — -------------------------- - - - - - - - - - - - - - - - - - - - - -Plum bers --------------------------------------------------- - - - - - - - ■ " * “ “ “ ~ “ “ “ " ■ “
Custodial and m aterial movement
Elevator operators, passenger(m en )___________ __ _______________,____ 1 .0 2 - - - - - - 1. 15 - - - - - - - - . 80 .9 4 .89 - -
Elevator operators, passenger(women)-------------------------------------------------- .70 1 . 16 - .78 .83 _ . 6 8 1 . 12 .9 4 - 1.09 .79 - .79 1.06 - .78 .93 .83 .96 .91
Guards and watchmen--------------------- 1.29 1. 38 - 1.63 1.77 1.29 - 1.36 1 . 28 - 1.28 1.48 1. 34 1.33 1.50 - 1. 24 1 .6 6 1.29 1.29 1.23Janitors, porters, and cleaners
(m en )-------------------------------------------- 1 .2 0 1.27 1.44 1.26 1.46 1.23 1. 19 1.25 1 . 22 1. 17 1 . 26 1 . 11 1.24 1.25 1.40 $1. 30 1 . 21 1. 33 1.04 1. 23 1.32Janitors, porters, and cleaners
(women) —— ___ , .99 1. 24 1.06 .97 1.46 1. 17 1 . 16 1 . 11 1. 13 .95 1 .2 1 1 . 12 1 . 12 .93 1.26 - .9 4 1 . 26 .91 .97 1.24L aborers, m aterial handling-------- 1.94 1.97 1.89 1.61 2.53 1.76 1.46 1.82 1.49 1.71 1 . 62 1. 50 1.71 1.48 2. 33 1.47 1.79 1.92 1.58 1.56 1.97Order f i l l e r s ---------------------------------- 1. 87 2 . 16 1.44 1.47 _ 1.60 - 1.74 1. 55 - 1.90 1. 33 1.70 - 2. 04 1. 57 1.62 1.77 1. 52 - 1 .6 6Packers, shipping (men)---------------- 1.62 2 . 11 - 1 .6 8 - - - 1.74 - - 1.47 - 1.74 1.32 1 .6 8 - 1. 83 1. 57 1.42 - 1 . 82Packers, shipping (w om en)----------- 1.52 1.61 - - - - - - - - - - - - - - - - - - -Receiving c le r k s ---------------------------- 1.95 2.26 2 .0 2 1.70 - 1.94 1. 55 1 .8 6 1. 53 - 1.89 - 1 .8 6 1.53 2.03 1.84 1 . 82 2 .03 1.75 1. 85 2 . 12Shipping c le r k s ------------------------------- 2 . 29 2 . 22 - _ - - - 1.98 1. 70 - 2 . 10 - - - - - 1 . 82 - 1. 94 - -Shipping and receiving c le r k s ------- 2.40 2 . 22 - 2.39 1.81 - - 2.05 - - 2.09 2 . 11 2 .2 2 - 2 . 12 - - - 2 .05 - -Truckdrivers 4 -------------------------------- 2.54 2.51 2.29 2.04 2. 57 2 .2 1 2.08 2. 36 1 . 81 2.27 2.26 1.95 1.99 2.08 2. 64 1. 87 2. 30 2 .2 2 1.93 1. 72 2 . 18
Light (tinder l l/2 tons)-------------- 1. 54 1.63 1.46 1. 34 - 1.64 - 1.69 1.44 - 1. 57 1. 27 1.40 1.37 1.57 - 1. 50 1.75 1.40 1.24 1.45Medium (1 V2 to and
including 4 tons)---------------------- 2.60 2. 36 2.46 2 .0 6 2.33 2.43 2 . 28 2.52 1.67 1.43 2. 38 2 .0 0 2 .0 0 1.95 2.08 1.99 2. 34 2 .24 1.94 1.55 2. 30Heavy (over 4 tons,
tra iler type)---------------------------- 2 .8 8 2.74 2.35 2.41 - 2.85 1. 85 2 .2 1 1. 83 2.78 2.60 - 2. 35 2.74 2 . 96 - 2. 56 2. 53 2. 31 2 . 20 2 .44Heavy (over 4 tons, other
than trailer type)--------------------- _ 2. 37 - - - - - - - - - - - - - - - - - - -Truckers, power (fo rk lift )------------ 2 .2 2 2.46 - 1.70 - 2 .2 1 1 .6 6 1.90 2.06 - 2 .0 2 - 1.63 - 2.45 1 .6 8 1 . 62 1.90 1. 87 1.59 2 . 18Truckers, pow er (other
than fork lift)----------------------------- - 2. 34 “ ” " “ - -' ' ‘
See footnotes at end of table.
Digitized for FRASER http://fraser.stlouisfed.org/ Federal Reserve Bank of St. Louis

(Average hourly earnings1 for selected occupations studied, July 1962 through June 1963)
Table A-ll. Plant Occupations—Nonmanufacturing----Continued
43
Occupation 2
South 5— Continued North C en tra l5
Raleigh R ichm ond3
SanAntonio 3
Washington 3 Akron Canton Chicago 3 Cincin
natiC leveland3 Columbus
D avenport- Rock Island—
MolineDayton Des
Moines D etroit3 GreenBay
Indianapolis 3
KansasCity Milwaukee
Minneapolis— St. Paul
Maintenance and powerplant
_ $2.59 . $2.87 . _ $3.63 $3.21 $3.13 $2.87 _ _ _ $3.02 _ $2.54 $2.98 $2.98 $3.04Electricians - - - 2.78 - - 3.54 3.08 3.10 - _ _ - 3.23 _ _ 3.25 _ 3.33
- - $2.65 2.95 - - 3.34 2.77 2.69 2.77 - - $2.37 2.89 _ 2.63 2.75 2.80 2.99Firem en, stationary b o ile r ________ - 1.70 - 1.84 - - 2.91 - 2.67 2 .2 1 - - 2 .1 0 2.53 - 1 .8 6 2.45 2.37 2.65H elpers, tra d es_________ _______. . . - . 1.37 2.30 - _ 2 .6 8 2.13 2.38 _ _ - _ 2.50 _ 2.48 . 2.76 2.65Machinists - - - - - - 3.37 - - - - - _ 3.09 _ 2.81 _ - _M echanics, automotive 5 $2.51 2.41 2.71 2.76 $3.00 $2.59 3.29 2.82 3.04 2.96 $2.78 $2.59 2 .8 8 3.08 $2.75 2.99 2.83 3.12 3.01Mechanics . _ . - _ _ 3.38 _ . _ _ _ _ 3.26 _ _ _ _ 3.04
- _ _ 2.46 . _ 3.55 2.72 2.60 . _ _ _ 2.95 _ 2.33 _ _ 3.29- - - - - - 3.65 - - . - - - - - - . _ _
Plumber s ............— -— —--------------- --- - - - - - 3.55 - - - - - - - - - - - -
Custodial and m aterial movement
Elevator operators, passenger(men) —____________________ ______ - - - - 1.16 - - 2.44 - - - - - - 1.51 - 1.16 - - 1.64
Elevator operators, passenger- .84 .92 1.24 - - 1.44 1 .2 1 1.23 1.05 .95 - 1 .1 0 1.39 - .89 1.28 1.25 1.59
Guards and watchmen—.. . . . . . . . - 1.63 1.47 1.59 1.37 1.40 1.78 2.06 1.58 1.58 _ 2.29 _ 1 .6 8 _ 1.45 1.40 _ 1.84Janitors, porters, and cleaners
(men) 5 1 .2 2 1.30 1.16 1.44 1.77 1.59 1.95 1.45 1.69 1.56 1.59 1.61 1.50 1.73 1.85 1.33 1.56 1.76 1.83Janitors, porters, and cleaners
1 .1 2 1 .21 1 .0 0 1.26 1.56 1.26 1.76 1.35 1.50 1.33 1.24 1.43 1.34 1.51 _ 1.29 1.54 1.42 1.60Laborers, m aterial handling 5_____ 1.58 1.59 1.49 2.06 2.83 2 .2 2 2.48 2.46 2.47 1.97 2.33 • 2.24 2 .1 2 2.48 2.48 2.24 2 .2 2 2.47 2.56Order fillers 1.61 1.71 1.23 1.96 2.07 . 2.J39 2 .1 1 2.24 2.07 _ 2.14 _ 2.47 » 2 .1 2 2.27 2.57 2.54Packers, shipping (men)_____ ,_____ - - 1.18 1.65 - _ 2.25 1.71 2 .0 1 1.61 • 1.93 2.29 2.16 _ 1.53 2.07 2.31 2.51Packers, shipping (women) . . . . . . . . . . - - - _ - . 1.65 . 1.58 _ _ _ _ 1.34 _ 1.31 1.65 1.72 1.57
- 1.89 1 .6 8 1.97 1.93 1.93 2.50 2.05 2.25 2.29 2 .2 2 2 .2 1 2.53 2.46 _ 2.14 2.14 2.60 2.50- - - 2.08 - - 2.43 2.03 2 .2 2 2.27 _ _ - 2.69 _ 2.19 2.24 2.65 2.72
Shipping and receiving clerks . . . . . . . - - -• 2.31 - 12.35 2.62 - 2.45 2 .2 0 - - 2.07 2.65 _ 2.38 2.72 2.56 2.52Truckdrivers 4» 5 1.97 1.94 1.77 2.28 2.95 '2.33 3.05 2.89 2.87 2.59 2.42 2 .8 6 2.77 2.92 2.77 2.56 2.61 2.93 2.82
Light (under 1V2 tons) - 1.93 1.29 1.54 - / - 2.82 2.74 2.59 1 .6 8 1.87 2 .1 0 2.03 2.38 «. 2 .0 0 1.85 2.74 2.60Medium (lVz to and
1.94 1 .8 6 1.91 2.29 2.85 2.15 3.01 2.76 2.90 2.41 2.24 - _ 2.62 2.79 2.43 2.53 2.65 2.83Heavy (over 4 tons,
- 2.35 1 .8 8 2.61 3.00 - 3.16 2.90 2.98 2 .8 6 2.50 _ _ 3.00 „ 2 .8 8 2.80 3.12 2 .8 8Heavy (over 4 tons, other
- - - 2.41 - _ 3.12 - 2.81 - _ - _ 3.00 _ _ 2.95 2.84Truckers, power (fork lift)______ __ - 1.84 1.44 _ 2 .8 6 _ 2.64 2.56 2.77 2.46 2.33 . _ 2.80 _ 2.54 2 .2 2 2.67 2.72Truckers, power (other
than fork lift)-------------- --------- --------- “ " ” * ■ ■ " 2.46 ■ ■ - - - - 2 .2 2 2.30 - 2.48
See footnotes at end of table.
Digitized for FRASER http://fraser.stlouisfed.org/ Federal Reserve Bank of St. Louis

44
(Average hourly earnings 1 for selected occupations studied, July 1962 through June 1963)
Table A-ll. Plant Occupations—Nonmanufacturing— Continued
Occupation 2
North Central5— Continued West
Omaha3Rockforc St. Lou is3 SiouxFalls
SouthBend Toledo W aterloo W ichita Albu
querque Boise DenverLos
A n geles-Long
Beach3
Phoenix3 PortlandSalt
LakeCity
SanBernardino—Riverside—
Ontario
SanDiego
SanFrancisco—
Oakland 3Seattle3 Spokane
Maintenance and powerplant
_______________________ $2 . 89 _ _ _ _ _ _ _ . . $2.98 $3.05 _ $3. 28 - - - $3. 81 $3. 12 $3. 52E lectric ian s______________ — ____ — _ _ _ - - $3.45 - - - - 3. 35 - 3. 35 - $3. 26 - 3. 44 - -Engineers, stationary—. . ---- —____ 2. 50 - $2.49 - - - - - - - 2 .60 3. 18 $2. 73 3.02 - - - 3. 29 3.06 2 . 66Firem en, stationary b o ile r ----------- - _ - - - - - - - - - - - - - - - - ■ ■H elpers, tra d es____ ________——___ 2 . 28 - - - - - - - - - 2.41 2. 53 - - $2. 44 - - - - -M achinists____ __ _ _ _ _ _ . . - _ - - - - - _ 3. 53 - - - - - 3. 42 - -M echanics, automotive - . . 2.91 $2. 53 3. 04 $2.44 $3. 09 3.01 $2 . 68 $2.79 $3. 28 $3. 05 3.06 3. 26 2.99 3. 13 2.94 3. 11 $3. 02 3. 48 3. 08 3. 08Mechanic s _________________________ _ - 3. 09 - - - - - - - - 3.01 - - - - - 3. 22 - -P a in ters .. . . — . - - _ 2. 78 - - - - - - - - 3.01 - - - - - 3. 67 ~Pipefitters _ ____________r----- T— - - - - - - - - - - - - - - - - - - •Plum bers . . . . ___ — — - - - " • “ ■ “ “ 3. 39 " ” ' ' "Custodial and m aterial movement
Elevator operators, passenger(m en)__________________—______ — - 1. 25 - - - - - - 1. 67 - ■ 2 . 12 ■ ■
Elevator operators, passenger01X16 .92 _ 1. 31 _ 1. 10 . _ .98 - - 1. 32 1.64 - 1. 43 1. 06 - 1. 50 2. 14 1. 64 -
Guards and watchmen . . . . 1.62 - 1.45 - - L 7 ? - 1 . 68 - - 1.80 2 . 16 1. 55 2 . 13 - - 2. 04 2.05 2 . 20 -Janitors, porters , and cleaners
(m en )_____________________________ 1. 65 1. 74 1.52 1. 54 1.60 1.85 1.67 1. 31 1.49 1.72 1.61 1. 89 1.43 1.90 1.59 1.87 1. 84 2 . 22 • 1.95 1. 76Janitors, porters , and cleaners
(w o m en ). ---- 1.41 . 1. 29 _ _ 1. 56 _ 1. 19 1. 57 - 1.65 1.75 - 1.77 1. 25 - 1.49 2 . 22 1. 81 1.48L aborers, m aterial handling_____ 2.43 2. 51 2. 52 _ 2 . 60 2. 53 2 . 19 2 . 12 2 . 39 2 . 60 2 .43 2.65 2. 27 2. 70 2. 19 1.93 2. 49 2. 90 2 .6 8 2. 56Order fillers _ _ _ _ _ _ __ _ _ 1.96 _ 2. 57 1.78 2. 29 2. 37 - - 1. 89 _ 2 . 21 2. 57 2. 54 2.65 2 .0 2 1.92 2 . 49 2 . 81 2. 57 2 . 60P a ck ers, shipping (men). — 2 .0 1 - 2. 31 - - 2. 17 - - - - 1 .9 2 2. 34 - 2 . 60 - - - 2 . 66 2. 64 -P a ck ers , shipping (women) _ _ — _ . - - - - - - - - - 1. 83 - - - - ~ 2. 19Receiving c le r k s ----- ------------ 2. 19 _ 2. 58 - - 2 . 39 - - 2 . 20 2. 17 2.07 2 . 60 - 2.55 2. 13 2 . 28 2. 29 2. 87 2 . 66 2 . 62Shipping clerks _ ____ . _ 2. 48 - _ - - _ - - 2. 36 2.73 - 2. 70 2 . 16 - - 2.99 2.77 -Shipping and receiving c le r k s ------- _ _ 2. 58 - - - - - - - 2. 53 2.71 - 2.67 2 . 08 - 2.45 2.96 2. 50 -Truckdrivers 4 ____________________ 2. 35 2.48 2.81 2 . 16 2. 87 2.90 2. 56 2. 34 2. 31 2. 67 2. 58 2.91 2. 47 2.87 2. 51 2. 39 2.75 3. 21 2.91 2 . 80
Light (under IV2 ton s)_________ 1.90 - 2. 17 - - 2. 54 - - 1.99 - 2 . 12 2. 74 1.82 - 2 .03 1. 74 2. 36 3. 04 2 . 59 -Medium (1 V2 to and
including 4 tons)______________ 2. 30 2 . 39 2. 76 2. 34 2. 69 2.71 - - - 2. 77 2 . 60 2 . 82 2.53 2.83 2. 55 2. 24 2 . 59 3. 18 2. 77 2.78Heavy (over 4 ton s,
trailer type)__________________ 2.78 2 . 69 2 . 89 _ 2.87 3.05 _ _ _ _ 2. 74 2. 97 2. 54 2.98 2 . 60 2. 83 2 . 89 3. 31 3.06 2.93Heavy (over 4 tons, other
_ _ . - _ - - _ - - - 2.91 - 2. 94 - - - 3. 27 2.95 -T ruckers, power (fork lift). 2. 30 - 2.81 - - - - 2. 55 - - 2. 53 2.93 - 2.81 2. 40 2. 64 2.83 2.91 2. 87 2. 69T ruckers, power (other
than fork lift)______________________ 2. 33 " 3. 00
1 Excludes premium pay for overtim e and for w ork on weekends, holidays, and late shifts.2 Data lim ited to men w orkers except where otherwise indicated.3 Exceptions to the standard industry limitations are shown in footnotes 4, 5, 7, and /or 11 to the table in appendix A.4 Includes all d rivers regardless of type and size o f truck operated. ..5 Rates for 2 areas not shown separately are as follow s: Savannah— janitors, porters , and cleaners (men), $1 .24 ; laborers, m aterial handling, $1 .80 ; tru ck d n vers , $2 .08 ; and truckdnvers, medium,
$2 .29 ; Muskegon—Muskegon Heights— m echanics, automotive, $2 .9 3 ; jan itors, p orters, and cleaners (men), $ 1 .8 2 , and (women), $1 .6 3 .
NOTE: Dashes indicate no data reported or data do not meet publication criteria .
Digitized for FRASER http://fraser.stlouisfed.org/ Federal Reserve Bank of St. Louis

Table A-12. Plant Occupations—Public Utilities1
(Average hourly earnings2 for selected occupations studied. July 1962 through June 1963)
45
O ccupation3 Albany—Schenec
tady—T roy
Allentown—Bethlehem—
EastonBoston4 Buffalo Man
chester
Newarkand
JerseyCity
NewHaven
NewY ork 4
Paterson— C lifton - Pass aic
Ph iladelphia
P ittsburgh
P ortland
P rov idence—Pawtucket
Scranton Trenton W ater-
buryW orces
ter York
Maintenance and powerplant
Carpenters — - - $ 2 .7 2 $ 2 .8 6 - $ 2 .8 6 _ $ 3 .0 3 _ $ 2 .8 2 $ 2 .7 7 _ _ . - - - -E lectr ic ia n s— ___ - - 3.03 - - 3.36 - 3.20 - 3. 15 2.93 - $3 . 19 - - - - -E ngineers, station ary_____________ - - - - - 3.43 - 3. 19 - 2 .80 2.94 - - - - - - -F irem en, stationary b o i le r -------— - - - - - 2 .67 - 2. 54 - - - - - - - - - -H elpers, tra d e s ------ — - - 2.58 2 .48 - 2. 50 - 2. 54 $ 2 .4 6 2.48 2.49 - 2 .35 - - - - -M achinists--------------------------------------- - - 3.08 - - - $ 2 .8 5 - - 3 .05 - -• - - - - - -M echanics, autom otive——________ $ 2 .8 0 $ 2 .6 8 2.71 2.77 $ 2 .2 4 2.91 2.83 3. 11 2.83 2 .8 6 3.02 $ 2 .2 7 2. 55 $ 2 .6 8 $ 3 .0 5 $ 2 .7 7 $ 2 .6 4 $ 2 .7 0Painters - - 2.91 - - 3.06 - 2.96 * 3.04 3.07 - - - - - - -
Custodial and m aterial movem entJanitors, p orte rs , and cleaners
(men) — — 2 . 11 2.03 2 . 11 2.08 - 2.27 2 .0 1 2 . 11 2 . 18 2 . 19 2. 23 1.83 2.04 1 .8 8 - - 2.04 1.70Janitors, p orters , and cleaners
(women) — — — 1.74 - - - - 1.65 - - - 1.84 1.79 - - - - - - -Laborers', m ateria l handling_____ 2.72 2.70 2.52 2 .6 8 - 2.63 2.53 2.60 2.69 2.54 2 .6 6 2. 56 2.71 2. 52 2.78 2. 67 2.75 2.69Truckdrivers *______________ —_____ 2 . 90 2.87 2.65 2.81 2.64 2.98 2.64 2 . 92 3.03 2.69 2.90 2 . 28 2.79 2.67 3. 10 2 .6 8 2.79 2.80
Light (under 1V2 tons)--------------- - - - - - - - - - - - - - - - - - -Medium (1 Vz to and including
4 tons) — 2. 83 - - 2.71 - 2.84 3.22 2.90 3.04 2.70 2.81 - 2 .77 2.70 - - - -Heavy (over 4 tons,
tra iler type) — 2.93 2 .8 8 2 .6 8 2.90 - 3. 13 2 . 69 3. 11 3. 13 2.71 3.08 2.08 2.79 - 3. 13 2 .6 9 2.80 -Heavy (over 4 tons, other than
tra iler ty p e )-------- ------------------ - - 2.65 - - - - 2. 97 - 2 .70 - - - - - 2 . 6 9 2.80 -T ru ck ers , pow er (fo rk lift ) . - - - 2.81 - 2 .8 6 - 2.71 - 2. 67 2.95 - - - - - - -T ru ck ers , pow er (other than
forklift) - “ " “ “ - - - ■ “ ■ " “ "
South
Atlanta Baltim ore 4
Beaumont—Port
Arthur
Birm ingham
Charleston,
W. Va.Charlotte
Chattanooga4 Dallas F ort
WorthG reen
ville Houston Jackson Jacksonville4
Little R ock - North
Little RockLouis -
v ilieLubbock Memphis 4 M iam i4 New
Orleans
Norfolk— Portsmouth and Newport
N ewa—Hampton
OklahomaC ity .
Maintenance and powerplantr.arpftntArn_ __ __ __ _______ - - - - - - - - - - - - - - - - - - - - -E lectricians — — - - - - - - - - - - - - - - $ 3 . 13 - - $ 3 .2 7 - - -Engineers, stationary - - - - - - - $ 2. 33 - - $ 2 .5 4 - - - - - - - - - -F irem en, stationary b o i le r _______ - - - - - - - - - - - - - - - - - - - - -H elpers, tra d e s___________________ - $ 2 .4 2 - $ 2 . 12 - - - 1.77 - - 2 .6 8 - $ 2 .4 2 - - - $ 2 .1 3 - $ 2 . 10 $2 .3 6 -M achinists--------------------------------------- - - - - - - - - - - - - - - - - - 3.30 - - -M echanics, autom otive— — — $ 2 .9 0 2.82 $3 .01 2.81 * $ 2 .8 6 $ 2 .8 0 - 2.78 $ 2 .2 9 $ 2 .5 3 2 . 66 $ 2 .4 9 2 .52 $ 2 .8 3 2.96 - 2.97 2.87 2.72 2 .6 8 $2 . 58Painters __ - - - - - - - - - - - - - - - - - - - - -Custodial and m aterial movem ent
Janitors, p orte rs , and cleaners(men) — — 1.73 1.80 1.85 1.81 1.91 1.31 $ 1 .6 2 1.63 1 .6 8 1.37 1.64 1.47 1.83 1.73 1.99 $ 1.59 1. 67 1.99 1. 56 1.59 1.73
Janitors, p orte rs , and cleaners(women) 1.70 - - - - - - 1.44 - - 1.51 - - - 1.59 - 1.35 1 .8 6 - - -
L a b orers , m aterial handling_____ 2 .64 2.52 1.94 2. 15 2 . 98 2.32 - 2 . 11 2 .0 1 2. 59 1.74 2.29 2. 17 - 2.83 1.65 2. 37 2. 27 - 1.74 2.35T ru ck d riv ers5 _ 2 .89 2.70 - 2.74 2.76 2.69 2.65 2.81 2.52 2. 53 2.93 2 .9 0 2.81 2.87 2.81 2.84 2 .8 6 2.74 2.54 2. 17 2 .6 8
Light (under l 1/* tons). - - - - - - - - - - - - - - - - - - - - -Medium (1 V2 to and including
4 tons)— — 2.85 2.73 2.75 2. 77 - 2 .60 2.56 2.83 2.31 - 2 .89 2.94 2.81 2.85 - - 2 .83 2.70 2 .6 8 2 .2 2 2.70Heavy (over 4 tons,
tra iler type) —____ ____________Heavy (over 4 tons, other than
2 .99 2.75 “ “ 2 .8 6 ” 2.43 “ “ 3.04 " ” “ ” 2 .8 8 2.83 2.40 2 .2 1 ”
tra iler type) - - - - - - - - - - - - - - - - - - - - -T ru ck ers, pow er {fo rk lift )—. --- -----T ru ck ers , pow er (other than
2 .90 - - - - - - 1 .8 8 2.31 - 2 . 12 - - - 2.46 1.49 1.43 - 2 .0 1 1.70 -
fork lift) - - - " - ■ " ** ■ ■ ■ • “ ■ ” ■ ■ ■ ■ -
See footnotes at end of table.
Digitized for FRASER http://fraser.stlouisfed.org/ Federal Reserve Bank of St. Louis

46
(Average hourly earnings2 for selected occupations studied, July 1962 through June 1963)
Table A-12. Plant Occupations—Public Utilities1— Continued
Occupation 3South— Continued North Central
Raleigh R ichm ond4
SanAntonio 4
Savannah4
Washington Akron Canton Chicago 4 C leve
land4 ColumbusDavenport-
Rock Island— Moline
Dayton DesMoines D etroit4 G reen
BayIndianapolis 4
KansasCity Milwaukee
Minneapolis— St. Paul
M uskegon-Muskegon
HeightsMaintenance and powerplant
Carpente r a-------------- ----------------------- - - - - - - - $2.78 - - - - - $3.08 - - $2.64 $2.67 $2 .6 1 -E lectricians — - — - - - - $2.79 - - 3.41 - - - - - - - - - - 3.16 -Engineers, stationary __ - - - - - - - 2.84 - - - - - 3.12 - - - - 2.63 -Firem en, stationary boiler - - - - - - - 2.73 - - - - - - - - - - 2.59 -H elpers, trades - - - - 2.35 - - 2.59 - - - - - 2.69 - $2.71 2.39 2.76 - -
- - - - - - - 3.35 - - - - - 3.08 - 2.81 - - - -M echanics, automotive.___ —_____ $2.59 $2.52 $2.80 - 2.76 $3.01 $2.59 3.30 $3.02 $3.03 $2 .8 6 $2.57 $2 .8 8 3.14 $2.84 3.02 2 .8 6 3.15 3.01 $2.93Painters ------ - - - - 3.13 - - 2.93 - - - - - - - - - - - -
Custodial and m aterial movementJanitors, porters, and cleaners
(men) _ ....... 1.57 1.76 1.67 $1.73 1.97 2.04 - 2 .2 2 2 .1 2 2 .0 2 2.04 - 1.91 2.28 1.97 2 .0 2 2.03 2.27 2 .2 1 2.15Janitors, porters, and cleaners
(w om en ) . . _. - - - - 1.65 1.74 - 2 .1 2 - - - - - - - 1.75 1.94 1.57 1.85 -L aborers, m aterial h a n d lin g -------- - 2 .0 0 2.36 - - 3.00 - 2 .6 6 2.84 2.59 2.82 - - 2 .9 2 2.50 2.79 2.43 2.87 2.64 -T rn r.k d riv e rs * .......... _ 2.30 2.43 _ 2.59 3.05 2.43 3.08 2.94 2 .8 6 2.87 2.94 2.96 3.04 2.87 2.96 2.77 3.05 2.85 -
Light (under 1V2 tons) - - - - - - - 2.97 - - - - - - - - - - - -Medium ( 1V2 to and including
4 tons) - 2 .2 0 2.59 - - - - 2.99 2.90 2.80 - - - 2.80 - 2 .8 6 2 .6 8 2.97 2.84 -Heavy (over 4 tons,
- 2.43 - - 2.13 3.00 - 3.17 3.01 - - - - 3.09 - 3.01 - 3.13 2.89 -Heavy (over 4 tons, other than
tra iler type) - - - - - - - 3.09 2.97 - - - - - - - - - - -- - - - - - - 2.63 - - - - - - - - - - 2.71 -
T ruckers, pow er (other thanforklift) - - - - - - - - 2.45 - " - ~ - - 2.37 - - “
North Central— Continued- W ett
•Omaha4 Rockford St. Louis SiouxFalls
SouthBend Toledo Waterloo Wichita Albu
querque Boise DenverLos
A ngeles-Long
Beach4
Phoenix4 PortlandSaltLakeCity
------- 555--------B ernard ino-R iverside—
Ontario
SanDiego
SanF ra n cis co -
Oakland 4Seattle4 Spokan*
Maintenance and powerplantC.arpAnterB . - - $2.70 - - - - - - - - $2.84 - $3.05 - - - $3.14 - .Electricians _______ - - - - - $3.55 - - - - - 3.17 - - - $3.26 - - - -Engineers, stationary_______ _____ $2.51 - - - - - - - - - - - - - - - - - - -Firem en, stationary boiler - - - - - - - - - - - - - - - - - - - -H elpers, trades_____________ _____ 2.30 - - - - - - - - - - 2.53 - - - - - - - -M a c h in ists _ - •- - - - - - - - - - - - - - - - - - -
2.91 $2 .6 1 3.08 $2.44 $3.10 3.04 - $2.79 $3.28 $3.07 $3.10 3.29 $3.09 3.14 $3.00 3.11 $3.04 3.48 $3.09 _Painters - - - - - - - - - - - 3.09 - - - - - 3.09 - -
Custodial and m aterial movement Janitors, porters, and cleaners
(m an) . _Janitors, porters, and cleaners
2 .0 0 2 .1 2 2 .2 2 1.77 " 2.26 $1.97 1.78 1.73 2.05 2 .0 0 2 .2 1 1 .6 6 2.15 1.99 2.24 2 .2 0 2.17 2 .2 1 $2 .1 6
(women) _ 1.82 - 1.87 - - 1.70 - - - - - - - - - - - 2.03 _ _Laborers, m aterial handling_______ 2.58 - 2.54 - 3.08 2.89 - 2 .6 1 2.71 - 2 .6 6 2.69 2.82 2.79 2.72 - 2.80 3.07 2.75 _T ru ckd rivers5 _ ______ 2.48 - 2.85 - 3.10 3.00 2.82 2.75 2.82 2.84 2.76 2 .9 0 2.79 2.85 2.72 2.51 2 .8 6 3.19 2.78 2.81
Light (under 1V2 tons) - - - - - - - - - - 2.70 - - - - - - - -Medium ( 1V2 to and including
4 ton s) __ _ 2.42 - 2.80 - 2 .8 8 2.85 - - - - 2.72 2.85 2.76 2.84 2.72 - 2.81 3.09 2.75 2.81Heavy (over 4 tons,
tr a ile r type) 2 .8 6 - 2 .8 8 - 3.09 3.16 - - - - 2.82 2.91 2 .8 6 2 .9 0 2.77 - 2.93 3.31 2.87 _Heavy (over 4 tons, other than
tr a ile r type) -------- ...... - - - - - - - - - - - 2.84 - - - - - 3.26 - _T r u c k e r s , p o w er (fork lift) - - 2 .6 8 - - - - - - - 2.80 2 .8 6 - 2.82 - - - 2 .9 0 - _T ruckers, pow er (other than
2.43fo rk lift) ~ “ ""
“ “ “ “ “ " “ “ ” -1 Transportation, communication, and other public utilities. Excludes taxicabs, serv ices incidental to water transportation, and municipally operated establishm ents.2 Excludes premium pay for overtim e and for work on weekends, holidays, and late shifts.3 Data lim ited to men w orkers except where otherwise indicated.4 Exceptions to standard industry limitations are shown in footnote 4 to the table in appendix A.5 Includes all d rivers regardless of type and size of truck operated.NOTE; Dashes indicate no data reported or data do not meet publication criteria.
Digitized for FRASER http://fraser.stlouisfed.org/ Federal Reserve Bank of St. Louis

(Average hourly earnings 1 for selected occupations studied, July 1962 through June 1963)
Table A-13. Plant Occupations—Wholesale Trade
47
Occupation 1 2
Northeast South North Central West
BostonNewark
andJersey
Citv
NewYork Philadelphia Pittsburgh Atlanta Baltim ore Houston Washington Chicago Cleveland D etroit
Minneapolis— St. Paul
St. LouisLos
A n geles-Long
Beach
SanF ran cisco-
Oakland
Maintenance and powerplantM echanics, autom otive—---------------- $2.99 $2.91 - $2 . 92 - $2.73 $3.26 $2 . 86 $3.09 $3.49
Custodial and m aterial m ovem entJanitors, porters, and clea n ers__ 1 . 80 1.91 $ 1 . 82 1.90 $ 1 .8 8 $1.61 $ 1 .6 8 1 .6 1 $1.55 2 .0 1 $1.84 2.03 $2 . 10 $1. 84 2. 13 2.24L aborers, m aterial handling_____ 2.28 2 . 21 2 . 39 2 . 20 2. 37 1.47 2 . 10 1.58 1.81 2. 33 2.23 2.42 2.58 2. 54 2.69 2.72O rder f i l l e r s ------ ----------------- — _ 2.07 2.40 2 . 28 2. 42 2. 52 1.82 2 .0 2 1.94 1.76 2.36 2 . 12 2 .44 2.59 2.55 2.53 2.81P ackers, shipping— ------- — — . 2. 17 _ 2.05 1.67 2 . 21 1.63 _ 1.50 1 . 62 2.29 2 .04 2 . 20 2.53 2.47 2. 35 2.70Receiving c lerk s ------- —------------- 2 .09 2.27 2. 38 2. 17 2. 55 2.05 _ 1.83 2. 15 2.49 2. 30 2. 70 2 .6 8 2.46 2.59 2.93Shipping c le r k s ------------------------------- 2 . 26 _ 2.42 2.27 2.48 2.29 _ _ _ 2.54 2 . 16 2.71 2 .6 8 2. 55 2 .6 8 2. 97Shipping and receiv ing c le r k s ------- 2. 33 2.60 2.48 2.49 - 2.40 2 . 16 2.09 - 2.75 _ 2.57 2 .6 6 2 .9 0 3.03 3.03T ru ck d rivers3— — — ---- ------ 2. 56 2.69 2.96 2 . 86 2. 84 1.89 2.50 1.74 2. 17 3.01 2.83 2 .78 2.84 2.76 2.90 3.20
Medium (1 V2 to and including4 tons)--------------------------------------- 2 . 39 2.57 2. 83 2. 77 2.75 1.95 2.29 1.50 2. 34 3.07 3.01 2.45 2.83 _ 2 . 82 3.25
T ruckers, pow er (fo rk lift ) ------------ 2 .46 2.62 - 2. 64 - 2.03 “ 1 .8 8 2.65 - 2.72 2.71 2 .8 6 2 .8 8 2. 87
1 Excludes prem ium pay for overtim e and for work on weekends, holidays, and late shifts.2 Data lim ited to m en w orkers.3 Includes all d rivers regardless o f type and size o f truck operated.NOTE: Dashes indicate no data reported or data do not m eet publication criteria .
Table A-l4. Plant Occupations—Retail Trade
(Average hourly earnings 1 for selected occupations studied, July 1962 through June 1963)
Northeast South North Central West
O ccupation2Boston
Newarkand
JerseyC itv3
NewYork
Philadelphia
Pittsburgh
P rov idence—Pawtucket
Atlanta Baltim ore Dallas Houston Miami New
OrleansWashington3 Chicago C leve-
land D etroit Indianapolis
Minneapolis— St. Paul
Denver P ortland
SanFrancis c o -
OaklandSeattle
Maintenance and powerplantC arpenters-------------------- — ~ ------ $3.43 - $3. 29 $3.71 - - $2 .8 6 - _ - - - - $3.30 - - - _ - _ _ _E lectr ic ia n s ------------ — — — ------ - - 3.40 3.39 - - - - - - - - - 3.45 - - - _ _ _ _ _Engineers, stationary-------------------- - - 3. 36 - $3.40 - - - $2.43 - - $2.78 - 3.45 - - - - - - _ -M echanics, autom otive------------------Custodial and m aterial m ovem ent ' ' ‘ ' '
2.46'
2 .70'
$2.25' '
3.29' ‘ ' ' ' '
$3.61 "
Elevator operators, passenger(wom en)___________________ ______ 1. 27 $1.34 1.61 1.46 - $ 1 .2 0 - $1. 13 - - - 1.05 $ 1 . 16 1. 37 $ 1 . 16 $ 1 . 22 - - $1.48 $1.42 _ $1.63
Janitors, porters, and cleaners
Janitors, porters, and cleaners1.65 1.51 1. 53 1.52 1.67 1. 37 1. 14 1. 24 1 .2 0 $1.24 1 .2 0 .95 1. 34 1.77 1.49 1.49 $1.26 $1.69 1. 44 1.77 2 . 19 1.96
(worn en)________________ __________ 1 . 28 _ 1. 53 1.32 1.45 _ 1. 13 1 . 11 1 .0 1 - - 1.03 1. 19 1.55 1. 17 1. 31 1. 14 1.46 1.43 1.43 - 1.77L aborers, m aterial handling-------- 2 . 10 2. 34 2. 15 1.85 2.23 1.81 1.63 1.74 1.69 1.39 1.63 1.49 1.77 2. 33 2. 40 1.89 1.62 2 . 16 2 . 19 2. 35 2 . 82 2.60O rder f i l l e r s _______________________ 2. 31 2.75 2.42 2.44 3. 04 - 1.99 2.26 1.90 1. 90 1 .8 8 1.89 2. 15 2.51 2. 56 2. 50 2 .34 2. 35 2. 15 2. 58 2. 77 _P ack ers, shipping (m en)--------------- 1.43 - 1.96 1.74 2.04 1.43 _ 1.61 1.44 _ - 1. 25 - 2 .09 _ _ - 2. 38 _ _ 2. 36 _P ack ers, shipping (w om en)----------- 1. 55 - 1.77 1.60 - - 1.49 - - - - - - 1.73 - - - 1.52 - - _ _Receiving c le r k s ----------------------------- 2.09 2. 31 2.08 2 .0 2 2. 52 1.95 1 .8 8 2. 24 1.74 1 .9 0 1.83 1.70 1.85 2.40 2 . 11 2. 34 - 2. 33 2. 14 2.43 2 . 81 2.67Shipping c le r k s ------------------------------- 2 .2 0 - 2 .44 _ - - - 2 . 18 2 . 12 - - - - 2.25 - - - - - - _ _Shipping and receiv ing c le r k s ------- - - - 2.61 2. 30 1.73 - 2 . 19 - - - 2 .0 1 - 2.33 - - - - - - 2.85 -T ruckdrivers 4 ------------- __ ----------- 2 .44 - 2 .8 6 2.75 3. 11 - 1.89 2 .2 1 1 .9 2 1.74 1.90 1.63 2.25 3.03 2.94 2 . 90 2.36 2.70 2.40 2. 85 3.49 _
Medium (IV 2 to and including4 tons) __ ___________ — _ 2 . 28 - 2. 36 _ 2.65 - 2.09 2 . 01 1.87 1.79 1.83 1.63 1.96 - 2.85 2. 58 1.89 2.70 2 .2 1 2.79 3.41 -
Truckers, pow er ( fo rk lift )________ 2 .6 6 2.79 .2 .63 3. 51 - 2. 14 2 . 60 - - 1.94 1.83 2.57 2.78 2 .6 6 - 2.75 - " 2.99 -
1 Excludes prem ium pay fo r overtim e and for work on weekends, holidays, and late shifts.2 Data lim ited to m en w orkers except where otherwise indicated.3 Exceptions to the standard industry limitations are shown in footnote 5 to the table in appendix A.4 Includes all d rivers regardless o f type and size o f truck operated.NOTE: Dashes indicate no data reported or data do not meet publication criteria.
Digitized for FRASER http://fraser.stlouisfed.org/ Federal Reserve Bank of St. Louis

48
(Average hourly earnings 2 for selected occupations studied. July 1962 through June 1963)
Table A-15. Plant Occupations—Finance1
O ccupation3
Northeast South North Central West
BostonNewark
andJersey
CityNew York Philadelphia Pittsburgh Atlanta Baltim ore Dallas Washington Chicago Cleveland Detroit
Minneapolis— St. Paul
St. LouisLos
A n geles-LongBeach
SanFrancis c o -
Oakland
Maintenance and powerplantCarpenters , ................ - - $ 2 .9 4 - - - - - - $4 .21 $ 2 .6 9 - - - - -Electricians - - 3.06 - - - - . - 4.21 - - - - - -Engineers, stationary _ - - 3.22 $ 2 .3 2 $ 2 .9 2 - ' $ 2 . 22 $ 2 .6 5 3.51 - - $ 3 . 16 - - -Painters _ $ 2 .0 5 - 2 .65 2.28 - - - - 2.15 - 2. 50 $ 2 .9 7 3.36 - - -
Custodial and m aterial movementElevator operators, passenger
(men) — 1.51 - 2.05 1.72 - - - 1 .2 2 - - - $ 1.28 $ 1.71Elevator operators, passenger
(women) — - - - - - - - - - - - 1.47 - 1.29 1.77 -Janitors, p orters, and cleaners
(m en )_____________________________ 1 .6 1 $ 1.75 2.05 1.71 1.93 $ 1 .0 2 $ 1.25 1. 15 1 .2 1 2.34 1.77 1.69 1.93 1.29 1.78 $ 2 .3 0Janitors, p orters, and cleaners
(women) _ _ _ 1.39 ” 1.72 1 . 37 1.64 .76 1. 17 1 . 16 1. 16 1.80 1. 54 1.43 1.58 1.24 1 .6 6 _
1 Finance, insurance, and real estate.2 Excludes prem ium pay for overtim e and for w ork on weekends, holidays, and late shifts.3 Data lim ited to men w orkers except where otherwise indicated.NOTE: Dashes indicate no data reported or data do not meet publication criteria!.
Table A-16. Plant Occupations—Services
(Average hourly earnings 1 for selected occupations studied, July 1962 through June 1963)
Occupation 2 3 4
Northeast South North Central West
BostonNewark
andJersey
City
NewYork
Philadelphia
Washington Chicago Detroit
LosA n g e les -
LongB each 3
Maintenance and powerplantCarpenters - - $2 . 58 - $ 2 .6 2 $ 3 .8 4 - $ 3 .0 6E lectr ic ia n s______________ ________ - - 2.69 - - 3.41 - 3. 12Engineers, stationary _ - $ 2 .8 5 2.95 $ 2 . 21 2 .8 6 3. 15 $ 2 .7 5 3 .09H elpers, trades ___ - - 2.31 - - - - -M echanics, automotive __ - - - - - - - 3 .25P a in ters______ - _____ - - 2.46 - 2.35 - - 2 .98Plum bers - - 2. 58 - - - - -
Custodial and m aterial movementElevator operators, passenger
(m en )--------------------------------------------- $ 1 .3 2 - 1.73 1.06 - - 1.62Elevator operators, passenger
(women) —r----------------- - - - - 1.25 - 1.37 -Janitors, porters , and cleaners
(m en )--------------------------------------------- 1.48 1. 55 1.90 1.49 1.44 1 .6 1 1 .6 6 1.82Janitors, p orters , and cleaners
(women) __ - - 1.73 1.28 1 .2 2 1.63 1.62 1.80Truckdrivers 4__ ____________ _____ 2.05 2. 53 2.64 - 1. 54 - 2 .69 2. 32
Light (under 1 V2 tons) “ ■ ■ ■ 1.48 “ “ 2. 13
1 Excludes prem ium pay for overtim e and for w ork on weekends, holidays, and late shifts.2 Data lim ited to men w orkers except where otherwise indicated.3 Excludes data for m otion picture production and allied serv ices ; data for these industries are included, how ever, in
"a ll industries" and "nonmanufacturing. "4 Includes all d rivers regardless o f type and size o f truck operated.NOTE: Dashes indicate no data reported or data do not meet publication criteria.
Digitized for FRASER http://fraser.stlouisfed.org/ Federal Reserve Bank of St. Louis

B: Establishment Practices and Supplementary Wage Provisions
Table B-l. Minimum Entrance Salaries1 for Women Office Workers—All Industries
(Distribution of establishments studied by minimum starting (hiring) salary1 for selected occupations, July 1962 through June 1963)
49
Inexperienced typists Other inexperienced c ler ica l w o rk ers 2
Number of establishments—
Labor market Studied Having a specified minimumHaving no specified minimum
Notemploying
w orkers in category
Datanot
available
Having a specified minimumHaving no specified minimum
Notemploying
w orkers in category
Datanot
availableTotal
Minimum weekly salary
Total
Min imum weekly salary
Under$40
$40and
under$50
$50
$60
$ 6 0
$70
$70
$80
$80
$90
$90andover
Under$4'0
$40and
under$50
$50
$60
$60
$70
T 7 0
$80
$80
$90
$90”andover
Northeast
B oston 3 . 272 151 _ 22 89 31 4 3 2 71 50 _ 160 s “ 37 82 32 3 4 2 80 32 .Buffalo 207 110 . 15 45 28 15 6 1 25 71 1 111 2 0 45 26 13 6 1 30 65 1Burlington 36 10 - - 8 2 . . . 9 17 * . 13 - 1 10 2 . . . 19 4 .Manchester 62 22 - 14 7 1 - . - 6 34 . 39 . 26 12 1 . . _ 13 10 _New Y ork 3 691 310 . 8 118 144 31 9 . 155 226 . 345 - 20 167 123 25 8 2 192 154 _Philadelphia 390 195 . 36 93 51 5 10 - 78 116 1 219 - 55 96 51 7 10 . 104 66 1Pittsburgh _______ ____________ 208 120 . 22 50 21 19 5 3 44 43 1 128 . 23 56 23 18 5 3 48 31 1P rovidence—Pawtucket.------------------ 135 75 . 39 30 4 1 1 . 26 34 . 78 . 40 31 6 . 1 . 24 33 _Trenton 82 33 - 2 16 10 1 4 - 15 34 - 37 - 5 19 8 1 4 - 21 24 -
South
195 88 _ 22 39 15 4 8 _ 38 69 _ 98 _ 31 42 14 4 7 48 49 .Chattanooga 3 - 99 24 1 13 8 2 . - . 3 71 1 • 39 1 23 12 3 . . _ 12 47 1Dallas 3 216 81 . 28 31 19 2 - 1 23 112 . 107 1 44 38 20 3 . 1 28 81 _F ort Worth 134 46 . 27 13 5 - 1 . 25 62 1 62 1 36 17 5 1 1 1 26 45 1Jacksonville 3 127 47 . 18 23 4 2 - . 16 64 . 57 1 25 25 4 2 _ _ 28 42 _Little R ock-N orth Little R o ck 3 ___ 79 29 1 20 7 . 1 - - 7 43 . 41 1 23 15 1 1 _ _ 10 28 _L ouisville 153 52 . 16 18 11 5 1 1 25 76 - 76 . 28 30 9 6 1 2 34 43 _New O rleans.— . . . . . . . . . — . . . . . . . ___ _ 174 56 . 18 27 6 3 2 - 21 96 1 77 . 30 32 9 3 3 _ 27 69 1N orfolk—Portsm outh and
Newport News—Hampton— — 104 28 2 12 8 5 - - 1 13 63 . 38 6 15 12 4 . . 1 17 49 _Oklahoma C ity3------------------------------- 122 27 . 8 16 2 - 1 - 8 87 . 55 2 23 22 6 . 1 1 23 44 _San Antonio 3 115 38 1 20 16 1 - . . 8 69 - 49 1 25 19 3 . . 1 9 57 _W ashington3 ------------------------------------ 223 88 - 12 34 36 4 2 - 43 92 - 98 - 17 46 31 3 1 - 60 65 -
North Central
Chicago 3 545 285 _ 9 85 129 32 2 0 10 118 142 _ 301 _ 17 118 110 24 26 6 137 107Cleveland 3 294 147 - 14 66 47 7 11 2 59 87 1 159 - 23 71 45 9 9 2 64 70 1Columbus 143 64 - 16 32 10 4 2 . 19 60 . 74 . 24 32 11 4 3 _ 34 35 _Davenport—R ock Island—M oline____ 92 35 - 4 16 3 10 2 . 10 47 - 52 1 15 21 3 9 3 . 16 24 _D etro it3 2 9 0 135 - 17 4a 38 21 7 3 60 95 . 150 . 29 52 45 14 6 4 69 71 _Green Bay 60 14 . 5 8 1 . . . 8 38 . 29 _ 17 11 1 _ _ _ 13 18 _
1 90 88 . 5 56 18 6 3 - 37 65 - 100 . 15 56 2 0 5 3 1 49 41 _M inneapolis-St. Paul 275 127 . 37 69 16 3 1 1 60 88 . 139 . 53 61 18 4 2 1 82 54 _St. Louis 3 ---------------------------------------- 251 129 . 34 45 32 8 7 3 50 71 1 142 . 44 55 25 8 8 2 57 51 1T oledo 126 44 . 3 18 18 3 2 . 22 60 . 58 . 7 28 17 4 2 _ 27 41 _W aterloo 46 12 . 4 5 2 1 _ . 7 27 . 26 1 10 13 1 1 . _ 12 8 _Wichita 69 21 - 7 8 3 3 - - 6 42 - 27 1 9 9 5 3 - 1 10 32 -
West
Los Angeles—Long B ea ch 3 353 186 2 31 74 36 25 18 57 110 _ 201 _ 5 47 68 37 28 16 57 95Salt Lake City 103 38 . 15 16 4 1 1 1 19 46 . 50 _ 18 22 7 1 1 1 19 34 _San Diego 101 41 . 3 14 17 4 1 2 10 50 . 47 . 6 17 16 5 1 2 12 42San F ran cisco-O aklan d3. 269 139 . . 37 54 26 9 13 52 78 . 152 _ _ 45 . 55 28 16 8 52 65 _Seattle 3 150 62 . 2 30 2 0 7 3 . 21 67 - 72 . 6 33 22 8 3 _ 29 49 _Spokane 67 17 9 5 1 2 10 40 24 19 2 1 2 10 33 “
These sa laries relate to form ally established minimum starting (hiring) regular straight-tim e salaries that are paid for standard workweeks. Data are presented for all standard workweeks combined. Excludes w ork ers in subclerica l jobs such as m essenger or office girl.Exceptions to the standard industry limitations are shown in footnotes 4, 5, 7, and /or 11 to the table in appendix A.
Digitized for FRASER http://fraser.stlouisfed.org/ Federal Reserve Bank of St. Louis

50
Table B-2. Minimum Entrance Salaries1 for Women Office Workers—Manufacturing
(Distribution of establishments studied by minimum starting (hiring) salary1 for selected occupations, July 1962 through June 1963)
Inexperienced typists Other inexperienced c le r ica l w ork ers 2
Number o f establishments—
Labor market Studied Having a specified minimumHaving no specified minimum
Notemploying
w orkers in category
Datanot
available
Having a sp ec ified minimumHaving no specified minimum
Notemploying
w ork ers in category
Datanot
availableTotal
Minimum weekly salary
Total
Minimum w eekly salary$40and
under$50
$50
$60
$60
$70
$70
$80
$80
$90
$90and
over
andunder
$50 $60 $70 $80 $90and
over
Northeast
Boston _ . _ 90 58 4 37 14 2 1 _ 24 8 _ 59 6 36 14 1 2 _ 26 5 _Buffalo ________ __ 111 71 4 30 20 13 3 1 16 23 1 67 3 33 16 11 3 1 18 25 1Burlington _ _ 18 6 - 4 2 - - - 4 8 - 7 - 5 2 - - - 9 2 -M anchester_______________________ 33 14 8 6 - - - - 3 16 - 22 13 9 - - - - 6 5 -New York _ _ _ _________ 238 113 1 38 55 13 6 _ 47 78 - 122 2 54 50 1 1 5 _ 62 54 -Philadelphia _ ____ 184 95 6 39 38 5 7 - 42 47 - 105 9 43 39 7 7 - 55 24 -P ittsbu rgh________________________ 76 53 4 20 12 11 4 2 11 12 - 57 5 22 14 10 4 2 12 7 -Providence—Pawtucket - 76 36 13 19 3 1 - _ 22 18 - 37 13 19 5 - - - 20 19 -Trenton------------------------------------------ 49 26 1 12 9 - 4 - 9 14 - 25 2 11 8 - 4 - 12 12 -
South
Baltim ore . m ^ 75 38 3 16 9 2 8 _ 20 17 _ 37 3 18 7 2 7 . 23 15 _Chattanooga _ . . . 55 13 6 5 2 - - - 3 38 1 20 11 7 2 - - - 9 25 1D allas............................ 70 26 5 8 12 - - 1 7 37 - 33 8 13 10 1 - 1 7 30 -Fort W orth _______________________ 49 13 3 6 3 - 1 _ 12 23 1 19 6 8 3 1 1 - 13 16 1Jacksonville______________________ 40 7 1 6 - - - _ 9 24 - 6 1 5 - - - - 19 15 -Little Rock—North Little R o c k ___ 33 11 8 3 - - - - 1 21 - 19 9 9 1 - - - 3 11 -Louisville - _ 73 31 2 13 10 4 1 1 12 30 - 40 6 19 8 4 1 2 18 15 -New Orleans 54 15 2 7 4 1 1 - 7 32 - 19 3 8 5 2 1 - 10 25 -Norfolk—Portsm outh and
Newport News—H am pton________ 36 12 5 3 3 - - 1 5 19 - 13 5 4 3 - - 1 5 18 -Oklahoma City _______ 35 7 2 4 1 - - - 1 27 - 13 4 7 2 - - - 3 19 -San Antonio ___________ ________ _ 40 13 5 7 1 - - - 4 23 - 17 7 8 2 - - - 6 17 -W ashington______________________ 45 15 1 5 9 - - - 10 20 - 18 ' 8 10 - - 15 12 -
North Central
C hicago. . ___ . ._ ___ 216 131 _ 32 62 18 16 3 51 34 _ 129 1 39 56 13 16 4 56 31 .Cleveland _ 144 84 3 32 34 3 10 2 26 34 - 85 4 37 29 5 8 2 31 28 -Columbus _________ 65 28 1 17 6 2 2 - 14 23 - 31 2 18 6 2 3 - 20 14 -Davenport—Rock Island—Moline — 51 23 - 10 2 9 2 - 6 22 - 32 5 15 2 8 2 - 8 11 -Detroit _ _ _ ____ 101 55 _ 12 23 14 4 2 20 26 - 54 1 11 25 10 5 2 25 22 -Green Bay _______ - 29 9 3 5 1 - - - 3 17 - 16 8 7 1 - - - 5 8 -Milwaukee _ ____ — -------- 93 50 2 31 10 4 3 - 21 22 - 51 4 29 12 2 3 1 24 18 -Minneapolis—St. P a u l_____________ 105 53 8 36 7 1 - 1 23 29 - 54 9 34 9 1 - 1 30 21 -St. L ou is__ _ — 106 65 10 24 21 4 4 2 20 20 1 69 14 28 17 4 4 2 21 15 1Toledo . . . . __ — 62 29 _ 12 13 2 2 _ 10 23 - 34 2 15 12 3 2 - 12 16 -W a ter loo____________________ _____ 24 9 3 4 1 1 - - 4 11 - 17 6 9 1 1 - - 6 1 -Wichita _______ _. ______ _ . 24 8 " 4 2 2 " - 4 12 - 8 - 3 3 2 - - 4 12 -
West
Los Angeles—Long B ea ch________ 124 76 _ 2 33 21 16 4 20 28 - 76 _ 9 29 17 16 5 18 30 _Salt Lake C ity ____ ____ __________ 34 15 4 9 1 - - 1 3 16 - 18 7 9 1 - - 1 3 13 -San Diego ________________ 30 14 - 1 9 3 1 - 2 14 - 15 - 3 8 4 - - 3 12 -San F ran cisco-O aklan d__________ 83 47 - 4 20 12 4 7 15 21 - 49 - 5 20 13 4 7 15 19 -
ScHittlc ...... j 55 19 1 10 4 3 1 _ 11 25 - 21 1 12 3 3 2 - 15 19 -
Spokane________. . . ____ ._ 24 6 2 2 2 3 15 7 5 2 3 14
These salaries relate to form ally established minimum starting (hiring) regular straight-tim e salaries that are paid for standard workweeks. Data are presented for a ll standard workweeks combined. Excludes w orkers in subclerica l jobs such as m essenger or o ffice g ir l.
Digitized for FRASER http://fraser.stlouisfed.org/ Federal Reserve Bank of St. Louis

Table B-3. Scheduled Weekly Hours—All Industries
(Percent distribution of office and plant workers by scheduled weekly hours of first-shift workers, July 1962 through June 1963)
51
Labor m arket
O ffice w orkers Plant w ork e rs 1
Under 40 hours 40hours
Over40
hours
Under 40 hours 40hours
Over 40 hours35 3674 37V2 383/* T ota l2 Under
37Vz 37Vz T ota l2 T ota l2 42 44 45 48 Over48
Northeast
B o s tn n 3 13 7 26 6 65 35 (4) 3 5 13 81 7 (4) 1 (4) 4Buffalo 1 2 25 6 35 65 (4) 3 8 X x 84 4 1 (4) 2 jB urlin gton ........... _ _ 1 - 16 _ 33 63 4 5 _ 5 84 11 (4) X 5M a n c h e ste r (4) - 27 15 46 53 1 1 1 3 84 13 4 2 2N ew Y o r k 3 _______________________________________________ 53 8 16 2 86 14 , 10 12 19 78 4 1 1 (4 ) 2 (4)Philadelphia 9 5 23 7 52 48 (4 ) 2 6 9 86 5 (4) (4 ) (4 ) 2 xP ittsb u rg h ---------- _ .. _ T._ 3 1 20 3 29 71 (4 ) 1 1 2 92 6 2 1 I (4 )P ro v id e n c e —P aw tu cket - - _ 4 8 19 10 47 53 3 1 6 78 16 (4 ) 6 (4 ) 3T re n to n _ . 11 1 12 1 27 72 (4 ) 4 - 4 91 5 - 4 (4 ) 1
South
B a lt im o r e 3 . 3 4 17 2 33 66 2 2 3 8 82 10 1 3 4 (4 )C h a tta n o o g a 3 . - - 5 1 24 2 38 58 4 3 3 6 80 14 x 2 1 8 2D a l la s 3_____ _____________________________ _ 1 (4) 5 8 18 78 5 3 (4 ) 3 72 25 1 7 4 6 3F o r t W orth (4 ) 1 1 2 93 5 3 4 74 23 (4 ) 4 3 7 4J a ck so n v ille 3 5 34 4 45 51 4 2 4 6 61 32 3 3 4 6 4Little R ock-N orth Little R o ck 3- (4) _ 16 - 16 76 9 1 .5 79 16 X 4 X 6 3L o u is v ille 11 (4) 10 1 32 6 4 5 2 6 8 79 13 (4) 4 2 2New Orleans -------- ------------- 6 10 5 26 67 7 2 I 5 63 32 I 2 I I 12 3Norfolk—Portsm outh and Newport
N e w s—H am pton 5 _ 7 1 23 72 5 5 1 8 77 15 X 3 2 2 4Oklahoma C ity3 (4) . 3 - 10 84 6 1 x 5 65 30 X 3 7 5San Antonio 3 (4) - 1 _ 6 88 6 1 3 6 62 32 1 8 8 6 7W a sh in g to n 3 9 1 18 7 38 61 1 4 3 7 72 22 <*> 6 2 10 3
North Central
Chicago 3 6 4 16 9 40 59 (4) 4 2 6 88 6 j 2 2 IC le v e la n d 3 2 1 16 2 22 77 3 5 8 87 6 1 2 2 xColumbus 3 _ 5 11 19 80 2 5 3 8 78 14 2 4 3 3 3D avenp ort—R ock Island—M o lin e (4) - 11 . 18 80 2 3 x 5 90 6 (4) 1 (4) 3D e tr o it 3 _ _ _ _ _ 2 1 8 2 17 82 (4) x 1 3 95 3 (4) (4) (4) xGreen Bay (4) - 14 „ 2 17 82 1 9 1 11 80 9 1 3 4Milwaukee --------------------- -------------- o 1 8 6 16 84 1 2 2 4 89 7 2 I 2M inneapolis-St. Paul (4) (4) 19 8 31 69 1 4 3 7 90 3 (4) (4) X 1St. L o u is 3 - -------- 1 3 8 5 19 81 (4 ) *•. 4 8 89 3 2 (4 ) (4 )T o le d o ----- ^ (4 ) (4 ) 13 2 16 83 (4 ) 2 3 87 10 2 2 4 (4 )Wa te r lo o ---------------------------------------------------- ---------- - - (4 ) (4 ) 95 5 x 26 67 7 2 3 2Wichita - - (4 ) 96 3 1 1 3 80 18 - 4 2 6 5
West
Los Angeles—Long B each 3--------------------------- ---------- 2 2 7 4 18 82 (4 ) 2 3 96 1 X l4 )Salt Lake C ity ------------------------------------------ - - 2 - 2 96 2 3 _ 3 76 21 4\ ) 4 x x
San D iego — (4 ) - 5 - 11 88 1 3 _ 4 90 6 x x 4 \ 1
San F ran cisco-O akland 3 — 3 1 19 9 38 62 _ 7 7 16 84 ( 4 ) (4 )S e a t t le 3 . ------------------------ ------------------------------------ . - 11 3 14 86 3 3 97 V /Spokane------------------------------------------ --— .... --------- 4 2 6 94 (4 ) 1 81 19 16 • 3
1 Data for finance and insurance establishments are excluded.* May include w eekly schedules other than those presented separately.
Exceptions to the standard industry limitations are shown in footnotes 4, 5, 7, and /or 11 to the table in appendix A. 4 L ess than 0.5 percent.
Digitized for FRASER http://fraser.stlouisfed.org/ Federal Reserve Bank of St. Louis

52
Table B-4. Scheduled Weekly Hours—Manufacturing
(Percent distribution of office and plant workers by scheduled weekly hours of first-shift workers, July 1962 through June 1963)
Labor market
O ffice w orkers Plant w orkers
Under 40 hours 40hours
Over40
hours
Under 40 hours 40 Over 40 hours
35 36V4 37*/z 383/4 T o ta l1 Under37 Vz 37 Vz T o ta l1 hours T o ta l1 42 44 45 48 Over
48
Northeast
Boston— — 12 _ 23 2 39 61 „ 2 5 6 89 4 _ 2 1 2 -Rnffaln ..... ..... _ 1 - 12 4 17 83 - 3 2 5 90 5 - 1 <2) 3 1Burlington — 3 - 1 - 4 95 1 6 - 6 92 1 - - 1 -M anchester-------------------------------- -------------------- 1 - 4 - 5 95 - 2 1 3 92 5 - - - - -New York__ — 58 5 12 2 81 19 - i1 18 5 25 74 1 - - (2) 1 -Philadelphia _______________ _ _ ___ ______ 5 2 18 13 41 59 - 2 8 10 87 4 - (2) 2 1Pittsburgh— — — 1 - 2 2 6 94 (2) 1 1 3 93 4 1 1 - 2 -Providence—Pawtncket----------------------------------- --- 2 1 12 12 28 72 3 1 4 80 16 - - 7 - 3Trenton 4 1 8 - 15 85 <*) <2) - (2) 94 6 - 6 - “
South
Baltim ore ___ — 1 (2) 10 4 17 80 3 1 5 7 86 7 _ 1 3 2 -Ohattanonga __ _ _ - 2 1 6 9 89 3 3 1 4 87 9 - - - 7 1Dallas — - 1 - 2 3 6 91 4 2 - 2 80 18 - 7 2 3 3Fort Worth - - - 2 2 96 2 4 2 6 82 12 (2) 2 2 5 2Jacksonville _ - 6 - - 6 89 6 2 5 7 77 16 9 - - 2 2Little R ock-N orth Little Rock . — - - 2 - 2 94 4 3 - 3 91 7 - 2 - 3 2Louisville ___ 7 1 8 3 20 78 1 2 6 8 8 8 4 - 2 2 - -New Orleans ___— - - 5 - 6 85 9 4 3 7 71 23 - - 18 2 2Norfolk—Portsm outh and Newport
News—Hampton__ — — - 9 - 2 4 15 85 - 2 1 3 94 3 - - 1 - 2Oklahoma City — - - - - - 94 6 - 4 4 73 23 - 5 11 2 5San Antonio — - - - - - 92 8 - 5 5 75 20 - 3 4 4 5Washington— ___ 4 - 27 2 33 65 2 22 14 35 56 9 - 2 3 2 "
North Central
Chicago 5 2 17 15 38 62 _ 6 3 8 8 8 4 _ _ 2 <2) 1Cleve land.., .............................. .......... ..- <2) (2) 12 1 14 86 - 2 7 10 8 6 5 - 1 2 1 1C o l u m b u s ............. ........... .......... v-1. . I..,-........ 6 2 8 90 2 - 6 6 86 9 3 2 2 (2) 2Davenport—R ock Island—Moline___ ______ _____ - <*) - (2) - 1 99 <2) - 1 1 94 4 - 2 <2) 3 -Detroit — - 3 2 4 96 1 1 3 96 1 - - - 1
1 - 27 3 34 66 - 14 2 16 76 8 - - 3 3 2Milwaukee _____ - (?) 3 4 8 91 <2) 2 2 4 89 7 2 - 1 (2) 2M inneapolis-St. Paul — — ( !) <2) 10 4 24 75 1 8 3 10 87 3 1 - 2 (2) -St. Louis n 6 6 14 86 - 4 4 8 89 2 2 - - -Toledo — - 7 3 10 90 <2) 1 2 2 88 10 3 2 - 4 -W aterloo — — - - - - - 96 4 - 1 31 66 2 - (2) 2 - -Wichita__ - - - - - 98 2 1 1 3 89 8 - 2 1 2 3
West
Los Angeles—Long Beach <*> - 1 1 2 98 _ 3 - 4 96 . - - - - _
Salt Lake City - - - - 98 2 5 - 5 81 14 - 7 - 6 -San D ieg o ----------- _ - - 1 - 1 99 - 4 - 4 95 1 - - - 1 -San Francis co-Oakland i 1 16 14 39 61 - 14 1 17 83 - - - - - -S e a tt le . • - 1 . 1 99 - 4 - 4 96 - - - - _ .Spokane. 4 4 96 2 2 56 43 40 2
1 May include weekly schedules other than those presented separately.2 L ess than 0. 5 percent.
Digitized for FRASER http://fraser.stlouisfed.org/ Federal Reserve Bank of St. Louis

Table B-5. Scheduled W eekly Hours—Public Utilities1
(Percent distribution of office and plant workers by scheduled weekly hours of first-shift workers, July 1962 through June 1963)
53
O ffice w orkers Plant w orkers
Labor m arket Under 40 hours 40 Over40
hours
Under 40 hours 40 Over 40 hours
35 36V4 37» /2 383/4 T ota l1 2 3 4 hours Under37 ‘ / 2 37 V2 Total2 hours T ota l2 42 44 48 Over
48
Northeast
Boston 3___________________________________ _____ 2 _ 49 _ 51 49 _ _ . _ 96 4 _ 4B u ffa lo__________________________________________ 1 - 37 - 38 62 - - _ - 99 1 - - 1Rur lin g ton _____ - - 65 - 65 35 - - - - 74 26 - - -M anchester ■ ....T .. . ........... - - 58 - 58 42 . - - - 69 31 - - -New Y o rk 5 ______________________________________ 53 (4) 11 4 68 32 - 1 3 4 96 (4) . _ (4)P h iladelphia____________________________________ 7 5 23 (4) 34 66 - (4) - (4) 99 - -P ittsbu rgh__ __ - - 45 - 47 53 (4) - - ^ - 83 17 6 - -P rovidence—Pawtucket - 4 71 - 75 25 - - - - 91 9 - - -
South
66' '
6 6 34 100
B altim ore 3 - (4) . 29 _ 31 69 - . - _ 100 _ _ - _ .Chattanooga 3 - 11 - 14 86 - - - 2 90 8 - - - -Dallas _ - - 3 - 3 - 5 91 4 - - - 79 21 - - 2 (4)F ort Worth — - - _ - - 100 - - - - 93 7 - - 3 5Jacksonville 3„ „ —r_T„_ri. _______________,___ - 1 27 - 28 72 (4) - - - 98 2 - - 2 -Little Rock—North Little Rock . - - - - - 99 1 - - - 90 10 - - 10 -L ouisville - - 19 - 19 81 1 - - - 92 8 - - 1 -New O rle a n s___ __N orfolk-Portsm outh and Newport
11 ~ 20 4 36 59 6 - - - 92 8 - * 4 (4)
News—Hampton — 2 - 31 - 34 66 - - - - 83 17 - 4 5 -Oklahoma City -i------------------- - - - - - - 99 1 - - - 98 2 » - 2 -San Antonio 3 - - - - - 100 - - - - 95 5 - 2 1 2Washington 7 - 32 14 54 46 - - - - 96 4 - “ 2
North Central
Chicago 3___ 2 _ 4 1 7 93 - - _ - 99 1 .. - . -Cleveland 3 ____________ . . . ------- --------------------------- - - 3 1 4 96 - - - - 93 7 - - - -Columbus - - - - - 99 1 - - - 100 - - - - -Davenport—Rock Island—M oline __ - - - - - 100 - - - - 97 3 - - - -D etro it3----------------------- -------------------------------—— - 1 - 29 (4) 30 70 - - - - 98 2 - - 2 -G reen Bay — — - - - - 100 - - - - 100 - - - - -
- - - - - 100 - - - - 96 4 4 (4) - -M inneapolis-St. Paul - - - - - 100 - - - - 99 1 - - - -St. Louis 4 - 1 1 6 93 1 - - - 99 1 - - 1 -Toledo _____ - 2 - - 4 96 - - . - 100 - - - - -W aterloo - - - - - 99 (4) - - - 93 7 - - 4 -Wichita - - 2 - 2 98 - - - 96 4 - - 3 1
West
Los Angeles—Long Beach 3_____________________ 4 - 1 (4) 5 95 - - - - 100 - - - - -Salt Lake City . — - - - - - 100 - - - - 94 6 - - 6 -San D iego - - - - - 100 - - - - 100 - - - - -San F ran cisco—Oakland 3_______________________ 1 - 7 8 16 84 - - 6 6 94 - - - - -Seattle 3__ - - 34 - 34 6 6 - - - - 100 - - - - -Spokane 100 92 8 8
1 Transportation, com m unication, and other public utilities. Excludes taxicabs, serv ices incidental to water transportation, and municipally operated establishments.2 May include w eekly schedules other than those presented separately.3 Exceptions to the standard industry limitations are shown in footnote 4 to the table in appendix A.4 L ess than 0. 5 percent.
Digitized for FRASER http://fraser.stlouisfed.org/ Federal Reserve Bank of St. Louis
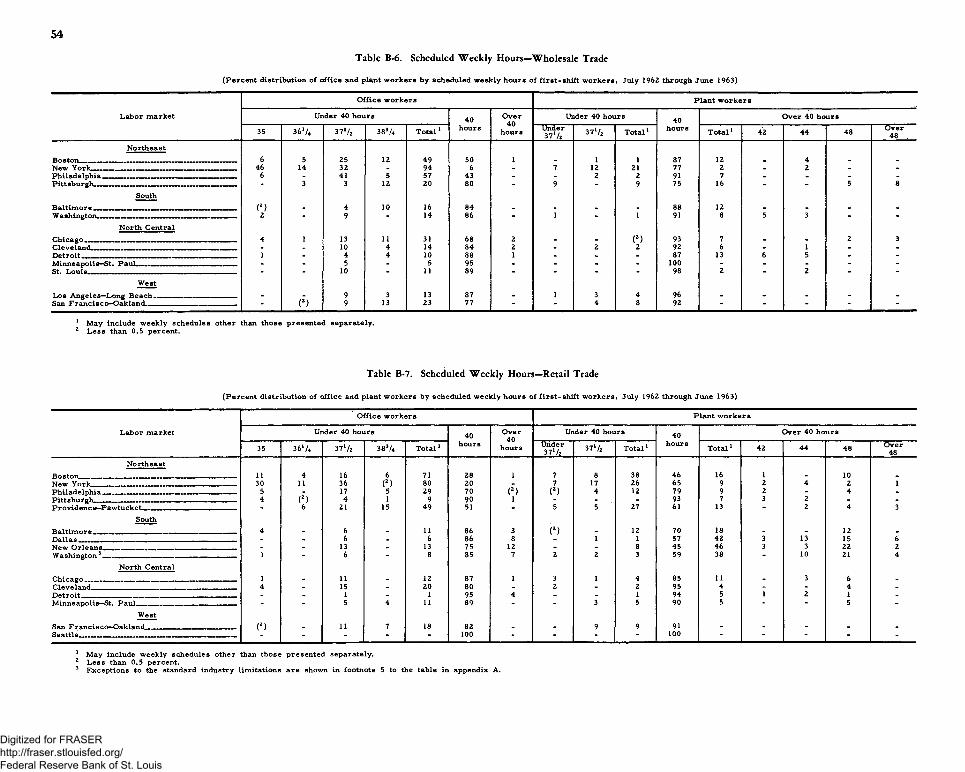
54
Table B-6. Scheduled W eekly Hours—Wholesale Trade
(Percent distribution of office and plant workers by scheduled weekly hours of first-shift workers, July 1962 through June 1963)
O ffice w orkers Plant w ork ers
Labor market Under 40 hours 40hours
Over40
hours
Under 40 hours 40hour 8
O ver 40 hours
35 361/* 37V2 383/4 T ota l1 Under37l /z 37l/z T ota l1 T ota l1 42 44 48 Over
48 .Northeast
Bo 8 ton__ . __ 6 5 25 12 49 50 1 . 1 1 87 12 . 4 . _New York— 46 14 32 - 94 6 - 7 12 21 77 2 . 2 - -Philadelphia 6 - 41 5 57 43 - - 2 2 91 7 - - - -P ittsb u rg h __ - 3 3 12 20 80 - 9 - 9 75 16 - - 5 8
SouthBaltim ore . . . . - .......... (2) . 4 10 16 84 _ _ . _ 88 12 _ _ . -Washington. . ---- 2 - 9 - 14 86 - 1 - 1 91 8 5 3 - -
North Central4 1 13 11 31 6 8 2 _ . (2) 93 7 _ . 2 3
Cleveland_________ - - 10 4 14 84 2 - 2 2 92 6 - 1 - -1 . 4 4 10 88 1 - . - 87 13 6 5 - -
Minneapolis—St. Paul. _ - - 5 - 5 95 - - - - 100 - - - - -St. Louis - - 10 - 11 89 - - - - 98 2 - 2 - -
WestLos Angeles—Long B each . __ - - 9 3 13 87 - 1 3 4 96 - - - - -San F ran cisco—Oakland_________ _______ —______ - (2) 9 13 23 77 - - 4 8 92 - - - - -
1 May include weekly schedules other than those presented separately.2 L ess than 0.5 percent.
Table B»7. Scheduled Weekly Hours—Retail Trade
(Percent distribution of office and plant w orkers by scheduled weekly hours of first-sh ift w orkers, July 1962 through June 1963)
Labor market
O ffice w orkers Plant w ork ers
Under 40 hours 40hours
Over40
hour 8
Under 40 hours 40hours
Over 40 hours
35 36l /4 37* U 383/4 T ota l1 Under37V2
37 V2 T ota l1 T ota l1 42 44 48 Over48
NortheastB oston--------- _ _ ------ -- ------ 11 4 16 6 71 28 1 7 8 38 46 16 1 _ 10 .New York------------ . _ _ 30 11 36 (2) 80 20 - 7 17 26 65 9 2 4 2 1Philadelphia . . _______ ____ 5 - 17 5 29 70 (2) (2) 4 12 79 9 2 - 4 -Pittsburgh______ 4 (2) 4 1 9 90 1 - - - 93 7 3 2 - -Providence—Pawtucket^. - 6 21 15 49 51 - 5 5 27 61 13 - 2 4 3
SouthB a ltim o re 4 . 6 _ 11 86 3 (2) - 12 70 18 - - 12 _Dallas _ _ 6 - 6 86 8 1 1 57 42 3 13 15 6New O rle a n s _ . 13 _ 13 75 12 _ - 8 45 46 3 3 22 2Washington3 — 1 - 6 - 8 85 7 2 2 3 59 38 - 10 21 4
North CentralChicago 1 _ 11 - 12 87 1 3 1 4 85 11 - 3 6 _Cl evelan d ---------- _ __ 4 - 15 - 20 80 - 2 - 2 95 4 - - 4 -Detroit _ _ - _ 1 - 1 95 4 . - 1 94 5 1 2 1 -Minneapolis—St. P a u l----- _ ___ _____ - - 5 4 11 89 - - 3 5 90 5 - 5 -
WestSan F r a n c is co -O a k la n d___ (2) _ 11 7 18 82 _ - 9 9 91 - - - - -Seattle______ _ - - - - 100 - 100 “ - -
May include weekly schedules other than those presented separately.Less than 0.5 percent.Exceptions to the standard industry limitations are shown in footnote 5 to the table in appendix A.
Digitized for FRASER http://fraser.stlouisfed.org/ Federal Reserve Bank of St. Louis

Table B-8. Scheduled Weekly Hours—Finance 1
(Percent distribution of office workers by scheduled weekly hours of first-shift workers, July 1962 through June 1963)
55
O ffice w orkers
Labor market Under 40 hours 40 Over
35 36 V4 37 V2 383/4 T ota l1 2 3 hours hours
Northeast
■Rnofnn 18 15 30 8 95 5 _New Y ork—_____________________________________ 54 11 10 . 91 9 _Philadelphia------- _ — — — ------------ — ---- 18 15 23 1 83 17 -Pittsburgh. — — --------- — ------- — 10 3 56 4 77 23 -
SouthB altim ore- — __ — — ... 9 13 31 . 64 36 .Dallas — — — — — — ...........— — — — - 1 8 18 36 64 (3)Washington---- --------- ------- ------------ ------------ 22 4 21 15 67 33
North CentralC h icago________________________________________ 13 14 22 9 72 28 _Cleveland— ------------ ------- . . __ ---- ------- 6 4 39 7 63 37 -D etro it . ------------ . . ..... ........ .............. ......— 1 7 12 6 44 56 .Minneapolis—St. Paul — — — ---- --------- — 1 - 36 24 72 28 -St. Louis — — — ------- ------- — „ — - 7 8 10 34 66 -
WestLos Angeles—Long B ea ch ------------------------------ — 3 8 13 13 45 55 -San Francisco—Oakland------------------------------------- 2 “ 28 9 48 52 "
1 Finance, insurance, and real estate.2 May include weekly schedules other than those presented separately.3 Less than 0. 5 percent.
Table B-9. Scheduled Weekly Hours—Services
(Percent distribution of office and plant w orkers by scheduled weekly hours o f f irst-sh ift w orkers, July 1962 through June 1963)
Labor m arket
O ffice w orkers Plant workers
Under 40 hours 40hours
Over40
hours
Under 40 hours 40hours
Over 40 hours
35 36V4 37 V* 383/4 T ota l1 Under37 V. 37 V2 T o ta l1 T ota l1 42 44 45 48 Over
48
Northeast
Boston_______________________________ __________—_ 18 8 6 10 55 45 (2) 8 2 11 89 _ _ _ _ _ _New Y ork_________ -________________________-___— 54 3 27 7 92 8 3 2 6 84 10 2 - 1 7 _Philadelphia-------------------------------------------------------- 7 5 48 13 74 26 1 12 4 20 60 20 - 2 2 3 6
SouthWashington --------------------- — ------- ------- ------ 4 (2) 9 - 14 85 (2) - 2 2 88 9 4 2 4
North CentralC h icago ---------------------------------------------------------------- 14 2 30 8 63 36 1 5 1 7 71 22 . 8 - 12 3D etro it ----------------------------------------------------------------- 29 - 33 - 63 34 3 5 5 10 77 12 - - - 9 3
WestLos Angeles—Long B ea ch 3 ------------------------------— 4 4 26 “ 43 57 (2) - 4 4 86 10 6 1 4 -
1 May include weekly schedules other than those presented separately.2 Less than 0. 5 percent.3 Excludes data for m otion picture production and allied serv ices; data for these industries are included, however, in "a ll industries.
Digitized for FRASER http://fraser.stlouisfed.org/ Federal Reserve Bank of St. Louis

56
Table B-10. Shift Differential Provisions—Manufacturing
(Percent distribution of plant workers in establishments having formal provisions 1 for late-shift operations, July 1962 through June 1963)
Percent o f manufacturing plant w orkers
Northeast South
Shift operation and shift pay differential
Boston Buffalo B u rlington
Manchester
NewYork
Philadelphia
P ittsburgh
P rov idence—Pawtucket
T ren ton
Baltim ore
Chattanooga Dallas Fort
WorthJackson
ville
LittleR o ck -NorthLittleRock
Louis - v ille
NewOrleans
N orfolk— P orts - mouth
and• Newport
News— Hampton
OklahomaCity
SanAntonio
W ashington
Total plant w orkers in manufacturingestablishm ents__ __ . ____ 1 0 0 . 0 1 0 0 . 0 1 0 0 . 0 1 0 0 . 0 1 0 0 . 0 1 0 0 . 0 1 0 0 . 0 1 0 0 . 0 1 0 0 . 0 1 0 0 . 0 1 0 0 . 0 1 0 0 . 0 1 0 0 . 0 1 0 0 . 0 1 0 0 . 0 1 0 0 . 0 1 0 0 . 0 1 0 0 . 0 1 0 0 . 0 1 0 0 . 0 1 0 0 . 0
Second shiftPlant w orkers in establishments:
With provisions for second shift------------------ 81. 5 95.2 85 .8 54. 0 70.4 87.3 98.0 76.9 91.3 86.4 91.7 77.7 80.9 78.0 63 .8 93 .8 75.3 8 8 . 6 82 .6 54.7 79.3With shift pay differential 78 .8 95.0 74.6 31. 5 6 9 . 0 8 6 . 2 97.5 50.6 89.6 83 .9 65.4 72. 1 76.3 58. 9 62. 1 9 0 . 1 58.6 87. 5 72.7 37.6 70. 5
Uniform cents (per hour) 38.0 60.4 23.6 23.6 38. 2 49 .9 88 .4 37.9 49 .3 51.9 50. 3 66.9 6 8 . 1 58.9 52.4 62.6 54.9 2 2 . 2 4 9 .6 35. 1 45. 1Under 5 cents - .7 - - . 6 1 . 0 2. 3 6 . 0 - 1 . 2 2 . 2 . 8 1.3 - . 6 - - 7. 5 1 .9 4 .9 -5 and' under 6 cants------------------------ 7 .0 2 .9 8 .3 15.0 4 .8 9.4 1 . 0 5.0 15. 7 6 .5 8 .9 1 1 . 0 5.6 32. 1 2 0 . 6 12.3 7. 5 4. 3 1 2 . 1 8 .3 7 .26 and under 7 cants------------------------ 2 .7 4 .2 - - . 8 2 .5 5.8 3.9 5.2 5.7 5.6 1.3 1.7 - 2 . 2 4 .0 10.4 . 8 - 1.4 -7 and under 8 cants------------------------ 4. 1 3 .2 . 5 .7 2 . 6 4 .6 2 . 2 6 . 5 1 0 . 6 - 7. 5 8 .9 5.8 9.4 1 6 . 8 5. 5 6 .4 .9 2 .7 - 2 .98 and under 9 cents------------------------ 2 .4 19.8 - - 1 . 0 10 . 1 63.8 6 . 2 7 .4 29.0 1 6 . 8 4. 5 4 .4 6 .4 6 . 2 4 .8 15.7 1.4 - - -9 and under 10 cen ts______________ 1 . 6 2 . 8 - - - 3 .6 2 . 8 - 3 .3 . 6 - - - 2. 5 3 .4 - - - - - -10 and under 11 cents.. 13.2 1 2 . 6 4 .3 6 .5 1 1 . 0 13.6 4. 5 6 . 6 5.0 4 .9 7. 5 25.9 7. 3 8 .4 - 27.2 1 1 . 2 3. 0 18. 3 13.6 2 . 011 and under 12 cents_____________ - 3 .4 - - 1 . 2 1. 5 - - - - - - - - - - - - - 1.9 -12 and under 13 cents_____________ .7 4 .3 - - J .3 1 . 6 5.3 2. 7 2 . 2 2 .3 .9 9. 3 28.9 - 2 .7 4. 1 2. 5 2. 5 10.9 - 3 .913 and under 14 cents--------------------- 2 . 0 . 8 - - 1 . 6 . 6 - - - 1.7 .9 - 3.4 - - 2 .7 - •8 3.7 - 1 . 814 and under 15 cents_____________ - . l - - .4 - .7 - - - - 1 . 6 - - - - - - - 5 .0 7 .715 and under 16 c a n ts-------------------------- 2 . 8 3 .6 - - 5. 1 - _ 1 . 2 - - - 3. 1 9 .6 - - 2 . 0 - - - - 4 .316 cents and over 1.4 1.7 10.4 1. 5 8 .9 1.4 - - - - - . 8 - - - - 1.3 .9 - - 15.3
Uniform percentage---------------------------- 28. 1 30.2 51.0 7 .9 28. 9 32.4 9 .2 8 . 5 40 .3 27 .9 1 1 . 6 5.2 8 .3 - 9 .7 20.4 3 .8 65 .2 21 .4 - 4. 1Under 5 percent - .3 - - - - - - - - - - - - - 2 . 8 - - - -5 percent 2 . 6 18.7 - 5. 5 3.2 2.7 1.9 .9 18.9 4 .4 3.9 2 .9 6.3 - - 3 .7 .9 3 .8 - - -Over 5 and under 10 percent 4 .8 1.3 3.3 - 1. 0 5.7 . 6 1 .1 2 . 1 6 .7 - - - - - 3 .2 - 61.4 - - -10 percent 19.6 9 .8 47 .7 2 .3 1 9 . 0 2 2 . 6 6 . 6 6 . 5 17.9 16.7 7.7 2. 3 2 . 0 - 9 .7 13. 5 - - 21 .4 - 4. 1Over 10 and under 15 percent _ _ _ 1 .0 - - - .7 .7 - - - - - - - - - - - - - - -15 percent and n v a r --------------- ,------------
Other*- - - - 4 .9 . 6 - - 1.3 - - - - - - - - - - - -
1 2 . 8 4. 5 - - 1.9 3 .9 - 4 .2 - 4. 1 3. 5 - - - - 7 .0 - - 1 . 6 2. 5 2 1 . 2With no shift pay d ifferential__ ____________ 2.7 . 1 1 1 . 2 22. 5 1.4 1 . 1 . 5 26.3 1.7 2 . 6 26.3 5.6 4 .5 19. 1 1.7 3 .7 1 6 . 6 1 . 1 9 .9 17. 1 8 . 8
With no provisions for second shift. . . . . . . . . . . 18. 5 4 .8 14.2 46 .0 29.6 12.7 2 . 0 23. 1 8 .7 13.6 8.3 22.3 19. 1 2 2 . 0 36.2 6 . 2 24.7 11.4 17.4 45 .3 20.7Third shift
Plant w orkers in establishments:With provisions fo r third sh ift_________________ 72.6 9 0 . 6 78.0 40 .4 59.8 81.2 96.7 65. 5 81.7 83.2 85.2 57.0 71. 5 69.9 55. 0 82.4 4 7 .6 8 8 . 2 54. 0 29 .5 67.3
With shift pay differential _ 72.6 9 0 . 6 76.6 36.2 59.2 80. 1 96.7 60.2 81.7 82.7 76.3 57.0 69.6 55.7 53.4 81. 0 4 6 .4 87. 1 52. 5 23. 1 60 .0Uniform cents (per hour) 32.4 54.4 25.6 30.7 27.8 46. 1 87. 5 44 .5 41. 3 50.7 60. 1 44 .0 24.9 55.7 43 .7 53.9 4 3 .0 21.9 31. 1 23. 1 37.3
Under 7 cents - .4 2 . 1 - 1. 1 1.4 . 5 5.3 - 1 . 2 16.9 1.7 2 . 2 15.4 7 .2 1.4 - 9 .3 8 .3 1 . 2 .97 and under 8 cents.. _ 6 . 2 . 5 . 5 14.2 . 8 2 .4 1 . 6 14. 5 6 . 2 . 8 2. 5 3.5 3 .3 9.2 14.0 - - 3. 5 - 3.7 2 .98 and under 9 cents________________ . 8 .7 - 2 . 2 - .3 2 .4 4 .7 3.9 3 .4 3.2 . 6 1 . 8 1 0 . 6 3. 1 2 . 6 - - - _9 and under 10 cen ts______________ . 6 3 .4 - - - 2.7 5. 1 - - 3 .2 1.4 - - - 3 .4 2 .4 3 .0 - - - -10 and under 11 cents 10.3 8 .3 1 2 . 2 1 0 . 8 10.4 17.5 5. 1 7. 5 18.2 3 .3 7 .4 12.3 6 .4 7 .4 13.7 14.7 5.6 2 . 0 6 . 6 3 .3 2 . 011 and under 12 cents_____________ 1 .0 4 .7 - - - . 2 .9 - 2 . 1 2 . 8 2.7 - - - - - 4 .4 - - _ _12 and under 13 cents___ 2 . 6 25.0 - . 2 .9 8 . 8 71. 1 3.4 6.7 2 9 . 0 7. 0 4 .7 6 . 2 9 .4 2 .4 5. 5 2 0 . 8 1 . 8 1 0 . 1 _ 3 .913 and tinder 14 cents________________ - . 8 - - . l 1.7 - - 1 .0 - .9 1 . 8 - - - 1. 1 - - 1 . 8 _14 and tinder 15 cents -------------------------- 1 .0 - - - . 8 .3 .7 - .9 . 6 3. 1 - - - - 1.3 - - _ . _15 and under 16 cents________________ 6 .3 6 .7 - 1.9 4 .6 2.7 - 7. 1 2 . 2 3 .3 15.0 16. 5 - 3.6 - 14.7 5.3 2 . 2 4 .3 9 .9 4 .316 and under 17 cents - - - - . 8 4 .4 . 2 - - 1.3 - . 5 1 . 6 - - 3 .0 3 .8 1.4 - _17 and under 20 cents.. 2 . 0 2 .3 - - 1 . 6 3.7 - . 8 - - - - - - - 4 .4 - . 7 - - 1.420 cents and over 1.4 1.5 10.4 1. 5 4 .6 - - 1 . 2 - 1.7 - 2 .9 3 .4 - - 2 .7 - .9 - 5.0 2 1 . 8
Uniform percentage 29.8 29.9 51.0 5. 5 21.7 29.0 9 .2 10.7 33.7 27.9 1 1 . 6 3.3 7. 5 - 9.7 19. 1 .9 65 .2 21.4 - 4. 1Under 7 percent 1. 1 .3 - - 3 .5 1 .0 1. 1 .9 2 . 1 1 .0 1. 1 - - - - - - - - - _7 and under 10 percen t ------------------— 3 .0 2 . 6 - - 1 .0 4 .3 . 6 1. 1 1 . 8 5.7 2 . 8 - - - - - - 61 .4 - - _10 percent _ 2 1 . 6 26.9 47 .7 5 .5 9.3 2 0 . 8 7 .5 8.7 29.7 2 0 . 1 7.7 3.3 5.6 - 8 .3 19. 1 .9 3 .8 21 .4 _ 1. 1Over 10 and under 15 p ercen t__ __ . 8 - - - .4 1 . 2 - - - - - - - - - - - - - - 1.915 percent _ 3 .3 - 3 .3 - 6 . 8 1. 5 - - - 1. 1 - - 2 . 0 - 1.4 - - - - - 1 . 2Over 15 percent - - - - .7 .3 - - - - - - - - - - - - - - -
Other * _ 10.4 6 .3 - - 9.7 5. 1 - 5.0 6 . 8 4. 1 4 .6 9.3 37.2 - - 8 . 0 2. 5 - - _ 18.6With no shift pay differential_________ __ - - 1.4 4 .2 . 6 1 .0 - 5.3 - . 5 8 . 8 - 1.9 14.2 1.7 1. 5 1 . 2 1. 1 1.5 6 .4 7 .3
With no provisions for third shift _ 27.4 9 .4 2 2 . 0 59.6 40 .2 18.8 3 .3 34. 5 18.3 16.8 14.8 43 .0 28. 5 30. 1 4 5 .0 17.6 52.4 1 1 . 8 4 6 .0 70. 5 32.7
See footnotes at end of table.
Digitized for FRASER http://fraser.stlouisfed.org/ Federal Reserve Bank of St. Louis

Table B-10. Shift Differential Provisions—Manufacturing— Continued
(Percent distribution of plant workers in establishments having formal provisions 1 for late-shift operations( July 1962 through June 1963)
57
Percent o f manufacturing plant w orkers
Shift operation and shift North Central West
Chicago Cleveland
Colum bus
D avenport- Rock Island—
MolineDetroit Green
BayMilwau
keeMinneapolis— St. Paul
St. Iou is Toledo W aterloo Wichita
LosAngeles—
Lona Beach
SaltLakeCity
SanD iego
SanF ra n cisco -
OaklandSeattle Spokane
Total plant w orkers in manufacturingestablishm ents-------------------------------------------------- 1 0 0 . 0 1 0 0 . 0 1 0 0 . 0 1 0 0 . 0 1 0 0 . 0 1 0 0 . 0 1 0 0 . 0 1 0 0 . 0 1 0 0 . 0 1 0 0 . 0 1 0 0 . 0 1 0 0 . 0 1 0 0 . 0 1 0 0 . 0 1 0 0 . 0 1 0 0 . 0 1 0 0 . 0 1 0 0 . 0
Second shiftPlant w orkers in establishm ents:
With provisions for second shift—---------------- 92.6 94.5 90.3 96.5 99 .4 95.5 93. 1 93. 1 94.7 9 2 . 8 97. 3 97 .5 9 2 . 0 84.7 95.2 95.7 97.0 95.5With shift pay d ifferen tia l----------------------- 91.7 91.9 89.6 93.6 99 .4 92 .4 9 2 . 6 92.0 94.7 92. 3 97. 3 94.6 92 .0 77.7 94 .4 95.7 97.0 95.5
Uniform cents (per h ou r)-------- ----------- 51. 1 58.7 54.6 71.2 28.9 88.3 69.7 70.4 53. 2 83.8 96 .4 91 .8 67 .8 60 .5 8 8 . 0 52.2 78.6 93.8Under 5 cents — — — — — — - - - 1.3 - - 4 .2 .5 . 8 - - - - . 6 - - - 2 . 0 .5 and under 6 cents------------------------- 6 . 1 5.7 4 .3 3.7 2 . 2 4. 3 5.2 6 . 6 1 2 . 6 11 .9 s 4 .9 3 .3 6 . 0 17.4 1 . 2 4 .5 5. 1 1 2 . 06 and under 7 cents— — — 1.7 . 8 . 8 5 .7 1.4 11 . 1 .9 2 . 2 3.7 7 .5 - - 1 .4 1 1 . 0 - - 2 . 1 4 .07 and under 8 cents- - — -------- 1.7 2 . 0 1.4 1. 5 3 .6 10. 3 5 .4 7 .0 3 .6 33.8 5 .0 4 .4 2 .3 2 . 0 - _ .9 .8 and under 9 cents------ — ------- 8 . 0 14.9 1 1 . 0 1 2 . 6 8 . 8 4. 2 8 .3 5. 1 13. 8 13.2 - 1.7 3 .8 2 .3 - 15.0 1 . 6 45.99 and under 10 ce n ts ------------- ------ 1 . 0 2. 3 3.7 - 1 . 0 - - .4 - . 1 - - . 3 - - . 8 3.6 12.710 and tinder 11 cents— ------- -------- 21.4 18. 1 1 i ; 0 16. 1 5.3 46.0 25. 1 24. 8 9 .5 7. 1 1 2 . 1 17. 1 15.7 25. 1 7 .6 1 2 . 8 4 .6 6 . 011 and under 12 cents--------------------- . 8 1 . 1 1 . 0 - .7 - - 1. 3 . 8 5 .8 - - 1 . 1 2 . 6 - .5 - -12 and under 13 cents--------------------- 4 .4 5.6 18.3 4 .9 2 . 0 . 6 . 0 8 . 3 5. 3 2 .7 30. 5 65.3 28. 3 - 75 .5 . 2 55.8 8 .413 and under 14 cents.-------------------- .5 .9 1.7 22.7 - 2 . 1 6 . 2 5 .5 - - 43 .0 - .9 - - - - -14 and under 15 cents------------------- - 1 . 1 .9 - 1.5 1.5 - 5 .4 - - - - - . 6 - 2. 5 7 .9 - 3. 315 and tinder 16 cents----- -------------- 2.7 4 .0 . 2 .3 2 . 1 4. 1 3 .8 . 8 3.9 - - - 5 .2 - 1 . 1 4. 1 .4 -16 cents and o v e r — ___— — — - 1 . 8 2. 5 - - .4 2 . 0 2.7 7 .5 - 1 . 6 1 . 0 - 1 . 6 - - 6 .4 2 . 6 1.5
Uniform percen tage ----------------------------- 35.8 29. 7 27.6 1 . 8 6 8 . 0 4. 1 21 .4 20. 5 37.9 7 .7 .9 - 1 2 . 8 13. 3 - 14.0 - -Under 5 p ercen t------------------------------ - 1 . 2 - - - - - - - - - - - - - - - -5 p ercen t— — — — - — — — - 4 .6 15.9 9 .8 - 64 .4 - 12.4 1 . 8 9 .0 7 .7 .9 - 4. 2 1 0 . 2 - 7 .0 - -O ver 5 and tinder 10 percent— ------ 1.7 2 .5 - 1 . 8 .5 - 8 .3 15.5 16.4 - - - 3 .4 - - - - -10 percent — — — — — — — . 28.8 9 .6 17.8 - 3. 1 4. 1 .7 3 .2 12. 5 - - - 5 .2 3.2 - 7 .0 - -O ver 10 and tinder 15 p ercen t------- .4 - - - - - - - - - - - - - - - - -15 percent and over - — — — i—
O ther1 2 .........................................................3 . 6 - - - - - - - - - - - - - - - -
4 .7 3 .5 7 .4 20. 5 2 .5 . 1.5 1 . 0 3.6 . 8 - 2 . 8 11.4 3.9 6 .4 29 .5 18.4 1.7With no shift pay d ifferen tia l____________ .9 2 . 6 . 6 2 .9 - 3. 1 .5 1 . 0 - .5 - 2 . 8 - 7 .0 . 8 - - -
With no provisions fo r second shift 7 .4 5 .5 9.7 3 .5 . 6 4 .5 6 .9 6 .9 5. 3 7 .2 2 .7 2 .5 8 . 0 15.3 4. 8 4. 3 3.0 4 .5Third shift
Plant w orkers in establishm ents:With provisions fo r third sh ift--------------------- 79.7 84.8 85.5 89.0 98 .4 8 6 . 8 86.5 83. 2 91. 3 8 8 . 8 91.7 94. 1 81. 1 6 8 . 6 91.6 88 .4 92. 8 8 6 . 0
With shift pay d ifferen tia l---- — 78.8 84.2 84.9 89.0 98 .4 8 6 . 8 86 .4 83.2 91 .3 8 8 . 8 91 .7 94. 1 81. 1 65 .3 9 1 . 6 88 .4 92.8 8 6 . 0Uniform cents (per hour) . . . - ------ 43 .2 51.8 34.2 64. 8 28.7 82.2 56 .8 62 .4 47. 1 78. 5 90 .8 16. 5 25.3 53.0 1 2 . 1 33.7 20.7 83.7
Under 7 cents — — — _ ----- .5 .7 1 . 2 . 8 .4 4. 2 .3 2 . 6 . 5 5 .5 - - 1 . 6 3.3 - 2 .7 5. 2 8 .57 and tinder 8 cents------------------------- . 6 . 2 2 .4 . . 8 - - 1 .5 - 1 2 . 8 - - .5 - - - . 6 -8 and under 9 cents____—_____—____ . 6 .9 6 . 1 1.9 2 . 0 - . 6 - .7 3 .7 - - - - - . 2 1 . 6 -9 and tinder 10 c e n ts ______________ - 1 . 0 .4 5 .7 1 . 2 _ .7 - . 8 5 .6 - - - . - - - -10 and under 11 cents______________ 9 .4 1 0 . 6 5.8 9 .7 7. 1 42.9 9 .7 9. 1 17.7 29.9 6 . 6 4 .7 7 .2 2 . 0 3 .2 1.7 2 . 1 4 .811 and tinder 12 cents— -------- ------ . 2 . 6 - . 6 _ - 1 .4 1.9 1.5 - - - - . - - - .12 and tinder 13 cents--------------------- 1 2 . 2 18.9 15.7 16.6 6 . 6 15. 5 5 .4 17. 1 15.2 7 .0 35.0 9 .6 3.0 1 1 . 0 2 . 0 8 . 2 3.9 53.513 and tinder 14 cents — — 1 . 2 _ - 2 . 1 - 4 .9 8 . 0 1 . 2 - 5 .8 - - . 2 - - .3 - -14 and tinder 15 cents--------------------- 1 . 6 .3 - 1.5 1.5 2. 3 2 .5 2. 5 - - - - - - - - - 3 .815 and tinder 16 cents— — ----- 11.4 10.4 1.4 2. 3 4 .0 6 . 2 15.8 14.8 2. 3 1.5 6 .3 .4 5. 1 2 1 . 2 3. 1 9 .5 7. 1 8 .916 and tinder 17 cents— ------- - 1.7 2 . 6 1.7 . 3 .2 2 . 0 - 2 .4 3. 1 4 .0 - 1 .7 1.5 2 .3 - 6 .5 - -17 and under 20 cents— — 1.5 2 .9 - 22.7 . - 6 .9 - 3 .4 1 . 2 43.0 - 1.5 13. 1 1. 1 - - 2 .720 cents and over — — —________ 2.3 2 .5 - . 8 2 . 1 4. 1 5.6 9. 3 1.9 1 . 6 - - 4 .7 - 2 . 6 4 .7 .3 1. 5
Uniform percen tage---------------------------- 28.4 26.9 26.3 1 . 8 66.3 2 .7 21 .4 19.8 22.5 8 .5 .9 - 6 .9 12.3 - 7 .5 - -Under 7 p ercen t- - — ------- - .3 .9 1 . 8 - - - - - - - - - - - - - - -7 and tinder 10 percent - — 1 . 1 3. 3 - 1. 8 2.7 - 8 .3 . 8 . 2 - - - - - - - - -10 percent- — — — . — 22. 5 22.7 24.6 - 63.2 2 .7 13. 1 2 .3 17.6 8 .5 .9 - 6 . 6 9.1 - 3 .4 - -O ver 10 and tinder 15 p ercen t------- 1 .4 - - - - - - 16.7 2 . 1 - - - - - - - - -15 percent — — - — — - _ 3 .2 - - - .3 - - - 2 . 6 - - - .3 3 .2 - 4. 1 - -O ver 15 p ercen t___________________ - - - - - - - - - - - - - - - - - -
O ther2 ------ — — — — — 7.2 5. 5 24.4 22.4 3 .4 2 . 0 8 . 2 1 . 0 21.7 1.7 - 77.6 48 .9 - 79.5 47 .3 72.0 2. 3With no shift pay d ifferen tia l____________ .9 . 6 . 6 - _ . . 1 - - - - - - 3 .3 - - - -
With no provisions fo r third sh ift__________ 20.3 15.2 14.5 1 1 . 0 1 . 6 13,2 13.5 16. 8 8 .7 1 1 . 2 8 . 3 5 .9 18.9 31.4 8 .4 1 1 . 6 7 .2 14.0
1 Includes establishm ents currently operating late shifts, and establishments with form al provisions covering late shifts even though they w ere not currently operating late shifts.2 Pay at regular rate fo r m ore hours than worked, a paid lunch period not given to first-sh ift w orkers, a flat sum per shift, and other provisions. Most "other" w orkers, however, w ere in establishments
which provided 1 such prov ision in com bination with a cents or percentage differential for hours actually worked.
Digitized for FRASER http://fraser.stlouisfed.org/ Federal Reserve Bank of St. Louis

58
Table B-ll. Shift Differential Practices—Manufacturing
(Percent distribution of plant workers actually working on late shifts* July 1962 through June 1963)
Percent of manufacturing plant w orkers
Northeast South
Shift operation and shift pay differential
Boston Buffalo B urlington
Manchester
NewYork
Philadelphia
P ittsburgh
P ro v idence—Pawtucket
T renton
Baltim ore
Chattanooga Dallas Fort
WorthJackson
ville
LittleR ock -NorthLittleR ock
L ou isv ille
NewOrleans
N orfolk—P o r ts mouth
andNewportNews—
Hampton
OklahomaCity
SanAntonio
Washington
Total plant w orkers in manufacturing1 0 0 . 0establishm ents. _ 1 00 .0 1 00 .0 1 0 0 . 0 1 0 0 .0 1 00 .0 1 0 0 .0 1 0 0 .0 1 0 0 .0 1 0 0 .0 1 0 0 . 0 1 00 .0 1 0 0 .0 1 00 .0 1 00 .0 1 0 0 .0 1 0 0 . 0 1 0 0 . 0 1 0 0 .0 1 0 0 .0 1 0 0 .0
Actually working on:
12.7 20.7 12.9 8.4 12.1 16.9 23.3 14.8 13.7 17.1 2 2 . 2 10.7 15.4 18.4 1 0 .6 17.1 16.4 17.2 15.7 10.5 14.4With shift pay d ifferentia l. _ 12.3 20.7 8.4 4.2 1 2 .0 16.7 23.1 9.5 13.4 15.9 15.5 9.8 14.0 12 .6 10.4 16.5 13.4 16.7 15.1 6.3 13.5
Uniform cents (per hour) ---- — 6.7 1 1 .2 3.2 3.7 8 .6 10.4 21.4 7.2 9.3 10.3 10.7 9.4 13.6 12 .6 8 .0 1 1 .2 13.0 3.5 8.4 6.3 8.4- .2 _ - .2 .3 .5 1.9 - .2 - .2 .1 - - - - .7 .1 .2 -
5 anil under £> cen ts... 1.5 .2 2 .6 2.9 .5 1.6 .3 .9 3.7 1.0 .4 1.6 .9 7.1 3.4 3.0 1 .6 .6 1.3 2.3 2 .16 and under 7 cents «■. .6 .6 _ _ .1 .7 1.4 1.3 1.3 1 .2 1.4 .1 .8 - .2 .3 2.4 .2 - .1 -7 and under 8 cents _ .6 .3 .2 _ .6 1 .2 .6 1.1 1.7 - 1.9 1.8 1 .0 2.3 2 .2 1.3 1.3 .2 .3 - .5
.3 5.5 - - .2 2 .2 16.3 .6 1.4 6.7 5.5 .5 .4 1.4 .5 .8 3.6 .3 - - -9 and under 10 cents .3 .4 - - - .9 .4 - .4 .2 - - - .5 - - - - - - -
1.7 1.6 - .1 1.8 2 .6 .8 .8 .5 .6 1.0 3.4 1.1 1.3 - 3.8 2 .8 .3 4.2 2 .6 .211 and under 12 cents - .7 . - .2 .4 - - - - - - - - - - - - - .5 -12 and under 13 cents . . . . . . .1 .7 _ _ - .2 .8 .3 .3 . 1 .2 1.0 6 .0 - 1.6 .6 1.1 .8 1.1 - ( l )13 and under 14 c e n ts _ _ _ .8 .2 - - .3 .2 - - - .3 .4 - .7 - - .8 - .3 1.4 - .714 and under 15 cents-------------- ------ - C) - - .1 - .3 - - - - .2 - - - - - - - .5 1.115 and under 16 cents .5 .6 - - .5 - - .2 - - - .3 2 .6 - - .5 - - - - .516 cents and o v e r--- ------------- ------ .3 .2 .5 .7 4.1 .1 - - - - - .2 - - - - .1 - - - 3.3
3.7 8 .8 5.2 .4 2 .8 5.1 1.7 1.8 4.1 4.5 3.4 .5 .5 - 2.4 4.2 .4 13.2 6.7 - .8Under 5 p ercen t.. _ _ - ( l ) - - - - - - - - - - - - - - .4 - - - -5 parr an» ______ T — . ___ .4 6 .2 - .3 .4 .4 .2 .2 .6 .5 1.5 .2 (1) - - .3 - .3 - - -Over 5 and under 10 percents. .9 .2 .2 - .3 1.1 . 1 - - .9 - - - - - .9 - 13.0 - - -10 percents. _ 2 .2 2.3 5.0 .1 1.4 3.3 1.3 1.6 3.1 3.1 1.9 .3 .4 - 2.4 3.0 - - 6.7 - .8O ver 10 and under 15 p e r c e n t s . .2 - - - .1 .2 - - - - - - - - - - - - - - -15 percent and o v er_______________
O theri __- - - - .7 (M - - .4 - - - - - - - - - - - -
1.9 .7 - - .5 1.2 - .5 - 1.1 1.5 - - - - 1.1 - - - - 4.3With no shift pay d ifferentia l. _ .4 (*> 4.4 4.2 .1 .2 .2 5.4 .3 1.1 6 .6 .9 1.4 5.8 .2 .6 3.0 .5 .6 4.2 .9
Third sh ift. . ------- ------------- - 2.7 8 .2 4.4 3.4 2.7 7.2 13.8 7.3 4.2 8.4 1 1 .2 4.1 3.2 9.3 1.6 4.7 5.2 5.8 1.3 1.5 4.9With shift pay differential----------------------- 2.7 8 .2 4.1 3.4 2.7 7.1 13.8 6.4 4.2 8 .2 9.8 4.1 2 .8 8.5 1.4 4.6 5.1 5.7 1.2 .8 4.7
Uniform cents (per hour) _ 1.5 6 .2 2.4 3.4 1.6 4.8 13.3 5.5 3.0 6.5 7.3 3.9 1.1 8.5 .7 3.7 5.0 1.9 1.1 .8 2.9Under 7 rents . ( ! ) .5 - .2 .1 .1 .7 - - 3.1 .3 .2 .9 - . 1 - .6 .2 - -7 and under 8 cents .2 (*) 2 .8 _ .2 .2 2.7 .6 .2 - .6 .2 2.4 - - .2 - .2 .38 and under 9 cents <I> .1 - - - ( ' ) .4 .6 .9 (M .1 - C) 1.8 C) - - - - -
( ' ) .1 - - - .5 .6 - - .2 . 1 - - - - - .3 - - - -10 and under 11 cents .8 .6 1.9 .5 .5 1.4 .8 .9 .8 .3 .5 1.0 .3 .9 .2 .6 .3 .5 .5 .1 .1
(*).7 - - - ( l ) .1 - .1 .3 .2 - - - - - 1 .0 - - - -
12 and tinder 13 rents------------ ----- 4.0 . _ .4 1.4 11.1 .4 .4 5.0 1 .2 .2 .1 2.3 .5 .4 2.4 .3 .1 - .213 and under 14 cents .1 - _ - .1 - - (X) - .2 .1 - - - .2 - - .2 - -14 and under 15 cents .1 - - - .1 .1 ( ' ) - .1 .1 .5 - - - - .3 - - - - -15 and tinder 16 cents.. .2 .2 - - .2 .2 .2 .2 n 1.4 1.0 - .1 - .9 .4 .1 (l ) .4 .116 and tinder 17 cents - - - - .1 .6 (M - - . i - .3 - - .3 .7 .2 - - -17 and tinder 20 cents . . . . .2 _ _ .2 .1 - - - - - - - - - .5 - .1 - - -20 cents and over . _ .1 _ . (l ) - - (l ) - .2 - .6 (*) - - .5 - - - - 2.3
Uniform percentage ____ _ .7 1.4 1.7 .1 .4 1.7 .5 .9 .7 1.7 2.3 .1 - - .7 .4 - 3.8 .1 - .2Under 7 percent .1 - - - (l ) .1
(*).1 - - ( l ) - - - - - - - - - -
7 and under 10 percent _ .1 (*> - - - .1 - .4 (*) .4 - - - - - - 3.8 - - ' -10 percents. — _ .5 1.3 1.7 .1 .1 1.4 .3 .7 .3 1.7 1 .8 .1 - - .7 .4 - ( ' ) .1 - -Over 10 and tinder 15 p ercen t------- (*> - - - - (M - - - - - - - - - - - - - - .215 percent. - - - - .1 - - - - (l ) - - - - - - - - - - -Over IS percent ---- . - - - - .1 (*) - - - - - - - - - - - - - - -
Other 2 .. . .5 .6 - - .7 .7 - (*) .4 - .2 . 1 1.6 - - .5 .2 - - - 1 .6With no shift pay d ifferential-------- ----- .3 ( l > -*1 .9 .2 1.4 .4 .8 .2 .1 (X) (*) .8 . 2
See footnotes at end of table.
Digitized for FRASER http://fraser.stlouisfed.org/ Federal Reserve Bank of St. Louis

Table B-ll. Shift Differential Practices—Manufacturing----Continued
(Percent distribution of piant workers actually working on late shifts, July 1962 through June 1963)
59
Percent o f manufacturing plant w orkers
Shift operation and shift pay differential
North Central West
Chicago C leveland
Columbus
D avenport- Rock Island—
MolineD etroit Green
BayMilwau
keeMinneapolis— St. Paul
St. Louis Toledo W aterloo Wichita
LosA n geles-
Long Beach
SaltLakeCity
SanDiego
banFrancis c o -
OaklandSeattle Spokane
Total plant w ork ers in manufacturingPAtahliAVimAnts 1 0 0 . 0 1 0 0 . 0 1 0 0 . 0 1 0 0 . 0 1 0 0 . 0 1 0 0 . 0 1 0 0 . 0 1 0 0 . 0 1 0 0 . 0 1 0 0 . 0 1 0 0 . 0 1 0 0 . 0 1 0 0 . 0 1 0 0 . 0 1 0 0 . 0 1 0 0 . 0 1 0 0 . 0 1 0 0 . 0
A ctually working on:
Second shift _ _____ _ 18. 5 19.5 18.7 17.6 23.7 2 2 . 6 2 1 . 2 13. 5 19.4 16.4 2 0 . 6 25.7 17.9 20.9 13.5 17.1 2 2 . 6 17.5With shift pay d ifferen tia l_______________ 18.2 19.2 18.6 17.3 23.7 21.9 2 1 . 1 13.4 19.4 16.2 2 0 . 6 25. 1 17.9 1 9 . 2 13.4 17.1 2 2 . 6 17.5
U niform cents (per h ou r)-------------------- 10.4 1 2 . 0 1 2 . 8 1 2 . 6 6 .3 2 1 . 2 14.7 11 . 1 1 1 . 2 16.1 2 0 . 6 24.7 13.3 14.6 12.7 1 0 . 6 20.5 17.5Under 5 ce n ts______________________ - - . 2 - - .7 . l - - - - - . 1 _ . . .3 .5 and under 6 cents------------------------- 1 . 2 . 8 . 8 .5 .4 . 2 1 . 1 . 5 2 .4 3 .4 .7 ^ 3 ^ .7 3 .9 (*) 1 . 0 1. 1 .36 and under 7 cents. . 6 . 2 t1) . 6 .4 2 .5 . 2 .5 . 8 1 . 6 . «.• .4 2 .4 _ .5 _7 and under 8 cents .3 .5 . 2 .5 2 . 6 1 . 2 1 . 8 . 8 4 .8 .9 1 . 0 . 6 _ . _ . 2 _8 and under 9 cents. __ . . 2 . 2 3.2 2 . 2 3. 1 1.9 1 . 2 2 . 1 .5 3 .4 2 . 2 - .3 .7 .3 . 3. 1 .3 11.59 and under 10 cen ts___— ------- ----- .3 .4 . 8 - .3 - - . 1 - _ - - ( ’ ) - - . 2 1 . 0 3. 310 and under 11 cents____ ____ ____ 3.7 3.9 1.9 2 .9 .9 13.1 5. 1 3 .2 2 . 0 1. 5 2 .3 2 .3 2. 5 6 .7 . 5 2 . 6 .9 1 . 011 and under 12 cents_____________ . 2 . 2 .3 - . 1 - - .3 . 2 1 . 6 - - .4 1.3 - . 1 - -12 and under 13 cents_____________ .9 1 . 2 6 . 2 1 . 0 .4 - .9 1 . 0 .4 .9 7 .8 2 0 . 8 6 .4 - 1 0 . 8 (») 15.4 . 213 and under 14 cents------------- ------- . l . 2 .4 3 .5 - - 1.4 1.3 - - 8 . 8 - . l - - - -14 and under 15 e*nta— T— .----------- .3 . 2 _ . 5 . 5 - 1 . 2 _ _ _ . - . 2 . 1. 2 2 . 0 _ .715 and under 16 cents--------------------- .4 . 8 - .4 1 . 0 . 8 .7 . 1 1 . 1 _ - - . 8 _ . 2 .7 _ .16 cents and over ..... . 2 . 5 - - . 1 . l .7 2 . 0 _ . 2 . l - . 5 _ _ .7 . 8 . 6
Uniform percentage 6 . 2 6 .4 5. 1 . 1 1 6 . 6 .7 6 .3 1.9 7 .3 - - - 2 .3 4. 5 - 1 . 2 - -Under 5 p ercen t------------------------------ - .4 - - - - - - - - - - - - - - - -5 percent 1.3 3 .9 .7 - 15.8 - 4 .6 . 1 .9 - - - . 8 4 .2 - .4 - -O ver 5 and under* 10 percent .4 .4 - . 1 . 1 - 1 . 6 1. 1 4 .2 - - - .9 - - - _ -10 percent _ 4 .4 1 . 6 4 .3 - .7 .7 (*) .7 2 . 2 - - - . 6 .3 - . 8 - -O ver 10 and under 15 p ercen t------- (*) - - - - - - - - - - - - - - . -15 percent and over . 1 - _ . _ . . . _ _ _ _ _ _ _ _
O th e r* ___ ________ ________ _ _ 1. 6 .7 . 8 4 .7 .9 - . 1 .3 .9 ( 1) . .4 2 . 2 . 1 .7 5 .3 2 . 1With no shift pay d ifferen tia l. .3 .4 . 1 .3 - .7 . 1 . 2 - .3 - . 6 - 1 . 6 • 1 - - -
Third sh ift ------------------------- . ____ _ _ 5.7 5. 1 4 .2 5 .3 7 .0 13.2 5.3 2 .3 7 .6 5. 1 4 .4 6 . 1 3.7 7 .2 2 .4 4 .6 4 .2 13.3With shift pay differential _ 5.7 5. 1 4 .2 5.3 7 .0 13.2 5.3 2 .3 7 .6 5. 1 4 .4 6 . 1 3.7 6 . 2 2 .4 4 .6 4 .2 13.3
U niform cents (per hour) 3 .7 3.7 2 .5 4 .2 2 .7 13. 1 3.2 2 . 1 5.8 5. 1 4 .4 . 8 1 . 8 6 . 2 .9 4 .0 1 . 6 13.3Under 7 cents 0 . 1 - . 1 (*) . 2 - . . . 5 _ _ . 2 (*) . . . 1 _7 and under 8 cents__ — - . l - n _ . _ . . 6 _ _ (*) _ _ _ _8 and tinder 9 cents------------------------- 1 . l .5 - .3 - , i _ . i _ . _ _ (*) . 2 _Q and under 10 cents _ _ - - ( 1) ( l ) . 1 - ( l ) _ (*) .7 _ _ . _ _ . .10 and under 11 cents_____________ .5 .4 .3 7 .4 10.9 .4 . 2 1. 5 _ _ . 2 .3 . 1 (*) _ _ _11 and under 12 cents___________ _ ( 1) ( ' ) - - - _ ( l ) _ .3 _ _ _ _ _ _ _ _12 and under 13 cents_____________ 1.9 2 . 1 1.4 3.0 . 8 . 6 .4 .7 2.3 1.5 2 .9 . 2 . 6 2 . 2 . 2 1.7 . 2 10.513 and under 14 cents . 1 - - - . .3 .7 _ _ . 8 _ (*) _ _ ( l ) _14 and under 15 cents______ ___,___ . 2 ( ' ) - - .4 . 1 (») . 1 _ _ _ _ _ _ . 215 and under 16 cents .5 .5 . 2 . 1 .3 .7 .9 .5 .3 . 1 _ ( l ) . 1 1 . 2 . 2 .7 1 . 1 2.516 and tinder 17 cents__ ___ . 1 . 2 ( ’ ) - .3 _ . 2 .5 . 6 _ . 3 . 2 .3 « . 8 .17 and under 20 cents . 2 . 1 .3 . _ . 2 _ .7 (») 1. 5 _ . 1 2 .4 . 5 _ _ _20 cents and o v e r --- ------- --------------- (*) . i - - . 1 .3 .4 .4 . 2 . 2 _ .3 _ . 1 . 8 . 1 . 1
U niform percentage _ _ 1.4 1 . 2 . 6 - 4 .2 - 1.4 . 1 . 6 - - - . 1 o -• . 1 - -Under 7 p ercen t___________________ ( 1) . 1 . 1 - - . - - - - - - _ _ . .7 and under 10 percent __ . 1 . 2 - - . 2 - .7 - - - - - - - - _ _ _10 percent__________________________ . 8 .9 . 5 - 4. 1 - .7 ( l ) .5 - - - . 1 - _ - _O ver 10 and under 15 p ercen t____ ( 1) - - - - - - . 1 (*) - - . - - - - _ •15 percent. ____ .3 - - - - - - - - - - (*) ( 1) - . 1 - _O ver 15 p ercen t___________________ - - - - - - - - - - - - - - . .
O th er2 .7 . l 1 . 0 1 . 1 . 1 . 1 . 8 - 1 . 2 - - 5.2 1 . 8 - 1.4 . 6 2.5With no shift pay differential . ___ ( l ) * 1 (*) .9
' '
1 Less than 0. 05 percent.2 Pay at regular rate for m ore hours than worked, a paid lunch period not given to first-sh ift w orkers, a flat sum per shift, and other provisions. Most "other" w ork ers, how ever, w ere in establish
ments which provided 1 such provision in combination with a cents or percentage differential for hours actually worked.
Digitized for FRASER http://fraser.stlouisfed.org/ Federal Reserve Bank of St. Louis

60
Table B-12. Paid Holidays—All Industries
(Percent distribution of office and plant workers by number of paid holidays provided annually. July 1962 through June 1963)
Number o f paid holidays
Northeast South
Boston 1 Buffalo B urlington
Manchester
NewY o r k 1
Philadelphia
P ittsburgh
P rov idence—Pawtucket
T ren ton
Baltim ore 1
Chattanooga 1D allas1 Fort
WorthJackson
ville 1
Little R o ck - North Little R o c k 1
Louis - v ille
NewOrleans
N orfolk—P o rts mouth
andNewport • News— Hampton
OklahomaC ity 1
SanAntonio1
W ashington 1
O ffice workersW orkers in establishments providing
paid holidays_________________________________ 99 99 100 9? 99 100 99 99 100 100 99 99 97 99 99 99 99 97 99 99 99Less than 5 holidays__________ ____________ (2) - 1 (2) (2) - (2) 1 - - 3 . 1 3 1 - 1 <*) 2 1 3 (2)5 holid ays____ , -,___ _______ _____ __ , 1 - (2) (2) - <2) - <2) 16 23 30 37 59 1 5 8 195 holidays plus 1 half day___ ______________ - - - - (2) 2 - (2) 4 - - - 1 - <*> - 17 f )5 holidays plus 2 half days or m o re ----------- - - - - - - - - - 1 - - 1 - - - 1 -6 h olid ays____ ,.,_____________ ______________ 1 14 7 21 g ) 8 12 7 10 10 33 31 42 8 11 39 23 51 52 27 136 holidays plus 1 half day - 1 (*) - (2 2 3 (2) (2) 2 14 5 <2) (2) - 4 1 1 1 1 16 holidays plus 2 half days or m o re _______ (2) 11 1 i ) 2 5 6 2 - 5 3 1 1 20 1 2 15 27 holidays 1 25 36 10 10 19 47 8 23 22 21 19 12 26 23 36 20 29 22 9 197 holidays plus 1 half day_________________ (2) 2 - - 2 6 5 <2) 3 g ) - <*> - - - 2 2 - - 2 37 holidays plus 2 half days or m o r e ----------- 8 - - 1 1 2 1 (2) - 4 - - <2) 2 <2) (2) 1 28 holidays — . ___ 6 15 8 (2) 7 23 16 7 21 29 10 8 5 6 2 8 18 7 12 3 408 holidays plus 1 half day _ — 5 1 1 1 1 3 2 1 10 (2) - - - - - - 2 - - - 68 holidays plus 2 half days or m o r e ----------- 1 2 - - 3 2 - - (2) 2 - - - - - - 4 - - 1 19 holidays __— 9 6 7 11 15 4 3 32 9 6 (2) 1 - 6 - 4 5 <2) - - 69 holidays plus 1 half day------------------ --------- 3 - - - jl 2 - 6 - 3 - - - - - <2) - -9 holidays plus 2 half days or m o re _______ 1 - - - 3 1 - - - - - - - - - - - - -10 holidays _ 17 (2) - 46 5 6 3 15 1 20 - 1 - 13 - 1 - - (2) (2) ■i10 h olid ays plus 1 h a lf day _ 6 - 2 2 1 1 7 - - - - - - - - (2) - !|10 holidays plus 2 half days o r m ore_______ 1 - - <2) 2 - - - - - - - - - - - - - - ;i l11 holidays — __ 36 13 21 6 30 2 (2) 14 7 2 - - - - - - - - - -11 holidays plus 1 half day _ 10 <2) - - 3 1 - - 1 - - - - - - - - - - -11 holidays plus 2 half days or m ore_______ 1 - - 2 - - - - - - - - - - - - - - - -12 holidays or m ore 2 <*) 21 - 12 19 <2) - 8 1 - - - - - - 1 - - - - -
W orkers in establishments providingno paid holidays __ <2) (2) ~ 1 (2) ~ (2) 1 “ ” 1 (2) 3 (2) 1 (2) 1
3 11 1
Plant workersW orkers in establishments providing
paid holidays 98 97 97 98 98 99 98 98 100 96 79 87 89 86 95 99 72 88 8 8 8 6 96Less than 5 holidays 3 - 5 2 (2) 2 1 2 1 1 10 6 10 8 7 2 5 5 5 8 75 holidays ,,,, , ...... .... .. - 1 - 6 - (2) 2 - 1 13 33 29 44 32 2 5 4 7 30 35 holidays plus 1 half day__________________ - - - - <*> - 2 - - - (2) - - - <2) - 2 - 18 -5 holidays plus 2 half days or m ore - - - - - V - - (2) - (2) - - 1 - - - 5 -6 holidays — 6 15 12 26 4 15 16 21 14 16 10 13 23 1 1 21 30 20 26 48 8 236 holidays plus 1 half day__________________ 1 1 5 - <2) 2 <2) 3 - 2 1 (2) 1 - - 4 2 1 0 (2) 16 holidays plus 2 half days or m o r e _______ 1 15 - 3 2 - 11 2 4 3 (2) 1 3 5 2 <2) 27 holid ays___________________________________ 9 31 54 33 28 30 59 * 16 27 40 24 21 14 20 25 42 17 42 23 9 237 holidays plus 1 half day 2 3 - - 1 3 1 - 4 (*) - 1 - - - 1 1 - - 2 17 holidays plus 2 half days or m ore - 6 - - 3 2 1 - 5 - - 6 - - (2) 1 - - - (2)8 holid ays -------------------------------------------------------- ,___ 17 18 4 11 13 31 14 17 28 26 20 7 4 2 9 10 12 6 5 3 338 holidays plus 1 half day . _ 7 (2) - 1 1 1 <2) 1 1 <2) - - - - - - - - - - (2)8 holidays plus 2 half days or m o r e ------------- 1 1 - - 2 2 - 1 (2) - - - - - - (2) - - (2)9 holid ays . _ _ 11 3 10 8 10 5 2 25 4 2 (2) 1 - - - 4 1 (2) - 39 holidays plus 1 half day__________ ________ 4 - - 2 2 - 6 - - - - - - - - - - -9 holidays plus 2 half days or m ore — 1 - - - 2 - - - - - - - - - - - - - - - -10 holidays-. 19 (2) - 7 8 3 2 4 2 5 - - - - - 1 1 - 1 2 -10 holidays plus 1 half day____________. . .__ 7 - <2) 1 <2) - - - - - - - - - - - - - - -10 holidays plus 2 half days or m ore____ . . . 1 - - 1 - - - - - - - - - - - - - - (2)11 h o lid a y s ________________________________________ 8 2 5 - 14 1 1 <2) <2) 1 - - - - - - 1 - - -11 holidays plus 1 half day_______ __________— - - - - 1 - - (2) - - - - - - - - - . -11 holidays plus 2 half days o r m ore - - - - (2) - - - - - - - - - - - - - . .12 h olid ays o r m o r e <2) - 3 - 3 <2) - - 3 - - - - - - - - - - - _
W orkers in establishments providingno paid holidays --------------------------------------------- 2 3 3 2 2 1 2 2 4 21 13 14 5 (2) 28 12 12 14 4
See footnotes at end of table,
Digitized for FRASER http://fraser.stlouisfed.org/ Federal Reserve Bank of St. Louis

(Percent distribution o f office and plant w orkers by number o f paid holidays provided annually, July 1962 through June 1963)
Table-B-12. Paid Holidays—All Industries-----Continued
61
Number o f paid holidaysNorth Central West
Chicago 1C leveland 1
Columbus
D avenport- Rock Island-
MolineD etroit1 Green
BayMilwau
keeMinne - apolis— St. Paul
St. L ou is1 Toledo W aterloo Wichita
LosA n geles-
Long Beach 1
T i l tLakeCity
SanDiego
SanF ran cisco— Oakland 1
Seattle1Spokane
O ffice w orkersW orkers in establishm ents providing
paid holidays — — 99 99 99 99 9? 9? 99 100 99 100 100 100 99 99 100 100 95L ess than 5 holidays 2 0 1 - (2) (2) - (2) ( !) - - 0 1 (2) (2) (2) -5 holidays _ _______ ___ _ - (2) (2) (2) - - - (2) - 1 (2) (2) 1 -5 holidays plus 1 half day - - - - - - - - - - - - - - - - - -5 holidays plus 2 half days or m o r e ___— - - - - - - - - - - - - - - - - - -6 h olid ays___________________________________ 25 30 55 30 20 36 21 38 13 30 11 28 8 2 17 1 1 396 holidays plus 1 half day- 4 2 2 3 3 15 9 6 2 3 1 1 1 - - - (2) -6 holidays plus 2 half days or m ore 9 18 3 1 45 24 20 7 3 27 - (2) 1 - - 1 - 27 holidays 28 28 17 59 14 23 22 23 42 26 46 25 26 13 8 21 42 367 holidays plus 1 half day 3 <2) (2) - 1 - 2 4 2 - - - 5 - - 1 1 -7 holidays plus 2 half days or m ore —— — 4 4 - - 2 - 5 3 2 3 - - 1 - - 5 - (2)8 holidays _ 10 11 18 3 3 (2) 10 9 27 7 41 45 43 71 65 50 52 178 holidays plus 1 half day__________________ (2) - - - (2) 1 5 1 (2) - - 8 3 - 2 - -8 holidays plus 2 half days o r m ore 1 (2) (2) - - 1 2 1 1 - - 1 - 2 1 1 -9 holidays ____ ____ 5 3 4 - 8 - 1 (2) 2 1 1 (2) 2 3 3 9 (2) -9 holidays plus 1 half day - - - - (2) 1 2 - 3 - - - 1 3 2 1 “ “9 holidays plus 2 half days or m o r e _______ - (2) - - 1 - (2) 2 - - - - 1 - - 1 2 -10 holidays __ (2) 1 - - 4 - 5 1 (2) (2) - (2) 1 2 - 1 1 110 holidays plus 1 half day — _ 1 1 - - - - (2) - - - - - - “ - 2 - -10 holidays plus 2 half days o r m ore______ 1 - - - - - - - - - - - ■ “ “ “ “ “11 holidays - __ 8 - - 3 - - - (2) 2 - - - 1 (2) 2 (2) - -11 holidays plus 1 half day — 2 - - - - - - - - - - - - “ 1 - ■11 holidays plus 2 half days or m ore ---------- - - - - - - - - “ ■ - ~ “ “ ~ -12 holidays or m ore _ (2) 1 - - (2) - - - - - - - (2) (2) 2 - •
W orkers in establishm ents providingno paid holidays _ _ (2) (2) 1 (2) (2) (2) (2) (2) " (2) “ " 1 <2) " ~ 5
Plant w orkers
W orkers in establishm ents providingpaid holidays ------- 99 98 89 99 99 96 97 99 99 96 99 97 98 89 93 99 99 98
L ess than 5 holidays 3 4 2 1 - 2 (2) (2) 2 - 3 6 3 (2) 3 6 25 holidays — (*> - 1 1 (2) - - - 1 1 - 1 1 2 - - - -5 holidays plus 1 half day - - - - - - - - - - - - - - - - - -5 holidays plus 2 half days or m ore - - - - - - - - - - - - - - - - -6 holidays 27 23 32 24 26 39 26 37 16 20 11 25 10 4 22 5 5 316 holidays plus 1 half day — 2 1 (2) 2 - 4 (2) 6 (2) 1 2 2 2 - - - (2) -
14 23 6 2 55 15 21 8 5 39 - 1 3 - - 2 - 37 holidays 36 32 27 62 13 37 24 27 49 22 56 23 32 28 12 31 47 507 holidays plus 1 half day 2 1 - - - 1 9 2 - - - 2 - - (2) 1 -7 holidays plus 2 half days o r m ore 3 4 -* - 1 - 5 1 2 2 - - 1 - - 5 - 18 holidays 11 10 16 6 3 2 13 7 16 7 28 40 40 39 58 44 40 128 holidays plus 1 half day - - - - . (2) - (2) 1 - - - - (2) 2 - <*) - -
- - (2) - - - - - - 3 - - - - - (*> - -9 holidays 3 2 2 - <2) - (2) (2) 1 1 2 - 1 11 - 6 - -9 holidays plus 1 half day - - - - - - - 2 - - - - - - - - -
- - - - - - - - - - - - - - - - - -(2) (2) - - (2) - 3 - 1 - - (2) (2) - - 2 - -
10 holidays plus 1 half d a y_________ —_____ - - - <2) - - - - - - - - - - -10 holidays plus 2 half days o r m ore -___ — - - - - - - - - - - - - - - - - - -11 holidays (2) - - - - - - 1 2 - - - - - - - - -11 holidays plus 1 half day - - - - - - - - - - - - - - - - - -11 holidays plus 2 half days o r m ore -----—— - - - - - - - - - - - - - - - - - -12 holidays o r m ore—_______________ _______ - - - - - - - - - - - - - - - - - -
W orkers in establishm ents providingno paid holidays
12 11 1 1 4 3 1 1 4 3 2 11 7 1 (2) 2
1 Exceptions to the standard industry limitations are shown in footnotes 4, 5, 7, and /or 11 to the table in appendix A.2 L ess than 0. 5 percent.
Digitized for FRASER http://fraser.stlouisfed.org/ Federal Reserve Bank of St. Louis

62
Tabic B-12a. Paid Holiday Time—All Industries
(Percent distribution of office and plant workers by sum of full-day and half-day holidays provided annually,1 July 1962 through June 1963)
Total paid holiday time
Northeast South
Boston2 Buffalo Burlington
Manchester
NewYork2
Philadelphia
Pittsburgh
P rov idence—Paw
tucket
Trenton
Baltim ore2
Chattanooga2 Dallas2 Fort
WorthJackson
v ille 2
LittleR o ck -NorthLittleR ock 2
L ou isv ille
NewOrleans
N orfolk—P o rts mouth
andNewportNews—
Hampton
OklahomaC ity2
SanAntonio2
Washington2
O ffice workers
13 days o r m ore ------------------------------------------------ 1 . _ 2 2 _ _ £| - _ _ _ - 1 - _ _ - -I2 V2 days or m o r e ------------------------------------------- 1 - - - 3 3 - - - (*> - - - - - 1 - - - ■ “12 days or m ore ------------------------------------------------ 3 (3) 21 - 15 19 ( !) - 8 1 - - - - - 1 - - - - “11 l/z days or m o r e ------------------------------------------- 12 1 21 - 18 19 (3) - 8 2 - - - - - 1 - - - -11 days or m ore ------------------------------------------------ 50 14 42 6 49 22 (3) 14 15 4 - - - - - 1 ~ - - -I0 V2 days or m o r e ------------------- ----------------------- 56 14 42 8 52 2 2 1 21 15 4 - - - - - 1 (3 ) - - - 110 days or m ore ------------------------------------—---------- 74 14 42 54 59 29 5 36 16 24 - 1 - 13 - 3 (3) - ( !) 59V2 days or m ore---------------------------------------------- 77 15 42 54 61 31 5 42 16 27 - 1 - 13 - 3 1 - ( ! ) (3) 69 days o r m ore —— ------------------------------------------ 86 22 48 65 78 37 8 74 25 35 (!) 2 - 19 - 7 11 ( !) ( ! ) 1 138 V2 days or m ore ---------— ---- ----------------- ---------- 91 24 49 66 80 39 10 74 36 35 (3) 3 - 19 - 7 15 (3 ) (3) 2 19
97 47 57 66 88 64 28 81 58 64 10 11 9 25 2 15 37 8 13 5 6097 49 57 66 90 70 34 81 61 64 10 11 9 25 2 17 42 8 13 7 63
7 days o r m o r e ------------------------------------------------- 99 85 93 77 99 90 85 89 90 87 31 35 22 54 26 54 74 38 36 30 8499 86 93 77 99 92 88 90 90 90 45 40 22 54 26 58 75 39 38 31 8599 99 99 98 99 100 99 96 100 100 79 72 64 62 38 97 98 90 90 59 9899 99 99 98 99 100 99 99 100 100 79 76 64 62 38 98 98 90 90 77 9999 99 99 99 99 100 99 99 100 100 96 98 95 99 98 99 99 95 98 96 9999 99 99 99 99 100 99 99 100 100 96 98 95 99 98 99 99 95 98 97 99
4 days o r m o r e ------- ---------------------- ------- ------------ 99 99 99 99 99 100 99 99 100 100 98 99 96 99 99 99 99 96 98 99 993 V2 days o r m ore------------- —------- ---------------------- 99 99 99 99 99 100 99 99 100 100 98 99 96 99 99 99 99 96 98 99 993 days o r m ore — . ____ ~ — 99 99 100 99 99 100 99 99 100 100 99 99 97 99 99 99 99 96 99 99 992 V2 days o r m ore__ —---- ------- . . .— —— . 99 99 100 99 99 100 99 99 100 100 99 99 97 99 99 99 99 97 99 99 992 days or m o r e __________________ ____ ____ ____ 99 99 100 99 99 100 99 99 100 100 99 99 97 99 99 99 99 97 99 99 991V2 days o r m ore---------------------------— -----------— 99 99 100 99 99 100 99 99 100 100 99 99 97 99 99 99 99 97 99 99 991 day o r m ore _ _____________ ____ ____ 99 99 100 99 99 100 99 99 100 100 99 99 97 99 99 99 99 97 99 99 99lU day o r m ore —— — 99 99 100 99 99 100 99 99 100 100 99 99 97 99 99 99 99 97 99 99 99No paid holidays------------------------------------------------ (3) (3) - 1 (3) - (3) 1 - - 1 (3) 3 (3) 1 (3) 1 3 1 1 1
Total receiving paid holidays--------------------------- 99 99 100 99 99 100 99 99 100 100 99 99 97 99 99 99 99 97 99 99 99
Plant workers
12 days or m ore ---------------------------------- -------- ----- ( ! ) _ 3 _ 4 0 _ _ 3 - - - - - - - - - - - -11V2 days or m o r e _____________________ ____— (3) - 3 - 4 (3) - - 3 (3) - - - - “ ■ ■ " * /3 \11 days or m ore____ ____ ____ _____ - — 9 2 8 1 19 1 1 ( !) 3 1 - - - - 1 - ■ 3IOV2 days o r m ore ------------------------------------------- 17 2 8 1 20 1 1 (3) 3 1 - - - - ■ * - ( )10 day8 o r m ore ------------------------------------------------ 36 2 8 8 30 4 2 4 5 5 - - - - 1 2 ■ 1 2 39 V2 days or m ore---------------------------------------------- 41 2 8 8 32 6 2 10 5 5 - - - - 1 2 ■ 1 2 (3)9 days o r m ore ——--------------------------------—--------- 53 6 18 16 45 13 4 35 10 7 (!) 1 - - 5 4 g ) 1 3 381/j> day8 o r m ore_________ _____— ------------------- 60 8 18 17 46 14 4 36 11 7 (3) 1 - - 5 4 (3) 1 3 3
77 31 22 28 62 46 20 52 44 33 21 8 10 2 9 15 17 6 6 5 377 V2 days o r m ore-______________ ___—_________ 79 34 22 28 62 49 21 52 48 34 21 9 10 2 9 16 20 6 6 7 387 days or m o r e _________________________ ____ — 88 80 76 64 92 81 81 68 85 76 45 34 27 23 35 61 40 50 29 16 626 V2 days o r m ore-______.— — ----------------- ---- 89 81 81 64 92 83 81 71 85 78 45 34 27 23 35 65 42 51 29 17 636 days o r m o r e ____ ____ — ------- — -------— 95 96 92 90 97 97 97 92 99 94 55 47 50 33 57 95 62 78 77 30 865V2 days o r m ore--- --- -------------------------------------- 95 96 92 90 97 97 97 94 99 94 55 48 50 33 57 95 62 80 77 48 865 days o r m ore — „ ---- ------- --------------- ------- 95 97 92 96 97 97 97 96 99 95 68 81 79 77 88 97 68 83 84 78 894 V2 days or m ore__ ______ _____ ____ ______ 95 97 92 96 97 97 97 96 99 95 70 81 79 77 88 97 68 83 84 78 894 days o r m ore „ _______ ___ —___ — ---- 95 97 92 98 98 99 97 97 99 96 70 83 83 78 94 97 68 85 84 83 895llz days or m ore______— — ---- ----------------------- 95 97 92 98 98 99 97 97 99 96 70 84 83 78 94 97 68 85 84 83 893 days o r m o r e ------------------------------------------------- 97 97 97 98 98 99 97 97 99 96 72 86 83 81 94 97 69 86 85 84 892 V2 days o r m ore__ ____ — ------- — — — 97 97 97 98 98 99 97 97 99 96 72 86 83 81 94 97 69 86 85 84 892 days o r m ore ----------------------------— — ------- 97 97 97 98 98 99 97 97 100 96 76 86 84 82 95 99 69 87 86 84 911V2 days o r m ore—--------- -------------- -— - ------- -- 97 97 97 98 98 99 97 97 100 96 76 86 84 82 95 99 69 87 86 84 911 day o r m ore— __ __ ------- — ------------------- 98 97 97 98 98 99 98 98 100 96 79 87 89 86 95 99 72 88 88 86 96V2 day or m ore____ __— — ------- -----— ------- 98 97 97 98 98 99 98 98 100 96 79 87 89 86 95 9? 72 88 88 86 96No paid holidays—---------------------------------------------- 2 3 3 2 2 1 2 2 - 4 21 13 14 5 (3 ) 28 12 12 14 4Total receiving paid holidays--------- ----------- ----- 98 97 97 98 98 99 98 98 100 96 79 87 89 86 95 99 72 88 88 86 96
See footnotes at end of table.
Digitized for FRASER http://fraser.stlouisfed.org/ Federal Reserve Bank of St. Louis
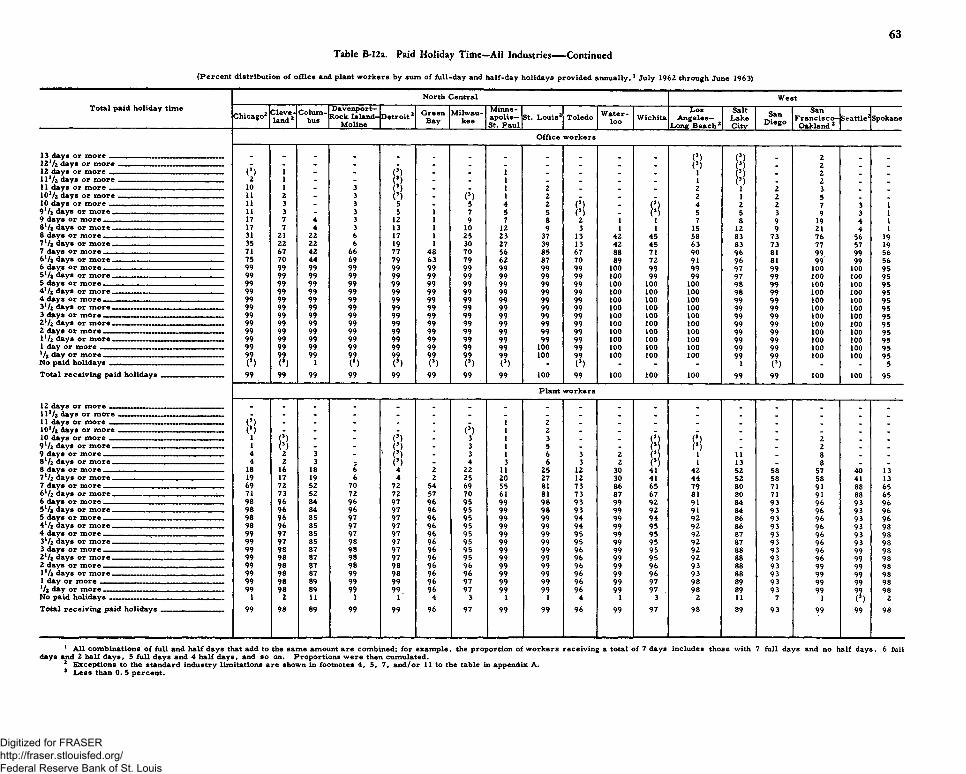
(Percent distribution o f office and plant w orkers by sum of full-day and half-day holidays provided annually,1 July 1962 through June 1963)
Table B>12a. Paid Holiday Tithe—All Industries-----Continued
63
Total paid holiday tim eNorth Central West
Chicago2 C leveland 2
Columbus
D avenport- Rock Island-
MolineD etroit2 Green
BayMilwau
keeMinneapolis— St. Paul
St. Louis2 Toledo W aterloo W ichita
LosA n geles-
Lone B ea ch 2
SaltLakeCitv
SanDiego
SanF ran cisco—
Oakland 2Seattle2Spokane
O ffice w orkers
13 days or m o r e __ . . _ . . . (3) (3) 21 2 */z days or m ore _ - - - - - _ . _ . _ _ . (3) 3 . 2 _12 days or m ore — _ (3) 1 - - (3) . _ 1 _ _ _ _ (3) 2 _ _11 1/t> days or p iore 2 1 - - _ _ 1 . . _ _ 1 (3) _ 2 _ _11 days or morfi T .... 10 1 - 3 (3) . _ 1 2 _ _ _ 2 1 2 3 _ _1 0 Vz days or m o r e ____ ____ ______ __________ _ 11 2 - 3 (3) _ (3) 1 2 . _ _ 2 2 5 _ _10 days or m o r e _________ _____. . . . . _____ -_____ 11 3 - 3 5 _ 5 4 2 (3) . (3) 4 2 2 7 3 19 l / 2 days or m o r e ____ ___. . . . . . . . _______________ 11 3 - 3 5 1 7 5 5 (3) _ (3) 5 5 3 9 3 19 days or m ore , T _ _ 17 7 4 3 12 1 9 7 8 2 1 1 7 8 9 19 4 18 V2 days or m o r e .. 17 7 4 3 13 1 10 12 9 3 1 1 15 12 9 21 4 18 days or m o r e _______ _________________________ 31 21 22 6 17 1 25 23 37 13 42 45 58 83 73 76 56 197 V2 days or m o r e ---------------------------------------------- 35 22 22 6 19 1 30 27 39 13 42 45 63 83 73 77 57 197 days or m o r e --------- ,------------, r--------- . -----------r— 71 67 42 66 77 48 70 56 85 67 88 71 90 96 81 99 99 566 V2 days or m ore 75 70 44 69 79 63 79 62 87 70 89 72 91 96 81 99 99 566 days or m o r e _____ ____________ ______________ 99 99 99 99 99 99 99 99 99 99 100 99 99 97 99 100 100 955 V2 days or m ore 99 99 99 99 99 99 99 99 99 99 100 99 99 97 99 100 100 955 days or m ore ________________ ____ _______ ____ 99 99 99 99 99 99 99 99 99 99 100 100 100 98 99 100 100 954Vz days or m o r e _____ _______ ________________ 99 99 99 99 99 99 99 99 99 99 100 100 100 98 99 100 100 954 days or m ore T .. . 99 99 99 99 99 99 99 99 99 99 100 100 100 99 99 100 100 953l /z days or m ore 99 99 99 99 99 99 99 99 99 99 100 100 100 99 99 100 100 953 days o r m ore 99 99 99 99 99 99 99 99 99 99 100 100 100 99 99 100 100 952 V2 days or m ore «. 99 99 99 99 99 99 99 99 99 99 100 100 100 99 99 100 100 952 days o r m o r e ____ ____ ____— T— ------------------ 99 99 99 99 99 99 99 99 99 99 100 100 100 99 99 100 100 95IV2 days or m o r e ---------------------------------------------- 99 99 99 99 99 99 99 99 99 99 100 100 100 99 99 100 100 951 day or m o r e ------T—r__„-------------- T--------------------- 99 99 99 99 99 99 99 99 100 99 100 100 100 99 99 100 100 95V; day o r m ore 99 99 99 99 9? 99 99 99 100 99 100 100 100 99 99 100 100 95No paid holidays (3) (3) 1 (3) (3) (3) (3) (3) - (3) - - - 1 (3) - - 5Total receiving paid holidays 99 99 99 99 99 99 99 99 100 99 100 100 100 99 99 100 100 95
Plant w orkers
12 days o r m ore _ _ _ _ _ _ _ _ _ _ _ _ _ . _ .1 1 1/2 days or m ore _ __ - - - - - . - _ _ . . _ _ . . _ _ _11 days o r m o r e ________________ _______ _____ 0 - - - . . _ 1 2 _ _ _ _ _ _ _ _ _IOV2 days or m ore . (3) - - - - - (3) 1 2 . - _ _ . _ _ _ _10 days o r m ore _ ___ 1 (3) - - (3) - 3 1 3 . _ (3) (3) . _ 2 _ .9 l / 2 days or m o r e . . _ 1 (3) - - . ( ) - 3 1 5 - - (3) (3) _ . 2 . •• _9 days or m o r e - — 4 2 3 - \ (») - 3 1 6 3 2 (3) 1 11 . 8 _ _al /j days or m ore 4 2 3 - (3) _ 4 3 6 3 2 (3) 1 13 _ 8 _ _8 days o r m ore . . . . 18 16 18 6 4 2 22 11 25 12 30 41 42 52 58 57 40 137V2 days or m ore — ______ 19 17 19 6 4 2 25 20 27 12 30 41 44 52 58 58 41 137 days or m ore — 69 72 52 70 72 54 69 55 81 73 86 65 79 80 71 91 88 656 Vz days or m ore _ __ ______ ^ 71 73 52 72 72 57 70 61 81 73 87 67 81 80 71 91 88 656 days or m o r e __________ _______ _____________ 98 96 84 96 97 96 95 99 98 93 99 92 91 84 93 96 93 965x/z days or m ore _ __ 98 96 84 96 97 96 95 99 98 93 99 92 91 84 93 96 93 965 days or m ore ......T. . 98 96 85 97 97 96 95 99 99 94 99 94 92 86 93 96 93 964 V2 days or m ore — . 98 96 85 97 97 96 95 99 99 94 99 95 92 86 93 96 93 984 days or m ore 99 97 85 97 97 96 95 99 99 95 99 95 92 87 93 96 93 983V2 days or m o r e -------- ^ -----------------------------. ----- 99 97 85 98 97 96 95 99 99 95 99 95 92 87 93 96 93 983 days o r m ore 99 98 87 98 97 96 95 99 99 96 99 95 92 88 93 96 99 982 l /? days or m ore _ .. . 99 98 87 98 97 96 95 99 99 96 99 95 92 88 93 96 99 982 days or m ore 99 98 87 98 98 96 96 99 99 96 99 96 93 88 93 99 99 98l 1/* days or m ore __ _ _ 99 98 87 99 98 96 96 99 99 96 99 96 93 88 . 93 99 99 981 day or m ore 99 98 89 99 99 96 97 99 99 96 99 97 98 89 93 99 99 98*/? day o r m ore 99 98 89 99 99 96 97 99 99 96 99 97 . 98 89 93 99 99 98No paid holidays 1 2 11 1 1 4 3 1 1 4 1 3 2 11 7 (3) 2Total receiving paid h o lid a y s ------ .------------ 99 98 89 99 99 96 97 99 99 96 99 97 98 89 93 99 99 . 98
1 A ll com binations o f full and half days that add to the same amount are combined; for exam ple, the proportion o f w orkers receiving a total o f 7 days includes those with 7 full days and no half days, 6 full days and 2 half days, 5 full days and 4 half days, and so on. Proportions w ere then cumulated.
2 Exceptions to the standard industry limitations are shown in footnotes 4, 5, 7, and /or 11 to the table in appendix A.3 L ess than 0. 5 percent.
Digitized for FRASER http://fraser.stlouisfed.org/ Federal Reserve Bank of St. Louis

64
Table B-13. Paid Holidays—Manufacturing
(Percent distribution of office and plant workers by number of paid holidays provided annually, July 1962 through June 1963)
Number o f paid holidays
Northeast South
Boston Buffalo Burlington
Manchester
NewYork
Philadelphia
P ittsburgh
P rov idence—Pawtucket
T ren ton
Baltim ore
Chattanooga Dallas Fort
WorthJackson
ville
LittleR ock -NorthLittleRock
L ou isv ille
NewOrleans
Norfolk— P orts - mouth
andNewportNews—
Hampton
OklahomaCity
SanAntonio
W ashington
O ffice w orkers
W orkers in establishments providingpaid holidays 100 100 100 100 100 100 100 100 100 100 99 . 99 95 100 99 100 98 100 100 99 97
Less than 5 holidays___________ _______ ____ (*) - - - - - - 1 - - 8 2 2 4 7 <j> - 2 2 9 -5 holidays ____ ______________ - - 1 ( ' ) - - ( ' ) - - 9 18 17 48 39 <*) 3 2 30 -5 holidays plus 1 half day - - - - - - - 4 - - 1 - - - - - - (*) - 17 -5 holidays plus 2 half days or m o r e _______ - - - - - - - - - - - - - - - - - - - 2 -6 holidays n 7 9 50 <’ ) 10 3 12 4 5 20 19 51 29 30 14 21 30 49 2 26 holidays plus 1 half day__________________ 1 ( ' ) - ( ' ) 1 - 1 - 3 4 1 1 1 - 4 *1 1 - - 66 holidays plus 2 half days or m ore i 19 3 1 3 5 - 10 2 - 7 4 - 5 2 25 2 - - 107 holidays _ . . . 3 31 70 27 7 22 58 14 30 40 32 18 4 8 10 51 6 57 32 2 307 holidays plus 1 half day _ _ 1 2 - - 2 8 9 - 5 - - 1 - - - 6 3 - - 11 ( ' )7 holidays plus 2 half days or m o r e _______ - 10 - - 1 2 1 - 2 <*> - - 9 - - (*) 3 1 - 5 -8 h olid ays________________________ ,________ 4 25 7 1 13 37 22 10 33 43 25 31 6 11 9 8 35 4 14 11 438 holidays plus 1 half day---------------------------- 14 ( 1) 1 4 3 1 - 1 14 - - - - - - - - - - -8 holidays plus 2 half days or m o re _______ 2 3 - - 6 3 - - 1 n - - - - - - 1 - - 8 -9 holidays _ 12 2 14 8 j21 4 2 42 1 3 - 3 - - - 11 1 - - - 59 holidays plus 1 half day__________________ 3 - - - j 2 3 - 12 - - - - - - - - 2 - - - -9 holidays plus 2 half days or m o r e _______ 2 - - - 7 - - - - - - - - - - - - - - - -10 hoKday«_. ------------------- ---------------------------- 18 n - 6 11 6 ( l ) 2 2 2 - - - - - 3 - - 1 210 holidays plus 1 half day 5 - - 3 - - - - - - - - - - - 1 - - - -10 holidays plus 2 half days or m ore______ 3 - - - 4 - - - - - - - - - - - - - - - -11 holidays . . . 30 - - - 11 - (*) - - 1 - - - - - - - - - - -11 holidays plus 1 half day 1 - - - 4 - - - 1 - - - - - - - - - - -11 holidays plus 2 half days or m ore--------- - - - - 1 - - - - - - - - - - - - - - - -12 holidays o r m ore ( l ) - - - 4 (*> - - - - - - - - - - - - - - -
W orkers in establishments providingno paid holidays . . . . . " ■ ■ ■ “ " ■ “ 1 (>) 5 ■ 1 " 2 “ 1 3
Plant w orkersW orkers in establishments providing
paid holidays __ 100 98 96 100 100 100 100 99 100 98 76 91 88 87 98 100 62 97 98 82 96Less than 5 holidays . . . . . 1 - - 2 - 1 - 2 - - 12 4 6 13 8 1 - 5 4 9 -5 holidays __ - - - 7 1 - - 2 - ( ' ) 4 26 16 43 27 - 5 1 8 44 -5 holidays plus 1 half day---------------------------- - - - - 1 - - 2 - - - - - - - - - 2 - 8 -5 holidays plus 2 half days or m o r e _____ _ - - - - - - - - - - - - - - - - - - - 2 -6 holidays 4 6 7 28 4 9 8 24 6 4 9 15 31 12 26 17 10 16 44 3 136 holidays plus 1 half day _ 1 1 6 - <*) 2 - 3 - 2 1 1 1 - - 4 4 1 - - <*)6 holidays plus 2 half days or m o r e _____ 1 21 - 4 2 3 2 - 14 3 - 5 6 - 3 4 4 4 - - 107 holidays. . ___ 10 29 66 41 17 33 71 20 28 54 24 23 8 15 18 53 13 66 30 1 287 holidays plus 1 half day 3 4 - - 1 4 1 - 5 - - 2 - - - 2 1 - - 5 -7 holidays plus 2 half days or m ore - 9 - - - 3 1 - 6 - - - 12 - - 1 1 - - - -8 holidays 17 24 5 14 21 33 15 20 34 28 26 14 8 4 17 10 18 2 10 3 378 holidays plus 1 half day 11 ( ' ) - 1 1 1 - 1 n - - - - - - - - - - - -8 holidays plus 2 half days or m ore . . 2 2 - - 5 2 - - 1 ( ' ) - - - - - - - - - 1 -9 holidays 13 2 12 3 16 4 2 18 2 2 - 3 - - - 6 2 - - - 79 holidays plus 1 half Hay. --------- 6 - - - 2 3 - 7 - - - - - . - - - - - - - -9 holidays plus 2 half days or m ore — 1 - - - 5 - - - - - - - - - - - - - - - -10 holidays 15 (*) - - 8 2 - - 2 3 - - - - - 2 3 - 1 6 -10 holidays plus 1 half day_________________ 7 - - 1 - - - - - - - - - - - - - - - -10 holidays plus 2 half days or m ore______ 2 - - - 3 - - - - - - - - - - - - - - - -11 holidays . 6 - - - 7 1 1 - - 1 - - - - - - 2 - - - -11 holidays plus 1 half day_________________ - - - - 1 - - - - - - - - - - - - - - - -11 holidays plus 2 half days or m ore--------- - - - - <*) - - - - - - - - - - - - • - - -12 holidays or m ore .. ___ - - - - 2 - - - - - - - - - - - - - - - -
'W orkers in establishments providingno paid holidays--- --------------------------- -------------- 2 4 1 2 24 9 12 13 2 38 3 2 18 4
See footnote at end of table.
Digitized for FRASER http://fraser.stlouisfed.org/ Federal Reserve Bank of St. Louis

(Percent distribution o f office and plant w orkers by number of paid holidays provided annually, July 1962 through June 1963)
Table B-13. Paid Holidays—Manufacturing----Continued
65
North Central WestNumber o f paid holidays
Chicago C leveland
Columbus
D avenport- Rock Island—
MolineDetroit Green
BayMilwau
keeMinneapolis— St. Paul
St. Louis Toledo W aterloo Wichita
L08A n geles-
Long Beach
SaltLakeCity
SanDiego
SanFrancis c o -
OaklandSeattle Spokane
O ffice w orkersW orkers in establishm ents providing• paid holidays 100 99 100 100 100 100 100 100 100 100 100 100 100 98 100 100 100 100
L ess than 5 holidays - (?) - 2 - 1 <*> - - - - - - - - - - -5 holidays - ( l ) 1 - - - - - - - ( ' ) (*) - 1 - - -5 holidays plus 1 half day__________________ - - - - - - - - - - - - - -5 holidays plus 2 half days or m o r e _______ - - - - - - - - - - - - - - - - -6 holidays 24 11 29 11 8 30 8 32 10 10 3 7 5 2 10 1 1 256 holidays plus 1 half day----------------------------- 7 2 1 2 1 5 ( ' ) 11 1 4 2 1 3 - - - ( l ) -6 holidays plus 2 half days or m ore — 14 30 7 2 77 36 29 7 4 45 - 1 3 - - 2 57 holidays __ _ _ 31 31 26 81 7 28 31 19 52 31 51 29 32 14 7 24 12 487 holidays plus 1 half day__________________ 5 1 1 - (*> - 4 11 4 - - - 3 - - - - -7 holidays plus 2 half days o r m ore 4 6 - - 3 - 9 3 3 6s - - 1 - - 13 - 18 holidays 9 13 34 3 3 ( l ) 14 13 20 3 42 62 53 78 82 47 87 218 holidays plus 1 half day (?) - - - - - 3 - - - - - 1 - ( 1) - -8 holidays plus 2 half days or m o r e _______ ( ' ) - (*) - - - - 1 - 2 - - - - - 1 - -9 h olid ays............. ......................................... 6 4 - 1 - (*) - 2 - 1 - 1 2 - 6 ( l ) -9 holidays plus 1 half day - - - - - - - - - - - - - - - 4 - -9 holidays plus 2 half days or m ore - - - - - - - - - - - - - - - - - -10 holidays - (>) - - - - 4 - (*) 1 - - ( [) - - 1 - -10 holidays plus 1 half day __ __ - - - - - ( l ) - - - - - - - - -10 holidays plus 2 half days o r m ore______ - - - - - - - - - - - - - - - - -11 holidays - - - - - - - 1 3 - - - - 1 - - - -11 holidays plus 1 half day - - - - - - - - - - - - - - - - - -11 holidays plus 2 half days or m ore______ - - - - - - - - - - - - - - - - - -12 holidays or m or« - - - - - - - - - - - - - - - - - -
W orkers in establishm ents providingno paid holidays _ , _ " (>) ■ " ■ “ " “ “ " “ ** 2 " ” "
Plant w orkers
W orkers in establishm ents providingpaid holidays ---- 100 99 95 100 99 99 100 100 99 100 100 100 98 96 99 99 100 100
Lass than *> holidays _ _ - -- (*) 3 - 1 - - 0 ) - - 3 - 1 - - - - - -5 holidays - 1 1 - - - 1 - - 2 1 - - - - -5 holidays plus 1 half day - - - - - - - - - - - - - - - - - -5 holidays plus 2 half days or m ore . - - - - - - - - - - - - - - - - - -6 holidays _ 14 9 26 13 8 32 11 18 9 7 3 9 4 7 15 2 8 21
3 1 - 3 - 5 - 8 ( ‘ ) 1 2 3 3 - - - ( l ) -6 holidays plus 2 half days or m ore 19 33 10 2 76 18 27 13 7 58 - 1 5 - - 3 5
42 32 30 73 9 42 29 27 50 18 59 25 40 42 15 26 30 587 holidays plus 1 half day 2 2 1 - - - 2 17 3 - - - 3 - - - - -7 holidays plus 2 half days or m ore 4 6 - - 2 - 7 2 3 3 - - 1 - - 10 - 28 holidays 12 11 £6 7 3 3 18 13 21 6 34 58 39 42 70 51 62 148 holidays plus 1 half day __ - - - - - - - - - - - - - - - - - -8 holidays plus 2 half days or m ore - - 1 - - - - - - 4 - - - - - 1 - «9 holidays _ 3 2 - - 1 - - - 2 - 2 - 2 4 - 4 - -9 holidays plus 1 half day - - - - - - - - - - - - - - - - - -
- - - - - - - - - - - - - - - - - -10 holidays (*) 1 - - - - 4 - 1 - - - 1 - - 3 - -10 holidays plus 1 half day - - - - - . - (*) - - - - - - - - - -10 holidays plus 2 half days o r m ore______ - - - - - - - - - - - - - - - - -11 holidays 1 - - - - - - 2 3 - - - - - - - -11 holidays plus 1 half d a y_________________ - - - - - - - - - - - - - - - - - -11 holidays plus 2 half days o r m ore__—__ - - - - - - - - - - - - - - - - - -12 holidays or m ore___ - - - - - - - - - - - - - - - - - -
W orkers in establishm ents providingno paid holidays 1 5 1 <l > 2 4 ( l ) (>)
Less than 0. 5 percent.
Digitized for FRASER http://fraser.stlouisfed.org/ Federal Reserve Bank of St. Louis

66
Table B-14. Paid Holidays—Public Utilities1
(Percent distribution of office and plant workers by number of paid holidays provided annually, July 1962 through June 1963)
Number of paid holidays
Northeast South
Boston 2 Buffalo B urlington
Manchester
NewY ork 2
Philadelphia
P ittsburgh
P rov idence—Pawtucket
T renton
Baltim ore 2
Chattanooga2 Dallas Fort
WorthJackson
ville 2
LittleR ock -NorthLittleRock
L ou isv ille
NewOrleans
N orfo lk -P o rts -mouth
andNewportNews—
Hampton
O klahomaCity
SanAntonio2
Washington
O ffice w orkers
W orkers in establishments providingpaid holidays_________ __ _________ 100 99 100 100 100 100 100 100 100 100 100 100 99 100 99 100 100 98 99 100 100
Less than 5 holidays,..^ _ ^ - - - - - - - - . - - . . (3) . . . 1 - - -5 holidays,... __ __ _ - - - - - - - - - - 8 6 24 8 . . . . 3 7 -5 holidays plus 1 half day - - - - - - - - - - - 1 . - - . . . - 6 .5 holidays plus 2 half days or m ore --------- - - . - - - - . . - . 6 . - - . . . . . .6 holidays,, 1 6 4 1 (3) 1 1 - . 3 18 37 14 14 15 23 4 17 25 9 16 holidays plus 1 half day------------- --------- - - - - - - . . . - - - (3) . (3) (3) . . 12 -6 holidays plus 2 half days or m ore.,---------- - - - - (3) (3) 1 - - 3 . 7 . . 26 2 . . -7 holidays___ ___ ___ _ 3 42 - - 15 39 31 6 11 7 69 44 61 78 84 77 46 50 72 63 317 holidays plus 1 half d a y . . . ____ . . . - - - - 1 2 - - - - * - - - - - - . - - (3 )7 holidays plus 2 half days or m ore - 2 - - 1 (3) - - - 1 - - - . . - - . - - -8 holidays___________T___,____________________ 3 - 12 - 10 25 27 2 - 28 - - - - - - 3 27 . 3 668 holidays plus 1 half day_____ - - - - (2) - - - - - - - - - - - . - - - -8 holidays plus 2 half days or m ore------------ - - - - 1 - - - - - - - . - . - 17 . - . 29 holidays,,, ,_______________________ . .____..... 8 24 - 11 8 3 12 9 66 . 6 - . . . . 4 2 _ . .9 holidays plus 1 half day---------------------------- - - - - - 5 - - - - - - - - - . - - - - -10 holidays _ _ _ __ __ __ _ 9 1 - 84 3 18 27 42 . 58 - - . . . . . . . . .10 holidays plus 1 half day_______ _________ 42 - - 4 - 4 2 41 - - - - - - - - - - - - -10 holidays plus 2 half days or m o re --------- - - - - (3) - - - - - - - - - - - . - - - -11 h o l i d a y s . . __________________ 33 24 65 - 53 (3) - . . . - - - - . . . . . - .11 holidays plus 2 half days or m o re --------- - - - - 4 - - - - - - . . . . . . . . .12 holidays or m o re ... _ - - 20 - 3 2 - - 23 (3) - - . - . . . - - . .
W orkers in establishments providingno paid holidays____ ____ --------------------------------- • (3) " - - - - - - - - 1 - 1 “ - 2 1 - -
Plant w orkers
W orkers in establishments providingpaid holidays.,___-,-rr-,-r__, _______ ___ _____ 100 99 100 100 99 100 100 95 100 100 97 99 94 96 97 100 95 86 93 100 99
Less than 5 holidays________________________ 1 . 16 . 1 - - - . . . 6 . 1 7 . 3 3 _ 1 45 holidays____________ ____________________ , - - . - - - 2 . . - 8 7 10 12 . . . . 4 12 _5 holidays plus 1 half day - - - - - - - - - - - 1 - - ‘ - . - - . 4 .5 holidays plus 2 half days or m ore .. - - - - - • - - - - - 2 - - - - - - - . .6 holidays-^,_________ ________________________ 4 1 8 8 3 2 1 . - 4 9 30 10 10 10 46 7 17 31 7 56 holidays plus 1 half day__________ ______ . . - - - - - - - - - - - • - - - . - - . 3 .6 holidays plus 2 half days or more* - - - - (3) - - - - 2 - 7 - - * . (3) 1 . _ _7 holidays___ _______ ___ 20 57 . - 22 40 43 9 29 13 75 46 73 73 80 54 61 37 58 68 337 holidays plus 1 half day__________ ___ - - - - - - 1 - - - - - - - - - - - . _ .8 holidays.,___________________________________ 2 - - - 8 27 27 - - 46 - - - - - - 22 27 . 6 578 holidays plus 1 half day__—. ______ _ _ - - - - . • - - - - - - - - - . . - . . .8 holidays plus 2 half days or m ore________ - - - - - - - - - - - - - - - - <3> - . . .9 holidays ____ __ __ __ __ 10 18 10 31 3 13 8 23 32 - 5 - - - - - (3) . _ .9 holidays plus 1 half day._________________ - - - - - (3) - - - - - - - . - - . . . .10 holidays__________ ,_______________________ 4 1 - 56 4 10 17 63 - 35 - - - . - . (3) - . . .10 holidays plus 1 half day_________________ 36 - - 5 - 4 - - - - - - . - . - - _ _ .11 holidays ____ . . . 21 23 44 - 50 - - - - - - - - - . - - - . . .11 holidays plus 2 half days or m o r e .. .____ - - - - (3) - - - - - - - - - - - - - . . .12 holidays or m ore ____ _. _____ - - 23 - 8 4 - - 39 - - - . . - . . . . . .
W orkers in establishments providingno paid holidays______________________________ (3) 1 5 3 6 4 3 5 14 7 1
See footnotes at end of table.
Digitized for FRASER http://fraser.stlouisfed.org/ Federal Reserve Bank of St. Louis

67
Table B-l4 . Paid Holidays—Public Utilities1— Continued
(Percent distribution o f office and plant w orkers by number o f paid holidays provided annually, July 1962 through June 1963)
Number o f paid holidaysNorth Central West
Chicago 2Cleveland2
Columbus
D avenport- Rock Island-
MolineD etroit2 Green
BayMilwau
keeMinneapolis— St. Paul
St. Louis Toledo W aterloo Wichita
LosA n geles-
Lone B ea ch 2
“ SaltLakeCity
SanDiego
SanFrancis c o -
Oakland 2Seattle2Spokane
O ffice w orkers
W orkers in establishm ents providingpaid holidays -----
L ess than 5 holidays _T _100 100 100 100 100 100 100 99 100 100 100 100 100 100 100 100 100 100
5 holidays - _ . _ _ _ _ _ _ _ 2- - . . _ _ _ _ _ _5 holidays plus 2 half days o r tv>or*__ - - - _ _ _ _ _ _ _6 holidays — - ------ 5 15 12 14 15 31 13 22 11 16 13 42 3 7 3 3
1 - 1 - _ «. _ _“6 holidays plus 2 half days nr m ore _ 5 - - . 1 34 30 _ 1 _ _ _
50 73 57 77 85 35 47 62 63 57 87 52 20 26 4 33 82 551 - - - _ .7 holidays plus 2 half days or m o r e ----------- - - - . . _ _ _ _ 38 holidays - 24 11 - 10 . . 2 7 19 _ 76 74 87 58 15 428 holidays plus 1 half day - - - - - . 10 148 holidays plus 2 half days or m ore nWT. „ - - - - _ _ _ _ _ j
15 - 31 „ _ _ _ 8 2 59 holidays plus 1 half day ... . - - . _ _ . _ 18 _ (3)10 holidays ------------- * - - _ _ _ 610 holidays plus 1 half day _ ... ... _ - - . . _ _ _ _ _ _10 holidays plus 2 half days o r m o re ----- - - . _ _ _ _ _11 holidays . ......... . - - - . _ _ _ _ _ _ _11 holidays plus 2 half days o r m o re ------ - - - _ _ _ _ _ _12 holidays o r m ore .... _--------- ... - - - . _ _ _ _ _
W orkers in establishm ents providingno paid holidays _ _ “ " * - - - (3) - - - - - - - - - -
Plant w orkers
W orkers in establishm ents providingpaid holidays -------
L ess than 5 holidays _ . . .98 97 99 100 100 100 100 100 100 100 96 97 97
2100 95 100 100 100
Q5 holidays - - . . _ _ _ _ _ _ _ _ o5 holidays plus 1 half day—....__r — . - . _ _ _ _ _ _ _ _ _5 holidays plus 2 half days o r m o r e __ - . - _ _ _ _ _ _ _6 holidays _ _ _ ... 20 22 13 17 24 35 41 30 18 18 9 41 3 6 3 3 86 holidays plus 1 half day_ - - (9) - . _6 holidays plus 2 half days o r m ore - - - (3) 24 16 _ _ _ _ _
42 67 78 71 76 41 37 60 52 60 86 50 25 30 17 33 71 677 holidays plus 1 half day---------------- ....------- - - - - . . _ _ _8 holidays8 holidays plus 1 half day
23 8 : n - -6
(9)9
13 14 - - 67 64 75 47 21 258 holidays plus 2 half days or m ore _ . • . . . _ _
13 . 8 . _ _ _ _ 8 179 holidays plus 1 half day ---- . - . . _ _ _ _ 17 _10 holidays _ - - - . _ _ _ „ _ _ 610 holidays plus 1 half day _ _ — . - • . _ _ _ _ _ _11 holidays __ ________ ____ _ ___ - - • . _ _ _ _ _ _11 holidays plus 2 half days o r m o re --------- - - . _ _ _ _ _ _ _ _
- ‘ . . _ _ _ _ _W orkers in establishm ents providing
no paid h o lid ays-------- 2 3 1 4 3 3 5
'
Transportation, com m unication, and other public utilities. Excludes taxicabs, serv ices incidental to water transportation, and m unicipally operated establishm ents. Exceptions to the standard industry limitations are shown in footnote 4 to the table in appendix A .L ess than 0. 5 percent.
Digitized for FRASER http://fraser.stlouisfed.org/ Federal Reserve Bank of St. Louis

68
Table B-15. Paid Holidays—Wholesale Trade
(Percent distribution of office and plant workers by number of paid holidays provided annually, July 1962 through June 1963)
Number of paid holidays
Northeast South North Central West
Boston NewYork
Philadelphia
P ittsburgh
Baltim ore
Washington Chicago Cleve
land DetroitMinneapolis—
St. PaulSt. Louis
LosA n geles-
LongBeach
SanF ran cisco—
Oakland
Office w orkers
W orkers in establishments providingpaid holidays 100 100 100 100 100 100 100 100 100 100 100 100 100
5 holidays - - - - - 4 1 - - - - - -6 holidays __ - - 6 12 5 8 29 47 52 36 28 16 46 holidays plus 1 half day___________________ - - 5 8 11 - 6 5 - 2 8 2 -6 holidays plus 2 half days or m o r e ------------ - (*) 2 13 4 11 21 16 18 14 1 _ -7 holidays — „ - 9 17 31 15 9 19 13 11 20 52 33 21
- 7 6 6 - 7 6 - - - - 6 -7 holidays plus 2 half days or m ore - 4 4 3 3 - 1 - - 4 3 4 48 h olid ays------------------------------------------------ —--- - 7 27 21 27 32 13 18 13 23 8 39 628 holidays plus 1 half day—— — —— — 6 6 8 4 2 2 - - - - - - -8 holidays plus 2 half days or m o r e ________ - 2 4 - - - - - - - - - -9 h o lid ays------------------------------------------------------ 9 17 10 1 3 23 2 - 2 (M _ 2 69 holidays plus 1 half day 3 5 - - - - - - - . 29 holidays plus 2 or m ore half days 2 6 - - - - - - - - _ - -10 holidays — 46 9 11 - 24 3 - - 4 - - (*) 110 holidays plus 1 half day - 5 - - - - - - - - - -10 holidays plus 2 half days or m ore----------- 3 2 - - - - - - - - - - -11 holidays 26 6 - - - - 4 - - _ _ _ _11 holidays plus 1 half day ——— — — — - 5 - - 7 - - _ _ - _ _ _11 holidays plus 2 half days or m ore— — 2 3 - - - - - - - _ _ _ _12 holidays or m ore — 3 7 - . - - - _ _ _ _ _ _
W orkers in establishments providingno paid holidays - " ~ - - " - - - - -
Plant workers
W orkers in establishments providingpaid h olid ays---------------------------------------------------- 100 100 91 100 100 100 100 99 100 98 100 100 100
Less than 5 holidays . — 2 - - - 7 - 1 - - - - - _5 holidays - - - - - 9 2 - - - . _ _5 holidays plus 2 half days or m o r e ________ - - - - 11 - - _ _ - . _ .
- - 2 16 14 18 26 50 66 45 21 9 _6 holidays plus 1 half day - - 6 3 4 - 2 5 - 2 <!> 2 _6 holidays plus 2 half days or m o r e ____—— 3 - 4 8 5 6 32 6 15 14 (*) . _7 h olid ays--------------------------------------------- -------- , - 11 12 35 23 10 18 11 12 22 74 28 4
- 2 1 3 3 1 2 - _ _ _ 5 _7 holidays plus 2 half days or m ore - (*) 5 2 - - 3 - - 1 1 3 28 holidays — - 12 32 27 23 38 9 26 5 10 3 51 738 holidays plus 1 half day 5 1 3 2 2 4 - _ _ _ . _ 28 holidays plus 2 half days or m ore — ——— - (*) - - . - . _ _ - _ _ _9 h olid ays------------------------------------------------------ 11 20 16 3 7 14 3 - <‘ ) 4 _ 2 149 holidays plus 1 half day----------------------------- 1 - - - - - - . - _ _9 holidays plus 2 half days or m ore 4 2 - - - - - - - - - _ _10 holidays----------------------------------------------------- 42 6 10 - . - - - 2 - - (M 410 holidays plus 1 half day - 1 - - - - - - - - - _11 holidays 31 25 - - - - C) - - - _ _11 holidays plus 1 half day - 1 - - 1 - - - - - _ _ _11 holidays plus 2 half days or m ore— — - 2 - - - - - - - - _ _ _12 holidays or m ore - 17 - _ - - - _ . . _ _ _
W orkers in establishments providingno paid holidays 9 2
Less than 0.5 percent.
Digitized for FRASER http://fraser.stlouisfed.org/ Federal Reserve Bank of St. Louis

Table B-16. Paid Holidays—Retail Trade
(Percent distribution of office and plant workers by number of paid holidays provided annually, July 1962 through June 1963)
69
Number o f paid holidays
Northeast South North Central West
Boston NewYork
Philadelphia
P ittsburgh
P rov idence—Pawtucket
B altim ore Dallas New
OrleansWash
ington 1 Chicago C leveland D etroit
Minneapolis— St. Paul
SanFrancis c o -
OaklandSeattle
O ffice w orkers
W orkers in establishm ents providingpaid holidays 98 99 100 99 94 100 98 99 100 99 100 100 100 100 100
Less than 5 h o lid a y s — -------------------T----- - (2) - - - - 3 (2) 1 _ . <2) (2)*» h o lid a y s - - - - - 55 3 1 . . . .6 h olid ays 12 (2) 32 75 4 63 11 52 40 50 64 79 73 _ _6 holidays plus 1 half day------------- ---------- - 2 - - 3 . 5 2 <2) 5 14 9 _6 holidays plus 2 half days o r m o r e ______ - (2) - - - - - 8 2 5 . . 1 .7 holidays __ ___ 3 55 26 22 - 28 29 17 39 44 23 7 11 73 997 holidays plus 1 half day - - 2 10 - 1 . . - - . _ 2 47 holidays plus 2 half days or m ore - 2 - - - _ . . . . 4 _ 38 h o lid ays ._____ - ... -- 36 5 29 2 19 7 . 14 15 1 5 . 13 (2)8 holidays plus 1 half day - 1 2 - - . - _ . . _ . .8 h o lid a y s p lu s 2 h a lf d a y s o r m o r e ... .... - 7 - - - . - . _ . . . . _ _9 h olid ays___ -- - — 18 4 - - 71 . . . 1 . . . . 79 holidays plus 1 half day 2 0 - - - . . . . . . _ _ _9 h o lid a y s p lu s 2 h a lf d a y s o r m o r * ________ (2) (2) - - - . - _ . . . _ . _ _10 h o lid a y s . - _ _ 23 7 - - - - - - - . . . . _ .10 holidays plus 1 half day (2) 5 - - - . . . . . . . . _10 holidays plus 2 half days o r m ore 3 - - - - - - . . _ . _ _11 h o lid a y s _ _ - 7 - - . - . . - . . _ . 2 _11 holidays plus 2 half days o r m ore_____ 5 1 - - - . - . . . . . _ _12 h o lid a y s o r m o r * - (2) - - . . . _ _ _ _ _ _
W orkers in establishm ents providingno paid holidays 2 (2) " (2) 6 - 2 1 “ (2) - - - - -
Plant w orkers
W orkers in establishm ents providingpaid h o lid a y s _ _ 93 98 99 92 n 94 78 81 95 99 98 99 100 100 100
L e s s than 5 h o lid a y s 4 1 6 4 ii _ 8 13 13 1 6 5 2 14 16- - - - - - 61 8 2 _ . . .6 h o lid a y s _ _ _ 10 4 36 58 2 61 2 49 26 76 59 87 72 _6 h o lid a y s p lu s 1 h a lf d ay - . 2 - . 1 . 3 2 _ 7 _ _6 holidays plus 2 half days or m o r e --------- - 2 - - - - - . - . . . 1 _
2 53 18 30 - 14 8 5 19 23 32 7 18 60 847 h o lid a y s p lu s 1 h a lf d ay _ - 2 - - - _ . . . . . . 27 holidays plus 2 half days o r m o r e ______ - 14 - - . - . . . 1 _ . 1 _ _
30 7 34 - 4 17 . 4 31 (2) _ . 22 _8 h o lid a y s p lu s 1 h a lf d a y . - 2 - - - . . . . . . .8 h o lid a y s p lu s 2 h a lf d ays o r m o r e - 2 - - - . - . . . . . . . _
4 2 3 . 75 . . _ 3 . . . _ 2 .4 3 - - . . . . _ _ . _ _
10 h o lid a y s _ ------- _ _ . 39 (2) - - - . - . _ . . . . _ _10 holidays plus 1 half day __ - b - - . . . . . _ _ _ _ _10 holidays plus 2 half days or m ore_____ - 2) - - . . . . _ . . _ _ _
- 6 - - - . - . . . . . . _ _11 holidays plus 1 half day - 1 - - - - - - . . . _ . _ _
W orkers in establishm ents providingno paid h o lid a y s ------ 7 2 1 8 8 6 22 19 5 (2) 2 1
* Exceptions to the standard industry limitations are shown in footnote 5 to the table in appendix A. 2 L ess than 0. 5 percent.
Digitized for FRASER http://fraser.stlouisfed.org/ Federal Reserve Bank of St. Louis

70
(Percent distribution o f o ffice w orkers by number o f paid holidays provided annually, July 1962 through June 1963)
Table B-17. Paid Holidays—Finance1
Number o f paid holidays
Northeast South North Central West
Boston NewY ork
Philadelphia
P ittsburgh
Baltim ore Dallas Wash
ington Chicago C leveland D etroit
Minneapolis— St. Paul
St. LouisLos
A n geles-Long
Beach
SanF ran cisco—
Oakland
O ffice workers
W orkers in establishments providingpaid h olid ays-------,-------------_____ „_____ -_____ 100 100 100 100 100 100 99 100 100 100 100 100 100 100
5 h olid ays------------------------------------------------------ - - - - - 17 - - - - - - - -5 holidays plus 1 half day--------- — — ------ - - - - - 8 - - - - - - - -6 holid ays. . . — . . -------------— - - - 2 3 45 6 15 64 18 39 5 4 (1 2)6 holidays plus 1 half day ------------— - - - 9 - 12 (2) 1 2 9 5 3 - -6 holidays plus 2 half days o r m ore — — - - - 5 (2) 4 - 3 2 4 10 1 - -7 h olid ays------------------------------------- r---------------- - (*) 1 60 1 9 5 10 3 2 14 10 14 37 holidays plus 1 half day—.— — - (*) - - - - - 3 - 4 1 - 9 -7 holidays plus 2 half days or m ore — —— - - (*) 4 - 2 5 6 2 - - - 1 38 holidays - . ---------------- — - — ~ - 1 3 17 2 46 6 1 1 4 69 24 558 holidays plus 1 half day------ . . . — . - - 5 9 - - 11 - - 1 6 3 27 58 holidays plus 2 half days o r m ore —— ------ • 1 1 - - - 1 4 2 - 6 3 2 29 holidays ____ ,_______ 2 13 5 3 16 - 8 3 7 37 - 3 3 149 holidays plus 1 half day --------- — . . 3 1 - - 12 - 3 - - 1 - - 3 19 holidays plus 2 half days o r m ore — ------— - 2 3 - - - - - 2 4 7 - 3 210 holidays— -— — — — . — - ~ 12 (*) - - 42 3 13 (*) 6 19 4 - 3 310 holidays plus 1 half day — ------- — — - 3 <*> - 3 - - - 5 4 - - - - 610 holidays plus 2 half days o r m ore— —— - 1 - - - - - 3 - - 2 - - -11 holidays ----------- - ------- — -------— 52 49 8 - 6 - - 32 - - - 3 5 -11 holidays plus 1 half d a y ------------------ -------- 25 4 3 - - - - 7 - - - - - 211 holidays plus 2 half days o r m ore----------- 1 3 - - - - - - - - - - 2 -12 holidays o r m ore . . . — ------ — 2 24 74 1 3 - - 1 5 1 - - (#) 4
W orkers in establishments providingno paid holidays — — ----------- ------------ — 1
1 Finance, insurance, and real estate.2 L ess than 0. 5 percent.
Digitized for FRASER http://fraser.stlouisfed.org/ Federal Reserve Bank of St. Louis

(Percent distribution of office and plant w orkers by number of paid holidays provided annually, July 1962 through June 1963)
Table B-18. Paid Holidays—Services
71
Number o f paid holidays
Northeast South North Central West Northeast South North Central West
Boston NewYork
Philadelphia Washington Chicago Detroit
LosA n g e les -
LongB each 1
Boston NewYork
Philadelphia Washington Chicago Detroit
LosA n geles-
Long Beach *
O ffice w orkers Plant Workers
W orkers in establishm ents providing99 99 100 100 99 99 100 94 88 84 100 91 85 88
L ess than 5 holidays - - - • g ) . <2) 16 1 - 4 19 15 245 h olid ays-------- ---------------------------- —.................. - - - 1 (2) • (2) - - . 12 • 4 .5 holidays plus 1 half day—..........„— ............. — - - - 1 * - - - - - - - - -6 h olid ays__________________ . . . — .................... - 1 1 31 19 53 85 21 13 8 73 46 60 60 346 holidays plus 1 half day—— — — — — - - 21 (2) 3 3 1 - - 3 _ . (2)6 holidays plus 2 half days or m ore - (2) 7 (2) 1 (2) 3 - (2) 3 - 4 2
. 25 4 13 19 3 39 4 39 4 19 3 4 287 holidays plus 1 half day— — — — - 6 28 n (2) - - - (2) 8 1 -
- 7 - i 12 • - - 2 1 3 - -14 14 6 30 7 7 26 16 6 1 10 1 1 2
2 • - 12 - - 9 10 - 1 - . (2)1 3 - - 1 - - . (2) - - .
9 holidays — — — 18 15 3 8 - - • 13 9 (2) . - _9 holidays plus 1 half day— ........... ....... . .......— - (2) * - - - - - 2 - - •9 holidays plus 2 half days or m ore — — - 2 - - - - • - - - - » -
16 10 (2) - - * - 10 13 2 - - * -10 holidays plus 1 half day 3 - • • - - • 2 - - - - •10 holidays plus 2 half days or m ore—— — - (2) . 3 - - - - - ( l ) • . _11 holidays ___ 39 13 ( 2 ) - - • - 10 6 ( 2 ) . -11 holidays plus 1 half day ___-— -____ . . . . ( 2 ) 3 - • 3 - - - g > • - .12 holidays or m ore —— — — 6 1 - - - - - ( 2 ) ( 2 ) - • - -
W orkers in establishm ents providing( 2 ) ( 2 ) ( 2 ) ( 2 ) 6 12 16 9 15 12
E xcludes data for m otion picture production and allied serv ices; data for these industries are included, however, in "a ll industries.' L ess than 0.5 percent.
Digitized for FRASER http://fraser.stlouisfed.org/ Federal Reserve Bank of St. Louis
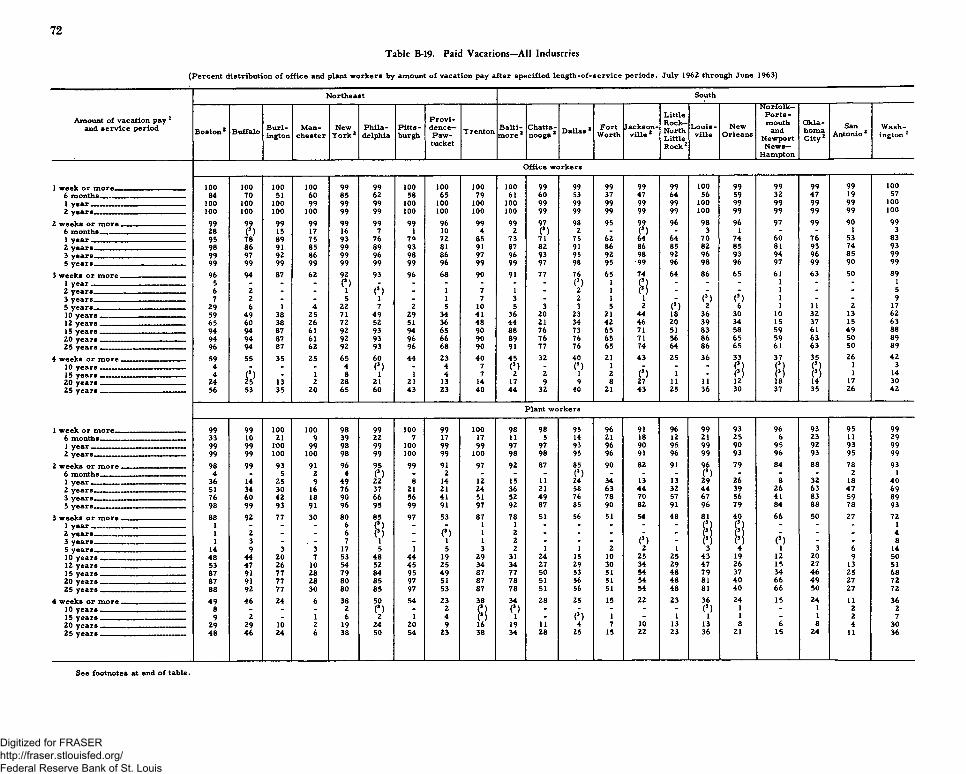
72
Table B-19. Paid Vacations—All Industries
(Percent distribution of office and plant workers by amount of vacation pay after specified length-of-service periods, July 1962 through June 1963)
Amount o f vacation pay 1 and serv ice period
Northeast South
Boston 2 Buffalo Burlington
Manchester
NewY o rk 2
Philadelphia
Pittsburgh
P rov idence—Pawtucket
Trenton Baltim o re 2
Chattanooga 2 Dallas 2 Fort
WorthJackson
ville 2
LittleR ock -NorthLittleR ock 2
L ou isv ille
NewOrleans
N orfolk—P o rts mouth
andNewportNews—
Hampton
OklahomaC ity 2
SanAntonio2
Washington 2
O ffice workers
100 100 100 100 99 99 100 100 100 100 99 99 99 99 99 100 99 99 99 99 1006 months . . — 84 70 51 60 85 62 58 65 79 61 60 53 37 47 64 56 59 32 47 19 571 year 100 100 100 99 99 99 100 100 100 100 99 99 99 99 99 100 99 99 99 99 1002 years 100 100 100 100 99 99 100 100 100 100 99 99 99 99 99 100 99 99 99 99 100
2 weeks or m ore ——---------------------- 99 99 99 99 99 99 99 96 99 99 9J 98 95 99 96 98 96 97 99 90 996 months 28 (*) 15 17 16 7 1 10 4 2 (3) 2 - (3) - 3 1 - - 1 31 year 95 78 89 75 93 76 7 0 72 85 73 71 75 62 64 64 70 74 60 76 53 832 years 98 86 91 85 99 89 93 81 91 87 82 91 86 86 85 82 85 81 93 74 933 years 99 97 92 86 99 96 98 86 97 96 93 95 92 98 92 96 93 94 96 85 995 years-------------- ----------------—— 99 99 99 99 99 99 99 96 99 99 97 98 95 99 96 98 96 97 99 90 99
3 weeks or m ore 96 94 87 62 92 93 96 68 90 91 77 76 65 74 64 8 6 65 61 63 50 891 year 5 - - - (S) - - - - - - (3) 1 (3) - - - 1 - - 12 years 6 2 - - 1 (3) - 1 7 1 - 2 1 (3) - - - 1 - ~ 53 years 7 2 - - 5 1 - 1 7 3 - 2 1 1 - (3) (3) 1 - - 95 years 29 6 1 4 22 7 2 5 10 5 3 3 5 2 <3) 2 6 1 11 2 1710 years 59 49 38 25 71 49 29 34 41 36 20 23 21 44 18 36 30 10 32 13 6212 years 65 60 38 26 72 52 51 36 48 44 21 34 42 46 20 39 34 15 37 15 6315 years 94 94 87 61 92 93 94 65 90 88 76 73 65 71 51 83 58 59 61 49 882 0 years 94 94 87 61 92 93 96 66 90 89 76 76 65 71 56 86 65 59 63 50 8925 years 96 94 87 62 92 93 96 68 90 91 77 76 65 74 64 86 65 61 63 50 89
4 weeks or m ore 59 55 35 25 65 60 44 23 40 45 32 40 21 43 25 36 33 37 35 26 4210 years 4 - - - 4 (3) - 4 7 (3) - (3) 1 - - - ( !) i s ! i s !
1 315 years 4 (3) - 1 8 1 4 7 2 2 1 2 <3) 1 - (3) (3) (3) 1 1420 years 24 25 13 2 28 21 21 13 14 17 9 9 8 27 11 11 12 18 14 17 3025 years 56 53 35 20 65 60 43 23 40 44 32 40 21 43 25 36 30 37 35 26 42
Plant w orkers
1 week o r m ore—6 months_____1 y e a r ________2 years—_____
2 weeks or m ore6 months—. ___1 year — — —2 year 8—3 years_______5 years_______
3 weeks o r m ore1 y e a r ________2 year8_______3 years_______5 years— —10 years — ___12 year8 _____15 y e a r s _____20 y e a r s --------25 years —____
4 weeks or m ore10 years -- ■■15 y e a r s _____20 y e a r s --------25 y e a r s _____
99 99 100 100 98 99 100 99 100 98 98 95 96 91 96 99 93 96 93 95 9933 10 21 9 39 22 7 17 17 11 5 14 21 18 12 21 25 6 23 11 2999 99 roo 99 98 99 100 99 99 97 97 93 96 90 95 99 90 95 92 93 9999 99 100 100 98 99 100 99 100 98 98 95 96 91 96 99 93 96 93 95 9998 99 93 91 96 95 99 91 97 92 87 85 90 82 91 96 79 84 88 78 934 - 5 2 4 (3) - 2 - - - (3) - - - (3) - - - 2 1
36 14 25 9 49 22 8 14 12 15 11 24 34 13 13 29 26 8 32 18 4051 34 30 16 76 37 21 21 24 36 21 58 63 44 32 44 39 26 63 47 6976 60 42 18 90 66 56 41 51 52 49 76 78 70 57 67 56 41 83 59 8998 99 93 91 96 95 99 91 97 92 87 85 90 82 91 96 79 84 88 78 9388 92 77 30 80 85 97 53 87 78 51 56 51 54 48 81 40 66 50 27 72
1 _ . _ 6 (3) - - 1 1 - - - - - ( !) (3) - - - 11 2 _ _ 6 (3) _ (3) 1 2 - - - - - ( !) <J - - - 4
3 _ - 7 1 - 1 1 2 - - - <3) - (3) (3) (3) - - 814 9 3 3 17 5 1 5 3 2 1 1 2 2 1 3 4 1 3 6 1448 44 20 7 53 48 44 19 29 31 24 15 10 25 25 43 19 12 20 9 5053 47 26 10 54 52 45 25 34 34 27 29 30 34 29 47 26 15 27 13 5187 91 77 28 79 84 95 49 87 77 50 53 51 54 48 79 37 34 46 25 6887 91 77 28 80 85 97 51 87 78 51 56 51 54 48 81 40 66 49 27 7288 92 77 30 80 85 97 53 87 78 51 56 51 54 48 81 40 66 50 27 7249 46 24 6 38 50 54 23 38 34 28 25 15 22 23 36 24 15 24 11 36
8 _ - _ 2 (3) - 2 (3) (3) - - - - - (3) 1 - 1 2 29 2 _ 1 6 2 1 4 <3) 1 - (3) 1 - 1 1 1 - 1 2 7
29 29 10 2 19 24 20 9 16 19 11 4 7 10 13 13 8 6 8 4 3048 46 24 6 38 50 54 23 38 34 28 25 15 22 23 36 21 15 24 11 36
See footnotes at end of table,
Digitized for FRASER http://fraser.stlouisfed.org/ Federal Reserve Bank of St. Louis

73
Table B-19. Paid Vacations—All Industries-----Continued
(Percent distribution of office and plant workers by amount of vacation pay after specified length-of-service periods, July 1962 through June 1963)
Amount o f vacation pay 1 and serv ice period
Noi-th Central West
C hicago2 Cleveland2 Columbus
Davenport- Rock Island—
MolineD etroit2 Green
BayMilwau
keeMinneapolis— St. Paul
St. L ou is2 Toledo W aterloo Wichita
LosA n geles-
Long Beach 2
SaltLakeCity
SanDiego
SanF ra n cis co -
Oakland 2Seattle 2 Spokane
O ffice w orkers
1 week o r m o r e ------------------------------- 99 100 99 100 99 100 99 99 100 100 100 99 100 100 100 100 100 1006 months 58 58 57 57 76 48 52 52 55 59 36 11 45 36 29 64 30 181 year------------------------------------------- 99 99 99 99 99 100 99 99 100 99 100 99 100 99 100 100 100 1002 y e a rs ---------------------------------------- 99 100 99 100 99 100 99 99 100 100 100 99 100 100 100 100 100 100
2 w eeks or more^ ,. 99 100 99 99 99 99 99 99 100 $9 99 98 99 99 100 100 99 1006 m onths---------------------------------------- 3 (3) - 2 1 . 1 1 2 2 _ _ 1 . 5 7 41 year ______ 73 81 73 77 85 71 55 69 68 75 44 61 78 59 71 81 85 522 years ., „.. 93 93 89 94 96 80 89 88 84 91 89 79 95 86 99 97 96 813 y e a r s . _ 99 98 98 98 99 95 95 99 99 99 92 98 98 97 99 100 99 995 y e a rs . 99 100 99 99 99 99 99 99 100 99 99 98 99 99 100 100 99 100
3 weeks or more.,., 92 92 85 84 95 93 95 95 92 94 95 94 93 83 82 96 52 881 year----------------------------------------------------------- 2 (3) - - - - (?) (?) - - . (3) . . (3) . 42 year s 3 1 - - - - (?) (3) 1 (3) - (?) 1 1 1 1 <3) 43 years . , 4 1 - - 1 - (3) 1 1 2 - (3) 2 1 2 4 1 45 years ----- 8 6 1 <3) 7 1 5 5 7 3 2 3 10 2 11 17 3 1410 y ea rs .. ___________ 54 39 36 44 75 57 49 61 41 62 66 74 44 43 31 56 26 4612 years___________ _________ 60 46 49 48 78 66 56 67 55 68 73 80 62 43 54 59 30 5115 years _________ ____ 91 92 84 84 95 90 93 94 90 94 91 92 92 75 82 95 52 8520 years 92 92 85 84 95 93 93 95 91 94 95 94 93 83 82 96 52 8825 years ______ 92 92 85 84 95 93 95 95 92 94 95 94 93 83 82 96 52 88
4 w eeks or m ore------—rr_.,---------------- 51 42 36 48 31 54 65 60 40 45 66 9 39 36 38 54 32 691 0 ypat c 1 (3> - - 2 - 2 (3> 1 (?) . . 1 2 1 (3) 91 5 yaars 4 - - 3 5 4 2 (3) (3) (3) 2 1 3 3 2 1020 years . ____ _ ._ 21 16 20 13 12 29 25 30 19 20 38 2 15 10 11 16 13 3825 y ea rs .. 51 41 36 48 31 47 64 58 38 45 66 9 33 36 28 44 31 69
Plant w orkers
1 w eek or m o r e ------------------------------- 99 99 97 100 99 99 99 99 99 100 100 99 99 99 99 99 99 1006 months 14 9 13 7 12 11 12 10 12 23 4 40 17 16 9 27 39 81 year. — 99 99 96 97 99 99 99 99 99 98 100 99 99 98 99 99 99 992 years ___ 99 99 97 100 99 99 99 99 99 100 100 99 99 99 99 99 99 100
2 w eeks or m ore 99 99 90 93 99 98 98 99 99 86 99 92 97 95 99 99 99 1006 m onths___ _______ - - (3) - (3) - - (3) (3) - . (3) (3) .1 year 20 15 21 8 9 11 6 15 13 11 1 42 32 25 53 32 44 132 years 55 32 38 23 26 22 28 45 37 31 12 62 74 54 94 83 71 443 y e a r s , s___ _________________ 85 48 58 39 41 43 51 89 75 57 44 89 90 89 99 90 86 985 years . ___ 99 99 90 93 99 98 98 98 99 86 99 92 97 95 99 99 99 100
3 weeks or m ore ---- -------------------- 89 90 77 83 91 87 94 93 91 94 96 45 89 65 78 94 62 881 year ____ _______________ 3 1 (?) - 1 - 1 1 1 (?) _ . 1 - 2 4 2 _2 years 3 2 ( - 1 - 1 1 3 <3> - - 1 2 5 2 _3 y e a rs --------------------------------- ---- 3 2 (3) - 1 - 1 2 5 - 1 2 (3) 2 8 2 _5 y e a rs -----------__________________ 6 10 1 1 7 1 7 7 6 4 - 2 16 5 14 27 3 110 years____ _______________ 50 30 26 16 26 48 42 57 38 38 30 28 52 29 33 76 35 5612 years 56 35 38 23 29 55 49 67 59 43 38 36 69 33 69 78 49 6615 years_____ _ ____ ____ 88 89 76 83 90 86 93 92 90 93 92 45 89 62 78 94 62 8820 years___________ 89 90 77 83 91 86 94 93 90 94 96 45 89 65 78 94 62 8825 years 89 90 77 83 91 87 94 93 91 94 96 45 89 65 78 94 62 88
4 w eeks or m ore _ 46 37 33 49 23 47 64 54 39 40 67 11 26 21 16 53 17 4910 years (3) 1 (?) - 4 - 3 2 2 (3) _ - 2 (*) 1 5 <3)15 years ...... 3 1 (3) - 4 3 5 2 3 2 - (3) 3 (3) 3 8 2 120 years 22 15 21 10 14 32 28 34 24 11 28 5 14 8 7 30 12 1525 years .. , _ _ 46 36 33 49 23 44 64 54 39 40 67 11 26 21 16 53 17 49
Includes payments other than "length of t im e ," such as percentages of annual earnings or flat-sum payments, converted to an equivalent tim e basis ; fo r example, a payment of 2 percent of annual .earnings was considered as 1 w eek 's pay. Periods of service were arbitrarily chosen and do not necessarily re flect the individual provisions for progression s. F or example, the changes in proportions indicated at 10 yea rs ' serv ice include changes occurring between 5 and 10 years. Estimates are cumulative. Thus, the proportion receiving 3 weeks' or m ore pay after 5 years includes those who receive 3 w eeks' or m ore pay after few er years of service.
2 Exceptions to the standard lim itations are shown in footnotes 4, 5, 7, and /or 11 to the table in appendix A.3 L ess than 0.5 percent.
Digitized for FRASER http://fraser.stlouisfed.org/ Federal Reserve Bank of St. Louis

74
Table B-20. Paid Vacations—Manufacturing
(Percent distribution of office and plant workers by amount of vacation pay after specified length-of-service periods, July 1962 through June 1963)
Northeast South
Amount of vacation pay1 and serv ice period Boston Buffalo B url
ingtonMan
chesterNewYork
Philadelphia
P ittsburgh
P rov id en ce - Paw - tucket
Trenton Baltim ore
Chattanooga Dallas F ort
WorthJackson
ville
LittleR o ck -NorthLittleRock
L ou isv ille
NewOrleans
Norfolk—P o rts mouth
andNewport
News—Hampton
OklahomaCity
SanAntonio
Washington
O ffice Workers
1 week or m o re -.-.-----------— ____ — 100 100 100 100 100 100 100 100 100 100 100 99 100 100 100 100 99 99 100 99 1006 months _____ —. . . — 84 76 26 35 83 67 66 49 87 52 55 34 20 45 32 61 62 16 30 12 63
100 100 100 100 100 100 100 100 100 100 100 99 100 99 100 100 99 99 100 99 1002 years———— — — —.. . . . . . 100 100 100 100 100 100 100 100 100 100 100 99 100 100 100 100 99 99 100 99 100
2 weeks or m o r e ................................. 99 99 99 97 99 99 100 92 100 99 96 97 98 97 97 98 96 97 99 96 1006 rarmtha____ _______________ :__ 17 (2) (a) . 3 5 1 3 . . . . - . . 1 1 . . 9 -1 y e a r ................................................. 97 85 85 61 94 89 87 60 91 71 70 74 77 67 57 87 88 80 81 37 842 y ea rs ..— . . . . . . . . . . . 99 90 87 72 99 94 94 67 95 76 87 92 88 81 75 93 93 83 94 74 95
99 95 88 72 99 96 98 75 96 94 91 96 92 94 80 96 94 93 97 81 1005 year s — . — __. . . . . . . — — — 99 99 99 97 99 99 100 92 100 99 96 97 98 97 97 98 96 97 99 96 100
96 97 86 18 89 92 98 60 93 93 65 74 81 66 42 90 71 81 70 50 911 year — 3 - - - 1 - - - - - - - - 6 - - - - - - -2 years 3 - . . 5 . - - 11 2 - - - 6 - - - - . - -3 y e a r s . . . «.—. .——— 3 1 . . 8 2 _ . 11 4 . . . 6 . . . _ . . 295 year s 12 4 2 5 23 8 3 4 13 5 5 3 5 6 . 3 10 2 18 12 4510 year8 — — ——— — — 42 51 16 12 74 59 28 18 50 40 40 25 23 33 35 59 63 18 36 12 8112 yoarc _______________________ 59 67 16 12 75 65 58 20 61 56 43 57 77 44 35 63 65 21 45 26 81
94 97 86 16 88 92 98 53 93 92 64 74 81 66 42 90 71 81 70 44 8994 97 86 16 89 92 98 57 93 93 64 74 81 66 42 90 71 81 70 50 91
25 year s —— — —— — ——— 96 97 86 18 89 92 98 60 93 93 65 74 81 66 42 90 71 81 70 50 9145 53 14 5 58 55 54 11 40 33 38 50 8 16 24 46 14 49 35 9 52
1 . - - 11 (2) - - 11 . - - - - - - 1 - 1 6 -15 years — 1 1 - 4 13 1 1 (2) 11 1 4 - - 2 - - 1 - 1 6 3120 years — 18 32 13 4 37 26 31 1 17 22 20 8 4 6 9 16 11 48 15 6 45
41 53 14 5 58 55 54 11 40 33 38 50 8 16 24 46 14 49 35 9 52
Plant w orkers
1 week or m ore 100 100 100 100 99 100 100 99 100 100 99 97 98 91 96 99 95 96 96 95 976 mr>n»V>a___ ____,___ -------- „r------- 18 5 16 4 30 23 4 10 14 8 4 5 14 8 7 19 19 5 31 9 451 y e a r ---------------- 100 100 100 100 99 99 100 99 100 99 99 96 97 90 . 94 99 92 95 96 94 972 years 100 100 100 100 99 100 100 99 100 100 99 97 98 91 96 99 95 96 96 95 97
2 weeks or m ore ———— — — 98 99 92 91 95 95 99 91 97 96 88 89 92 83 92 97 80 92 90 83 976 iru-m+ha-, ___ __ ________ 1 . - . 3 1 - _ . . . . - - . . - . 4 .1 year 18 8 16 4 43 25 3 7 6 15 13 23 38 5 9 27 10 6 41 20 562 years 27 25 19 7 65 30 5 7 13 25 16 55 56 12 21 43 17 8 55 44 803 y*>a ya . _ ......... . _____________ 64 47 30 7 85 59 42 30 38 41 43 75 69 58 31 61 42 20 86 53 915 years ------------------------------------------------------- 98 99 92 91 95 95 99 91 97 96 88 89 92 83 92 97 80 92 90 83 97
3 weeks or m ore 89 97 85 23 74 84 98 48 90 83 55 62 61 54 44 88 46 86 53 31 871 y e a r ________ „ _____ ____________________ 1 - - . 10 1 . - - 1 - - . - - - (?) - - - 12 years — . . . — — 1 . . . 10 1 - . (?) 2 - - - - - - ? - . - 13 y a a r a ___ ,__________________ ,____________ 1 1 . - 12 2 - - (2) 2 - - - - - - (2) - - - 225 years 6 3 4 2 18 6 1 2 2 2 1 2 3 - 3 3 6 2 5 11 3510 years - ..n _______ _____r ., ,_______ 36 38 15 3 54 44 49 10 23 26 27 17 9 23 32 50 30 10 22 11 7412 years 42 42 23 3 55 50 49 16 27 30 30 39 48 40 32 53 37 11 27 19 7415 years 88 96 85 21 71 84 98 44 90 82 54 61 61 54 44 87 44 28 53 27 8020 years 88 96 85 21 74 84 98 46 90 83 55 62 61 54 44 88 46 86 53 31 8725 years 89 97 85 23 74 84 98 48 90 83 55 62 61 54 44 88 46 86 53 31 87
4 weeks or m ore ——— —— — — 43 46 18 2 33 47 56 14 35 29 30 29 10 13 19 42 27 3 34 10 3710 years — — — . 2 - - - 3 (2) - - (?) - - - - - - 1 3 - 1 6 _15 y e a r s --------------------- r_ ,^ ----------------------- 2 3 - 1 8 2 2 1 (2) 1 - - - - - 2 3 - 1 6 1820 years ___ 18 30 11 1 17 22 17 1 11 18 12 1 6 2 10 14 9 1 12 6 31
years 41 46 18 2 33 47 56 14 35 29 30 29 10 13 19 42 27 3 34 10 37
See footnotes at end of table.
Digitized for FRASER http://fraser.stlouisfed.org/ Federal Reserve Bank of St. Louis

75
Table B-20. Paid Vacations—Manufacturing----Continued
(Percent distribution of office and plant workers by amount of vacation pay after specified length-of-service periods, July 1962 through June 1963)
Amount o f vacation p a y 1 and serv ice period
North Central West
Chicago C leveland Columbus
Davenport- Rock Island—
MolineD etroit Green
BayMilwau
keeMinneapolis— St. Paul
St. Louis Toledo W aterloo WichitaLos
A n geles-Long
Beach
SaltLakeCity
SanDiego
SanF ra n cis co -
OaklandSeattle Spokane
O ffice workers
1 week o r m ore . . — 100 100 99 100 100 100 100 100 100 100 100 100 100 100 100 100 100 1006 months- 62 70 41 74 91 48 50 66 57 76 44 1 31 28 9 63 8 101 year _ . . . . 100 99 99 99 100 100 100 100 100 100 100 100 100 100 100 100 100 1002 yea rs— - . . — — - 100 100 99 100 100 100 100 100 100 100 100 100 100 100 100 100 100 100
2 weeks or m ore . . . . 100 100 99 99 99 100 99 99 100 100 100 99 98 99 100 100 99 1006 months 8 (2) . 3 (2) - 1 1 2 3 _ . _ . _ _1 y e a r . . 78 91 80 94 95 85 54 81 74 91 45 66 87 79 92 95 94 692 y -------- ----------------- -------------- 95 96 88 97 98 89 86 94 85 97 91 75 95 91 100 100 99 783 y e a rs . . ________ 99 98 96 98 99 91 92 99 98 99 91 99 97 97 100 100 99 995 yea rs---------------------------------------- 100 100 99 99 99 100 99 99 100 100 100 99 98 99 100 100 99 100
3 weeks o r m ore — - ___— 93 95 91 97 98 96 98 96 97 97 99 99 96 93 81 97 15 871 year _____ ._ ____ — 4 (2) . - - - (2) 1 - . . 1 1 . . _ _ _2 years . — — ------- — . 7 1 - - . - (2) 1 2 (2) - 1 2 2 4 1 (2) -3 years ________ . . . » 8 2 - . 1 - (2) 3 2 3 . 1 4 2 5 10 2 .5 y e a rs . ------ . . . . . . . . 11 5 3 . 2 2 6 12 9 4 . 4 10 3 9 15 4 3010 y e a r s -------- ----- . . — . 59 37 24 55 80 59 41 79 50 67 80 95 44 76 16 84 12 7912 y e a r s ______________________^ 65 48 55 61 83 69 53 79 79 72 83 98 82 76 80 92 14 7915 y e a r s ------- _ ._ _. _____ 93 95 91 97 98 94 98 95 97 97 93 99 96 92 81 97 15 8720 y e a r s -------- . . 93 95 91 97 98 94 98 96 97 97 •99 99 96 93 81 97 15 8725 y e a r s ------------------------------------- 93 95 91 97 98 96 98 96 97 97 99 99 96 93 81 97 15 87
4 weeks or m o r e ___________________ 54 42 28 54 11 67 69 60 51 41 75 2 26 46 3 46 5710 y e a r s ____ ___________________ 3 1 - - (2) - 4 1 3 - - - (2) 2 - (2) (*) _15 y e a r s — . — — 4 1 - - 1 (2) 4 2 5 - 1 - 2 2 2 3 -20 years -________________ _______ 24 17 15 2 4 38 25 49 26 23 40 2 15 3 2 26 3 5025 y e a r s -------------------------------------- 53 41 28 54 11 67 69 60 51 41 75 2 26 46 3 45 6 57
Plant w orkers
1 week o r m ore ------------------------ ------ 100 100 97 100 100 100 100 100 99 100 100 100 100 100 100 100 99 1006 m onths. - . . . . . . 13 6 4 4 6 3 4 8 10 33 4 51 12 19 6 29 55 .1 y e a r . . . — - - — 99 99 97 96 99 100 100 100 99 100 100 100 100 100 100 100 99 1002 yea rs ---------------------------------------- 100 100 97 100 100 100 100 100 99 100 100 100 100 100 100 100 99 100
2 weeks o r m o r e ----------------------------- 98 99 93 94 100 100 99 98 99 Ol i00 97 98 98 100 98 99 1006 months-------------------------------- ----- . - . . - . . . . - . . - . . . _ _1 y e a r ----------------------------------------- 16 12 17 6 5 3 2 9 14 13 i 55 37 40 82 28 56 22 y ea rs— --------------------------- ------- - 45 18 30 9 11 12 12 27 31 18 4 68 68 59 94 71 65 103 years - — — — — 76 30 45 23 20 20 38 81 68 40 39 95 86 84 100 81 80 965 yea rs ---------------------------------------- 98 99 93 94 100 100 99 98 99 81 100 97 98 98 100 98 99 100
3 weeks o r m o r e ----------------- ----------- 93 93 90 92 94 94 97 94 96 99 99 44 90 80 83 96 46 951 y e a r ________________________ —____ 5 2 - . 1 - 1 1 1 1 - - (2) - 3 8 3 -2 y a s y o , ,______________________________ 5 2 - . 1 . 1 1 4 1 - - 2 1 3 11 3 .3 y a a r « ____________________________r. 5 3 - . 1 . 1 3 6 2 . 1 3 1 3 11 3 .5 y<*« •»•«» ---------------- --------------------- 8 5 2 . 2 1 8 10 8 6 . 3 9 6 9 15 4 .10 years — ------ 52 19 18 12 13 54 37 66 39 30 34 32 44 44 17 71 23 8012 years — — — ------------ 56 23 37 20 14 55 45 75 66 35 39 41 69 44 78 76 35 8615 years ■_______________________ 93 93 90 92 94 92 97 92 96 97 95 44 90 76 83 96 46 9520 years . . . . . . . . . . . .. .. .n .. . . . . . . . . . . . 93 93 90 92 94 92 97 94 96 99 99 44 90 80 83 96 46 9525 y e a r s ----------------- — ---------------- 93 93 90 92 94 94 97 94 96 99 99 44 90 80 83 96 46 95
4 weeks o r m o r e ---------—------—---------— 47 35 28 55 8 46 67 49 40 38 74 6 22 22 5 43 8 6310 years ---------------- ,---------- ---- -------------- (2) 1 - - 1 - 5 2 3 1 - - 1 1 - 1 (2) .15 y e a r s „--------------------------------------------- 2 1 . . 1 3 5 3 3 1 - - 2 1 4 2 1 .20 y e a r s ,______________________________ 20 12 15 8 3 35 25 41 23 10 30 6 12 6 4 25 7 8
years 47 33 28 55 8 46 67 49 40 38 74 6 22 22 5 43 8 63
Includes percentage o r fla t-sum type payments converted to equivalent weeks' pay. See footnote 1, table B-19. Less than 0. 5 percent.
Digitized for FRASER http://fraser.stlouisfed.org/ Federal Reserve Bank of St. Louis

76
Table B-21. Paid Vacations—Public Utilities1
(Percent distribution of office and plant workers by amount of vacation pay after specified length-of-service periods, July 1962 through June 1963)
Amount o f vacation pay2 and serv ice period
Northeast South
B oston3 Buffalo B urlington
Manchester
NewY ork 3
Philadelphia
P ittsburgh
P rov id en ce - Paw - tucket
Trenton B altim o re 3
Chattanooga3 Dallas Fort
WorthJackson
ville 3
LittleR ock -NorthLittleRock
Louis - v ille
NewOrleans
Norfolk—P o rts mouth
andNewportNews—
Hampton
OklahomaCity
SanAntonio 3
Washington
O ffice workers
1 week or m ore— 100 100 100 100 100 100 100 100 100 100 100 100 100 100 100 100 100 99 100 100 1006 months 78 39 65 89 79 33 39 55 83 67 26 63 46 29 59 29 55 7 69 66 651 year 100 100 100 100 100 100 100 100 100 100 100 100 100 100 100 100 100 99 99 100 100
2 weeks or m o r e _________________ 99 100 100 100 100 100 100 100 98 100 100 98 100 100 100 100 100 99 100 99 10011 months __ _ . 43 - 65 58 19 - - 36 - - - - - 1 - - 4 - - - -1 year 86 38 95 90 91 35 37 82 83 65 15 45 19 14 33 7 57 15 74 26 762 years_________________________ 86 56 95 90 94 58 75 90 83 96 34 76 67 50 81 32 77 67 89 81 783 years 97 100 95 94 99 98 95 97 98 99 94 97 97 98 99 99 99 97 100 99 995 years 99 100 100 100 100 100 100 100 98 100 100 98 100 100 100 100 100 99 100 99 100
3 weeks or m o r e ------------------- ------- 97 98 91 97 99 99 99 98 98 97 91 91 93 94 91 98 86 864
95 71 99
2 years - - - - - - - - - - - - - - - - - 4 - -3 y _ ------------------------------ 1 - - - 6 - - - - - - - - - - 1 1 4 - -5 years 3 - - - 25 7 - 4 3 (4) - 1 1 - - 2 13 4 6 i 510 years 37 33 26 30 60 37 37 49 23 4 20 4 2 11 10 12 32 4 11 4 •12 years 39 33 26 36 61 37 38 55 23 11 20 15 3 15 21 15 38 28 18 & ;
97 98 91 97 99 99 99 98 98 97 91 89 93 94 91 98 86 86 79 1 1 91?20 years 97 98 91 97 99 99 99 98 98 97 91 91 93 94 91 98 86 86 94 99
97 98 91 97 99 99 99 98 98 97 91 91 93 94 91 98 86 86 95 994 weeks or m ore --------- 72 57 91 88 76 52 71 79 83 94 31 34 29 37 58 25 56 53 48 45 66
- - - - 2 - - - - - - - - - - - - 3 - - -15 years - 1 - - 9 (4) - - - - - - - - - - - 3 1 - 320 years 23 18 6 5 34 4 8 30 17 7 6 6 1 9 2 4 12 4 6 2 3725 years 72 57 91 88 76 52 71 79 83 94 31 34 29 37 58 25 42 53 48 45 65
Plant workers
1 week or m ore 100 100 100 100 98 100 100 100 100 100 100 100 100 98 100 100 99 95 100 100 1006 months . . . . .. 71 31 44 67 66 31 21 42 71 40 35 56 37 27 18 23 31 2 49 48 501 year _ .. „.... ..... 98 100 100 100 98 100 100 100 100 100 100 100 100 98 100 100 99 95 93 100 1002 years 100 100 100 100 98 100 100 100 100 100 100 100 100 98 100 100 99 95 100 100 100
2 weeks or m ore 100 100 100 100 98 100 100 100 100 100 100 99 100 98 100 100 99 91 100 96 1006 months . ___________ ______ 38 - 44 31 15 - - 24 - - - - - - - 3 - - - _ -1 year 76 32 74 75 77 20 5 59 71 42 6 39 16 13 15 9 41 2 57 17 592 years 78 61 74 75 82 49 55 73 71 88 48 67 46 39 32 29 61 67 68 67 743 years ______ __—___- 92 98 74 79 95 79 91 86 98 98 97 93 92 90 97 91 94 88 100 96 98
100 100 100 100 98 100 100 100 100 100 100 99 100 98 100 100 99 91 100 96 100100 100 83 100 97 100 99 100 100 100 97 90 89 93 88 100 80 76 91 77 97
1 yn ar 1 - - - 5 (4) - - 11 3 - - - - - 3 - - - - -2 y e a r * ...... . .... ... ... 1 - - - 5 4 - - 11 3 - - - - - 3 - - - - -3 years — 6 - - - 5 n - - 11 3 - - - - - 3 1 0 - - -5 years 6 - - - 15 3 - 1 11 3 - (4) 2 - - 3 1 h 5 - 1210 years 38 51 39 34 45 52 31 45 48 22 10 9 5 14 1 14 28 n 6 5 39
47 51 39 65 47 52 35 63 48 31 10 31 10 23 19 27 39 28 20 13 42100 100 83 100 97 100 99 100 100 100 97 87 89 93 88 100 80 76 70 77 97
20 years ___ 100 100 83 100 97 100 99 100 100 100 97 90 89 93 88 100 80 76 84 77 97100 100 83 100 97 100 99 100 100 100 97 90 89 93 88 100 80 76 91 77 9781 71 83 65 74 60 67 85 80 99 48 45 26 40 35 38 62 53 38 42 66
1 - - - 5 - - 4 - 2 - - - - - - - - - - -15 years -------------- 1 1 - - 8 1 - 4 - 2 - - - - - - - - - - 13
31 35 16 13 37 20 22 44 48 30 7 21 5 14 9 12 17 7 12 6 4876 71 83 65 74 58 67 85 80 99 48 45 26 40 35 38 40 53 38 42 66
See footnotes at end of table.
Digitized for FRASER http://fraser.stlouisfed.org/ Federal Reserve Bank of St. Louis

77
Table B-21. Paid Vacations—Public Utilities1-----Continued
(Percent distribution of office and plant workers by amount of vacation pay after specified length-of-service periods* July 1962 through June 1963)
Amount o f vacation pay2 and serv ice period
North Central West
Chicago 3 Cleveland3 Columbus
Davenport- Rock Island—
MolineD etroit3 Green
BayMilwau
keeMinneapolis— St. Paul
St. Louis Toledo W aterloo WichitaLos
A n geles-Long
B each3
SaltLakeCity
SanDiego
SanF ran cisco—
Oakland 3Seattle 3 Spokane
O ffice w orkers
1 w eek or m o re__ 100 100 100 100 100 100 99 99 100 100 100 100 100 100 100 100 100 1006 m onths. __ _ __ _ 28 26 3 13 44 39 30 6 32 6 , - 50 44 41 51 51 50 131 year------------------------------------------- 100 100 100 100 100 100 99 99 100 100 100 100 100 100 100 100 100 100
2 w eeks or m o re .. _. 100 100 100 100 100 100 99 99 100 98 100 100 100 100 100 100 100 1006 m onths_________________________ - - - - - - - - - - - - - _ - . . _1 year____________________________ 52 46 3 15 43 39 30 20 15 25 9 22 14 17 46 27 64 172 years 58 73 59 61 78 61 83 62 59 54 72 88 81 82 98 80 73 603 y e a rs__________________________ 100 98 100 100 100 100 99 99 100 98 100 100 99 99 100 100 98 1005 y e a rs__ . . . 100 100 100 100 100 100 99 99 100 98 100 100 100 100 100 100 100 100
3 w eeks or m ore . _ . _ 98 93 100 98 98 98 96 97 96 96 87 83 99 89 98 100 99 971 year., - 1 - - - - - - - - - - - - - - -2 years - 1 - - - - - - - - - - - - - - - -3 y e a rs__ __ __ __ _ - 1 - - - - - - - - - 1 - - - 5 2 -5 y e a rs__________________________ 1 1 - - 2 - 1 - 3 - - 1 3 - 4 17 5 -10 years_________________________ 14 30 51 38 45 40 45 31 28 31 - 1 29 9 48 43 27 2912 years_________________________ 27 32 60 46 49 63 49 45 32 43 33 5 37 13 49 44 43 4415 years__________________________ 98 93 100 98 98 98 96 97 96 96 87 83 99 89 98 100 99 9720 yea rs .. __ . _____ _. 98 93 100 98 98 98 96 97 96 96 87 83 99 89 98 100 99 9725 yea rs .--- ---------------- ----------------- 98 93 100 98 98 98 96 97 96 96 87 83 99 89 98 100 99 97
4 w eeks or m ore 53 58 82 62 74 66 86 53 52 61 52 36 81 33 93 68 62 7010 years - - - - - - - - - - - - - - - 6 - -15 years (4) - - - 1 - 2 1 1 - - - 1 - - 8 2 -20 years 24 6 8 41 21 23 49 20 27 14 33 1 11 2 7 15 28 4225 years 53 58 82 62 74 32 86 53 52 61 52 36 81 33 93 68 62 70
Plant w ork ers
1 week or m ore ... 98 100 100 100 100 100 100 100 100 100 100 100 100 100 100 100 100 1006 months 2 13 7 6 41 31 19 8 24 5 - 52 38 33 40 60 56 191 year . . . . ____ 98 100 100 100 100 100 100 100 100 100 100 100 100 100 100 100 100 1002 y e a r s . . . ______________ _ . 98 100 100 100 100 100 100 100 100 100 100 100 100 100 100 100 100 100
2 w eeks or m ore 98 100 100 100 100 100 100 100 100 100 100 100 100 100 100 100 100 1006 months _ _ 1 - - - _ 2 1 . - _ 3 . _ _ . _1 year. _ . _ _______ 25 32 8 6 33 31 19 18 12 5 _ 19 18 12 9 48 60 272 y e a r s . . . . . ____ . 49 55 38 50 67 44 64 51 51 49 58 77 67 48 92 93 65 373 y e a r s . . . . _ _____ 98 97 100 100 100 100 100 98 99 99 96 96 98 99 100 100 91 1005 years _ _ 98 100 100 100 100 100 100 100 100 100 100 100 100 100 100 100 100 100
3 w eeks o r m ore . ......... .. _ 98 100 100 100 100 99 100 99 100 98 98 87 98 100 100 100 98 1001 year_____________________ _____ - 2 1 - - - - 2 1 - - - 3 - 5 - - -2 years . . . . _ - 2 1 - - - 2 1 - - - 3 - 5 - - -3 y e a r s . . . ______ - 2 1 - (4) - - 2 1 - - 3 3 - 5 17 0 -5 years _ . ______ 1 2 1 - 1 - 4 2 7 - - 3 5 - 8 23 (4) -10 yea rs_______________ ________ 11 29 34 27 41 30 42 31 31 23 - 7 28 3 54 62 30 1812 yea rs .________ _________ , 36 48 44 36 52 58 60 52 45 . 32 31 17 44 33 59 62 53 4115 years ..... .... _ .. 98 100 100 100 100 99 100 99 100 98 93 87 98 99 100 100 98 10020 years _ ______ 98 100 100 100 100 99 100 99 100 98 98 87 98 100 100 100 98 10025 years _ _ _ _ _ _ _ 98 100 100 100 100 99 100 99 100 98 98 87 98 100 100 100 98 100
4 w e e k s o r m o r e _. _ 63 74 70 52 82 66 80 69 61 58 63 48 79 52 93 90 67 5210 y ea rs .. _____ ________ - - 1 . - - - 2 1 - - _ 3 _ 5 23 _ _15 y e a r s _ „ ^ 2 - 1 _ _ - 15 7 7 . - - 5 _ 5 23 . _20 years . . . _____ 37 26 24 30 30 28 60 38 44 15 31 9 29 19 28 43 39 25
63 74 70 52 82 41 80 69 61 58 63 48 79 52 93 90 67 52
Transportation, com munication, and other public utilities. Excludes taxicabs, serv ices incidental to water transportation, and m unicipally operated establishm ents.2 Includes percentage o r fla t-su m type payments converted to equivalent w eeks' pay. See footnote 1, table B -19.3 Exceptions to the standard industry lim itations are shown in footnote 4 to the table in appendix A.4 L ess than 0.5 percent.
Digitized for FRASER http://fraser.stlouisfed.org/ Federal Reserve Bank of St. Louis

78
Table B-22. Paid Vacations—Wholesale Trade
(Percent distribution of office and plant workers by amount of vacation pay after specified length-of-service periods, July 1962 through June 1963)
Amount o f vacation pay 1 and serv ice period
Northeast South North Central West
Boston NewYork
P h iladelphia
P ittsburgh
Baltim ore
Washington Chicago Cleve
land DetroitMinneapolis— St. Paul
St. LouisLos
A n geles-LongBeach
SanF ran cisco—
Oakland
Office w orkers
1 weftk o r m o r e - — — - 100 100 100 100 100 100 100 100 100 100 100 100 1006 m on th s _ __ _ _________ 78 76 4 4 48 43 59 37 61 38 31 58 37 411 year _ __ 100 100 100 100 100 100 100 100 100 100 100 100 100
2 w e e k s o r m o r e _ _ 98 99 100 100 100 100 100 100 100 100 100 100 1006 m on th s ._ - _ .. __ __ _____ _ 11 4 2 - _ _ _ _ 3 _ _ - -1 year. . __ ____ „ __ __ _ __ 97 95 81 72 85 74 67 72 80 67 66 65 802 y e a r s ._ .... _ __ __ . _ 98 99 85 93 91 91 96 90 98 81 80 99 1003 years __ __ 98 99 94 98 94 100 100 97 100 99 98 100 1005 y e a r s .... __ __ _ 98 99 100 100 100 100 100 100 100 100 100 100 100
3 w ee k s o r m o r e .... ... . 78 81 83 92 85 76 81 87 79 88 74 87 881 year _ __ _ - 1 - - - - - - - - - - -2 years _ _ . — - 1 1 - - - - - - - - 2 -3 years _ _ _ _ _ _ __ - 1 1 - - 2 2 - - - - 2 15 y e a rs ___ _ ___________ __ ___ _____ 10 11 5 - - 8 5 4 7 - - 18 1110 y e a r s __ _ _ . .. 45 62 64 12 62 50 46 45 48 66 20 69 7112 years__ _ _ _ _ _ _ _ _ _ 52 62 65 14 73 51 55 50 64 76 26 75 751 5 y e a r s 77 80 83 92 79 76 77 85 79 85 69 87 8820 y e a r s _____ , ... _ __ 77 81 83 92 79 76 81 85 79 88 74 87 8825 y e a r s 78 81 83 92 85 76 81 87 79 88 74 87 88
4 w ee k s o r m o r e 31 40 56 27 51 40 49 37 35 6 0 20 42 4110 years _ _ _ _ _ _ - (?) 1 - - - - - 1 - > ( 2 ) 115 y e a r s __ _ - (2 ) 2 - - _ 1 - 1 2 _ 5 320 y e a r s 24 21 37 9 44 27 21 22 21 29 9 27 2925 y e a r s . ... _ _ _ _ _ .................. — 31 40 56 27 51 40 49 37 35 60 20 4 2 41
Plant workers
1 w eek o r m o r e .. _._ _ 100 98 92 100 100 100 99 99 100 100 100 100 966 m on th s _ ._ T_ _ 60 64 19 22 20 28 22 25 12 23 20 18 131 y e a r . ... ... _ __ _ . 100 98 92 100 100 100 99 99 100 100 100 100 96
2 w ee k s o r m o r e 96 98 92 97 93 95 99 99 100 100 100 100 966 months ...... .......... .. . . . ________ - 3 5 - - - - - - 2 _ _ _ _1 year. __ __ __ __ __ __ __ ... ..... 76 78 21 42 38 4 4 33 38 30 30 18 31 252 y e a r s _ ...... 85 96 28 56 43 73 66 64 62 6 2 49 93 963 y e a r s .. ___ _ _____ _ , ________ r_ 93 98 o3 89 48 88 92 84 84 94 95 100 965 y e a rs -------------------------------------------------------------------------- 96 98 92 97 93 95 99 99 100 100 100 100 96
3 weeks or m ore____ ____________________________ 85 80 75 93 69 65 88 89 77 97 81 94 961 year______________________________________________ — - 11 - - - - - - - - - - -2 y e a rs _____________________________________________ _ - 11 - - - - - - - - - 1 -3 y e a rs____________________________ _____ _____ - 11 - - - 3 1 - - - - 1 _S y e a r s 3 32 - - - 9 1 4 14 1 _ 26 1610 y e a r s . . . __ __ __. 4 4 69 54 4 0 25 42 52 49 38 63 33 64 8312 y e a r s_______________ _______________ ______________ 63 69 59 49 35 42 65 58 52 79 4 4 66 8515 y M r f i , , , , . , . ,,,__ 1 ..... 84 78 75 93 68 65 88 86 77 95 71 94 9620 years. _ __ ____ . __ _____ ._ 84 80 75 93 68 65 88 86 77 97 81 94 9625 y e a r s _ . 85 80 75 93 69 65 88 89 77 97 81 94 96
4 weeks or m ore__ _ _ _ _ _ _ 21 23 4 8 47 25 34 52 31 42 71 9 38 6910 y e a r s - - - - - - - - 3 - - (1 2) 415 y e a r s . - - 6 - - - 2 - 3 - - (2) 420 y e a r s ......... . , ________________________ 14 16 39 18 18 21 29 21 32 38 3 17 6025 y e a r s __ __ 21 23 48 47 25 34 52 31 4 2 71 9 38 69
1 Includes percentage or flat-sum type payments converted to equivalent w eeks' pay. See footnote 1, table B-19.2 L ess than 0.5 percent.
Digitized for FRASER http://fraser.stlouisfed.org/ Federal Reserve Bank of St. Louis

79
Table B-23. Paid Vacations—Retail Trade
(Percent distribution of office and plant workers by amount of vacation pay after specified length - of - s e r vie e periods* July 1962 through June 1963)±
Amount o f vacation p a y 1 and serv ice period
Northeast South North Central West
Boston NewYork
Philadelphia
P ittsburgh
P rov idence—Pawtucket
Baltim ore Dallas New
OrleansWashing
ton 2 Chicago C leveland Detroit
Minneapolis—
St. Paul
SanFrancis c o -
OaklandSeattle
O ffice w orkers
1 w eek o r m ore 100 100 100 100 100 100 100 100 100 100 100 100 100 100 1006 months 70 62 19 26 71 9 23 37 29 24 16 44 7 17 41 year 100 100 99 100 100 100 100 100 100 100 100 100 100 100 100
2 weeks o r m ore 100 99 100 99 99 97 93 96 99 100 100 100 100 100 1006 month8 - - - - - - - - - - _ _ . . .1 year ------------,-------------------------- 76 63 20 49 61 8 34 54 63 28 24 34 23 42 122 years 100 99 93 95 95 88 88 85 93 99 96 95 83 100 1003 years 100 99 98 98 99 93 93 85 95 100 100 99 100 100 100
100 99 100 99 99 97 93 96 99 100 100 100 100 100 1003 weeks o r m ore 98 87 92 98 53 78 64 29 80 95 88 92 89 93 92
1 year . - - - - - - - - 3 1 - - - - -2 y e a rs . ----- - - - - 12 - - - 8 1 - - - - -3 years - 4 - - 16 - - - 8 1 - - - - -<5 years . _ _ __ _ 55 37 6 1 34 1 1 3 9 4 46 35 4 59 (3)10 years 89 75 88 32 53 50 48 8 66 74 84 76 61 84 9112 years ... ... ... _ 89 76 88 35 53 52 51 28 71 78 84 79 63 84 92IS years _ ------- 98 86 91 98 53 77 58 29 78 94 88 91 89 93 9220 years ... ... - ----- 98 86 91 98 53 78 64 29 80 95 88 92 89 93 922S years 98 87 92 98 53 78 64 29 80 95 88 92 89 93 92
4 weeks o r m ore 79 56 80 55 39 47 49 25 42 79 43 76 66 71 4910 years 43 1 - - 15 - - - 3 - - 20 - -IS years 44 2 - - 15 - 11 - 3 2 - 20 - 6 -20 years 59 25 30 43 29 9 15 8 26 30 16 38 3 24 16
79 56 80 55 39 47 49 25 42 79 43 76 66 70 49
Plant w orkers
1 week o r m ore ... . 100 99 100 100 100 100 100 93 100 99 99 100 100 100 10047 » 49 13 8 47 9 8 37 16 23 11 34 9 9 1
100 99 97 100 100 96 95 86 100 99 99 100 100 100 1002 years 100 99 100 100 100 100 100 93 100 99 99 100 100 100 100
2 weeks o r m ore 98 98 97 95 88 83 84 68 93 99 97 100 100 100 1006 months - 1 - - - _ - . _ _ . _ _1 year 56 54 17 28 41 3 15 37 30 27 11 15 21 28 52 years .. . _ - 90 98 68 67 82 59 69 55 65 90 69 68 85 98 953 years ' 98 98 92 89 88 80 84 55 90 99 96 98 100 100 100S years ---- _ _ _ 98 98 97 95 88 83 84 68 93 99 97 100 100 100 100
91 84 88 92 65 73 43 21 72 88 91 89 88 99 891 y e a r -------------------------------------------------------------- - - - - - . - - 2 - - . _ . _2 years - - - - 4 - - - 8 - - - - - -3 years - 4 - - 6 - - - 10 - - - - - -5 yea rs -------- • 46 23 8 5 30 2 2 8 12 8 44 32 8 63 110 y e a r s _ _ 89 73 72 41 65 59 19 10 59 73 86 78 62 95 8012 y e a r s 89 73 72 43 65 60 24 16 59 79 86 81 67 95 8515 years 89 82 86 89 65 72 34 16 64 87 89 87 88 99 8920 years 89 82 86 92 65 73 43 21 72 88 91 89 88 99 89
91 84 88 92 65 73 43 21 72 88 91 89 88 99 89
4 weeks or m ore 75 54 72> 49 54 40 17 14 35 46 46 73 65 64 2110 years 34 1 - - 17 - . - 2 - - 22 - _15 years 38 4 ■- - 24 _ 2 - 2 5 - 22 - 15 _20 years __ 72 24 37 40 50 23 2 8 31 22 32 55 21 27 132 5 y e a r s 75 54 72 49 54 40 17 14 35 46 46 73 65 64 21
1 Includes percentage o r flat-svim type payments converted to equivalent w eeks' pay. See footnote 1* table B - 19.2 Exceptions to the standard industry limitations are shown in footnote 5 to the table in appendix A.3 Less than 0. 5 percent.
Digitized for FRASER http://fraser.stlouisfed.org/ Federal Reserve Bank of St. Louis

80
Table B-24. Paid Vacations—Finance1
(Percent distribution of office workers by amount of vacation pay after specified length-of-service periods, July 1962 through June 1963)
Amount o f vacation pay 1 2 and serv ice period
Northeast South North Central West
Boston NewYork
Philadelphia
P ittsburgh
Baltim ore Dallas Wash
ington Chicago Cleveland D etroit
Minneapolis— St. Paul
St. LouisLos
A n geles-LongBeach
SanF ran cisco—
Oakland
Office w orkers
Iw e e k o r m n r e 100 99 99 100 100 100 100 99 100 100 99 100 100 1006 months _.i____ _ __ 87 95 93 67 96 71 58 91 52 74 86 73 68 881 year . . . . . . . 100 99 99 100 100 100 100 99 100 100 97 100 100 100
100 99 99 100 100 100 100 •99 100 100 99 100 100 1006 m onths. . . . . . __ 47 31 18 3 9 5 9 2 - 2 2 4 - 181 y e a r . . . . ------ 100 98 98 100 99 100 99 98 96 98 97 97 95 1002 y e a r s . . . . . 100 99 99 100 99 100 100 99 100 100 99 100 100 100
3 weeks or m ore 100 96 97 94 95 82 93 96 97 96 99 94 94 9710 . - - - 1 . - - . - - - -
2 years . . . 12 - - - - 6 3 - - - - 3 - -3 years . . . . . . 12 5 - - - 6 3 - - - - 3 - 35 ..... ..............isr,..,, ■ 50 20 1 - 5 6 13 3 2 11 - 8 6 310 years _ — — 73 76 20 34 26 26 68 61 34 87 55 36 38 3312 years___ _ . . . . . . . . 73 76 20 74 26 26 68 61 38 87 63 36 38 331 *» years 97 96 97 91 86 77 91 96 97 96 97 89 92 9420 years. . . . --------- ---------------- 97 96 97 94 91 82 93 96 97 96 99 89 94 9725 years . . . . _ 100 96 97 94 95 82 93 96 97 96 99 94 94 97
4 weeks or more_ _ _ 75 82 70 15 45 40 22 43 38 52 67 26 48 6115 years . . . . . . ------------ <3) 7 - - 5 1 4 5 - 4 . 1 1 -20 years. . . . . . 25 26 12 6 13 11 14 13 16 16 29 8 17 725 y e a r s . _ . . . 73 82 69 12 43 40 22 43 34 52 61 19 27 35
1 Finance, insurance, and real estate.2 Includes percentage or flat-sum type payments converted to equivalent weeks' pay. See footnote 1, table B-19.3 L ess than 0.5 percent.
Digitized for FRASER http://fraser.stlouisfed.org/ Federal Reserve Bank of St. Louis

81
Table B-25. Paid Vacations—Services
(Percent distribution of office and plant workers by amount of vacation pay after specified length-of-service periods, July 1962 through June 1963)•>
Northeast South North Central West Northeast South North Central West
and serv ice period Boston NewYork
Philadelphia
Washington Chicago Detroit
LosA n geles-
LongB each2
Boston NewYork
Ph ila delphia
Washington Chicago Detroit
LosA n geles-
LongB each2
Office w orkei•s IJlant worker'S
1 w eek or m ore 100 997899
10069
100
10067
100
9966
993 6 93
931693
100 992599
98 97 946 m on th s________ 90100
100551 vear __ 99
7100 98
9 20100 97 94
2 w eeks or m ore __ 9916
995
9816708498
993 99 QQ 99Q
94 84 85 99 97 826 months _ .... 7710
91( 3)206291
1 year 929899
869899
879799
859799
o C - 3366785
1662
-332 years on
8089QO
Z.g 93684
125 vears _
ysJQQ
CTO94
31 5877 77 99 97 82
3 weeks or m ore _ 896
93 76 85 73 7 A 77 56 421
29 40 501 year — f 77 71(?)(?)(3)
2 years _ 6 13 “ - 4 113 years _ 15 2 19
27718385
1434
(3)286074
” ■ 2 - 45 years _ _ . _ _ ... 22 31
639293
40567676
1 A * ■ 3 4 110 years 65 56
7173
an3
217677
■ 6284242
4182329
54015 years _ ___ 88 •7-7 Afi 9
5656
15404025 vears _ _ __ __ ___ 89 77 71 50
f *x 77 71 504 weeks or m o r e . 30 27
642
44514434345
232
151523
33Q
36 1410 years _. r. . nT _ 6lo 5 7 9 2
(?)( 3)
215 years 6 12
1627
232342
7Q ~ 5
101214
I20 years 14
77C 8 “ 2 ■ 9 125 years . T 30 33 16
2 " 9 2 2JO 5 7 9 2 2
* Includes percentage or fla t-sum type payments converted to equivalent w eeks1 pay. See footnote 1, table B-19.Excludes data for m otion picture production and allied serv ices; data for these industries are included, how ever, in "a ll in du stries ." L ess than 0. 5 percent.
Digitized for FRASER http://fraser.stlouisfed.org/ Federal Reserve Bank of St. Louis

82
(Percent distribution o f o ffice and plant w orkers with form al p rov ision s , 1 by type o f plan, July 1962 through June 1963)
Table B-26. Health, Insurance, and Pension Plans—All Industries
Labor market
Insurance plans Sickness and accident insurance a n d /o r s ick leave Rcti rement
ns ion plan No health,
insurance, or pension
plan
LifeAccidental death and dism em berment
H ospitalization Surgical M edical Catastrophe
T ota l2
Sicknessand
accidentinsurance
Sick leave (full pay and
no waiting period)
Sick leave (partial pay
o r waiting period)
pe]
A llplans
Noncontrib
utoryplans
A llplans
Noncontrib
utoryplans
Allplans
Noncontrib
utoryplans
A llplans
Noncontrib
utoryplans
A llplans
Noncontrib
utoryplans
Allplans
Non-contrib
utoryplans
A llplans
N on-con trib
utoryplans
A llplans
Non-con trib
utoryplans
O ffice workers
Northeast
B oston3. 96 56 56 26 89 45 8 8 44 78 35 67 29 85 38 14 74 3 83 58 (4 )Buffalo 96 69 48 29 90 66 88 63 68 52 45 23 86 57 41 70 3 82 65 1Burlington 99 33 73 4 83 17 77 16 65 8 88 32 91 67 15 73 1 86 35 1M anchester 92 74 73 38 83 57 84 59 62 41 57 46 93 46 28 71 (4 ) 65 60 1New Y ork 3 96 62 46 29 82 51 79 46 64 32 62 24 81 28 18 71 3 84 64 1Philadelphia 97 66 38 21 78 48 74 44 58 35 52 26 76 40 24 61 6 84 6 8 1Pittsburgh 97 65 44 30 81 57 79 55 57 41 53 30 87 50 39 70 4 85 64 1Providence—Pawtucket — 83 51 59 36 93 65 92 64 88 62 44 30 66 20 7 56 1 65 58 1Trenton __ 97 61 53 31 8 8 54 87 50 82 48 49 29 89 41 22 77 7 80 56 1
South
Baltim ore 3 97 48 45 22 77 42 79 43 53 30 66 37 84 43 23 53 12 88 6 8 1Chattanooga 3 95 50 46 17 96 56 95 55 76 48 71 43 65 32 16 48 3 75 37 2Dallas 3 98 42 43 14 8 8 30 86 28 63 19 56 16 63 23 8 44 10 75 40 1Fort Worth 96 44 63 22 94 21 94 21 64 1 1 66 12 74 39 7 57 7 68 45 1Jacksonville3 . . . 96 44 46 14 91 30 91 30 73 23 84 34 76 20 8 55 10 78 57 1Little Rock—North Little R ock 3 ---- 91 39 65 13 81 28 79 26 67 22 66 28 65 35 12 42 10 69 41 4Louisville — 92 43 57 23 87 41 85 39 64 32 65 37 73 42 17 47 12 70 46 2New Orleans 95 52 49 22 78 39 76 37 61 30 51 24 55 28 11 25 11 66 39 3Norfolk—Portsmouth and
Newport News—Hampton 94 31 72 14 91 27 90 27 65 27 65 29 66 36 17 47 9 62 30 2Oklahoma C ity 3____________________ 94 28 67 16 77 12 78 14 51 10 57 16 80 33 2 52 14 64 45 2San Antonio3 _ _ ___ 88 35 53 27 89 42 84 41 37 14 54 17 57 11 5 43 7 55 35 4Washington 3__ _ 91 46 50 21 71 28 68 25 47 18 58 25 90 29 14 72 6 79 45 (4 )
North Central
C hicago3 _ _ . __ 96 49 54 20 89 34 89 32 70 26 66 22 81 44 19 48 13 73 45 1C leveland3 _ ___ 97 62 56 30 82 49 80 48 55 37 48 19 71 51 33 43 7 80 6 8 1Columbus----------------------------------------- 93 46 59 17 83 35 82 34 62 18 61 18 79 40 14 51 14 79 64 3Davenport—Rock Is land—Moline____ 96 63 64 32 94 69 94 69 81 60 35 19 56 37 8 22 4 77 69 2D etroit3 9 / 57 63 40 92 60 92 60 85 57 61 27 87 60 32 6 8 4 85 69 1Green Bay _ 92 57 69 42 98 52 95 52 71 28 55 27 91 58 40 45 11 74 62 (4)Milwaukee . — 95 57 58 27 93 45 92 45 81 41 53 14 82 61 26 52 3 82 64 2Minneapolis—St. P au l_____________ 94 54 45 21 89 38 87 38 79 35 61 21 73 34 21 49 3 79 45 1St. L ou is3 . . . . . . . 95 60 56 34 84 52 85 53 79 48 55 30 78 48 26 51 9 75 50 3T oledo__ __ __ __ 95 60 66 40 85 50 85 50 75 33 63 28 79 60 38 50 4 81 69 -W aterloo _ __ _____ 99 48 8 8 40 89 61 89 61 83 59 48 9 65 46 7 25 3 83 56 1W ichita. ______ _ . ____ 93 15 76 7 92 10 92 10 87 8 26 7 92 74 3 58 23 79 75 3
West
Los Angeles—Long Beach3____ 98 56 72 35 94 48 94 48 85 43 77 37 78 24 10 70 5 78 57 (4 )Salt Lake City. . . . _ ____ ____ 99 48 44 21 93 36 93 36 88 36 60 24 78 45 9 55 8 78 49Sari Diego . . . — 98 74 80 47 93 57 93 57 83 49 86 51 89 45 - 70 10 74 55 -San F ran cisco—Oakland3 __________ 97 57 60 35 92 51 92 50 82 44 79 35 77 29 8 61 8 84 59 (4 )Seattle 3 ,, , __ .. 99 25 81 16 52 25 52 25 49 24 35 13 92 24 17 73 7 84 72 090 33 57 23 67 31 67 ' 31 64 31 72 42 84 42 27 53 12 75 54 (4 )
See footnotes at end of table.
Digitized for FRASER http://fraser.stlouisfed.org/ Federal Reserve Bank of St. Louis

83
Tabic B-26. Health, Insurance, and Pension Plans—All Industries— Continued
(Percent distribution of office and plant w orkers with form al provisions* 1 by type o f plan* July 1962 through June 1963)
Labor market
Insurance plans Sickness and accident insurance and /or sick leave Reti.rement
nsionplan No health,
insurance, or pension
plan
LifeAccidental death and dism em berment
Ho spitalization Surgical M edical Catastrophe
T ota l1 2
Sicknessand
accidentinsurance
Sick leave (full pay and
Sick leave (partial pay or waiting
period)
pe
Allplans
Noncontrib
utoryplans
Allplans
Non- contrib-
utory plan 8
All plan 8
Noh-contrib-
utbryplans
Allplans
N on-contrib
utoryplans
Allplans
Non-contrib
utoryPlans__
Allplans
Non-contrib -
utoryplans
A llplans
Noncontrib
utory plan 8
no waiting period) Ail
plans
Non-contrib
utoryplans
Plant w orkers
Northeast
B oston 3 . ___ 94 60 61 35 86 55 84 54 74 47 36 19 94 74 43 21 10 72 57 2B u ffa lo -. 94 63 52 29 89 6 8 88 66 60 45 16 11 80 69 41 11 6 76 66 3B u rlin g to n 96 33 67 9 87 31 79 26 68 19 69 24 94 76 25 23 6 72 30 2M anchester ___ ____ 75 52 59 38 90 43 89 43 79 44 12 7 81 75 50 7 2 52 48 1N ew Y o r k 3 __ __________ 93 78 53 41 89 78 87 76 68 57 21 14 81 58 51 31 12 81 73 2Philadelphia.— _ . . . 96 73 49 39 89 74 85 72 61 51 22 13 89 79 62 15 6 79 6 8 1Pitt sburgh ,....................'-------- 97 83 44 35 95 81 95 80 49 40 20 14 93 86 75 7 4 86 79 1
82 57 62 44 91 68 91 6 6 82 61 16 6 42 33 18 9 2 50 46 3T ren to n _ , . 95 65 57 34 92 67 8 8 62 79 57 22 16 56 50 27 11 3 73 60 3
SouthB a lt im o r e 3 _ 89 55 43 24 75 55 76 55 35 25 23 14 90 72 48 10 15 80 71 4C h attan ooga 3 82 40 45 21 85 45 85 44 31 21 23 8 61 56 27 3 4 50 41 10Dallas ___ 8 6 40 49 21 80 32 81 32 51 17 31 11 49 33 13 17 9 60 37 8F o r t W o rth _ 87 33 55 17 87 30 87 30 57 16 43 11 58 42 11 25 12 49 35 6J a c k s o n v ille 3 . 82 40 45 16 83 31 81 29 57 19 44 19 53 34 13 13 14 55 39 7Little R ock-N orth Little Rock 3 — 78 44 47 23 80 47 74 40 56 31 40 25 . §9 48 24 13 4 40 25 13L o u is v il le 8 8 52 66 36 89 54 89 54 69 39 31 11 82 6 8 37 9 15 70 51 3N ew O r le a n s _ ----- 79 41 43 14 64 31 61 28 36 18 25 15 54 41 18 7 9 45 32 14N orfolk-Portsm outh and
N ew p o rt N e w s -H a m pton 87 22 67 9 86 21 85 21 39 19 26 13 76 64 43 47 3 61 21 7Oklahoma C ity3 _ 83 41 60 19 66 25 69 28 46 19 42 19 67 29 7 22 21 48 39 7San A n to n io 3 79 30 47 12 81 23 76 2 2 32 11 39 16 43 25 10 15 8 39 26 10W a sh in g to n 3 8 8 44 56 24 80 39 78 37 41 19 42 17 84 52 30 39 16 60 34 6
North CentralC h ic a g o 3 94 51 57 29 92 51 91 50 69 40 36 16 90 76 41 9 14 63 51 1C le v e la n d 3 _ _ 98 67 . 61 39 85 6 8 84 69 54 47 19 7 88 82 58 5 4 78 73 1Columbus 11 ..... 8 6 52 70 30 83 47 82 47 44 23 38 19 81 65 34 15 13 65 57 8Davenport—Rock Island—M oline------ 91 52 65 27 91 64 91 64 77 54 20 9 81 76 22 1 9 67 63 5D etroit3 . . . __ _____ 98 40 66 21 94 74 94 74 83 65 9 6 94 84 30 11 5 82 79 1Green B a y .— __________________— . 84 57 67 49 97 37 93 37 72 30 35 19 87 79 42 3 6 71 62 2Milwaukee _ __ 95 49 58 25 95 54 94 53 80 47 20 6 94 83 37 6 8 74 65 1Minneapolis—St. P au l_____ _____——_ 90 63 44 29 87 6 6 85 66 73 59 23 16 88 73 57 15 11 6 6 57 2St. L ou is3 - - - 97 63 71 45 92 6 6 91 6 6 80 56 25 12 93 80 52 16 9 75 63 1Toledo _ — 97 66 70 48 95 73 92 70 76 44 28 8 92 82 58 8 6 80 74 .W a te r lo o 98 76 89 71 94 70 94 70 88 67 7 4 89 85 33 3 3 84 71 1W ich ita 91 15 68 6 93 14 92 14 85 10 32 8 89 76 7 44 25 73 70 3
West
92 62 76 49 94 71 94 71 86 65 51 33 6 6 27 13 38 17 74 59 1Salt Lake City __ - 95 39 67 28 93 41 93 41 82 40 55 26 74 42 14 36 13 57 38 1San D iego 97 82 87 67 96 76 96 76 85 6 8 80 64 86 41 2 60 17 65 58 1San F rancis co-O akland 3 __________ 97 83 62 50 94 78 94 77 90 75 44 29 70 22 9 26 31 86 6 6 (4)S e a tt le 3 . . . . . . _ 95 86 85 78 96 89 96 89 92 88 24 18 95 87 84 36 10 78 73 2Spokane . .... _ ----- ----- 8 8 56 48 20 79 47 79 47 74 47 44 23 77 63 43 11 15 62 46 2
1 "A ll p lans" include those plans fo r which at least a part of the cost is borne by the em ployer. "N oncontributory plans" include only those plans financed entirely by the em ployer. Excluded are legally required plans such as w orkm en 's compensation, socia l security, and railroad retirem ent.
2 Unduplicated total of w orkers receiv ing sick leave or sickness and accident insurance shown separately. Sick leave plans are lim ited to those which definitely establish at least the minimum number of days' pay that can be expected by each employee. Informal sick leave allowances determined on an individual basis are excluded.
3 Exceptions to the standard industry limitations are shown in footnotes 4, 5, 7, and /or 11 to the table in appendix A.4 Less than 0.5 percent.
Digitized for FRASER http://fraser.stlouisfed.org/ Federal Reserve Bank of St. Louis

84
(Percent distribution o f o ffice and plant w orkers with form al p ro v is io n s ,1 by type o f plan, July 1962 through June 1963)
Table B>27. Health, Insurance, and Pension Plans—Manufacturing
Labor market
Insurance plans Sickness and accident insurance an d /or sick leave Retirem ent
pensionplan No health,
insurance, or pension
plan
LifeAccidental death and dism em berment
Hospitalization Surgical M edical Catastrophe
T ota l2
Sicknessand
accidentinsurance
Sick leave (full pay and
no waiting period)
Sick leave (partial pay o r waiting
period)A llplans
Noncontrib
utoryplans
A llplans
Non-contrib -
utoryplans
A llplans
Noncontrib
utoryplans
A llplans
Non-contrib
utoryplans
Allplans
Noncontrib
utoryplans
Allplans
Noncontrib
utoryplans
A llplans
Non-con trib -
utoryPlans
A llplans
Noncon trib
utoryplans
O ffice workers
Northeast
B oston _____________________________ 98 51 64 31 98 54 98 53 92 48 61 30 95 60 28 82 1 85 53 1Buffalo 97 70 61 42 96 71 95 69 71 55 40 17 93 86 64 70 2 88 69 1Burlington 99 34 71 9 99 33 87 21 78 14 85 23 97 84 21 76 - 88 31 (3)Manchester 79 60 77 60 89 53 93 57 75 48 9 4 90 84 61 51 - 36 26 1New York 94 63 45 30 88 61 86 57 68 43 54 30 90 33 25 79 4 82 66 2Philadelphia 97 64 45 27 91 70 88 67 67 49 44 29 92 67 42 74 3 89 64 ( !)Pittsburgh 98 71 36 26 99 76 99 76 78 64 44 26 94 73 59 81 - 93 78 (3)Providence—Pawtucket 79 54 59 42 96 67 93 64 89 62 31 15 51 26 11 36 - 59 55 1Trenton 99 62 51 34 99 65 99 65 93 62 48 22 88 53 29 84 “ 90 60
South
99 57 61 30 86 47 88 47 51 28 54 24 96 75 41 46 20 .90 7590 43 55 21 95 48 94 47 62 31 51 18 74 58 22 43 2 72 55 3
Dallas 96 41 53 22 97 40 97 40 69 21 57 18 77 52 15 60 1 82 42 (3)VrtTt Worth _ ------ — - _ _ 98 33 83 28 97 26 97 26 80 11 59 5 85 72 17 73 1 82 80Jacksonville 90 20 58 15 92 21 90 20 82 13 78 10 70 45 10 34 6 67 38 2Little Rock—North Little Rock —— 89 44 52 26 91 51 85 45 56 26 46 28 73 64 27 44 - 57 32 4Louisville __ 97 42 80 38 96 53 97 53 82 45 63 31 78 71 30 49 2 78 52 1New Orleans . 92 29 52 14 77 40 77 40 50 28 24 7 79 48 10 36 3 80 66 4Norfolk—Portsm outh and
Newport News—Hampton 98 16 85 5 98 14 98 14 29 12 29 4 82 70 50 65 1 90 34 1Oklahoma City ~ 98 27 54 6 73 11 72 11 64 9 58 24 80 46 4 44 19 68 44 2San Antonio 86 36 46 26 90 28 90 28 50 15 39 10 49 28 23 26 1 47 21 1Washington _______ ________ 85 33 54 16 85 35 79 29 49 16 60 32 98 48 24 72 3 73 67 1
North Central
Chicago — _ _ 98 48 59 25 90 38 89 37 74 30 53 21 86 62 31 47 8 73 54 (3)C levelan d . 99 69 63 43 94 68 93 68 68 53 43 14 87 72 48 57 5 89 76Columbus ____ __-____ _____ 96 52 82 27 88 33 88 33 55 17 69 23 85 72 26 51 9 81 70 1Davenport—R ock Island—M oline____ 98 60 78 44 98 77 98 77 90 69 21 7 58 48 10 17 1 88 88 1Detroit 99 54 72 48 99 82 99 82 94 78 62 20 97 92 51 71 1 94 89 oGreen Bay 93 71 84 72 99 64 99 64 68 32 20 14 87 85 71 35 - 85 73 3Milwaukee 98 50 71 36 99 64 99 64 88 60 43 8 95 90 39 54 - 87 80 (3)Minneapolis—St. Paul _ ------ 96 60 35 19 97 65 94 65 82 58 45 26 85 54 39 50 1 80 42 1St. Louis 96 49 71 43 94 59 92 56 87 52 44 20 83 67 35 59 1 89 61 2Toledo 100 58 83 47 98 53 98 53 93 35 68 20 92 83 47 62 (3) 95 83 .W aterloo 100 48 93 46 99 81 99 81 99 81 43 3 59 58 7 10 91 75 -Wichita 100 4 91 1 97 5 97 5 96 5 13 1 99 97 2 62 27 91 90 -
West
99 52 92 49 98 54 98 54 87 48 82 40 85 26 12 80 2 79 60 (3)Salt Lake City 99 43 32 18 100 63 100 63 93 62 18 11 97 80 8 81 3 86 51San Diego 99 80 99 84 99 83 99 83 94 78 97 81 97 73 - 92 - 84 84 -San F ran cisco—Oakland______ 95 65 67 44 99 72 99 72 96 68 60 31 71 31 16 60 (3) 92 60 -Seattle__-__. . ._________ ____________ 98 13 93 9 17 16 17 16 17 16 7 5 96 8 6 89 2 95 94 (3)Spokane 96 55 50 21 95 60 95 60 95 59 25 8 85 64 42 54 81 36 3
See footnotes at end of table,
Digitized for FRASER http://fraser.stlouisfed.org/ Federal Reserve Bank of St. Louis

85
(Percent distribution of office and plant w orkers with form al p ro v is io n s ,1 by type o f plan, July 1962 through June 1963)
Table B-27. Health, Insurance, and Pension Plans—Manufacturing— Continued
Labor m arket
Insurance plans Sickness and accident insurance and /or s ick leave Retirement
pensionplan No health,
insurance, or pension
LifeAccidental death and dism em berment
H ospitalization Surgical M edical Catastrophe
T ota l2
Sicknessand
accidentinsurance
Sick leave (full pay and
no waiting period)
Sick leave (partial pay
or waiting period)A ll
plans
Non-contrib
utoryplans
Allplans
Noncontrib
utoryplans
Allplans
Noncontrib
utoryplans
Allplans
Non-contrib
utoryplans
A llplans
Noncontrib
utoryplans
A llplans
Noncontrib
utoryplans
A llplans
Noncontrib
utoryplans
A llplans
Non-contrib-
utoryplans
plan
Plant w orkers
Northeast
Boston_____ - - 96 67 63 43 96 64 95 63 84 55 42 21 97 89 55 9 5 78 64 2Buffalo 97 62 56 30 96 73 95 72 62 47 12 8 88 84 48 5 5 82 74 1Burlington__ 100 30 70 10 99 36 88 25 78 19 72 18 98 87 25 14 - 78 28 -M anchester 72 54 57 43 94 44 94 43 81 .45 8 3 83 82 55 2 - 56 52 -New Y ork— __ 95 81 51 42 96 87 93 85 72 63 15 8 78 66 62 26 7 81 75 1Philadelphia 96 73 51 40 95 79 95 79 65 52 22 12 96 91 71 14 3 82 70 1Pittsburgh_______ 99 88 36 29 99 88 99 88 47 39 16 13 99 98 86 1 1 94 89 -P r o videnc e—Pawtucket 80 58 63 48 93 71 94 70 85 64 16 6 34 31 16 3 1 49 45 2T ren ton ------------------------------------------- 99 65 62 36 100 72 98 70 87 64 23 15 57 57 27 8 - 81 65 -
South
Baltim ore __ 98 66 49 29 88 66 89 66 37 27 21 14 96 91 61 ! 8 85 78Chattanooga 82 40 49 24 88 48 88 48 30 21 20 4 67 65 32 1 2 57 47 9Dallas _ 91 47 49 26 93 48 93 48 54 23 30 12 49 44 18 15 4 62 44 1F ort W orth________________________ 94 34 68 25 90 40 90 40 65 18 32 5 70 62 18 35 6 65 59 4Jack son v ille______________________ 75 21 54 17 90 34 85 29 71 21 46 9 46 39 14 4 9 55 39 7Little Rock-N orth Little R ock .___ 73 39 45 27 82 53 72 43 54 27 31 23 65 63 33 3 - 35 20 17L ou isville 94 53 76 40 94 58 96 58 76 42 28 6 91 85 43 8 8 78 58 1New O rleans— 79 36 49 13 72 32 72 32 38 17 23 13 71 63 27 7 - 44 33 14Norfolk—Portsm outh and
Newport News—Hampton 93 13 83 8 95 17 95 17 22 13 9 3 89 86 67 61 2 86 24 3Oklahoma C ity_____ —__—__—____ 95 52 73 16 69 29 68 29 54 26 57 31 70 37 10 5 32 51 50 5San Antonio — — 81 36 47 22 93 28 93 28 33 9 39 12 38 30 18 8 2 30 19 3Washington-------------------------------------- 88 32 49 14 89 41 80 33 55 22 27 9 90 70 48 22 4 37 35 2
North Central
Chicago 97 52 62 34 95 53 95 53 71 39 30 13 96 89 49 2 10 65 53 <3)Cleveland— 99 68 66 40 94 77 94 79 66 59 16 4 90 89 60 1 1 85 81 1Columbus — 96 59 87 39 88 52 88 .52 48 24 43 22 92 83 43 16 9 77 74 jDavenport—Rock Island—M oline— 94 57 69 34 98 76 98 76 85 65 12 3 89 89 27 . 6 79 79 2D etroit 99 28 71 16 99 87 99 87 91 81 3 2 98 98 27 4 - 94 93 _G reen Bay 89 64 79 65 99 35 99 35 77 31 22 13 90 87 52 2 3 70 67 1Milwaukee . _ 97 41 62 23 100 56 99 56 87 52 17 3 97 97 38 2 - 81 75 -M inneapolis—St. Paul 93 69 35 24 97 78 94 77 80 69 14 9 95 89 74 11 10 70 67 2St. Louis — 98 55 74 44 95 65 94 64 84 56 19 7 98 90 55 16 6 86 69 -TnlpHn 99 60 78 51 100 75 99 73 83 41 26 2 99 94 58 6 2 93 89 .W aterloo 99 82 95 81 98 81 98 81 97 80 2 1 96 96 36 1 <*) 92 80 -Wichita-------------------------------------------- 100 9 80 4 99 13 99 13 95 10 24 2 96 95 7 52 29 83 83 -
W est
Los Angeles—Long B ea ch_______ — 96 58 85 54 100 70 100 70 90 63 58 35 69 31 16 47 8 71 56 _Salt Lake City 96 30 65 25 100 55 100 55 89 53 43 23 84 57 19 36 18 72 50 _San D iego 100 .87 96 84 100 88 100 88 87 75 91 79 92 67 3 77 3 76 76 _San Fran cis co-O akland____. . . . . . __ 97 81 71 56 99 85 99 85 94 80 28 18 54 30 16 13 15 96 76 _Seattle 95 90 90 86 99 95 99 95 98 94 12 11 96 94 91 52 4 91 90 1Spokane...........—— . . . . . . ------ ------- ----- 94 79 44 29 94 67 94 67 94 67 10 6 91 91 75 3 3 78 67 4
1 "A ll p lans" include those plans fo r which at least a part o f the cost is borne by the em ployer. "Noncontributory plans" include only those plans financed entirely by the em ployer. Excluded are lega lly required plans such as w orkm en 's com pensation, socia l security, and railroad retirem ent.
2 Unduplicated total o f w orkers receiving sick leave o r sickness and accident insurance shown separately. Sick leave plans are lim ited to those which definitely establish at least the mini™,,™ number o f d ays ' pay that can be expected by each em ployee. Informal sick leave allowances determ ined on an individual basis are excluded.
3 L ess than 0. 5 percent.
Digitized for FRASER http://fraser.stlouisfed.org/ Federal Reserve Bank of St. Louis

86
Table B-28. Health, Insurance, and Pension Plans—Public Utilities1
(Percent distribution of o ffice and plant w orkers with form al provisions, 2 by type of plan, July 1962 through June 1963)
Labor m arket
Insurance plan Sickn ess and accident insurance and/ or s ick leave Reti.rement
rnsionplan No health,
insurance, or pension
LifeAccidental death and dism em berment
H ospitalization Surgical M edical Catastrophe
T ota l3
Sicknessand
accidentinsurance
Sick leave (full pay and
no waiting period)
Sick leave (partial pay or waiting
period)
pe
A llplans
Non-contrib
utoryplans
Allplans
Non-contrib
utoryplans
Allplans
Non-contrib-utoryplans
Allplans
Noncontrib
utory Plans___
Allplans
Non-contrib
utoryplans
Allplans
Non-contrib-
utoryplans
Allplans
N on-con trib -
utoryplans
A llplans
Non-contrib
utoryplans
plan
O ffice w orkers
Northeast
Boston4 — — — 97 78 75 28 55 51 55 51 39 36 76 71 98 23 12 88 1 78 76 -B u ffa lo -. - 98 83 32 5 75 62 75 62 67 54 78 65 62 8 5 59 - 54 53 -Burlington. 100 65 88 - 35 _ 35 20 10 - 95 84 100 35 20 100 - 91 84 -M anchester — 100 74 96 12 42 41 42 41 42 41 84 84 100 11 11 88 1 89 89 -New Y ork 4 - . ______ - 99 54 65 11 67 34 67 34 55 28 73 57 90 34 15 81 7 91 61 ( !)Ph iladelph ia-. - 99 68 39 6 57 46 54 45 53 44 70 65 62 29 6 57 3 61 60 (5)Pittsburgh. 95 46 39 10 74 37 74 37 68 34 88 55 75 8 7 46 24 72 52 -
95 54 75 11 63 30 63 30 61 30 51 49 87 32 8 87 - 84 75 -Trenton................— 100 85 74 8 34 34 17 17 17 17 78 78 93 19 19 22 66 83 81
'
South
B altim ore4 — — _ - __ 100 40 33 5 71 71 71 71 64 64 92 92 97 6 6 95 2 91 90 _Chattanooga4 —. —. — . . — 100 80 32 3 87 66 87 66 78 57 89 69 65 9 3 51 11 31 29 -Dallas — . —. — — 99 57 44 8 72 44 73 44 58 36 68 48 58 14 5 22 29 74 53 (5)Fort Worth — 99 61 38 4 73 41 73 41 69 39 88 67 70 4 1 36 31 67 50 -J acks onville 4 — 99 92 39 11 72 64 72 64 69 62 92 87 40 12 9 10 28 45 44 -Little Rock-N orth Little R ock—. . — 98 75 67 4 50 27 50 27 36 23 94 71 75 19 4 24 48 73 52 2
99 86 45 11 79 64 79 64 72 58 93 79 44 11 10 9 31 46 33 -New O rleans . .— 98 79 39 16 77 56 77 56 71 50 88 62 47 8 4 25 18 68 31 2N orfolk-Portsm outh and
Newport News—Hampton— 97 62 42 8 72 38 72 38 66 37 88 80 71 22 7 56 - 56 32 1Oklahoma Pity, „ ....... — n----- ---- 100 79 6 33 56 36 56 36 52 32 60 49 86 12 7 41 42 85 64 -San Antonio4 — — 98 81 55 9 56 37 54 37 46 35 90 78 83 7 2 36 43 72 58 (5)Washington . — 94 63 47 6 55 25 55 25 37 25 75 59 81 19 6 75 1 79 47 “
North Central
Chicago 4 -____— ____ ———— 99 87 42 9 76 45 76 45 74 43 94 63 84 27 6 57 22 63 52 (5>Cleveland4 —— — — —— — 99 87 39 11 68 56 68 56 51 40 86 74 69 22 21 36 30 62 57 -
100 46 52 5 75 22 75 22 65 16 86 37 94 37 2 51 43 83 58 -Davenport—Rock Island-M oline____ 98 95 31 6 79 76 79 76 78 74 98 68 95 (5) - 47 21 59 24 -D etroit4 ..... rr . . . • • • 99 59 39 9 73 35 73 35 67 33 80 76 85 10 9 80 3 74 61 -Green B a y ..— 98 92 38 23 91 85 91 85 53 47 88 83 95 10 10 42 47 60 60 -
99 87 47 10 63 22 63 22 61 22 76 46 98 38 8 94 1 80 39 1Minneapolis—St. P au l__________.—— 91 68 38 16 70 57 70 57 65 52 70 60 95 16 12 89 2 56 45 ( !)St. Louis . • i • 99 95 42 10 74 50 74 50 70 47 88 62 90 18 9 42 37 53 49 (5)Toledo T--------------- —-------- - 98 67 42 19 80 64 80 64 80 64 88 55 66 18 13 34 19 62 39 -Waterloo - - — - - 100 56 64 1 72 8 72 8 34 1 46 19 85 33 1 65 19 51 19 -
100 62 52 14 72 14 71 14 65 10 73 41 87 15 12 31 42 58 58 ■
West
Los Angeles—Long B each4___;_____ 99 84 62 12 53 19 53 19 53 19 93 59 85 13 4 68 14 85 74 -Salt Lake C ity . _________________ 99 52 84 10 69 11 69 11 69 11 97 40 85 16 4 59 11 72 64 -San tv ago ........... .................... ..... 100 97 94 6 53 10 53 10 53 10 60 56 96 - - 49 47 95 53 -San Francis co-Oakland 4 — ———_ 99 72 54 47 66 16 66 16 66 16 93 41 77 30 2 37 36 74 45 -SSattle 4 ____ .— ______________ ______ 98 67 59 14 59 37 59 37 56 37 78 54 84 25 20 31 42 70 50 iSpokane—. _ — 100 60 59 15 43 32 43 32 43 32 71 60 74 17 15 29 28 74 73
See footnotes at end of table.
Digitized for FRASER http://fraser.stlouisfed.org/ Federal Reserve Bank of St. Louis

87
(Percent distribution of o ffice and plant w orkers with form al provisions, 2 by type o f plan, July 1962 through June 1963)
Table B-28. Health, Insurance, and Pension Plans—Public Utilities1— Continued
Insurance plans Sickness and accident insurance and /or sick leave irement
tnsionplan No health,
insurance, or pensionLabor market
LifeAccidental death and dism em berment
Hospitalization Surgical M edical Catastrophe
T ota l1 2 3
Sicknessand
accidentinsurance
Sick leave (full pay and
Sick leave (partial pay or waiting
period)
pe
A llplans
Non-contrib
utoryplans
Allplans
Non-contrib-
utoryplans
Allplans
Non-contrib-utoryplans
Allplans
N5n^contributoryplans
Allplans
Non-contrib
utoryplans
Allplans
Noncontrib
utoryplans
A llplans
Non-contrib
utoryplans
no waiting period) All
plans
Non-contrib
utoryplans
plan
Plant w orkers
NortheastB oston4 ____ _ ____ 98 74 72 27 61 49 61 49 45 33 71 59 91 32 18 30 41 85 79 _Buffalo________________ -_____________ 98 84 52 25 77 66 77 66 54 43 61 47 75 31 14 26 19 72 68 _Burlington. _ . . . . . ._ 100 54 84 10 56 10 56 33 33 10 90 67 67 56 33 56 44 93 77 _M anchester_ _ __ __ __ __ _ 100 71 91 32 69 61 69 61 69 61 56 56 96 31 31 3.4 31 67 67 _New Y o rk 4 _ __ __ __ __ __ _ 98 62 70 17 67 39 67 39 59 36 68 54 86 34 15 34 40 84 67 _Philadelphia. ................ 100 64 40 12 66 43 50 40 42 32 52 48 75 46 35 22 23 76 73 _P ittsburgh. __ ._ _ — 94 60 40 14 81 44 81 44 63 39 74 50 69 24 14 22 31 66 46 _Providence—Paw tucket. _____ 99 51 75 18 73 37 73 37 73 37 40 37 80 53 23 20 24 86 81 _Trenton---------------------------------------------- 100 72 44 11 68 68 31 31 31 31 52 52 71 39 39 28 32 80 71 -
SouthB a ltim ore4 . . . . . . . . 98 46 45 14 69 69 69 69 56 56 68 66 100 30 30 68 17 98 98 _Chattanooga4 __ _ ____ 100 89 40 2 63 52 63 52 58 47 86 75 40 7 2 4 29 48 40 _Dalla s ______ _ 99 48 57 15 68 34 73 34 49 22 64 34 77 36 12 32 27 76 45 (5)F ort W orth_________________________ 98 71 34 7 79 55 79 55 71 50 82 71 53 12 4 21 27 53 38Jacksonville 4________ _____________ 95 82 37 8 73 44 73 44 66 38 75 68 52 25 14 5 27 51 47 _Little Rock—North Little R ock_____ 97 91 29 9 73 67 73 67 63 58 81 74 46 13 9 20 17 40 26 3L o u is v il le . . . . _ .... ... _ 99 78 56 18 81 56 81 56 72 47 78 54 66 24 21 6 43 63 35 _New O rleans _ . . . . 99 87 50 27 75 63 75 62 57 48 73 63 54 30 24 5 26 71 41 1N orfolk—Portsm outh and
N ewport News—Hampton_________ 95 56 51 7 66 29 66 29 62 27 69 65 80 27 11 50 4 65 37 5Oklahoma City___________________ __ 100 77 77 35 71 48 71 48 56 36 50 42 73 20 13 26 31 65 56 _San A ntonio4 __ . . ._ ._ __ 93 70 56 10 62 34 56 34 43 28 81 64 66 20 6 18 36 58 42 2W ash in gton 94 57 56 6 67 29 67 29 52 29 74 45 76 35 7 56 15 74 38 4
North CentralC h ic a g o 4 98 85 44 18 75 51 75 51 69 46 78 52 73 46 25 29 18 68 57 _Cleveland 4 - — ....... ................... .... 100 87 56 25 74 49 74 49 45 25 75 48 78 37 30 30 27 78 70 _Columbu s _________________________ 100 66 62 12 74 42 74 42 55 32 77 55 70 32 12 13 46 75 47 _Davenport—R ock Island—M oline____ 100 94 40 11 75 69 75 69 66 60 89 83 56 9 9 1 46 61 40 _D etroit4 _ _ __ . 100 70 50 22 71 44 71 44 70 42 70 67 83 21 21 63 4 82 73 _G reen Ray , , 100 93 48 35 87 80 87 80 56 49 72 65 66 28 28 13 24 71 71 _Milwaukee __________ ________ ______ 100 89 42 21 82 57 82 57 80 56 55 36 83 42 21 23 36 80 41 _M inneapolis—St. P a u l. ____ 91 68 43 22 72 ■ 59 72 59 65 54 58 52 72 24 20 25 26 70 57 1St. L o u is . . _ .... . .. _ — __ 99 88 48 19 83 61 83 61 67 45 76 53 68 30 18 10 32 62 58 _Toledo _ _ 98 69 39 21 79 65 79 65 79 65 77 62 60 17 16 11 33 58 43 _W aterloo _ _ _ _ _ __ 100 70 69 7 68 13 68 13 37 6 63 39 69 35 7 26 32 63 39 _W ichita _ _ _ _ _ _ 100- 65 53 9 67 9 64 9 57 6 67 39 83 17 9 21 46 61 61 -
WestLos Angeles—Long B each4. . . _ 99 80 64 19 63 30 63 30 61 30 79 46 72 17 6 55 12 81 70 _Salt Lake C ity .. __ ._ __ ._ _ 96 60 75 21 74 24 74 24 74 24 88 45 50 18 15 37 _ 74 57 _San Diego ___________________________ 100 97 84 16 64 28 64 28 64 28 60 53 88 4 _ 39 45 96 60 _San F ran cis co-O akland 4 ____ _____ 98 76 64 42 70 24 70 24 70 24 78 30 90 39 7 54 36 93 47 _Seattle 4 _________________________ __ 95 63 58 19 70 43 70 43 58 43 85 51 84 38 24 32 35 81 49 _
100 71 52 15 56 52 56 52 56 52 75 71 59 23 15 8 29 59 52
1 Transportation, com munication, and other public utilities. Excludes taxicabs, serv ices incidental to water transportation, and m unicipally operated establishments.2 "A ll p lans" include those plans for which at least a part of the cost is borne by the em ployer. "Noncontributory plans" include only those plans financed entirely by the em ployer. Excluded are
legally required plans such as w orkm en1 s compensation, socia l security, and railroad retirem ent.Unduplicated total of w ork ers receiving sick leave or sickness and accident insurance shown separately. Sick leave plans are lim ited to those which definitely establish at least the minimum
number of days' pay that can be expected by each employee. Informal sick leave allowances determined on an individual basis are excluded.4 Exceptions to the standard industry limitations are shown in footnotes 4, 5, 7, and /or 11 to the table in appendix A.5 L ess than 0.5 percent.
Digitized for FRASER http://fraser.stlouisfed.org/ Federal Reserve Bank of St. Louis

88
Table B-29. Health, Insurance, and Pension Plans—Wholesale Trade
(Percent distribution o f o ffice and plant w orkers with form al provisions, 1 by type o f plan, July 1962 through June 1963)
Labor market
Insurance plans Sickness and accident-insurance an d /or s ick leave R e tire m e n t
No health, insurance, or pension
plan
LifeAccidental death and dism em berment
Hospitalization Surgical M edical Catastrophe
T ota l2
Sicknessand
accidentinsurance
Sick leave (full pay and
Sick leave (partial pay
or waiting period)
pe nsionplan
A llplans
Noncontrib
utoryplans
A llplans
Noncontrib
utoryplans
Allplans
Noncontrib
utoryplans
A llplans
Non-contrib
utoryplans
Allplans
Noncontrib
utoryplans
Allplans
Non-contrib
utoryplans
A llplans
Non-con trib
utoryplans
no waiting period) A ll
plans
Non-con trib -
utoryplans
O ffice workers
Northeast
Boston 98 42 49 20 94 35 91 34 83 28 62 20 75 30 11 63 6 67 32 -New Y ork - 91 62 55 34 76 40 72 36 60 28 49 16 78 37 24 67 - 74 42 1Philadelphia_______________________ 96 49 32 19 82 40 74 31 53 14 56 12 60 35 22 55 - 86 68 1P ittsbu rgh -------------------------------------- 95 64 62 39 76 58 75 57 43 25 27 10 84 59 44 76 2 67 49 3
South
95 31 46 24 95 23 93 21 59 15 56 11 82 31 12 61 6 86 45 3W ashington________________________ 95 73 58 38 90 66 64 40 62 40 73 43 92 44 32 77 2 86 62 ‘
North Central
96 41 69 26 97 37 j 94 34 83 30 62 19 86 52 22 64 1 73 48 2Cleveland __ 95 46 61 23 68 31 68 34 45 27 37 12 71 59 27 29 2 58 38 2D e tro it 87 29 49 20 82 34 80 33 57 27 38 8 75 50 20 58 8 '54 33 7Minneapolis—St. Paul 94 46 64 36 93 30 93 33 90 31 48 8 70 41 17 41 8 73 51 2St. L ou is ----------------------------------------- 90 51 64 40 86 57 86 57 76 47 43 17 86 60 37 53 10 72 35 4
West
Los Angeles—Long B each--------------- 96 56 73 39 96 77 96 77 87 69 63 52 76 25 13 59 9 59 32 -San Fran cis co -O aklan d----------------- 97 65 66 52 96 61 94 59 91 59 70 35 78 21 9 68 7 71 50
Plant w orkers
Northeast
Boston 92 34 66 22 91 32 90 31 80 29 42 15 80 48 11 45 13 62 35 493 69 59 47 93 70 90 68 67 52 27 10 84 50 46 53 - 78 73 2
Philadelphia — — -— ----------------------- 95 79 41 39 90 79 76 64 43 34 26 10 74 63 61 20 - 77 74 -P ittsburgh_____________________ ___ 91 71 51 44 86 70 83 67 70 54 25 6 81 69 62 27 7 82 64 7
South
79 37 33 23 74 28 74 28 31 10 19 2 68 43 21 21 10 43 25 1889 56 57 32 90 54 76 40 71 40 54 26 85 43 26 61 13 66 50 “
North Central
Chicago 98 59 70 39 94 54 88 48 68 38 40 18 90 71 48 31 7 65 49 1Cleveland 97 58 63 38 80 47 80 49 36 23 37 7 93 67 43 34 5 60 38 -Detroit -------------------------------- — 92 57 74 48 88 57 88 57 46 34 14 4 92 81 47 32 5 52 42 2Minneapolis—St. P aul--------------------- 99 47 80 34 91 35 90 37 88 35 28 10 90 71 28 30 13 77 51 -St. Louis 90 70 67 60 86 71 86 71 61 51 11 5 89 64 48 60 11 64 56 10
West
Los Angeles—Long Beach--------------- 97 67 83 52 83 74 83 74 80 71 51 44 80 36 13 36 40 81 70 -San F ran cisco-O aklan d--- ------------- 100 91 80 78 93 88 87 81 85 81 53 47 87 10 3 26 56 91 83
1 "A ll plans" include those plans for which at least a part o f the cost is borne by the em ployer. "Noncontributory plans" include only those plans financed entirely by the em ployer. Excluded are legally required plans such as w orkm en's com pensation, socia l security, and railroad retirem ent.
* Unduplicated total of w orkers receiving sick leave or sickness and accident insurance shown separately. Sick leave plans are lim ited to those which defin itely establish at least the minim um number o f days ' pay th?* can be expected by each em ployee. Inform al s ick leave allowances determ ined on an individual basis are excluded.
Digitized for FRASER http://fraser.stlouisfed.org/ Federal Reserve Bank of St. Louis

89
Table B-30. Health, Insurance, and Pension Plans—Retail Trade
(Percent distribution o f office and plant w orkers with form al p ro v is io n s ,1 by type o f plan, July 1962 through June 1963)
Labor m arket
Insurance plans -siasess and accident insurance an d /or sick leave rement
nsionplan No health,
insurance, or pension
plan
LifeAccidental death and dism em berment
Hospitalization Surgical M edical Catastrophe
T ota l1 2
Sicknessand
accidentinsurance
Sick leave (full pay and
Sick leave (partial pay or waiting
period)
pe]
A llplans
Non-contrib
utoryplans
Allplans
Noncontrib
utoryplans
Allplans
Non-contrib
utoryplans
Allplans
Non-contrib
utoryplans
Allplans
Noncontrib
utoryplans
Allplans
Non-contrib
utoryplans
Allplans
Non-contrib
utoryplans
no waiting period) All
plans
Non-contrib-
utoryplans
O ffice w orkers
N ortheastBoston — 92 38 56 10 79 38 77 36 71 33 32 8 98 61 20 50 29 75 47 _New Y o r k __________________________ 89 71 48 43 89 72 87 71 71 60 23 7 90 45 39 54 12 68 42 1Philadelphia_______________________ 95 53 35 24 88 47 82 43 41 40 39 0 88 36 32 26 41 88 55 1‘PiH-aHiivgVi____________________ ____ 95 73 72 58 93 62 93 62 23 10 22 ( 3) 94 69 59 22 11 74 53 5P rov id en ce -P aw tu ck et____________ 89 56 50 32 83 50 83 50 67 44 10 73 10 10 52 10 34 19 8
SouthB altim ore _ __ 76 12 34 6 62 8 62 8 47 8 57 1 82 38 7 19 32 88 48 4Dallas __ _ __ __ _______ 93 23 72 18 93 6 93 6 75 4 55 1 67 18 5 26 30 78 14 4New Orleans ------------------------------- 86 21 41 8 69 19 52 3 24 (3) 24 - 62 24 6 21 25 59 38 8W ashington4 . _ 90 18 32 5 81 16 78 13 27 3 44 (3) 98 33 2 52 37 77 42 1
North CentralChicago 95 15 48 4 95 17 95 13 38 10 73 1 93 38 5 11 50 76 34 (3)Cleveland _ _ 92 35 19 9 46 16 45 15 16 7 20 - 85 65 30 20 18 70 52 4D etroit _ . . . . — —_ 92 49 49 17 74 12 74 12 64 10 26 - 70 38 11 23 39 57 37 7M inneapolis-St. P a u l_____ ________ 85 34 46 22 68 21 62 21 29 17 59 12 81 57 21 29 10 71 41 3
W estSan F ran cisco—O akland___________ 88 54 38 16 97 68 97 68 80 68 71 44 72 3 3 48 23 55 25 2Seattle ___ 99 65 64 62 99 67 99 67 67 67 46 12 96 63 63 11 36 47 47 (3)
Plant w orkers
N ortheastBo 8 ton __ 92 46 50 13 75 49 73 46 66 41 10 3 94 67 32 35 15 74 54 1New York - ______ 93 83 47 46 95 88 92 85 76 68 10 8 85 57 49 35 8 83 74 1Philadelphia __ 90 73 44 40 84 71 79 67 63 62 8 - 81 60 52 18 13 75 64 1Pittsburgh 91 79 70 64 87 74 87 74 39 37 5 - 87 71 65 23 4 70 64 9Providence-Paw tucket - 83 71 50 40 83 71 83 71 70 63 5 - 78 31 31 42 5 48 38 8
SouthB a ltim ore__________________________ 62 30 22 10 40 21 40 21 24 13 16 - 79 31 21 12 44 78 60 9Dallas . 79 25 49 14 78 5 78 5 57 5 27 1 44 16 4 19 13 57 19 14New Orleans 69 24 34 6 50 18 36 6 18 3 6 - 45 24 7 6 21 51 38 16Washington4. 89 41 59 31 85 40 84 38 25 6 34 9 90 57 32 35 25 66 33 6
North CentralChicago 88 21 45 11 89 30 89 29 54 24 40 2 84 55 11 10 31 68 47 2Cleveland __ — 91 47 39 36 50 37 48 37 20 19 7 - 83 74 56 3 8 73 65 3D e tr o it _ . _ _ 95 68 52 27 86 28 86 28 66 14 14 - 83 53 36 20 31 52 42 4M inneapolis-St. P a u l______________ 78 50 46 35 70 46 69 46 53 43 27 15 84 65 44 17 5 61 45 3
W estSan F rancisco-O akland _ 95 82 32 29 100 93 100 93 93 93 62 54 82 4 1 38 41 59 44 -S ea ttle . ... . _ 100 91 90 89 100 92 100 92 92 92 27 17 98 90 *90 4 19 52 52
1 "A ll p lans" include those plans for which at least a part o f the cost is borne by the em ployer. "Noncontributory plans" include only those plans financed entirely by the em ployer. Excluded are legally required plans such as w orkm en 's compensation, socia l security, and railroad retirem ent.
* Unduplicated total o f w ork ers receiv ing sick leave or sickness and accident insurance shown separately. Sick leave plans are lim ited to those which definitely establish at least the minimum number o f days' pay that can be expected by each em ployee. Informal sick leave allowances determ ined on an individual basis are excluded.
3 L ess than 0 .5 percent.4 Exceptions to the standard industry limitations are shown in footnote 5 to the table in appendix A.
Digitized for FRASER http://fraser.stlouisfed.org/ Federal Reserve Bank of St. Louis

90
(P ercent distribution of o ffice w orkers with form al p rov is ion s ,2 by type of plan, July 1962 through June 1963)
Table B-31. Health, Insurance, and Pension Plans—Finance1
Labor market
Insurance plans Sickness and accident insurance an d /or s ick leave rement
nsionplan No health,
insurance, or pension
plan
LifeAccidental death and dism em berment
Hospitalization Surgical M edical Catastrophe
T ota l3
Sicknessand
accidentinsurance
Sick leave (full pay and
no waiting period)
Sick leave (partial pay or waiting
period)
pe1
Allplans
Non-contrib
utoryplans
A llplans
Non-contrib
utoryplans
Allplans
Non-contributoryplans
Ailplans
Non-contrib
utoryplans
A llplans
Non-contrib
utoryplans
Allplans
Non-contributoryplans
A llplans
Noncontributoryplans
Ailplans
Non-contrib
utoryplans
O ffice w orkers
NortheastBoston_________________________________________ 97 67 50 23 97 43 97 43 81 28 82 29 72 20 _ 72 _ 91 69 (4)New V<"»rk. „ .. ,, - ., n , n 99 61 42 31 88 53 83 44 72 28 78 20 74 21 10 68 1 90 74 -Philadelphia ..... , .,r.„ ,......... 97 80 30 16 67 19 65 16 59 16 61 14 64 9 6 60 2 92 88 2Pittsburgh 100 62 42 31 50 30 38 23 25 18 73 48 76 12 3 76 93 54 -
South
Baltim ore — 99 55 29 23 66 40 70 43 55 34 81 53 63 7 4 56 87 63 1Dallas - - 99 43 22 9 93 22 88 16 63 11 59 8 57 4 2 51 6 72 37 -
Washington-------------------------------------- 92 57 65 37 65 32 65 32 52 21 53 22 93 29 23 76 - 82 50
North Central
Chicago -------— 97 58 47 20 91 27 91 27 78 21 76 18 64 26 10 55 2 81 40 (4)Cleve 1 frtHi ■■ i ,■ 99 50 64 16 80 9 75 4 37 4 53 2 27 5 2 25 - 90 77 1Detroit ~ 96 78 61 49 96 38 96 38 88 34 71 40 75 7 1 71 2 90 39 2Minngapnlifl 97 51 53 19 99 12 99 12 99 13 83 8 53 10 9 46 . 99 46 -
St. Louis------------------------------------------ 99 64 42 36 76 42 84 50 78 46 68 39 66 36 18 46 5 72 34 -
West
Los Angeles—Long Beach . __ 97 59 42 19 99 38 99 38 94 37 76 28 70 24 11 65 2 84 64San F ran ci8co—Oakland—........ — . . . . 100 43 61 26 96 44 96 44 77 29 89 31 80 39 9 66 96 75
1 Finance, insurance, and real estate.2 "A ll plans" include those plans for which at least a part of the cost is borne by the em ployer. "N oncontributory plans" include only those plans financed entirely by the em ployer. Excluded are legally
required plans such as w orkm en 's compensation, socia l security, and railroad retirem ent.3 Unduplicated total of w orkers receiv ing sick leave or sickness and accident insurance shown separately. Sick leave plans are lim ited to those which definitely establish at least the minimum number
of days' pay that can be expected by each em ployee. Informal sick leave allowances determ ined on an individual basis are excluded.4 Lea8 than 0.5 percent.
Digitized for FRASER http://fraser.stlouisfed.org/ Federal Reserve Bank of St. Louis

(Percent distribution of office and plant w orkers with form al provisions, 1 by type o f plan, July 1962 through June 1963)
Table B-32. Health, Insurance, and Pension Plans—Services
91
Labor m arket
Insurance plans Sickness and accident insurance and /or sick leave Retirement
pensionplan No health,
insurance, or pension
plan
LifeAccidental death and dism em berment
Hospitalization Surgical M edical Catastrophe
T ota l1 2
Sicknessand
accidentinsurance
Sick leave (full pay and
no waiting period)
Sick leave (partial pay or waiting
period)A llplans
Non-contrib
utoryplans
Allplans
Noncontrib
utoryplans
Allplans
Noncontributory plan 8
Allplans
Noncontrib
utoryplans
Allplans
Non-contrib-
utoryPlans
A llplans
Non**contributoryplans
A llplans
Non-contrib-utoryplans
A llplans
Noncontrib
utoryplans
O ffice w orkers
Northeast
Boston — 82 33 44 31 59 21 54 21 46 19 48 16 93 36 19 77 71 45 !90 68 28 23 62 40 60 38 34 15 36 10 80 22 21 68 <3 4) 70 60 1
Philadelphia_________ 89 59 45 37 54 36 35 19 34 17 24 8 51 26 15 33 4 52 52 5
South
W a sh in g to n . 89 33 42 19 73 18 73 18 56 14 53 12 83 21 10 76 76 24 1
North Central
C h ic a g o - ----- 80 34 51 18 83 38 79 34 53 19 50 8 73 36 19 52 13 59 21 8D e tro it— . . . - 90 44 44 20 74 29 74 29 55 24 37 8 60 32 18 53 - 47 47 5
West
98 50 71 44 96 40 96 40 89 34 73 27 59 22 1 54 3 73 31 (3)
Plant w orkers
Northeast
Rnafnn 83 56 66 49 80 41 72 38 63 38 22 7 84 61 40 39 2 32 19 10New Y o r k -------------------------------- 83 80 51 49 82 78 79 75 55 53 6 3 76 61 60 28 5 69 66 8P h ilad elp h ia ---------------------------- 89 82 75 70 71 65 57 54 58 55 2 2 65 50 43 13 7 43 43 3
South
Washington __ 81 47 58 30 78 46 78 46 50 30 35 7 76 54 39 .37 5 51 34 12
North Central
Chicago.—— — — 81 66 49 36 91 74 89 72 85 68 17 10 79 73 64 13 4 30 27 7D etroit_________ — 81 74 48 43 86 79 86 79 60 53 3 2 73 70 67 11 - 8 8 6
West
82 76 62 58 92 85 92 85 88 84 19 15 23 11 4 9 6 49 45 8
1 "A ll p lans" include those plans for which at least a part of the cost is borne by the em ployer. "Noncontributory plans" include only those plans financed entirely by the em ployer. Excluded are legally required plans such as w orkm en 's compensation, socia l security, and railroad retirem ent.
Unduplicated total o f w ork ers receiving sick leave or sickness and accident insurance shown separately. Sick leave plans are lim ited to those which definitely establish at least the minimum number o f days' pay that can be expected by each employee. Informal sick leave allowances determined on an individual basis are excluded.
3 Less than 0.5 percent.4 Excludes data fo r m otion p icture production and allied services; data fo r these industries are included, how ever, in "a ll industries."
Digitized for FRASER http://fraser.stlouisfed.org/ Federal Reserve Bank of St. Louis

92
(Percent distribution o f o ffice and plant w orkers by type o f rate structure 1 in 6 broad industry divisions studied, July 1961 through June 1963)
Table B-33. Rate Structure Characteristics—All Industries
Item
NortheastAlbany— Schenec-
tady— T roy
Allentown—Bethlehem—
EastonB oston2 Buffalo Burl
ington
Lawrence—H aver
hill
Manchester
Newarkand
JerseyCity*
NewHaven
NewY ork 2
P a terson -Clifton—Passaic
Philadelphia
P ittsburgh
P o rt - ' land
P ro v i-„dence—
Paw tucket
Scranton Trenton W ater-
buryW orces
ter York
O ffice workers
A ll o ffice w orkers 3 100 100 100 100 100 100 iop 100 100 100 100 100 100 100 100 100 100 100 100 100
F orm al rate p o licy ___________ ____ 67 58 67 73 50 70 47 63 75 63 51 65 62 57 44 64 58 58 75 41
Single ra te— _ . — 16 8 j 7 _ 5 3 3 n 1 Z 6 3 5 4 11 1 (4 ) 2 2Range o f ra tes ------—— -_____ — 51 50 66 66 50 65 44 60 64 62 49 59 59 52 40 53 57 58 73 39
No form al rate policy— 33 42 33 26 50 30 53 37 19 37 45 29 27 40 56 34 40 42 22 59
Information not available as to -type of tim e payment ~ - <4 ) 1 - - ~ (4 ) 6 <4 ) 4 6 11 3 “ 2 2 “ 3
Plant workers
A ll plant w orkers _______ _________ 100 100 100 100 100 100 100 100 100 100 100 100 100 100 100 100 100 100 100 100
Paid tirtie rates------------------------------ 76 59 81 75 93j
54 55 79 61 85 79 74 63 73 68 60 74 65 72 67
F orm al rate p o licy ______ _____ 65 46 61 64 77 37 34 68 46 64 62 65 57 47 49 47 62 50 53 46
Single ra te ________________— 38 27 22 40 52 11 16 41 24 34 31 40 41 37 33 33 43 19 17 26Range o f rates 27 19 39 24 25 26 18 27 22 30 31 25 16 10 16 14 19 31 36 20
No form al rate p o licy .. 11 13 19 11 16 17 • 21 11 14 21 17 8 4 26 19 13 10 15 18 21
Information not available as totype o f tim e payment - - 1 - - “ “ (4 ) 1 “ ■ 1 2 " ■ 2 “ 1 “
Paid by incentive methods 24 41 19 24 7 46 45 20 28 12 19 23 36 23 32 39 26 35 28 33
P iece rate . _ 17 26 9 4 4 23 44 8 15 5 7 12 8 6 15 37 9 17 21 16
Individual__________________ 16 22 8 4 4 23 44 7 14 4 6 n 6 6 13 36 7 14 18 12Group ----------------------------------- 1 4 1 (4 ) - <4 ) (4 ) 1 1 1 1 1 2 - 2 1 2 3 3 4
Production bonus 5 2 8 12 2 22 (4 ) 11 11 3 11 7 14 15 15 1 13 18 5 16
Individual — 2 2 6 7 l 2 <4 ) 9 9 2 8 4 5 6 12 1 10 14 4 13G rou p ----------------------------------- 3 (4 ) 2 5 1 20 2 2 1 3 3 9 9 3 - 3 4 1 3
C om m is s ion _ -------------- ------------ 2 1 2 2 1 1 1 1 2 4 1 3 4 2 2 1 3 (4 ) 1 1
Information not available as totype o f incentive paym ent----- - 12 - 6 - - " (4 ) (4 ) " " 1 10 ■ ~ - 1 * 1
Information not available as totype o f rate structure — (4 ) 1 1 3 2 3 4
See footnotes at end of table,
Digitized for FRASER http://fraser.stlouisfed.org/ Federal Reserve Bank of St. Louis

93
Table B-33. Rate Structure Characteristics—All Industries— Continued
(P ercent distribution o f o ffice and plant w orkers by type o f rate structure 1 in 6 broad industry divisions studied, July 1961 through June 1963)
Item
South
Atlanta B altim o r e 2
Beaumont—Port
Arthur
Birm ingham
Charleston,
W. Va.Charlotte
Chattanooga 2Dallas 2 F ort
WorthG reen
ville Houston Jackson Jacksonville2
Little R ock - North
Little R ock 2L ou is
villeLubbock Memphis2M iami New
Orleans
Norfolk^ Portsmouth and Newport
N ews—Hampton
OklahomaC ity2
O ffice w orkers
A ll o ffice w orkers 3 100 100 100 100 100 100 100 100 100 100 100 100 100 100 100 100 100 100 100 100 100
F orm al rate po licy _ 66 73 50 40 72 46 56 57 61 37 43 46 59 43 52 40 55 31 43 47 48
Single rate _____________________ 4 2 2 5 3 2 5 2 5 l 7 2 9 3 7 6 5 2 7 4 1Range o f ra tes____ _______ _____ 62 71 48 35 69 44 51 55 56 36 36 44 5t) 40 45 34 50 29 36 43 47
No form al rate p olicy 33 27 40 45 26 54 44 43 39 63 56 54 41 57 48 60 45 69 57 53 52
Inform ation not available as totype o f tim e payment __ 1 " 10 15 2 ” “ (4 ) " “ ’ 1 " " ■ " " • ■ " “
Plant w orkers
A ll plant w orkers 100 100 100 100 100 100 100 100 100 100 100 100 100 100 100 100 100 100 100 100 100
Paid tim e rates-------------------- ------- 80 80 79 69 85 81 78 90 89 70 88 80 87 85 81 87 80 91 87 63 81
F orm al rate policy 59 65 64 45 69 42 66 59 59 53 62 50 55 60 69 46 56 59 59 36 55
Single rate __ 30 37 49 30 31 24 44 14 i i 41 41 22 34 50 49 23 34 25 46 22 25Range o f rates — ,--------,------- 29 28 15 15 38 18 22 45 38 12 21 28 21 10 20 23 22 34 13 14 30
No form al rate po licy 21 15 12 21 14 39 12 31 30 17 26 30 32 25 12 41 24 32 28 27 26
Inform ation not available as totype o f tim e p aym en t___j.____ - - 3 3 2 - - - - - - - - * - - - - - - -
Paid Hy incentive m ethods _ 18 20 5 30 15 19 22 9 11 30 12 20 13 15 19 13 20 9 13 37 19
P iece rate______________________ 9 5 (4 ) 6 1 13 17 4 2 26 3 4 5 10 13 1 11 3 5 3 8
Individual----------------------------- 8 5 (4 ) 4 12 15 3 22 1 3 5 9 10 1 8 3 5 3 2Group 1 <4 ) <4 ) 2 <4 ) 1 2 1 1 4 2 1 (4 ) 1 3 - 3 - - (4 ) 6
Production bonus_______________ 3 13 1 3 10 1 2 1 5 Z 2 9 1 - 3 3 3 2 1 29 (4 )
Individual----------------------------- l 4 1 2 7 l j l 3 2 2 7 1 _ 2 3 2 2 l 29 (4 )G rou p ----------------------------------- 2 9 - 1 3 (4 ) 1 - 2 <4 ) (4 ) 2 (4 ) - 1 <4 ) 1 <4) <4 ) (4)
C om m ission 6 2 4 4 4 5 3 4 4 2 7 7 7 5 3 9 6 4 7 5 11
Inform ation not available as totype o f incentive p aym en t----- - - - 17 - - - - - “ - - - - - - . - “ -
Inform ation not available as totype o f rate structure---- ------------ 2 16 1 1 (4 )
See footnotes at end of table.
Digitized for FRASER http://fraser.stlouisfed.org/ Federal Reserve Bank of St. Louis

94
(Percent distribution o f o ffice and plant w orkers by type o f rate structure 1 in 6 broad industry divisions studied, July 1961 through June 1963)
Table B-33. Rate Structure Characteristics—A ll Industries——Continued
Item
South— C ontinued North Central
Raleigh R ichm ond2
SanAntonio 2
Savannah2
Washington 2 Akron Canton Chicago2 Cincin
natiC leveland2 Columbus
D avenport- Rock Island—
MolinaDayton Des
Moines D etroit2 G reenBay
Indianapolis 2
KansasCity Milwaukee
Minneapolis— St. Paul
Muskegon—Muskegon
Heights
A ll o ffice w orkers 3
O ffice workers
100 100 100 100 100 100 100 100 100 100 100 100 100 100 100 100 100 100 100 100 100
Form al rate policy 64 56 42 53 66 81 69 57 67 68 74 65 67 44 77 49 61 58 80 60 60
Single rate 3 9 2 17 6 2 6 5 2 4 2 3 2 j 2 5 3 5 j 6 1Range o f rates _ 61 47 40 36 60 79 63 52 65 64 72 62 65 43 75 44 58 53 79 54 59
No form al rate policy 36 43 58 47 34 19 31 41 33 30 26 35 33 55 23 51 39 42 20 40 40
Information not available as totype o f tim e paym ents __ _ “ 1 " (4) - - - 2 " 2 - - “ 1 - - (4 ) - - - <4 )
Plant w orkers
A ll plant w orkers __ 100 100 100 100 100 100 100 100 100 100 100 100 100 100 100 100 100 100 100 100 100
Paid time rates _ _ _ 85 85 88 92 92 70 66 75 79 74 79 66 81 76 91 83 74 80 67 86 62
Form al rate policy 48 61 35 70 68 65 61 69 67 67 68 52 73 61 85 71 58 69 62 79 58
Single rate 22 49 18 61 25 35 40 31 40 32 21 25 37 39 60 44 32 40 34 43 31Range of rates ____ 26 12 17 9 43 30 21 38 27 35 47 27 36 22 25 27 26 29 28 36 27
No form al rate policy__________ 37 24 53 22 24 5 5 5 12 7 11 14 8 15 6 12 16 11 5 7 4
Information not available as totype of tim e payment - - - - - - 1 “ <4 ) - - - - - - - - - - -
Paid by incentive methods_________ 15 14 12 7 8 30 25 25 21 25 21 34 19 20 9 17 25 20 33 14 37
P iece rate-------------------- - ---------- 7 6 6 3 1 17 7 8 8 8 8 12 13 10 2 10 7 7 11 3 11Individual r. , x 7 6 6 3 (4 ) 16 4 6 7 7 6 11 9 9 2 8 5 5 10 3 6Group------------------------------------- - (4) <4 ) (4 ) 1 3 2 1 1 2 1 4 <4 ) 2 2 2 (4 ) 5
P rod u ction hnnna <4) 3 1 1 1 11 17 12 10 13 10 20 4 3 4 6 13 7 20 7 25Individual ______ ___________ (4) 2 <4)
(4 )1 10 6 6 6 6 3 12 3 2 1 3 3 3 u 5 4
Group 1 - 1 U 6 4 7 7 8 1 1 3 3 10 4 9 2 21C o m m is s io n ~ . . 8 5 5 3 6 2 1 4 3 3 3 2 2 7 3 1 5 6 2 4 1Information not available as to
type o f incentive payment___... - - - - - - 1 - 1 - - - - - - -Information not available as to
type o f rate structure 1 1 9 (4 ) 4 1 1
See footnotes at end of table.
Digitized for FRASER http://fraser.stlouisfed.org/ Federal Reserve Bank of St. Louis

95
(P ercent distribution of office and plant w orkers by type of rate structure 1 in 6 broad industry divisions studied, July 1961 through June 1963)
Table B-33. Rate Structure Characteristics—A ll Industries-----Continued
North Central— Continued West
ItemOmaha1 2 Rockford St. Louis2 Sioux
FallsSouthBend Toledo W aterloo Wichita Albu
querque Boise DenverLos
Angeles-^ Long '
B each2Phoenix2 Portland
SaltLakeCity
SanB ernard ino-Riverside—
Ontario
SanDiego
SainF ra n cisco - Oakland 2
Seattle2Spokane
O ffice w orkers
All office workers 3 ------ 100 100 100 100 100 100 100 100 100 100 100 100 100 100 100 100 100 100 100 100
71 47 63 39 74 78 69 76 69 50 71 79 63 65 46 74 76 75 83 67
Single rate, ....... 17 1 9 3 2 5 4 1 2 4 4 3 3 8 5 7 2 7 5 12Range of rates. 54 46 54 36 72 73 65 75 67 46 67 76 60 57 41 67 74 68 78 55
No form al rate p olicy 28 53 37 61 26 22 31 24 31 50 29 21 37 35 54 26 24 25 17 33
Information not available as totype Of tim e payment ---------------------- 1 ■ ■ - “ ■ - ■ - - “ - - " ‘ - (4) r
Plant w orkers
All plant workers 100 100 100 100 100 100 100 100 100 100 100 100 100 100 100 100 100 100 100 100
75 62 82 93 73 77 56 90 90 90 81 92 87 89 93 82 94 90 96 90
Formal rate policy 57 50 79 73 69 73 52 73 79 76 65 86 63 84 70 71 85 88 95 81
Single rate 37 7 49 64 44 54 20 50 40 33 39 45 33 70 52 35 26 64 84 7320 43 30 9 25 19 32 23 39 43 26 41 30 14 18 36 59 24 11 8
No form al rate p o licy __________ 18 12 3 20 4 4 4 17 11 14 16 6 24 5 23 11 9 2 1 9
Inform ation not available as totype of tim e payment - ~ - - - - - - - - " - - - - - - (4) - -
Paid by incentive m ethods------------- 21 38 18 7 27 23 44 10 10 10 19 8 13 11 7 18 6 10 4 10
Piece rate 6 22 9 1 12 7 25 - 1 1 6 3 3 3 2 4 2 1 1 -
Individual -------------- 5 20 7 1 7 5 20 _ (4) l 5 3 3 3 2 3 2 1 ! .G roup-------------------------- ----------- 1 2 2 - 5 2 5 - (4) <4) 1 (4) - (4) (4) 1 - (4) - -
Production bonus ------------------ 8 13 8 1 12 *12 17 4 3 3 4 3 4 1 - 11 (4) 2 1 3
Individual ■ ---------- -- 2 11 3 1 7 4 15 3 3 3 2 2 2 (4) 3 (4) 1 (4) 2G rou p. 6 2 5 - 5 8 2 1 (4) - 2 1 2 1 - 8 (4) 1 (4) 1
Conrymission _ ............. 7 3 1 5 3 4 2 6 6 6 9 2 6 7 5 3 4 6 2 7
Information not available as totype o f incentive payment---------- “ - - - - - - - - - - - - - 1 - •
Information not available as totype of rate stru ctu re . 4
1 F or a description of the types o f rate structure, see appendix A, p. 103.2 Exceptions to the standard industry lim itations are shown in footnotes 4, 5, 7, and /or 11 to the table in appendix A.3 Relates to tim e-ra ted w ork ers.4 L ess than 0.5 percent.
Digitized for FRASER http://fraser.stlouisfed.org/ Federal Reserve Bank of St. Louis

96
(Percent distribution o f office and plant w orkers by type o f rate stru ctu re ,1 July 1961 through June 1963)
Table B-34. Rate Structure Characteristics—Manufacturing
Item
NortheastAlbany—
Schenectady—T roy
Allentown—Bethlehem—
EastonBoston Buffalo B url
ington
Lawrence— H aver-
hill
Manchester
Newarkand
JerseyCity
NewHaven
NewYork
Paterson—Clifton^-Passaic
Philadelphia
P ittsburgh
P o rtland
P ro v id e n ce - Paw - tucket
Scranton Trenton W ater-
buryW orces
ter York
O ffice w orkers
All o ffice w orkers 2_______________ 100 100 100 100 100 100 100 100 100 100 100 100 100 100 100 100 100 100 100 100
Form al rate p o licy _______________ 63 60 69 78 68 78 19 61 59 65 64 65 53 56 42 66 69 60 63 47
Single rate . . . . __ . . . . 29 1 _ 1 _ _ 4 2 ( 3) (3) 2 . 1 (3) . 3 _ 1 . - -Range o f rates __ __ 34 59 69 77 68 78 15 59 59 65 62 64 53 56 39 66 68 60 63 47
No form al rate policy_____________ 37 40 31 20 32 22 81 39 23 35 31 27 24 41 58 34 28 40 32 53
Information not available as to ..type o f time payment _ " - 2 - - - - 18 - 5 8 23 3 - - 3 5
Plant workers
All plant w ork e rs____ ____________ 100 100 100 100 100 100 100 100 100 100 100 100 100 100 100 100 100 100 100 100
Paid time rates________________ __ 69 52 71 69 92 51 45 74 49 82 78 69 56 63 63 52 69 61 67 61
Form al rate p o lic y ____________ 64 42 61 64 85 38 30 64 39 61 59 64 52 47 44 45 63 . 49 49 46
Single ra te . . . . . . . . . . 46 24 22 41 62 10 14 39 18 31 34 40 41 40 31 32 48 18 14 26Range o f ra te s_____________ 18 18 39 23 23 28 16 25 21 30 25 24 11 7 13 13 15 31 35 20
No form al rate policy_________ 5 10 10 5 7 13 15 10 9 21 19 4 1 16 19 7 4 12 16 15
Information not available as totype o f time paym ent________ - - - ' - 1 " “ 1 3 - “ - 2 " 2 "
Paid by incentive methods________ 31 4 48 29 4 30 8 49 55 26 35 4 17 4 22 29 44 37 37 48 4 31 39 33 39
P iece r a t e _____________________ 24 31 16 5 6 25 55 11 20 11 8 17 11 12 19 48 12 19 25 20
Individual__________________ 22 27 13 5 6 25 55 10 18 10 7 15 8 12 16 47 9 16 21 15Group ____ 2 4 3 (3) - (3) (3) 1 2 1 1 2 3 3 1 3 3 4 5
Production bonus . . . . . . . . . . . . . . . . . . 7 3 13 16 2 24 (3) 15 14 6 14 10 19 25 18 (3) 17 20 6 19
Individual __ __ . . 3 3 9 9 1 2 (3) 12 12 3 10 5 7 10 14 (3) 13 15 5 15Group------------------------------------ 4 (3) 4 7 1 22 3 2 3 4 5 12 15 4 - 4 5 1 4
Information not available as totype o f incentive paym ent___ " 14 - 9 - - (3) 1 - 2 14 ~ - ~ 1 " 2
Information not available as totype o f rate structure 1 16 2
See footnotes at end of table.
Digitized for FRASER http://fraser.stlouisfed.org/ Federal Reserve Bank of St. Louis

97
(Percent distribution of office and plant w orkers by type of rate s tru ctu re ,1 July 1961 through June 1963)
Table B-34. Rate Structure Characteristics—Manufacturing---- Continued
South
ItemAtlanta Balti
m ore
Beaumont—P ort
Arthur
Birmingham
Charleston
W. Va.Charlotte
Chattanooga Dallas Fort
WorthG reen
ville Houston Jackson Jacksonville
Little R ock - North
Little RockLouis - v ille
Lubbock Memphis M iami New
Orleans
Norfolk— Portsmouth and Newport
New s—Hampton
OklahomaCity
O ffice w orkers
A ll o ffice w o rk e rs 2— — _ _ 100 100 100 100 100 100 100 100 100 100 100 100 100 100 100 100 100 100 100 100 100
F orm al rate p o l ic y ____________ __- 61 79 56 32 88 49 45 67 75 35 41 53 17 30 64 5 40 16 54 59 64
Single ra te _____________________ 2 3 3 5 _ 1 _ 1 2 - 3 2 1 3 14 2 _ 1 4 _ _Range o f rates _ _ 59 76 53 27 88 48 45 66 73 35 38 51 16 27 50 3 40 15 50 59 64
No form al rate po licy_____________ 39 21 25 29 9 51 55 33 25 65 53 47 83 70 36 95 60 84 46 41 36
Information not available as totype o f time payment - - 19 39 3 " “ " 6 " " “ ■ ” ~ ■ ■ ■ ■
Plant w orkers
A ll plant w ork ers . . . . 100 100 100 100 100 100 100 100 100 100 100 100 100 100 100 100 100 100 100 100 100
Paid tim e rates____ _______________ 76 74 78 61 85 75 77 91 88 68 92 77 85 81 78 97 77 88 87 45 80
F orm al rate p o l ic y ____________ 66 70 70 47 78 43 74 74 72 56 82 60 59 68 73 53 65 45 69 36 62
Single r a te __________________ 37 45 59 33 33 28 50 14 24 47 55 25 54 59 53 36 47 22 56 23 31Range o f ra te s ______________ . 29 25 11 14 45 15 24 60 48 9 27 35 5 9 20 17 18 23 13 13 31
No form al rate p olicy - 10 4 4 10 4 32 3 17 16 12 10 17 26 13 5 44 12 43 18 9 18
Information not available as totype o f time payment - “ 4 4 3 - “ " - - ■ ~ " " “ _ • ~ “
Paid by incentive m ethods________ 4 23 26 1 39 15 25 23 9 4 12 32 8 23 15 19 22 3 4 23 12 13 55 20
P iece r a t e _____ _____ _________ 18 8 - 9 - 25 20 8 3 30 7 7 13 19 18 2 19 9 11 6 20
Individual_____ __-_______ __ 16 8 _ 6 _ 24 18 6 1 26 1 7 13 17 14 2 12 9 11 6 3Group----------------- — --------------- 2 (3) 3 - 1 2 2 2 4 6 ' - 2 4 - 7 - - (3) 17
Production bonus— __ 5 18 1 4 15 (3) 3 1 . 9 2 1 16 2 - 4 1 4 3 2 49 (3)
Individual_____ _____________ l 5 1 2 11 01 1 4 2 1 12 2 _ 3 _ 2 3 (3) 48 (3)
Group------------------------------------ 4 13 " 2 . 4 (3) 2 - 5 (3) (3) 4 (3) - 1 1 2 (3) 2 1 -
Information not available as totype o f incentive p aym en t___ - - - 26 - - - - - - - - • ~ " • "
Information not available as totype o f rate structure___________ 1 21
See footnotes at end of table,
Digitized for FRASER http://fraser.stlouisfed.org/ Federal Reserve Bank of St. Louis

98
(Percent distribution o f o ffice and plant w orkers by type o f rate stru ctu re ,1 July 1961 through June 1963)
Table B-34. Rate Structure Characteristics—Manufacturing— Continued
Item
South-C ontinued North Central
Raleigh R ich mond
SanAntonio
Savannah
W ashington Akron Canton Chicago Cincin
natiC leve
land ColumbusD avenport-
Rock Island— Moline
Dayton DesMoines Detroit G reen
BayIndianapolis
KansasCity Milwaukee
Minne - apolis— St. Paul
Muskegon—Muskegon
Heights
O ffice w orkers
A ll o ffice w orkers 2_______________ 100 100 100 100 100 100 100 100 100 100 100 100 100 100 100 100 100 100 100 100 100
Form al rate policy 5.9 43 30 20 50 90 76 59 64 73 73 78 75 53 85 49 72 61 83 64 68
Single ra te ----------------------- -------- 2 _ _ _ 7 1 4 1 _ (3) _ (3) 1 _ (3) . _ _ _ 1 _Range o f rates — . - 57 43 30 20 43 89 72 58 64 73 73 78 74 53 85 49 72 61 83 63 68
No form al rate policy__—____ ____ 41 57 70 80 50 10 24 38 36 24 27 22 25 44 15 51 28 39 17 36 32
Information not available as totype o f tim e paym ent-------- -------- " “ ” " 3 3 “ ■ “ 3 " “ " " ■ ■ (3)
Plant w orkers
All plant W orkers — 100 100 100 100 100 100 100 100 100 100 100 100 100 100 100 100 100 _J00__ 100 100 100
Paid tim e ra tes ..__. . . ____________ 86 87 84 96 100 64 60 68 75 70 73 58 80 70 93 78 70 76 60 83 59
Form al rate policy _______ ____ 59 74 45 87 82 62 59 63 67 66 67 50 75 63 91 74 62 69 56 79 57
Single rate 29 67 34 80 49 37 44 24 44 31 21 18 43 44 72 47 38 42 32 36 32Range o f rates . —— 30 7 11 7 33 25 15 39 23 35 46 32 32 19 19 27 24 27 24 43 25
No form al rate p o licy ..________ 27 13 59 9 18 2 1 4 8 3 6 8 5 7 2 4 8 7 4 4 2
Information not available as totype Of time paym ent------------ - - - •- “ “ - 1 - 1 “ " * ■ " “ " “ ■
Paid by incentive methods________ 14 13 4 16 4 - 36 29 32 425 30 27 42 4 20 23 7 22 30 4 24 40 17 40
P iece rate . . . . 13 9 15 4 - 23 8 12 11 11 12 16 15 18 2 14 9 12 15 6 12
Individual 13 9 15 4 _ 22 4 10 10 10 9 15 10 17 1 12 6 9 14 5 7- (3) <3) (3) - 1 4 2 1 1 3 1 5 1 1 2 3 3 1 1 5
Production b o n u s .... .. .. . ,—. . . . . . 1 4 - - - 13 21 19 14 18 15 26 5 5 5 8 21 12 25 11 28
Individual l 3 _ _ _ 12 7 8 9 8 5 16 4 4 1 4 3 4 14 7 5Group— - 1 - - - 1 14 11 5 10 10 10 1 1 4 4 18 8 11 4 23
Information not available as totype o f incentive payment — - - - “ - - " 1 ■ 1 “ “ “ “ “ ” “
Information not available as totype o f rate structure—____ ____ 11 (3) 7 1
See footnotes at end of table.
Digitized for FRASER http://fraser.stlouisfed.org/ Federal Reserve Bank of St. Louis

(Percent distribution o f o ffice and plant w orkers by type o f rate s tru ctu re ,1 July 1961 through June 1963)
Tabic B-34. Rate Structure Characteristics—Manufacturing— Continued
99
North Central— Continued West
ItemOmaha Rockford St. Louis Sioux
FallsSouthBend Toledo W aterloo Wichita Albu
querque Boise DenverLos
A n g e les -LongBeach
Phoenix PortlandSalt
LakeCity
SanBernardino—Riverside—
Ontario
SanDiego
SanFrancis c o -
OaklandSeattle Spokane
O ffice w orkers ‘
A ll o ffice w orkers 1 2 100 100 100 100 100 100 100 100 100 100 100 100 100 100 100 100 100 100 100 100
Form ed rate p o licy — 51 60 72 50 83 85 79 90 52 i 76 88 73 46 73 82 88 69 91 46
Single ra te ______________________ _ 2 2 5 2 _ _ _ _ 1 _ 1 4 _ 4 7 1 4 1 7Range o f rates —___. . . 51 58 70 45 81 85 79 90 52 - 76 87 69 46 69 75 87 65 90 39
No form al rate p olicy__-______ _ 44 40 28 50 17 15 21 10 48 99 24 12 27 54 27 18 12 29 9 54
Inform ation not available as totype o f tim e payment — 5 “ “ “ “ “ “ " " " “ ” “ " ** “ “ 2 “ "
Plant w orkers
A ll plant w o rk e rs_________________ 100 100 100 100 100 100 100 100 100 100 100 100 100 100 100 100 100 100 100 100
Paid tim e rates 67 58 77 99 73 71 50 95 99 99 78 90 89 93 96 76 98 91 99 93
F orm al rate p olicy 56 52 76 87 71 71 . 49 89 92 74 68 87 83 90 80 72 92 90 99 93
Single rate 39 6 42 84 47 63 16 63 49 73 47 33 42 74 58 30 16 80 96 93Range o f rates 17 46 34 3 24 8 33 26 43 1 21 54 41 16 22 42 76 10 3 -
No form al rate po licy— _______ 11 6 1 12 2 (3 4) 1 6 7 25 10 3 6 3 16 4 6 1 (3) -
Inform ation not available as totype o f tim e payment - - - “ - - - - - “ ■ - - - - - - (3.) “
26 42 23 1 27 29 50 5 1 1 22 4 10 11 7 4 24 2 9 1 7
P iece rate 10 27 12 1 15 11 30 - 1 1 13 4 8 5 4 7 2 3 (3) -
Individual ______ __—_______— 7 24 10 1 9 8 24 - 1 1 13 4 8 5 4 5 2 3 (?) _Group—__——_________________ 3 3 2 “ 6 3 6 - - (3) (3) (3) - <3) (3) 2 (3) “
Production bonus,___ _____— ----- 16 15 11 - 12 18 20 5 (3) - 9 5 3 2 - 17 4 1 7
Individual — 3 13 3 _ 7 . 6 18 3 (3) _ 3 3 . - - 3 2 <3 ) 4Group— ___ 13 2 8 - 5 12 2 2 (3 ) “ 6 2 3 2 - 14 - 2 1 3
Inform ation not available as totype o f incentive payment____ - - - - - - - - - - - - ' 2
Inform ation not available as totype o f rate structure— ________ 7
1
1 F or a descrip tion o f the types o f rate structure, see appendix A, p . 103.2 Relates to tim e-ra ted w ork ers.3 Less than 0. 5 percent.4 Includes som e com m ission paid w orkers.
Digitized for FRASER http://fraser.stlouisfed.org/ Federal Reserve Bank of St. Louis

Digitized for FRASER http://fraser.stlouisfed.org/ Federal Reserve Bank of St. Louis

Appendix A: Scope and Method of Survey
Occupational pay data for each area are collected annually. In Boston, Chicago, Los Angeles—Long Beach, New York, Philadelphia, and San F ra n cisco—Oakland, the data are collected by personal v isits of Bureau fie ld econom ists each year except for som e of the sm aller establishm ents. In these establishments, data are obtained by m ail in alternate years if the last survey indicated employment in relatively few of the occupations studied. Occupational pay data in the other 76 areas are collected by personal visits of Bureau field econom ists to all establishm ents in the sample at 2-year intervals and by a com bination of personal visits and m ail, prim arily the latter, in the intervening years.
Supplementary wage practices are covered only in the surveys conducted through fie ld economists* visits. Of the 82 areas covered in this report, 39 involved this type of survey. In the other areas, data w ere obtained ch iefly by m ail questionnaire, from the establishments visited by fie ld econom ists in the regular fu ll-sca le survey made in 1961—62. P ersonal visits were made to nonrespondents and to those respondents reporting unusual changes since the previous survey. F u ll-sca le em ploym ent and earnings inform ation (A tables) w ere obtained, but no data w ere requested for current establishment practices or supplementary wage provisions.
Industry and Establishm ent Coverage
A rea survey data w ere obtained from representative establishments within six broad industry divisions: (1) Manufacturing; (2) transportation, com m unication, and other public utilities; (3) wholesale trade; (4) retail trade; (5) finance, insurance, and real estate; and (6) selected serv ices . Excluded from the scope of the studies were government institutions 5 and the construction and extractive industries.
The scope of the studies was further limited within each of the six m ajor industry groupings to establishments which em ployed m ore than a specified minimum number of w orkers, as indicated in the table on page 105. Sm aller establishments were omitted because they tended to furnish insufficient employment in the occupations studied to warrant inclusion.
Sampling and Estim ating P rocedures
M ore than 12,000 establishments were included in the Bureau's sample selected to represent over 46, 000 establishments within the scope of the studies in the 82 areas.
5 See footnote 4 to the table (p. 106) for areas in which public utilities were municipally operated and have been excluded.
Eighty of the 82 areas surveyed are Standard Metropolitan Statistical A reas. These 80 areas are part of a sample design which, when the areas are appropriately weighted, w ill perm it the preparation of estim ates for the com posites of all 212 Standard Metropolitan Statistical A reas in the United States, as established by the Bureau of the Budget through 1961. Such estim ates are not a part of this bulletin, but w ill be released in the forthcom ing second summary bulletin.
The present sampling plan can be described as a two-stage design consisting of an area sample and an establishment sample. The area sample is designed to allow presentation of data for all m etropolitan areas and the establishment sample is designed to allow presentation of data for each particular area.
The area sample of 80 areas was based upon the selection of 1 area from a stratum of sim ilar areas. The criteria of stratification w ere region and type of industrial activity. Each area had a chance of selection roughly proportionate to its total nonagricultural em ployment. Each of 37 large areas form ed a stratum by itself, and was certain of inclusion in the sample. Each of these areas represented only itself, but each of the 43 other areas represented itself and sim ilar units.
The establishment sample is stratified as p recise ly as available inform ation perm its. Each geographic-industry unit for which a separate analysis is to be presented is sampled independently. Within these broad groupings, a finer stratification by product and size of establishment is made. Each sampled stratum w ill be represented in the sample by a number of establishments proportionate to its share of the total employment. The size of the sample in a particular survey depends on the size of the universe, the d iversity of occupations and their distribution, the relative dispersion*'of earnings among establishm ents, the distribution o f establishments by size, and the degree of accuracy required.
To obtain optimum accuracy at minimum cost, a greater p roportion of large than of sm all establishments was studied; however, all establishments w ere given their appropriate weight. Estimates are presented, therefore, as relating to all establishments in the industry grouping and area, but not to those below the minimum size studied; an exception, however, is the tabulation of minimum entrance rates, which relates solely to provisions in the establiShments actually visited.
101
Digitized for FRASER http://fraser.stlouisfed.org/ Federal Reserve Bank of St. Louis

102
Occupational Earnings
W orkers were classified by occupation on the basis of uniform job descriptions designed to take account of minor inter establishment variation in duties within the same job ; these job descriptions are listed in appendix B.
A verage earnings are presented in the A tables, beginning on page 9. Data are shown for fu ll-tim e w orkers; i .e ., those hired to work a fu ll-tim e schedule for the given occupational classification . Earnings data exclude prem ium pay for overtim e and nightwork, and for work on weekends and holidays. Nonproduction bonuses are ex cluded, but cost-o f-liv in g bonuses‘and incentive earnings are included. Average weekly earnings for office c lerica l, professional, and tech nical occupations relate to the standard salaries that were paid for standard work schedules; i .e ., to the straight-tim e salary c o r r e sponding to the workers* norm al weekly work schedule excluding all overtim e hours. Weekly earnings w ere rounded to the nearest half dollar.
Trends of Occupational Earnings
The percentages of change presented in tables 3 and 4 (pages 7 and 8) are p rim arily m easures of (1) general salary and wage changes, (2) m erit or other increases in pay received by individual w orkers while in the same job , and (3) changes in average wages due to changes in the labor force . Changes in the labor fo rce could consist of labor turnover, fo rce expansions, fo rce reductions, as w ell as changes in the proportion of w orkers employed by establishments with different pay levels. Changes in the proportions of w orkers within an occupation have no effect because constant employment weights are used.
F or office c ler ica l w orkers and industrial nurses, the p er centages of change relate to average weekly salaries for norm al hours of work, that is , the standard work schedule for which straight-tim e salaries are paid. For plant w orker groups, the changes relate to straight-tim e average hourly earnings, excluding prem ium pay for overtim e and for work on weekends, holidays, and late shifts. The percentages of change are not influenced by changes in standard work schedules, as such, or by prem ium pay for overtim e.
To compute area wage changes, average weekly salaries or average hourly earnings for each of the selected occupations were multiplied by the 1961 employment (an average of 1953 and 1954 em ployment was used in the 1953-63 se r ie s— table 4) in that job. These weighted earnings w ere totaled for each occupational group and com pared with the corresponding aggregate of the previous year to arrive at the percentage change in earnings.
The new trend series is following occupations:
Office clerical (men and women)
Bookkeeping-machine operators, class BClerks, accounting, classes A and BClerics, file, classes A , B, and CClerics, orderClerics, payrollComptometer operatorsKeypunch operators, classes A and BOffice beys and girlsSecretariesStenographers, general Stenographers, senior Switchboard operators Tabulating-machine operators, class B Typists, classes A and B
based on 1961 em ploym ent in the
Skilled maintenance (men)
CarpentersElectriciansMachinistsMechanicsMechanics (automotive)PaintersPipefittersTool and die makers
Unskilled plant (men)
Janitors, porters, and cleaners
Laborers, material handling
The old series based on 1953—54 employm ent was restricted to women in the office clerica l and industrial nurse groups and d iffered somewhat in occupations used.
Establishment P ractices and Supplementary Wage P rovisions
Information is presented (in the B tables) on selected establishment practices and supplementary benefits as they relate to office and plant workers in 39 areas. A dm inistrative, executive, and p ro fessional em ployees, and force -accou n t construction w orkers who are utilized as a separate work force are excluded. "O ffice w orkers" in clude working supervisors and nonsupervisory w orkers perform ing c ler ica l or related functions. "P lant w ork ers" include working forem en and all nonsupervisory w orkers (including leadm en and trainees) engaged in nonoffice functions. Cafeteria w orkers and routemen are excluded from manufacturing industries, but included in nonmanufacturing industries.
Because of rounding, sums of individual item s in these tabulations may not equal totals.
Minimum Entrance Salaries. Tables B - l and B -2 relate only to the establishments in each area sam ple. They are presented in term s of establishments with form al minimum entrance salary p olicies . The detailed tables in the individual area bulletins also present data for nonmanufacturing industries as a group; the entrance salaries are a lso presented in term s of the m ost com m on workweeks for which they w ere recorded.
The scheduled hours (tables B -3 through B -9) of a m ajority of the first-sh ift w orkers in an establishm ent are tabulated as applying to all of the plant or office w orkers of that establishment.
Digitized for FRASER http://fraser.stlouisfed.org/ Federal Reserve Bank of St. Louis

Shift differential data (tables B -10 and B - l l ) are lim ited to manufacturing industries. This information is presented both in term s of (a) establishm ent policy , 6 presented in term s of total plant worker em ploym ent, and (b) effective practice , presented in term s of w orkers actually em ployed on the specified shift at the time of the survey. In establishm ents having varied differentials, the amount applying to a m ajority was used or, if no amount applied to a m ajority, the c la s sification ’ 'other" was used. In establishments in which som e late-sh ift hours are paid at norm al rates, a differential was recorded only if it applied to a m ajority of the shift hours.
Paid holidays, paid vacations, and health, insurance, and pension plans are treated statistically on the basis that these are applicable to all plant or o ffice w orkers if a m ajority of such w orkers are eligib le or m ay eventually qualify for the practices listed.
The paid holidays tables present the number of whole and half holidays actually provided. Table B -12a (all industries) combines whole and half holidays to show total holiday time.
The sum m ary of vacation plans (tables B-19 through B-25) is lim ited to form al p o lic ies , excluding inform al arrangements whereby time off with pay was granted at the discretion of the em ployer. In the tabulations of vacation allowances by weeks of pay and years of serv ice , payments not on a time basis were so converted; for example, a payment of 2 percent of annual earnings was considered as the equivalent of 1 w eek 's pay. The pay amounts and serv ice period for which data are presented are typical but do not necessarily re flect the individual provisions for progressions. F or example, the changes in proportions indicated at 10 years ' service include changes in p ro visions occurring between 5 and 10 years. Furtherm ore, estim ates are cumulative. Thus, the proportion receiving 3 or m ore w eeks' pay after 5 years includes those who receive 3 or m ore w eeks' pay after few er years of serv ice . Data for intermediate service periods were not tabulated. Data on em ployer practice in computing vacation payments, such as tim e payments, percent of annual earnings, or fla t- sum amounts, are available in the individual area bulletins.
Data are presented for all health, insurance, and pension plans (tables B -26 through B-32) for which at least a part of the cost was borne by the em ployer, excepting only legal requirem ents such as w orkm en's com pensation, railroad retirem ent, and socia l security. Such plans included those underwritten by a com m ercial insurance
An establishment was considered as having a policy if it met eidler of the following conditions: (1) Operated late shifts at the time o f the survey, or (2) had formal provisions covering late shifts. An establishment was considered as having formal provisions if it (1) had operated late shifts during the 12 months prior to the survey, or (2) had provisions in written form for operating late shifts.
103
company and those provided through a union fund or paid d irectly by the em ployer out of current operating funds or from a fund set aside for this purpose. Death benefits w ere included as a form of life insurance.
Sickness and accident insurance data are lim ited to that type of insurance under which predeterm ined cash payments were made directly to the insured on a weekly or monthly basis during illness or accident disability. Information is presented for all such plans to which the em ployer contributes. In New York City and New Jersey, however, which have enacted tem porary disability insurance laws which require em ployer contributions,7 plans w ere included only if the em ployer (1) contributed m ore than was legally required, or (2) provided the em ployee with benefits which exceed the requirem ents of the law. Tabulations of paid sick leave plans are lim ited to form al plans which provided full pay or a proportion of the w ork er 's pay during absence from work because of illness. Separate tabulations are presented a c cording to (1) plans which provided full pay and no waiting period, and (2) plans which provided either partial pay or a waiting period. Sick leave plans include only those which definitely established at least the minimum number of days' pay that could be expected by each employee. Informal sick leave allowances determined on an individual basis were excluded. In addition to the presentation of the proportions of w orkers who are provided sickness and accident insurance or paid sick leave, an unduplicated total is shown of w orkers who rece ived either or both types of benefit.
Catastrophe insurance, som etim es referred to as extended m edical insurance, includes those plans which w ere designed to p ro tect em ployees in case of sickness and injury involving expenses be yond the norm al coverage of hospitalization, m edical, and surgical plans. M edical insurance re fers to plans providing for complete or partial payment of doctors ' fees. Such plans might be underwritten by com m ercia l insurance companies or nonprofit organizations or they might be self-insured* Tabulations of retirem ent plans are limited to those plans that provided monthly payments for the remainder of the w ork er 's life .
Rate structure characteristics (tables B -33 and B-34) r e late to basic types of rate structures for w orkers paid under various time and incentive system s. Information is presented for tim e-rated w orkers under (1) form al— single rate plans, (2) form al— range of rates for the same job plans, and (3) informal-—individual determ ination; and for incentive paid w orkers under (1) p iecew ork system s, Jz] production bonus s y s t e m s , and (3) com m ission system s. A form al— single rate structure is one in which the same rate is paid
7 The temporary disability laws in California and Rhode Island did not require employer contribution.
Digitized for FRASER http://fraser.stlouisfed.org/ Federal Reserve Bank of St. Louis

104
to all w orkers in the same job classification , and the individual worker is paid the same rate during the entire time he is holding a job. An individual w orker may occasionally be paid above or below the single rate for special reasons, but such payments are regarded as excep tions. A form al— range of rates structure is one in which the m inimum and maximum rates paid for the same job are specified, or the minimum or maximum paid is specified. Specific rates may be determ ined by m erit, length of serv ice , or a combination of various concepts of m erit and length of serv ice . Automatic progression from the minimum of the range to the maximum is common. An inform al— individual determination rate structure exists when the rates paid are set on an individual basis. The rates may be loose ly based either upon the job being done or upon the training, ability, or skill of the
individual worker. Incentive earnings are defined as those which depend upon the output of the individual w orker or a group of w orkers. P iecew ork is work for which a predeterm ined rate is paid for each unit of output. Production bonus w ork is w ork for which an extra payment is made for production in excess of a quota or for com pletion of a job in less than standard time.
Information in tables B -33 and B -34 relates to the actual proportion of w orkers paid under the various time and incentive sy s tem s. For example, if an establishment had a form al rate structure involving both single rates and ranges of rates for various jobs , the actual number of workers paid under each system was recorded.
Digitized for FRASER http://fraser.stlouisfed.org/ Federal Reserve Bank of St. Louis

105
M inim um -size establishment and estimated number of w orkers within scope o f survey by industry d ivision for 82 labor markets studied by the Bureau o f Labor Statistics, July 1962 through June 1963
M ini- Number o f w orkers in establishments within scope o f studies2 (in thousands)
Labor m a rk et1 Payrollperiod
sizeestablish ment
All industries Manufacturing Nonmanufacturing 3 Public u tilit ies4 W holesale trade Retail trade 9 Finance 6 Services 7
Total O ffice Plant Total O ffice Plant Total O ffice Plant Total O ffice Plant Total O ffice Plant Total O ffice Plant Total O ffice Total O ffice Plant
Northeast
Albany-Schenectady-Troy, N. Y 8 — M ar. 1963 50 93.3 _ _ 54.2 _ _ 39. 1 _ _ 12. 1 _ 3 .3 (9) (9) 12.7 (9) 5 .5 (9) 5 .5 (9) <9)Allentown—Bethlehem—Easton,Pa. —N. J 8 .....................- ............. Feb. 1963 50 104.0 - - 82.9 - _ 21. 1 _ _ 7 .6 _ _ 1.0 (9) (9) 7 .6 (9) (9) 2 .9 (9) 2 .0 (9) K9)Boston, M a ss_____ ____ . . — Oct. 1962 n 456.2 99.0 267.8 220.6 . 32. 0 149. 1 235.6 67.0 118.7 41 .4 7 .8 24.4 24. 5 7. 5 10.7 67.9 7. 3 54.7 53 .5 36. 3 48 .3 8. 1 26.9
Buffalo, N .Y .................................. D ec. 1962 50 223.0 30.0 153.7 151.3 16. 5 111.3 71.7 13.5 42 .4 23.6 3 .5 12.7 5. 5 (J) (9) 26.8 (9) (9) 7. 1 (9 ) 8.7 (9) (9)Burlington, V t_____________________ Mar. 1963 50 6 .3 1.0 4 .0 4 .5 . 5 3 .0 1.8 .5 1.0 . 8 .2 .5 . 1 (9) (9) .5 (9) (9) . 3 (9) . l (9) (9)Lawrence—Haverhill,M ass. —N. H 8 _____________________ June 1963 50 44.5 _ - 39.5 _ _ 5.0 _ _ .9 (9 ) (9) .4 ( !) ( !) 2 .4 (9) (9) 1.0 (9) .‘ 3 (9) (9)M anchester, N. H __________________ Aug. 1962 50 21.5 2 .4 16.4 15.5 .8 13.3 6 .0 1.6 3. 1 2. 2 .5 1. 1 1.0 (9) (9) 1 .4 (9 ) (9) 1.0 (9) .4 (9) (9)
Newark and J ersey City, N. J 8____ Feb. 1963 ( “ ) 437. 1 - - 263.2 _ - 173.9 - _ 52. 1 _ _ 23. 3 28. 7 33.6 36.2New Haven, Conn8 ------------------------- Jan. 1963 50 58.3 _ - 35.3 - _ 23.0 _ _ 10. 1 _ _ 1.7 (*> (9) 4 .7 (9) (’ > 4. 2 (9) 2. 3 (9) (9)New York, N .Y ____________________ Apr. 1963 ( “ ) 1,614.9 473.8 754.2 554. 1 113.6 319.9 L,060. 8 360.2 434. 3 241.9 51. 1 113.7 128.6 48.7 45.0 208. 1 26. 3 157.4 286. 2 190. 5 196.0 43.6 102.0Patersonr-C lifton-Passaic, N. J 8 — May 1963 50 174.6 _ _ 126.9 _ . 47.7 . _ 14.7 _ _ 6 .7 (9) (9) 16.6 (9) (9) 4 .0 <9) 5.7 (9) (9)Philadelphia, Pa. —N. J ------------------- Nov. 1962 ( “ ) 687.7 130. 5 421.7 410 .4 51.9 282.4 277. 3 78 .6 139.3 77 .2 18.6 41 .8 37.7 11.9 15.0 80.0 10.9 60.9 51.7 32.4 30.7 4 .8 19.0Pittsburgh, Pa_____________________ Jan. 1963 < ") 364.7 55.3 247.2 232.2 25. 3 173.4 132. 5 30.0 73 .8 40 .8 6 .8 23. 1 16.4 5. 1 7 .2 39.3 3. 8 31. 3 16.8 11.0 19.2 (9) (9 )Portland, M aine8__________________ Nov. 1962 50 21.5 - - 10.6 - - 10.9 _ - 3 .6 _ - 1. 5 (9) (9) 3. 5 (9) (9) 1.7 (9) .6 (9) (9>Providenc e—Pawtucket,
R. I .—M a ss .- — — — _ — May 1963 50 139.2 19. 3 100. 5 104.0 10. 2 80.5 35. 2 9. 1 20.0 8.6 1.5 5.3 2 .6 (9) (9) 14.4 1.6 11.4 6 .8 (9) 2 .8 (9) (9)Scranton, P a8. — - ____ Aug. 1962 50 36.5 _ _ 25 .4 _ _ 11. 1 _ _ 4. 2 _ _ 1. 1 (9) (9) 3 .7 <9) (9) .9 (9) 1.2 (9) (’ )Trenton, N. J____ ________ __ __ _ D ec. 1962 50 45.8 6 .7 31. 1 33.3 4. 3 23 .8 12.5 2 .4 7 .3 4 .2 . 7 2 .3 . 5 (9) (9) 3 .7 (9) (9) 1.6 (9) 2 .5 9) (9)Waterbury, Conn8— — ____ ____ M ar. 1963 50 40.2 _ _ 34.6 - _ 5 .6 _ - 1. 8 _ - . 2 (9) ( !) 2. 3 ( !) ( !) .9 (9) .4 (9) (9)W orcester, M a ss8 ------------------------- June 1963 50 56. 3 _ _ 41 .5 _ _ 14.8 _ _ 3 .6 _ _ .7 ( ! ) (9) 6. 1 <9) (9) 3 .8 (9) .6 (9) (9)York, P a 8 ............................................... Feb. 1963 50 45.7 - - 36.7 - - 9 .0 - 3 .2 - - . 8 (9) (9) 3 .4 (9) (9) .7 (9) .9 (9) (9)
South
Atlanta, G a8 - ________ __ _ May 1963 50 187.4 _ _ 77.6 _ _ 109.8 _ _ 32. 7 _ _ 16.6 _ _ 33. 3 _ _ 17.3 . 9 .9 (9) (9)B altim ore, Md— — __ __ __ _ Nov. 1962 ( l°) 262.7 42.7 170. 1 159. 1 17.9 112.9 103.6 24 .8 57.2 21.9 4. 5 12. 1 12. 5 2 .9 6 .0 38.6 4 .4 30. 1 18. 7 11. 7 11.9 (9) (9)Beaumont—P ort Arthur, T e x 8------- May 1963 50 40. 1 - 27.5 - - 12.6 _ - 5. 5 _ - .9 ( !) ( !) 4 .0 (!> ( !) .8 ( ! ) 1.4 (9) (9)Birmingham, A la 8 ------------------------- Apr. 1963 50 93.2 - - 52.5 - - 40.7 - - 12. 5 - - 6 .7 ( !) 11. 8 (J) (J) 6. 3 (! ) 3 .4 ( !) ( !)Charleston, W. V a 8 ______________ Apr. 1963 50 32.4 _ - 19.0 - - 13.4 _ - 6 .9 - - 1.2 ( ! ) ( !) 3 .9 ( ! ) ( ! ) .6 9) .8 n (9)Charlotte, N. C 8 ---------------------------- Apr. 1963 50 51.6 _ _ 21.5 _ _ 30. 1 _ _ 10. 3 _ _ 5. 8 ! ! ) (! ) 8. 1 ( !) ( !) 3 .4 ( !) 2 .5 (9) (9)Chattanooga, Tenn. —G a----------------- Sept. 1962 50 48.6 5. 3 36.0 34.6 2. 1 27.9 14.0 3 .2 8. 1 3 .2 . 5 2 .0 .9 ! ! ! ! ) 4. 8 (9) (9) 2 .9 (9) 2 .2 ( !) ( !)D allas, Tex-------------------------------------- Nov. 1962 50 202.0 44. 2 118.6 88. 1 10. 1 60 .2 113.9 34. 1 58.4 27.0 6 .4 14.2 17.9 ! ) ! ) 35. 2 3 .9 27 .4 24.6 17.6 9 .2 (9) (9)Fort Worth, Tex „ — ------ Nov. 1962 50 81.5 14.0 49.0 38.4 5. 2 23.4 43. 1 8 .8 25.6 12.0 1.9 6 .2 5. 5 ! ) ( !) 17.9 ( !) ( !) 3 .9 (9) 3 .8 (9) (9)G reevnille, S .C 8 --------------------------- May 1963 50 38.6 _ _ 30.6 _ _ 8 .0 _ _ 1.9 _ _ .4 (9) (9) 3 .4 (9) (9) 1 .2 (9) 1. 1 (9) (9)Houston, T e x 8--------------------------------- June 1963 50 189.8 _ _ 75.4 - _ 114.4 _ _ 33.0 _ _ 18.7 39 .4 11.6 9) 11.7 (9) 9)Jackson, M iss 8 ------------------------------ Feb. 1963 50 19.5 _ _ 7 .4 - _ 12. 1 _ _ 3 .6 _ - 1. 3 (! ) ( f) 3 .4 <!~) ( !) 2. 1 (9) 1.7 (9) (9)Jacksonville, F la --------------------------- Jan. 1963 50 57.0 12.8 34.0 14.9 1. 1 11.6 42. 1 11.7 22 .4 11.4 2. 1 5 .5 5. 1 (9) (9) 13.7 (9) (9) 7 .9 (9) 4 .0 (9) (9)Little Rock—North Little
Rock, Ark— . — — — __ Aug. 1962 50 30.0 4 .2 19.3 12.7 .7 9 .9 17. 3 3.5 9 .4 6 .6 .8 3. 5 1.7 ( !) (*) 4 .5 ( !) (9) 3 .0 (9) 1. 5 (9) (9)L ou isville , K y .—Ind — _ — - Feb. 1963 50 124.2 18. 5 83.6 75.8 7. 5 56.5 48 .4 11.0 27. 1 15. 8 3. 1 8 .7 6. 5 ( ! ) ’ ) 15.0 ( ! ) ( !) 6 .9 (9) 4 .2 (9) (9)Lubbock, T e x 8 — . — ------- . . . June 1963 50 10.7 _ _ 3.2 - _ 7 .5 _ _ 2. 2 _ _ .6 ( ! ) ( !) 3 .5 ( !) ( !) .6 (9) .6 (9) (9)Memphis, Tenn8 — — — — — . Jan. 1963 50 84.9 _ - 38.7 - - 46 .2 _ - 10. 8 _ - 8 .7 (! ) ( !) 15 .4 (9) (9) 5 .2 (9) 6. 1 ( !) (9)M iami, F la 8 .......................................... D ec. 1962 50 111.6 _ _ 27.5 - - 84. 1 - - 24.6 - . 4. 5 (! ) ( !) 29.6 8 .2 (9) 17.2 (9) ( !)New O rleans, La---------- -------- Feb. 1963 50 117.2 17.6 72. 3 41.6 4. 3 31.0 75.6 13. 3 41. 3 26. 2 4. 1 9 .3 9 .6 (9) (9) 22.9 2. 1 18.2 7. 8 (9) 9. 1 n (9)Norfolk—Portsm outh and Newport
News—Hampton, Va---------------------- June 1963 50 73.5 7 .8 56.9 35.9 2. 1 31.5 37.6 5 .7 25 .4 9. 1 1. 3 5 .5 3 .4 ( ! ) (9) 18.4 ( ! ) ( !) 3. 1 (9) 3.6 (9) (9)Oklahoma City, Okla_______________ Aug. 1962 50 1156. 2 1111. 6 34. 4 17.4 2. 3 12.2 u 38. 8 119. 3 ll22.2 9 .6 1.9 5 .6 4 .4 ( ! ) (9) 13.3 ( !) ( !) 5 .0 (9) 3 .5 (9) (9)Raleigh, N .C 8_____________________ Sept. 1962 50 15.6 _ - 6. 1 - - 9 .5 - - 2 .8 - - 1.3 ( !) ( !) 2 .9 (! ) (! ) 1.9 0 .6 ( !) ( ! )Richmond, V a 8____________________ Nov. 1962 50 77.6 - - 36.7 - - 40 .9 - - 11.6 - - 4 .7 ( ! ) ( !) 13. 5 ( ! ) ( !) 7. 3 (9) 3 .8 (9) (9)San Antonio, Tex ____ __ __ ____ June 1963 50 58. 3 9 .5 40.0 19.4 1. 3 14.7 38. 9 8 .2 25.3 6. 5 .8 4 .0 4 .8 (! ) ( !) 17. 8 ( !) 5 .9 (9) 3.9 (9) (9)Savannah, G a8— . . . . _ May 1963 50 20.3 _ - 12.8 - - 7. 5 - - 3. 3 - - .4 (9) (9) 2. 3 i9) (9) .6 (9) .9 (9) (9)Washington, D. C. —Md. —V a ----------- Oct. 1962 50 199.2 36. 1 121. 1 28.0 3. 2 16.3 171. 2 32.9 104.8 37.6 6 .6 24.2 11. 3 2 .4 6 .0 63.6 5 .5 52.7 18.9 10. 5 39.8 7 .9 18.9
North Central
Akron, O hio8 ___ — ____ __ June 1963 50 96.9 _ 71.5 _ _• 25 .4 _ _ 9 .5 _ _ 1.9 (! ) ( !) 9 .9 ( ! ) ( !) 2. 1 ( !) 2.0 (9) (9)Canton, O hio8 __ ____ — _____ _ Apr. 1963 50 57.8 _ - 45 .8 - - 12.0 - - 3 .7 - - 1.6 (9) (9) 4 .9 (9) (9) 1 .4 (9) .4 (9) (9)Chicago, 111------------- — — ------- - Apr. 1963 ( l0) 1,119.2 270 .4 708.0 635. 1 102. 1 435.3 564. 1 168.3 272.7 145. 5 31.2 75.0 87.0 28.0 42 .8 151.4 29.5 105.5 92.6 60 .5 87.6 19.1 42. 1Cincinnati, Ohio—K y8 — . — _ M ar. 1963 50 205.0 . -- 132.4 - - 72 .6 - - 22.9 (9) (9) 7 .9 (9) (9) 21.9 (9) (9) 10.5 (9) 9 .4 (9) (9)Cleveland, O h io___________________ Sept. 1962 ( 10) 325.3 59.7 202.9 206.0 31. 5 140.0 119.3 28 .2 62 .9 32. 1 7 .0 13.6 19.6 5 .6 10. 1 35.6 2 .5 28.6 17.3 10.6 14.7 (9) (9)Columbus, Ohio — — ____ . . D ec. 1962 50 119.6 23.8 69 .4 61.3 9. 1 40.0 58. 3 14.7 29 .4 14.6 2 .8 6 .2 5.7 (9) (9) 18.9 (9) (9) 9 .5 (9) 9 .6 (9) (9)
See footnotes at end o f table.
Digitized for FRASER http://fraser.stlouisfed.org/ Federal Reserve Bank of St. Louis
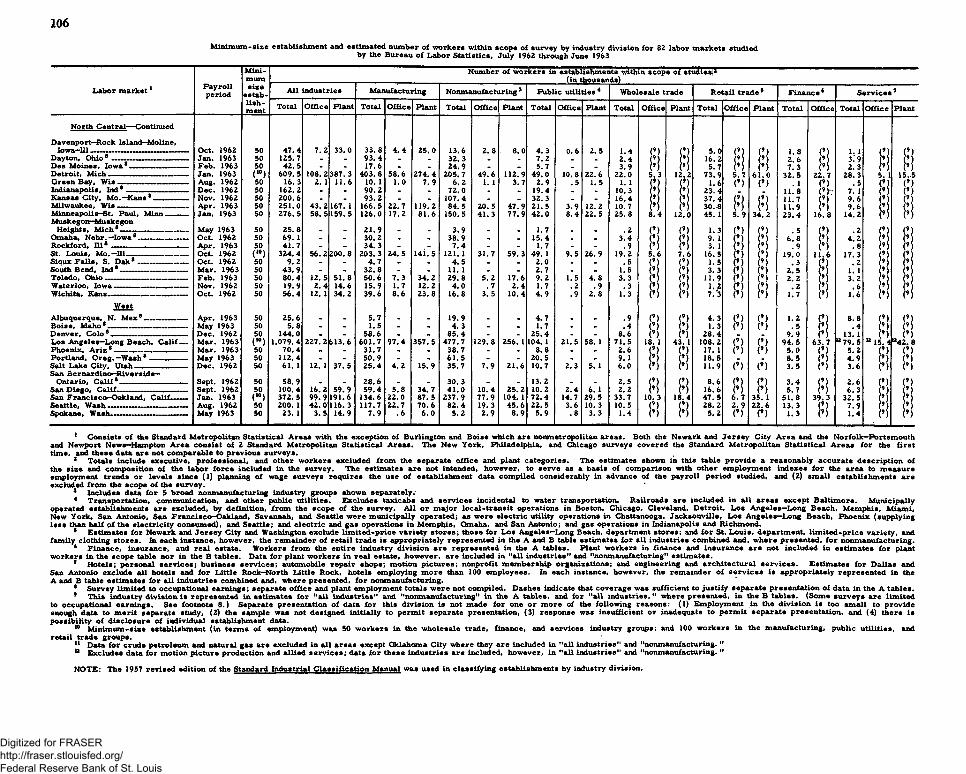
106
M inim um -size establishment and estim ated number o f w orkers within scope o f survey by industry division for 82 labor m arkets studiedby the Bureau o f Labor Statistics, July 1962 through June 1963
Minimum
Number o f w orkers in establishments within scope o f studies)2
Labor m ark et1 Payrollperiod
sizeestablish ment
All industries Manufacturing Nonmanufacturing 3 Public u tilities4 Wholesale trade Retail trade 5 Finance 8 Services 7
Total O ffice Plant Total O ffice Plant Total O ffice Plant Total Office Plant Total O ffice Plant Total O ffice Plant Total O ffice Total O ffice Plant
North Central— Continued
Davenport—Rock Island—Moline,Iowa—111__________ __ __________ Oct. 1962 50 4 7 .4 7 .2 33.0 33.8 4 .4 25.0 13.6 2 .8 8.0 4 .3 0.6 2 .5 1.4 (9) 5 .0 (9) (9) 1. 8 (9) 1. 1 (9) (9)Dayton, O hio8 ——-------- ------------ - Jan. 1963 50 125.7 - - 93 .4 - - 32.3 - - 7 .2 - _ 2 .4 (9) 16.2 9 (9) 2 .6 (9) 3 .9 9) (9)Des M oines, Iow a8--- --------------------- Feb. 1963 50 42 .5 - - 17.6 - - 24.9 _ _ 5.7 _ _ 3.9 H (9) 5 .7 (’ ) (9) 7. 3 (9) 2. 3 (9) (9)Detroit, M ich -------------- — _________ Jan. 1963 ( . . ) 609 .5 108. 2 387. 3 403 .8 58.6 274 .4 205.7 49.6 112.9 49.0 10.8 22.6 22.0 5 .3 12.2 73.9 5 .7 61 .0 32.5 22.7 28. 3 5. 1 15.-5
Green Bay, W is ----------------------- ------ Aug. 1962 50 16. 3 2. 1 11.6 10. 1 1.0 7 .9 6 .2 1. 1 3 .7 2.9 .5 1.5 1. 1 (9) (9) 1.6 (9) (9) . 1 (9) . 5 (9 ) (9)Indianapolis, Ind 8 -------------------------- D ec. 1962 50 162.2 - - 90 .2 - _ 72.0 _ . 19.4 - - lo ! 3 (9) (9) 23 .4 11. 8 (9)-: 7. 1 (9) (9)Kansas City, M o .—K ans8_______— Nov. 1962 50 200.6 - - 93 .2 - - 107.4 - . 32.3 - - 16.4 (’ ) (9) 37 .4 O (9) 11.7 (9 9 .6 (9) (9)Milwaukee, W is- — - _______ Apr. 1963 50 251.0 43 .2 167. 1 166.5 22.7 119.2 84.5 20. 5 47.9 21.5 3.9 12. 2 10.7 (? (9) 30 .8 (9 ) (9) 11.9 (9) 9 .6 (9) 9M inneapolis-St. Paul, M inn--------- Jan. 1963 50 276.5 58. 5 159. 5 126.0 17.2 81.6 150.5 41. 3 77 .9 42.0 8 .4 22. 5 25.8 8 .4 12.0 45. 1 5 .9 34. 2 23 .4 16.8 14.2 (9) (9)Muskegoir-MuskegonHeights, M ich 8 — ......................... May 1963 50 25. 8 - - 21.9 - - 3 .9 - - 1.7 . - .2 (9) (9) 1. 3 (9) (9) . 5 (9) .2 (9) (9)Omaha, Nebr. —Iow a8------------—------ Oct. 1962 50 69.1 - - 30.2 - - 38.9 - . 15.4 . - 3 .4 (9) n 9. 1 (9) (9 ) 6 .8 (’ ) 4 .2 oRockford, 1118 Apr. 1963 50 41.7 - - 34.3 _ _ 7 .4 - - 1.7 . . .9 (9) l9) 3. 1 9 9 .9 (9) .8 9 (*)
St. Louis, M o .—Ill______________ — Oct. 1962 ( »°) 324 .4 56.2 200.8 203.3 24.5 1 4 i.5 121. 1 31.7 59.3 49. 1 9.5 26.9 19.2 5 .6 7 .6 16. 5 (9) (9) 19.0 11.6 17.3 (9) (9)Sioux F a lls , S. D ak8 - ------------ Oct. 1962 50 9 .2 - _ 4 .7 - . 4 .5 - _ 2.0 _ - .5 (9) (9) 1 .5 9) (9) .3 (9) . 2 9) (9)South Bend, Ind 8 — ------------------------ Mar. 1963 50 43 .9 - _ 32.8 - - 11. 1 _ - 2 .7 - . 1.5 (9) (9) 3 .3 9) (9) 2 .5 9 1. 1 (9) oToledo, Ohio —— — ------- ----- Feb. 1963 50 80 .4 12. 5 51. 8 50.6 7 .3 34.2 29 .8 5. 2 17.6 9 .2 1.5 4 .8 3.3 (9) (9) 11.9 (9) (9) 2. 2 9) 3 .2 (9) 9Waterloo, Iow a----------------- ------------- Nov. 1962 50 19.9 2 .4 14.6 15.9 1.7 12. 2 4 .0 .7 2 .4 1.7 .2 .9 .3 (9) (9) 1 .2 (9) (9) . 2 9 .6 (9) (9)Wichita, Kans--------------------------------- Oct. 1962 50 56 .4 12. 1 34.2 39.6 8 .6 23. 8 16.8 3. 5 10.4 4 .9 .9 2 .8 1.3 (9) (9) 7 /3 (9) (9) 1.7 l9) 1.6 (9) (9)West
Albuquerque, N. Mex 8 ___________ Apr. 1963 50 25.6 - _ 5.7 _ - 19.9 - - 4 .7 . - .9 <!> (?) 4. 3 (9) (9) 1.2 (9) 8 .8 (9) (9)Boise, Idaho8_____ — --------------------- May 1963 50 5 .8 - - 1.5 - . 4 .3 - . 1.7 . . .4 (9) (9) 1. 3 (9) (9) .5 (9) .4 (9) (9)Denver, C o lo 8. ___________________ D ec. 1962 50 144.0 - - 58.6 . _ 85 .4 - - 25.4 - - 8 .6 (9) (9) 28 .4 9 .9 (9) 13. 1 (9) (9)Los Angeles—Long Beach, Calif — M ar. 1963 (1°) 1,079.4 227. 2 613.6 601.7 97 .4 357.5 477.7 129.8 256. 1 104. 1 21.5 58. 1 71.5 18. 1 43. 1 108. 2 (9) (9) 94 .5 63 .7 12 79. 5 12 15.4 “ 42 .8Phoenix, A riz 8-------------- ------------— Mar. 1963 50 70 .4 _ - 31.7 - . 38.7 - - 8 .8 . - 2 .6 (9) (9) 17. 1 (9) (9) 5 .0 (9) 5 .2 (9) (9 )Portland, Oreg. —W ash8 — ------- - May 1963 50 112.4 - - 50.9 . - 61 .5 . - 20.5 . - 9. 1 (9) (9) 18.5 8 .5 (9 4 .9 <9) (9)Salt Lake City, Utah — --------------— D ec. 1962 50 61. 1 12. 1 37.5 25 .4 4 .2 15.9 35.7 7 .9 21.6 10.7 2.3 5. 1 6 .0 (9) (9) 11.9 (9 ) (9) 3 .5 (9) 3 .6 (9 ) (9)San Bernardinop-Riverside—
Ontario, Calif 8----------------- ----------- Sept. 1962 50 58.9 . . 28 .6 _ . 30. 3 _ - 13. 2 - - 2 .5 (9) (9) 8 .6 (9) (9) 3 .4 (?) 2 .6 (9) (9)San D iego, Calif-------- --------- -----— . Sept. 1962 50 100.4 16. 2 59.9 59.4 5 .8 34.7 41.0 10.4 25.2 10.2 2.4 6.1 2 .2 (9) (9) 16.6 (9 ) (9) 5 .7 (9) 6 .3 nSan Fran cisco—Oakland, Calif— — Jan. 1963 (10) 372.5 99.9 191.6 134.6 22.0 87. 5 237.9 77.9 104. 1 72 .4 14.7 29.5 33.7 10. 3 18.4 47. 5 6 .7 35. 1 51.8 39.3 32.5 (9 j 9Seattle, W ash------------— — -------— Aug. 1962 50 200. 1 42.0 116.3 117.7 22.7 70 .6 82 .4 19.3 45.6 22.5 3.6 10. 3 10.5 (9) 28. 2 2 .9 22.6 13.3 (9) 7 .9 (9) 9Spokan.* Wa.h-------------------------------- May 1963 50 23. 1 3 .5 14.9 7 .9 .6 6 .0 5.2 2 .9 8.9 5.9 .8 3. 3 1.4 (9) (9) 5 .2 (9) (9) 1.3 (9) 1 .4 (9) (9)
1 Consists o f the Standard M etropolitan Statistical Areas with the exception o f Burlington and Boise which are nonmetropolitan areas. Both the Newark and J ersey City A rea and the Norfolk—Portsm outh and Newport News-Hampton A rea consist o f 2 Standard M etropolitan Statistical A reas. The New York, Philadelphia, and Chicago surveys covered the Standard M etropolitan Statistical A reas for the fir s t time, and these data are not com parable to previous surveys.
2 Totals include executive, professional, and other w orkers excluded from the separate o ffice and plant categories . The estimates shown in this table provide a reasonably accurate descrip tion o f the size and com position o f the labor fo rce included in the survey. The estim ates are not intended, however, to serve as a basis of com parison with other em ploym ent indexes fo r the area to m easure employment trends or levels since (1) planning o f wage surveys requires the use o f establishment data com piled considerably in advance o f the payroll period studied, and (2) sm all establishm ents are excluded from the scope o f the survey.
2 Includes data for 5 broad nonmanufacturing industry groups shown separately;4 Transportation, communication, and other public utilities. Excludes taxicabs and serv ices incidental to water transportation. Railroads are included in a ll areas except Baltim ore. Municipally
operated establishments are excluded, by definition, from the scope o f the survey. A ll o r m ajor loca l-tran sit operations in Boston, Chicago, Cleveland, D etroit, Los Angeles—Long Beach, Memphis, Miami, New York, San Antonio, San Fran cisco—Oakland, Savannah, and Seattle w ere m unicipally operated; as were e lectric utility operations in Chattanooga, Jacksonville, Los Angeles—Long Beach, Phoenix (supplying less than half o f the electricity consum ed), and Seattle; and e lectric and gas operations in Memphis, Omaha, and San Antonio; and gas operations in Indianapolis and Richmond.
s Estim ates fo r Newark and Jersey City and Washington exclude lim ited -p rice variety stores; those for Los Angeles—Long Beach, department stores; and fo r St. Lou is, department, lim ited -p rice variety, and fam ily clothing stores. In each instance, however, the rem ainder o f retail trade is appropriately represented in the A and B table estimates for all industries com bined and, w here presented, fo r nonmanufacturing.
4 Finance, insurance, and real estate. W orkers from the entire industry d ivision are represented in the A tables. Plant w orkers in finance and insurance are not included in estim ates for plant workers in the scope table nor in the B tables. Data fo r plant w orkers in real estate, how ever, are included in "a ll industries" and "nonmanufacturing" estim ates.
7 H otels; personal se rv ices ; business se rv ices ; automobile repair shops; m otion p ictu res; nonprofit m em bership organizations; and engineering and architectural se rv ices . Estim ates for Dallas and San Antonio exclude all hotels and for Little Rock—North Little Rock, hotels employing m ore than 100 em ployees. In each instance, however, the rem ainder o f s e rv ices is appropriately represented in the A and B table estim ates for a ll industries combined and, where presented, fo r nonmanufacturing.
4 Survey lim ited to occupational earnings; separate o ffice and plant employment totals w ere not com piled. Dashes indicate that coverage was sufficient to justify separate presentation o f data in the A tables.9 This industry div ision is represented in estim ates for "a ll industries" and "nonmanufacturing" in the A tables, and for "a ll in du stries ," where presented, in the B tables. (Some surveys are lim ited
to occupational earnings. See footnote 8 .) Separate presentation o f data for this division is not made for one o r m ore o f the following reasons: (1) Employment in the d iv ision is too sm all to provideenough data to m erit separate study, (2) the sample was not designed initially to perm it separate presentation, (3) response was insufficient or inadequate to perm it separate presentation, and (4) there is possibility o f d isclosu re o f individual establishment data.
10 M inim um -size establishment (in term s o f employment) was 50 w orkers in the w holesale trade, finance, and serv ices industry groups; and 100 w orkers in the manufacturing, public utilities, and retail trade groups.
11 Data for crude petroleum and natural gas are excluded in a ll areas except Oklahoma City where they are included in "a ll industries" and "nonmanufacturing. "12 Excludes data for m otion picture production and allied se rv ices ; data fo r these industries are included, however, in "a ll industries" and "nonmanufacturing. "
NOTE: The 1957 revised edition o f the Standard Industrial C lassification Manual was used in classifying establishments by industry division.
Digitized for FRASER http://fraser.stlouisfed.org/ Federal Reserve Bank of St. Louis

Appendix B: Occupational Descriptions
The primary purpose of preparing job descriptions for the Bureau’s wage surveys is to assist its field staff in classifying into appropriate occupations workers who are employed under a variety of payroll titles and different work arrangements from establishment to establishment and from area to area. This permits the grouping of occupational wage rates representing comparable job content. Because of this emphasis on interestablishment and interarea comparability of occupational content, the Bureau’ s job descriptions may differ significantly from those in use in individual establishments or those prepared for other purposes. In applying these job descriptions, the Bureau’s field economists are instructed to exclude working supervisors, apprentices, learners, beginners, trainees, handicapped, part-time, temporary, and probationary workers.
OFFICE
BILLER, MACHINEPrepares statements, bills, and invoices on a machine other
than an ordinary or electromatic typewriter. May also keep records as to billings or shipping charges or perform other clerical work incidental to billing operations. For wage study purposes, billers, machine, are classified by type of machine, as follows:
Biller, machine (billing machine). Uses a special billing machine (Moon Hopkins, Elliott Fisher, Burroughs, etc., which are combination typing and adding machines) to prepare bills and invoices from customers’ purchase orders, internally prepared orders, shipping memorandums, etc. Usually involves application of predetermined discounts and shipping charges and entry of necessary extensions, which may or may not be computed on the billing machine, and totals which are automatically accumulated by machine. The operation usually involves a large number of carbon copies of the bill being prepared and is often done on a fanfold machine.
Biller, machine (bookkeeping machine).Uses a bookkeeping machine (Sundstrand, Elliott Fisher, Remington Rand, etc., which may or may not have typewriter keyboard) to prepare customers’ bills as part of the accounts receivable operation. Generally involves the simultaneous entry of figures on customers’ ledger record. The machine automatically accumulates figures on a number of vertical columns and computes and usually prints automatically the debit or credit balances. Does not involve a knowledge of bookkeeping. Works from uniform and standard types of sales and credit slips.
BOOKKEEPING-MACHINE OPERATOROperates a bookkeeping machine (Remington Rand, Elliott
Fisher, Sundstrand, Burroughs, National Cash Register, with or without a typewriter keyboard) to keep a record of business transactions.
Class A. Keeps a set of records requiring a knowledge of and experience in basic bookkeeping principles and familiarity with the structure of the particular accounting system used. Determines proper records and distribution of debit and credit items to be used in each phase of the work. May prepare consolidated reports, balance sheets, and other records by hand.
Class B. Keeps a record of one or more phases or sections of a set of records usually requiring little knowledge of basic bookkeeping. Phases or sections include accounts payable, payroll, customers’ accounts (not including a simple type of billing described under biller, machine), cost distribution, expense distribution, inventory control, etc. May check or assist in preparation of trial balances and prepare control sheets for the accounting department.
CLERK, ACCOUNTINGClass A. Under general direction of a bookkeeper or account
ant, has responsibility for keeping one or more sections of a complete set of books or records relating to one phase of an establishment’s business transactions. Work involves posting and balancing subsidiary ledger or ledgers such as accounts receivable or accounts
107
Digitized for FRASER http://fraser.stlouisfed.org/ Federal Reserve Bank of St. Louis

108
CLERK, ACCOUNTING—Continuedpayable; examining and coding invoices or vouchers with proper accounting distribution; and requires judgment and experience in making proper assignations and allocations. May assist in preparing, adjusting, and closing journal entries; and may direct class B accounting clerks.
Class B. Under supervision, performs one or more routine accounting operations such as posting simple journal vouchers or accounts payable vouchers, entering vouchers in voucher registers; reconciling bank accounts; and posting subsidiary ledgers controlled by general ledgers, or posting simple cost accounting data. This job does not require a knowledge of accounting and bookkeeping principles but is found in offices in which the more routine accounting work is subdivided on a functional basis among several workers.
CLERK, FILE
Class A t In an established filing system containing a number of varied subject matter files, classifies and indexes file material such as correspondence, reports, technical documents, etc. May also file this material. May keep records of various types in conjunction with the files. May lead a small group of lower level file clerks.
Class 0, Sorts, codes, and files unclassified material by simple (subject matter) headings or partly classified material by finer subheadings. Prepares simple related index and cross-reference aids. As requested, locates clearly identified material in files and forwards material. May perform related clerical tasks required to maintain and service files.
Class C9 Performs routine filing of material that has already been classified or which is easily classified in a simple serial classification system (e.g., alphabetical, chronological, or numerical). As requested, locates readily available material in files and forwards material; and may fill out withdrawal charge. Performs simple clerical and manual tasks required to maintain and service files.
CLERK, ORDERReceives customers’ orders for material or merchandise by mail,
phone, or personally. Duties involve any combination of the following: Quoting prices to customers; making out an order sheet listing the items to make up the order; checking prices and quantities of items on order sheet; and distributing order sheets to respective departments to be filled. May check with credit department to determine credit rating of customer, acknowledge receipt of orders from customers, follow up orders to see that they have been filled, keep file of orders received, and check shipping invoices with original orders.
CLERK, PAYROLLComputes wages of company employees and enters the neces
sary data on the payroll sheets. Duties involve: Calculating workers’ earnings based on time or production records; and posting calculated data on payroll sheet, showing information such as worker’s name, working days, time, rate, deductions for insurance, and total wages due. May make out paychecks and assist paymaster in making up and distributing pay envelopes. May use a calculating machine.
COMPTOMETER OPERATORPrimary duty is to operate a Comptometer to perform mathema
tical computations. This job is not to be confused with that of statistical or other type of clerk, which may involve frequent use of a Comptometer but, in which, use of this machine is incidental to performance of other duties.
DUPLICATING-MACHINE OPERATOR (MIMEOGRAPH OR DITTO)Under general supervision and with no supervisory responsi
bilities, reproduces multiple copies of typewritten or handwritten matter, using a Mimeograph or Ditto machine. Makes necessary adjustment such as for ink and paper feed counter and cylinder speed. Is not required to prepare stencil or Ditto master. May keep file of used stencils or Ditto masters. May sort, collate, and staple completed material.
Digitized for FRASER http://fraser.stlouisfed.org/ Federal Reserve Bank of St. Louis

KEYPUNCH OPERATOR
Class A . Operates a numerical and/or alphabetical or combination keypunch machine to transcribe data from various source documents to keypunch tabulating cards. Performs same tasks as lower level keypunch operator but, in addition, work requires application of coding skills and the making of some determinations, for example, locates on the source document the items to be punched; extracts information from several documents; and searches for and interprets information on the document to determine information to be punched. May train inexperienced operators.
Class B. Under close supervision or following specific procedures or instructions, transcribes data from source documents to punched cards. Operates a numerical and/or alphabetical or combination keypunch machine to keypunch tabulating cards. May verify cards. Working from various standardized source documents, follows specified sequences which have been coded or prescribed in detail and require little or no selecting, coding, or interpreting of data to be punched. Problems arising from erroneous items or codes, missing information, etc., are referred to supervisor.
OFFICE BOY OR GIRL
Performs various routine duties such as running errands, operating minor office machines such as sealers or mailers, opening and distributing mail, and other minor clerical work.
SECRETARY
Performs* secretarial and clerical duties for a superior in an administrative or executive position. Duties include making appointments for superior; receiving people coming into office; answering and
109
SECRETARY —Continuedmaking phone calls; handling personal and important or confidential mail, and writing routine correspondence on own initiative; and taking dictation (where transcribing machine is not used) either in shorthand or by Stenotype or similar machine, and transcribing dictation or the recorded information reproduced on a transcribing machine. May prepare special reports or memorandums for information of superior.
STENOGRAPHER, GENERALPrimary duty is to take dictation involving a normal routine
vocabulary from one or more persons either in shorthand or by Stenotype or similar machine; and transcribe dictation. May also type from written copy. May maintain files, keep simple records, or perform other relatively routine clerical tasks. May operate from a stenographic pool. Does not include transcribing-machine work. (See transcribing-machine operator.)
STENOGRAPHER, SENIORPrimary duty is to take dictation involving a varied technical
or specialized vocabulary such as in legal briefs or reports on scientific research from one or more persons either in shorthand or by Stenotype or similar machine; and, transcribe dictation. May also type from written copy. May also set up and maintain files, keep records, etc.
OR
Performs stenographic duties requiring significantly greater independence and responsibility than stenographers, general as evidenced by the following: Work requires high degree of stenographicspeed and accuracy; and a thorough working knowledge of general business and office procedures and of the specific business operations, organization, policies, procedures, files, workflow, etc. Uses this knowledge in performing stenographic duties and responsible clerical tasks such as, maintaining followup files; assembling material for reports, memorandums, letters, etc.; composing simple letters from general instructions; reading and routing incoming mail; and answering routine questions, etc. D oes not include transcribing-machine work.
Digitized for FRASER http://fraser.stlouisfed.org/ Federal Reserve Bank of St. Louis

110
SWITCHBOARD OPERATOROperates a single- or multiple-position telephone switchboard.
Duties involve handling incoming, outgoing, and intraplant or office calls. May record toll calls and take messages. May give information to persons who call in, or occasionally take telephone orders. For workers who also act as receptionists see switchboard operator- receptionist.SWITCHBOARD OPERATOR-RECEPTIONIST
In addition to performing duties of operator on a single position or monitor-type switchboard, acts as receptionist and may also type or perform routine clerical work as part of regular duties. This typing or clerical work may take the major part of this worker's time while at switchboard.
TABULA TING-MACHINE OPERATORClass A. Operates a variety of tabulating or electrical ac
counting machines, typically including such machines as the tabulator, calculator, interpreter, collator, and others. Performs complete reporting assignments without close supervision, and performs difficult wiring as required. The complete reporting and tabulating assignments typically involve a variety of long and complex reports which often are of irregular or nonrecurring type requiring some planning and sequencing of steps to be taken. As a more experienced operator, is typically involved in training new operators in machine operations, or partially trained operators in wiring from diagrams and operating sequences of long and complex reports. Does not include working supervisors performing tabulating-machine operations and day-to-day supervision of the work and production of a group of tabulating-machine operators.
Class B0 Operates more difficult tabulating or electrical accounting machines such as the tabulator and calculator, in addition to the sorter, reproducer, and collator. This work is performed under specific instructions and may include the performance of some wiring from diagrams. The work typically involves, for example, tabulations involving a repetitive accounting exercise, a complete but small tabulating study, or parts of a longer and more complex report. Such reports and studies are usually of a recurring nature where the procedures are well established. May also include the training of new employees in the basic operation of the machine.
TABULATING-MACHINE OPERATOR-Contimied
Class C. Operates simple tabulating or electrical accounting machines such as the sorter, reproducing punch, collator, etc., with specific instructions. May include simple wiring from diagrams and some filing work. The work typically involves portions of a work unit, for example, individual sorting or collating runs or repetitive operations.
TRANSCRIBING-MACHINE OPERATOR, GENERALPrimary duty is to transcribe dictation involving a normal rou
tine vocabulary from transcribing-machine records. May also type from written copy and do simple clerical work. Workers transcribing dictation involving a varied technical or specialized vocabulary such as legal briefs or reports on scientific research are not included. A worker who takes dictation in shorthand or by Stenotype or similar machine is classified as a stenographer, general.
TYPIST
Uses a typewriter to make copies of various material or to make out bills after calculations have been made by another person. May include typing of stencils, mats, or similar materials for u$e in duplicating processes. May do clerical work involving little special training, such as keeping simple records, filing records and reports, or sorting and distributing incoming mail.
Class A. Performs one or more o f the following: Typing material in final form when it involves combining material from several sources or responsibility for correct spelling, syllabication, punctuation, etc., of technical or unusual words or foreign language material; and planning layout and typing of complicated statistical tables to maintain uniformity and balance in spacing. May type routine form letters varying details to suit circumstances.
Class B, Performs one or more o f the following: Copy typing from rough or clear drafts; routine typing of forms, insurance policies, etc.; and setting up simple standard tabulations, or copying more complex tables already set up and spaced properly.
Digitized for FRASER http://fraser.stlouisfed.org/ Federal Reserve Bank of St. Louis

I l l
PROFESSIONAL AND TECHNICAL
DRAFTSMAN
Leader. Plans and directs activities of one or more draftsmen in preparation of working plans and detail drawings from rough or preliminary sketches for engineering, construction, or manufacturing purposes. Duties involve a combination o f the following: Interpreting blueprints, sketches, and written or verbal orders; determining work procedures; assigning duties to subordinates and inspecting their work; and performing more difficult problems. May assist subordinates during emergencies or as a regular assignment, or perform related duties of a supervisory or administrative nature.
Senior. Prepares working plans and detail drawings from notes, rough or detailed sketches for engineering, construction, or manufacturing purposes. Duties involve a combination o f the following: Preparing working plans, detail drawings, maps, cross-sections, etc., to scale by use of drafting instruments; making engineering computations such as those involved in strength of materials, beams, and trusses; verifying completed work, checking dimensions, materials to be used, and quantities; writing specifications; and making adjustments or changes in drawings or specifications. May ink in lines and letters on pencil drawings, prepare detail units of complete drawings, or trace drawings. Work is frequently in a specialized field such as architectural, electrical, mechanical, or structural drafting.
DRAFTSMAN —Continued
Junior (assistant). Draws to scale units or parts of drawings prepared by draftsman or others for engineering, construction, or manufacturing purposes. Uses various types of drafting tools as required. May prepare drawings from simple plans or sketches, or perform other duties under direction of a draftsman.
NURSE, INDUSTRIAL (REGISTERED)A registered nurse who gives nursing service under general
medical direction to ill or injured employees or other persons who become ill or suffer an accident on the premises of a factory or other establishment. Duties involve a combination o f the following: Giving first aid to the ill or injured; attending to subsequent dressing of employees’ injuries; keeping records of patients treated; preparing accident reports for compensation or other purposes; assisting in physical examinations and health evaluations of applicants and employees; and planning and carrying out programs involving health education, accident prevention, evaluation of plant environment, or other activities affecting the health, welfare, and safety of all personnel.TRACER
Copies plans and drawings prepared by others, by placing tracing cloth or paper over drawing and tracing with pen or pencil. Uses T-square, compass, and other drafting tools. May prepare simple drawings and do simple lettering.
MAINTENANCE AND POWERPLANT
CARPENTER, MAINTENANCE
Performs the carpentry duties necessary to construct and maintain in good repair building woodwork and equipment such as bins, cribs, counters, benches, partitions, doors, floors, stairs, casings, and trim made of wood in ah establishment. Work involves most o f the following: Planning and laying out of work from blueprints, drawings, models, or verbal instructions; using a variety of carpenter’s handtools, portable
CARPENTER, MAINTENANCE-Continued
power tools, and standard measuring instruments; making standard shop computations relating to dimensions of work; and selecting materials necessary for the work. In general, the work of the maintenance carpenter requires rounded training and experience usually acquired through a formal apprenticeship or equivalent training and experience.
Digitized for FRASER http://fraser.stlouisfed.org/ Federal Reserve Bank of St. Louis

112
ELECTRICIAN, MAINTENANCE
Performs a variety of electrical trade functions such as the installation, maintenance, or repair of equipment for the generation, distribution, or utilization of electric energy in an establishment. Work involves most o f the following: Installing or repairing any of a variety of electrical equipment such as generators, transformers, switchboards, controllers, circuit breakers, motors, heating units, conduit systems, or other transmission equipment; working from blueprints, drawings, layouts, or other specifications; locating and diagnosing trouble in the electrical system or equipment; working standard computations relating to load requirements of wiring or electrical equipment; and using a variety of electrician's handtools and* measuring and testing instruments. In general, the work of the maintenance electrician requires rounded training and experience usually acquired through a formal apprenticeship or equivalent training and experience.
ENGINEER, STATIONARYOperates and maintains and may also supervise the operation
of stationary engines and equipment (mechanical or electrical) to supply the establishment in which employed with power, heat, refrigeration, or air-conditioning. Work involves: Operating and maintainingequipment such as steam engines, air compressors, generators, motors, turbines, ventilating and refrigerating equipment, steam boilers and boiler-fed water pumps; making equipment repairs; and keeping a record of operation of machinery, temperature, and fuel consumption. May also supervise these operations. Head or chief engineers in establishments employing mote than one engineer are excluded.
FIREMAN, STATIONARY BOILERFires stationary boilers to furnish the establishment in which
employed with beat, power, or steam: Feeds fuels to fire by hand oroperates a mechanical stoker, or gas or oil burner; and checks water and safety valves. May clean, oil, or assist in repairing boilerroom equipment.
HELPER, MAINTENANCE TRADESAssists one or more workers in the skilled maintenance trades,
by performing specific or general duties of lesser skill, such as keeping a worker supplied with materials and tools; cleaning working area, machine, and equipment; assisting journeyman by holding materials or tools; and performing other unskilled tasks as directed by journeyman. The kind of work the helper is permitted to perform varies from trade to trade: In some trades the helper is confined to supplying, lifting, and holding materials and tools and cleaning working areas; and in others he is permitted to perform specialized machine operations, or parts of a trade that are also performed by workers on a full-time basis.
MACHINE-TOOL OPERATOR, TOOLROOMSpecializes in the operation of one or more types of machine
tools, such as jig borers, cylindrical or surface grinders, engine lathes, or milling machines, in the construction of machine-shop tools, gages, jigs, fixtures, or dies. Work involves most o f the following: Planning and performing difficult machining operations; processing items requiring complicated setups or a high degree of accuracy; using a variety of precision measuring instruments; selecting feeds, speeds, tooling, and operation sequence; and making necessary adjustments during operation to achieve requisite tolerances or dimensions. May be required to recognize when tools need dressing, to dress tools, and to select proper coolants and cutting and lubricating oils. For cross-industry wage study purposes, machine-tool operators, toolroom, in tool and die jobbing shops are excluded from this classification.
MACHINIST, MAINTENANCEProduces replacement parts and new parts in making repairs of
metal parts of mechanical equipment operated in an establishment. Work involves most o f 4he following: Interpreting written instructions andspecifications; planning and laying out of work; using a variety of machinist's handtools and precision measuring instruments; setting up and operating standard machine tools; shaping of metal parts to close tolerances; making standard shop computations relating to dimensions of work, tooling, feeds, and speeds of machining; knowledge of the working
Digitized for FRASER http://fraser.stlouisfed.org/ Federal Reserve Bank of St. Louis

MACHINIST, MAINTENANCE-Continued
properties of the common metals; selecting standard materials, parts, and equipment required for his work; and fitting and assembling parts into mechanical equipment. In general, the machinist’s work normally requires a rounded training in machine-shop practice usually acquired through a formal apprenticeship or equivalent training and experience.
MECHANIC, AUTOMOTIVE (MAINTENANCE)Repairs automobiles, buses, motortrucks, and tractors of an es
tablishment. Work involves most o f the following: Examining automotive equipment to diagnose source of trouble; disassembling equipment and performing repairs that involve the use of such handtools as wrenches, gages, drills, or specialized equipment in disassembling or fitting parts; replacing broken or defective parts from stock; grinding and adjusting valves; reassembling and installing the various assemblies in the vehicle and making necessary adjustments; and alining wheels, adjusting brakes and lights, or tightening body bolts. In general, the work of the automotive mechanic requires rounded training and experience usually acquired through a formal apprenticeship or equivalent training and experience.
MECHANIC, MAINTENANCERepairs machinery or mechanical equipment of an establishment.
Work involves most o f the following: Examining machines and mechanical equipment to diagnose source of trouble; dismantling or partly dismantling machines and performing repairs that mainly involve the use of handtools in scraping and fitting parts; replacing broken or defective parts with items obtained from stock; ordering the production of a replacement part by a machine shop or sending of the machine to a machine shop for major repairs; preparing written specifications for major repairs or for the production of parts ordered from machine shop; reassembling machines; and making all necessary adjustments for operation. In gen? eral, the work of a maintenance mechanic requires rounded training and experience usually acquired through a formal apprenticeship or equivalent training and experience. Excluded from this classification are workers whose primary duties involve setting up or adjusting machines.
113
MILLWRIGHTInstalls new machines or heavy equipment, and dismantles and
installs machines or heavy equipment when changes in the plant layout are required. Work involves most o f the following: Planning and laying out of the work; interpreting blueprints or other specifications; using a variety of handtools and rigging; making standard shop computations relating to stresses, strength of materials, and centers of gravity; alining and balancing of equipment; selecting standard tools, equipment, and parts to be used; and installing and maintaining in good order power transmission equipment such as drives and speed reducers. In general, the millwright’s work normally requires a rounded training and experience in the trade acquired through a formal apprenticeship or equivalent training and experience.
OILERLubricates, with oil or grease, the moving parts or wearing sur
faces of. mechanical equipment of an establishment.
PAINTER, MAINTENANCEPaints and redecorates walls, woodwork, and fixtures of an es
tablishment. Work involves the following: Knowledge of surface peculiarities and types of paint required for different applications; preparing surface for painting by removing old finish or by placing putty or filler in nail holes and interstices; and applying paint with spray gun or brush. May mix colors, oils, white lead, and other paint ingredients to obtain proper color or consistency. In general, the work of the maintenance painter requires rounded training and experience usually acquired through a formal apprenticeship or equivalent training and experience.
PIPEFITTER, MAINTENANCEInstalls or repairs water, steam, gas, or other types of pipe and
pipefittings in an establishment. Work involves most o f the following: Laying out of work and measuring to locate position of pipe from drawings or other written specifications; cutting various sizes of pipe to correct lengths with chisel and hammer or oxyacetylene torch or pipecutting machine; threading pipe with stocks and dies; bending pipe by hand-driven or power-driven machines; assembling pipe with couplings
Digitized for FRASER http://fraser.stlouisfed.org/ Federal Reserve Bank of St. Louis

114
PIPEFITTER, MAINTENANCE—Continuedand fastening pipe to hangers; making standard shop computations relating to pressures, flow, and size of pipe required; and making standard tests to determine whether finished pipes meet specifications. In general, the work of the maintenance pipefitter requires rounded training and experience usually acquired through a formal apprenticeship or equivalent training and experience. Workers primarily engaged in installing and tepairing building sanitation or beating system s are excluded.
PLUMBER, MAINTENANCEKeeps the plumbing system of an establishment in good order.
Work involves: Knowledge of sanitary codes regarding installation of vents and traps in plumbing system; installing or repairing pipes and fixtures; and opening clogged drains with a plunger or plumber’s snake. In general, the work of the maintenance plumber requires rounded training and experience usually acquired through a formal apprenticeship or equivalent training and experience.
SHEET-METAL WORKER, MAINTENANCEFabricates, installs, and maintains in good repair the sheet-
metal equipment and fixtures (such as machine guards, grease pans, shelves, lockers, tanks, ventilators, chutes, ducts, metal roofing) of an establishment. Work involves most o f the following: Planning and laying out all types of sheet-metal maintenance work from blueprints, models, or other specifications; setting up and operating all available
SHEET-METAL WORKER, MAINTENANCE-Continuedtypes of sheet-metal-working machines; using a variety of handtools in cutting, bending, forming, shaping, fitting, and assembling; and installing sheet-metal articles as required. In general, the work of the maintenance sheet-metal worker requires rounded training and experience usually acquired through a formal apprenticeship or equivalent training and experience.
TOOL AND DIE MAKER(Die maker; jig maker; tool maker; fixture maker; gage maker)
Constructs and repairs machine-shop tools, gages, jigs, fixtures or dies for forgings, punching, and other metal-forming work. Work involves most of the following: Planning and laying out of work from models, blueprints, drawings, or other oral and written specifications; using a variety of tool and die maker’s handtools and precision measuring instruments, understanding of the working properties of common metals and alloys; setting up and operating of machine tools and related equipment; making necessary shop computations relating to dimensions of work, speeds, feeds, and tooling of machines; heattreating of metal parts during fabrication as well as of finished tools and dies to achieve required qualities; working to close tolerances; fitting and assembling of parts to prescribed tolerances and allowances; and selecting appropriate materials, tools, and processes. In general, the tool and die maker’s work requires a rounded training in machine-shop and toolroom practice usually acquired through a formal apprenticeship or equivalent training and experience.
For cross-industry wage study purposes, tool and die makers in tool and die jobbing shops are excluded from this classification.
CUSTODIAL AND MATERIAL MOVEMENT
ELEVATOR OPERATOR, PASSENGERTransports passengers between floors of an office building,
apartment house, department store, hotel, or similar establishment. Workers who operate elevators in conjunction with other duties such as those of starters and janitors are excluded.
GUARDPerforms routine police duties, either at fixed post or on tour,
maintaining order, using arms or force where necessary. Includes gate- men who are stationed at gate and check on identity o f em ployees and other persons entering.
Digitized for FRASER http://fraser.stlouisfed.org/ Federal Reserve Bank of St. Louis

JANITOR, PORTER, OR CLEANER (Sweeper; charwomen; janitress)
Cleans and keeps in an orderly condition factory working areas and washrooms, or premises of an office, apartment house, or commercial or other establishment. Duties involve a combination o f the following: Sweeping, mopping or scrubbing, and polishing floors; removing chips, trash, and other refuse; dusting equipment, furniture, or fixtures; polishing metal fixtures or trimmings; providing supplies and minor maintenance services; and cleaning lavatories, showers, and restrooms. Workers who specialize in window washing are excluded.
LABORER, MATERIAL HANDLING
(Loader and unloader; handler and stacker; shelver; trucker; stock- man or stock helper; warehouseman or warehouse helper)
A worker employed in a warehouse, manufacturing plant, store, or other establishment whose duties involve one'or more o f the follow• ing: Loading and unloading various materials and merchandise on orfrom freight cars, trucks, or other transporting devices; unpacking, shelving, or placing materials or merchandise in proper storage' location; and transporting materials or merchandise by hand truck, car, or wheelbarrow. Longshoremen, who load and unload ships are excluded.
ORDER FILLER(Order picker; stock selector; warehouse stockman)
Fills shipping or transfer orders for finished goods from stored merchandise in accordance with specifications on sales slips, customers* orders, or other instructions. May, in addition to filling orders and indicating items filled or omitted, keep records of outgoing orders, requisition additional stock or report short supplies to supervisor, and perform other related duties.
115
PACKER, SHIPPING
Prepares finished products for shipment or storage by placing them in shipping containers, the specific operations performed being dependent upon the type, size, and number of units to be packed, the type of container employed, and method of shipment. Work requires the placing of items in shipping containers and may involve one or more o f the following: Knowledge of various items of stock in order to verify content; selection of appropriate type and size of container; inserting enclosures in container; using excelsior or other material to prevent breakage or damage; closing and sealing container; and applying labels or entering identifying data on container. Packers who also make wooden boxes or crates are excluded.
SHIPPING AND RECEIVING CLERK
Prepares merchandise for shipment, or receives and is responsible for incoming shipments of merchandise or other materials. Ship- ping work involves: A knowledge of shipping procedures, practices,routes, available means of transportation, and rates; and preparing records of the goods shipped, making up bills of lading, posting weight and shipping charges, and keeping a file of shipping records. May direct or assist in preparing the merchandise for shipment. Receiving work involves: Verifying or directing others in verifying the correctness of shipments against bills of lading, invoices, or other records; checking for shortages and rejecting damaged goods; routing merchandise or materials to proper departments; and maintaining necessary records and files.
For wage study purposes, workers are classified as follows:
Receiving clqrk Shipping clerkShipping and receiving clerk
Digitized for FRASER http://fraser.stlouisfed.org/ Federal Reserve Bank of St. Louis

116
TRUCKDRIVERDrives a truck within a city or industrial area to transport ma
terials, merchandise, equipment, or men between various types of establishments such as: Manufacturing plants, freight depots, warehouses, wholesale and retail establishments, or between retail establishments and customers’ houses or places of business. May also load or unload truck with or without helpers, make minor mechanical repairs, and keep truck in good working order. Driver-salesmen and over-tbe-road drivers are excluded.
For wage study purposes, truckdrivers are classified by size and type of equipment, as follows: (Tractor-trailer should be rated on the basis of trailer capacity.)
Truckdriver (combination o f s iz e s listed separately) Truckdriver, light (under 1% tons)Truckdriver, medium (1% to and including 4 tons)Truckdriver, heavy (over 4 tons, trailer type)Truckdriver, heavy (over 4 tons, other than trailer type) *
TRUCKER, POWER
Operates a manually controlled gasoline- or electric-powered truck or tractor to transport goods and materials of all kinds about a warehouse, manufacturing plant, or other establishment.
For wage study purposes, workers are classified by type of truck, as follows:
Trucker, power (forklift)Trucker, power (other than forklift)
WATCHMAN
Makes rounds of premises periodically in protecting property against fire, theft, and illegal entry.
* U.S. GOVERNMENT PRINTING OFFICE : 1964 0 -7 2 1 -2 2 9
Digitized for FRASER http://fraser.stlouisfed.org/ Federal Reserve Bank of St. Louis

Digitized for FRASER http://fraser.stlouisfed.org/ Federal Reserve Bank of St. Louis

Digitized for FRASER http://fraser.stlouisfed.org/ Federal Reserve Bank of St. Louis

Order Form
TO:
Superintendent of Documents orU. S. Government Printing Office Washington, D. C. 20402
Bureau of Labor Statistics—18 Oliver Street, Boston, Mass. 02110 341 Ninth Avenue, New York, N. Y. 10001 1371 Peachtree Street, NE., Atlanta, Ga. 30309 1365 Ontario Street, Cleveland, Ohio 44114 105 West Adams Street, Chicago, 111. 60603 630 Sansome Street, San Francisco, Calif. 94111
Enclosed find $____ in I I check or 1 1 money order. Make checks or money orderspayable to the Superintendent of Documents. (Twenty-five percent discount for bundle order of 100 or more copies.)
Please send me copies of bulletins as indicated.
Data on occupational earnings, and establishment practices and supplementary wage provisions are presented in the following bulletins:
Number of copies Area and payroll period
Baltimore (Nov. 1962)-----------------------------Boston (Oct. 1962)-----------------------------------Buffalo (Dec. 1962)----------------------------------Burlington (Mar. 1963)----------------------------Chattanooga (Sept. 1962)--------------------------Chicago (Apr. 1963)---------------------------------Cleveland (Sept. 1962)-----------------------------Columbus (Dec. 1962)------------------------- *----Dallas (Nov. 1962)-----------------------------------Davenport—Rock Island—Moline (Oct. 1962)Detroit (Jan. 1963)----------------------------------Fort Worth (Nov. 1962)----------------------------Green Bay (Aug. 1962)------------------------------Jacksonville (Jan. 1963)--------- —-------------Little Rock—North Little Rock (Aug. 1962) -Los Angeles—Long Beach (Mar. 1963)-------Louisville (Feb. 1963)-----------------------------Manchester (Aug. 1962)---------------------------Milwaukee (Apr. 1963)-----------------------------Minneapolis—St. Paul (Jan. 1963)-------------New Orleans (Feb. 1963)-------------------------New York (Apr. 1963)— ---------------------------Norfolk—Portsmouth and
Newport News—Hampton (June 1963)--------Oklahoma City (Aug. 1962)*-----------------------Philadelphia (Nov. 1962)--------------------------Pittsburgh (Jan. 1963)------------------------------Providence—Pawtucket (May 1963)------------St. Louis (Oct. 1962)-------------------------------Salt Lake City (Dec. 1962)-----------------------San Antonio (June 1963)----------------------------San Diego (Sept. 1962)-----------------------------San Francisco-Oakland (Jan 1963) —---------Seattle (Aug. 1962)—-------------------------------Spokane (May 1963)----------------------------------Toledo (Feb. 1963) ---------------------------------Trenton (Dec. 1962)—-------------------------------Washington (D .C .), (Oct. 1962)---------------Waterloo (Nov. 1962)-------------------------------Wichita (Oct. 1962)----------------------------------
Bulletinnumber
1345-231345-151345-301345-501345-81345-651345-141345-281345-211345-181345-471345-271345-31345-391345-71345-621345-481345-21345-591345-381345-441345-791345-751345-61345-311345-401345-701345-171345-251345-781345-101345-341345-41345-661345-511345-291345-161345-201345-11
Price
25 cents 25 cents 25 cents 25 cents 25 cents 30 cents 25 cents 25 cents 25 cents 25 cents 25 cents 25 cents 25 cents 25 cents 25 cents 30 cents 25 cents 25 cents 25 cents 25 cents 25 cents 40 cents
25 cents 25 cents 30 cents 25 cents 25 cents 25 cents 25 cents 25 cents 25 cents 25 cents 25 cents 25 cents 25 cents 25 cents 25 cents 25 cents 25 cents
Digitized for FRASER http://fraser.stlouisfed.org/ Federal Reserve Bank of St. Louis

Data on occupational earnings are presented in the following bulletins:
Numberof copies Area and payroll period
_________ Akron (June 1963)--------------------------------------------------------_________ Albany—Schenectady—Troy (Mar. 1963)--------------------------_________ Albuquerque (Apr. 1963)-----------------------------------------------_________ Allentown—Bethlehem—Easton (Feb. 1963)----------------------_________ Atlanta (May 1963)--------------------------------------------------------_________ Beaumont—Port Arthur (May 1963)---------------------------------
Birmingham (Apr. 1963)-----------------------------------------------_________ Boise (May 1963)----------------------------------------------------------_________ Canton (Apr. 1963)--------------------------------------------------------_________ Charleston (W. V a.), (Apr. 1963)---------------------------------_________ Charlotte (Apr. 1963)---------------------------------------------------_________ Cincinnati (Mar. 1963)--------------------------------------------------_________ Dayton (Jan. 1963)--------------------------------------------------------_________ Denver (Dec. 1962)-------------------------------------------------------_________ Des Moines (Feb. 1963)------------------------------------------------_________ Greenville (May 1963)--------------------------------------------------
_________ Indianapolis (Dec. 1962)-----------------------------------------------_________ Jackson (Feb. 1963)—---------------------------------------------------_________ Kansas City (Nov. 1962)-----------------------------------------------_________ Lawrence—Haverhill (June 1963)------------------------------------_________ Lubbock (June 1963)------------------------------------------------------_________ Memphis (Jan. 1963)----------------------------------------------------________ Miami (Dec. 1962)--------------------------------------------------------_________ Muskegon—Muskegon Heights (May 1963)------------------------________ Newark and Jersey City \Feb. 1963)-----------------------------________ New Haven (Jan. 1963)-------------------------------------------------________ Omaha (Oct. 1962)--------------------------------------------------------________ Paterson—Clifton—Passaic (May 1963)----------------------------________ Phoenix (Mar. 1963)----------------------------------------------------_________ Portland (Maine), (Nov. 1962)--------------------------------------________ Portland (Oreg.), (May 1963)---------------------------------------_________ Raleigh (Sept. 1962)------------------------------------------------------________ Richmond (Nov. 1962)--------------------------------------------------________ Rockford (Apr. 1963)---------------------------------------------------________ San Bernardino—Riverside-Ontario (Sept. 1962)--------------_________ Savannah (May 1963)---------------------------------------- ------------________ Scranton (Aug. 1962)----------------------------------------------------________ Sioux Falls (Oct. 1962)-------------------------------------------------________ South Bend (Mar. 1963)-------------------------------------------------________ Water bury (Mar. 1963)-------------------------------------------------
Worcester (June 1963)--------------------------------------------------________ York (Feb. 1963)----------------------------------------------------------
Bulletinnumber
1345-811345-531345-631345-451345-711345-671345-561345-741345-641345-611345-581345-541345-351345-321345-421345-681345-821345-261345-431345-221345-771345-721345-361345-331345-691345-461345-371345-121345-761345-571345-241345-731345-11345-191345-551345-91345-601345-51345-131345-521345-491345-801345-41
Price
20 cents 20 cents 20 cents 20 cents 25 cents 20 cents 20 cents 20 cents 20 cents 20 cents 20 cents 20 cents 20 cents 25 cents 20 cents 20 cents 25 cents 25 cents 20 cents 25 cents 20 cents 20 cents 25 cents 20 cents 20 cents 25 cents 20 cents 20 cents 20 cents 20 cents 20 cents 25 cents 20 cents 20 cents 20 cents 20 cents 20 cents 15 cents 20 cents 20 cents 20 cents 20 cents 20 cents
OCCUPATIONAL SUMMARY BULLETINS:
Number of copies________ Bulletin 1303-83 (Part H). Wages and Related Benefits, Metropolitan Areas, United
States and Regional Summaries, 1961—62.Presents information on occupational earnings, establishment practices, and supplementary wage provisions for all metropolitan areas combined and separately by industry division and region. Also provides analyses of wage differences and trends of occupational earnings. Price 50 cents.
________ Bulletin 1387. National Survey of Professional, Administrative. Technical, and ClericalPay, February^-March 1963.Fourth annual report provides information on nationwide salary levels and distributions in private industry for accountants, auditors, attorneys, chemists, engineers, engineering technicians, draftsmen, tracers, job analysts, directors of personnel, managers of office services, and clerical employees. Price 40 cents.
N am e____________________________________________________________________________
Address ____________________________________________________ ______________________
City _____________ ._______________________ State_________________Zip Code__________
Digitized for FRASER http://fraser.stlouisfed.org/ Federal Reserve Bank of St. Louis

Digitized for FRASER http://fraser.stlouisfed.org/ Federal Reserve Bank of St. Louis

![H20youryou[2] · 2020. 9. 1. · 65 pdf pdf xml xsd jpgis pdf ( ) pdf ( ) txt pdf jmp2.0 pdf xml xsd jpgis pdf ( ) pdf pdf ( ) pdf ( ) txt pdf pdf jmp2.0 jmp2.0 pdf xml xsd](https://img.dokumen.tips/doc/110x75/60af39aebf2201127e590ef7/h20youryou2-2020-9-1-65-pdf-pdf-xml-xsd-jpgis-pdf-pdf-txt-pdf-jmp20.jpg)


