Embed Size (px)
Citation preview
e
Bio
ener
gy
M
onito
ring
and
Ass
essm
ent
Bioenergy Environmental Impact Analysis (BIAS)of Ethanol Production from Sugar Cane in Tanzania Case Study: SEKAB/Bagamoyo
Env
ironm
ent
C
limat
e C
hang
Bernd Franke, Sven Gärtner, Susanne Köppen, Guido Reinhardt – IFEU, Germany Mugassa S.T. Rubindamayugi - University of Dar es Salaam, Tanzania Andrew Gordon-Maclean – Consultant, Dar es Salaam, Tanzania
Food and Agriculture Organization of the United Nations, Rome 201047

The conclusions given in this report are considered appropriate at the time of its preparation. They may be modified in the light of further knowledge gained at subsequent stages.
The designations employed and the presentation of material in this information product do not imply the expression of any opinion whatsoever on the part of the Food and Agriculture Organization of the United Nations (FAO) concerning the legal or development status of any country, territory, city or area or of its authorities, or concerning the delimitation of its frontiers or boundaries. The mention of specific companies or products of manufacturers, whether or not these have been patented, does not imply that these have been endorsed or recommended by FAO in preference to others of a similar nature that are not mentioned.
The views expressed in this information product are those of the author(s) and do not necessarily reflect the views of the Food and Agriculture Organization of the United Nations.
All rights reserved. Reproduction and dissemination of material in this information product for educational or other non-commercial purposes are authorized without any prior written permission from the copyright holders provided the source is fully acknowledged. Reproduction of material in this information product for resale or other commercial purposes is prohibited without written permission of the copyright holders.
Applications for such permission should be addressed to the Chief, Electronic Publishing Policy and Support Branch, Communication Division FAO Viale delle Terme di Caracalla, 00153 Rome, Italy or by e-mail to: [email protected]
© FAO 2010
Environment and Natural Resources Management Series 47 iii
Abstract This case study demonstrates strengths and weaknesses of the Bioenergy Environmental Impact Analysis framework (BIAS) in its draft form of 2009. The evaluation was conducted on the 21 000 ha bioethanol project of SEKAB near Bagamoyo, Tanzania.
The study shows that the BIAS framework is a useful tool in guiding the analysis of biofuel projects. It also underlines evidence that substantial site-specific data are required to sufficiently evaluate impact on all environmental areas: biodiversity, water, soil and greenhouse gases (GHG), especially soil carbon. Specific indicator values for thresholds are missing, but may be of limited usefulness in specific cases, due to necessary adaptation to local conditions.
Biodiversity Module The BIAS module for Assessment of biodiversity impacts requires thorough analysis of information which may or may not be available in sufficient detail. There need to be ways to credit and evaluate mitigation strategies that are implemented by project developers.
Water Module The BIAS framework provides suitable methodologies to address the impact on water availability. However, better accounting of the needs of existing and future competing users is essential for meaningful strategic planning. Also the year-to-year fluctuations of water availability need to be addressed with detailed site-specific data.
Soil Module Clear guidance for the evaluation of impacts on soil is given for: erosion risk, compaction risk, nutrient loss risk and carbon loss risk, with carbon stock evaluation in existing soil and future scenarios being the most prominent issue. Guidance to determine the reliability of the carbon stock value in existing soils and its change after conversion is not clear enough.
Greenhouse Gas Module Comprehensive guidance for evaluating GHG balances for biofuels indicates options for different methodologies, for which calculations can be adapted to the needs of the respective users. Both substitution and allocation methods should be used. In this particular case study the most intensive and expensive data need is local carbon stock (above and especially below ground), for which the determination and use are not clearly enough indicated, particularly in relation to land use change (direct and indirect).
General project recommendations As a lesson learned from this report, thorough site-specific assessments of the natural resources are suggested before concessions are made for large-scale plantations.
Bioenergy Environmental Impact Analysis (BIAS) of Ethanol Production from Sugar Cane in Tanzania Case Study: SEKAB/Bagamoyo
by: Bernd Franke, Sven Gärtner, Susanne Köppen, Guido Reinhardt – IFEU Heidelberg, Germany Mugassa S.T. Rubindamayugi - University of Dar es Salaam, Tanzania Andrew Gordon-Maclean – Consultant, Dar es Salaam, Tanzania
103 pages, 38 figures, 32 tables
FAO Environmental and Natural Resources Service Series, No. 47 – FAO, Rome, 2010
Keywords: Environmental impact assessment, strategic environmental assessment, evaluation and assessment methodology and tools, bioenergy, bioethanol, sustainability, biodiversity, greenhouse gas (GHG), water and soil quality, quantity and availability, land use change, models, databases, sugar cane, Tanzania
This series replaces the following: Environment and Energy Series, Remote Sensing Centre Series, Agrometeorology Working Papers A list of documents published in this FAO series and other information can be found at the Web site: www.fao.org/nr

Environment and Natural Resources Management Series 47 iv
Acknowledgements The authors appreciate the confidence expressed by the Food and Agriculture Organization (FAO), Rome by contracting IFEU to conduct this study. We particularly express our thanks to Rainer Krell (FAO Rome) and Rommert Schramm (FAO Dar es Salaam) for their support and helpful discussions.
A number of experts have contributed to the success of this study. We would especially like to express our gratitude to all who have actively supported the study by participating in technical discussions as well as submitting written and oral comments.
Special thanks go to our co-authors, Dr. Mugassa Rubindamayugi and Andrew Gordon-Maclean, who both provided extremely valuable insights and input from the Tanzanian perspective.
Heidelberg, Germany, 2010 Bernd Franke Sven O. Gärtner
Susanne Köppen Guido Reinhardt
ifeu - Institute for Energy and Environmental
Research Heidelberg Wilckensstr. 3, 69120 Heidelberg, Germany
Tel.: +49-(0)6221-4767-0, Fax: -19
E-mail: [email protected],
Website: www.ifeu.de

Environment and Natural Resources Management Series 47 v
Table of Contents 1 Goal and scope 1
2 The BIAS Analytical Framework 1
3 The SEKAB Bioethanol project in Bagamoyo 3 3.1 Tanzanian bioenergy strategy elements 3 3.2 The SEKAB project 3
4 Biodiversity impacts 6 4.1 Vegetation 6 4.2 Wildlife 11 4.3 Mitigation strategies to reduce the impact on wildlife 13
5 Agricultural water use 15 5.1 Impact on water availability 15 5.2 Impact of sugar cane cultivation on water quality 18 5.3 Mitigation strategies impact of sugar cane cultivation on water pollution 18 5.4 Impact of sugar cane processing and ethanol production on water quality 19 5.5 Mitigation measures to control impact of ethanol production processes 20 5.6 Other activities likely to impact water quality 20
6 Impact on soil 21 6.1 Information on soil conditions and properties 21 6.2 Feedstock farming practices likely to impact the environment 23 6.3 Impacts of sugar cane production or farming practices on the soil quality 24 6.4 Good farming practices for soil carbon management and to minimize soil
erosion 25 6.5 Environmental impact on soil of the processing of sugar cane feedstock 26 6.6 Conclusions 26
7 Greenhouse gas balance 27 7.1 Introduction 27 7.2 Methodology 28
7.2.1 Methodological details 28 7.2.2 General specifications for this study 30 7.2.3 Data sources and quality 30
7.3 Existing carbon stock 31 7.3.1 Estimate based on SEKAB field data 31 7.3.2 Estimate of carbon in biomass using global carbon map data 31
7.4 Land use change 34 7.5 Compliance with EU-RES Directive criteria using default values for GHG
savings 35 7.6 Description of life cycle scenarios 36

Environment and Natural Resources Management Series 47 vi
7.6.1 The SEKAB Bioethanol production system 36 7.6.2 Allocation 36 7.6.3 Substitution 37 7.6.4 Land use change 38
7.7 Results 39 7.7.1 Allocation 39 7.7.2 Substitution 41 7.7.3 Variation of subsequent land use 43 7.7.4 Variation of carbon stock in existing biomass 44
7.8 Conclusions 45
8 Applying the BIAS framework to other bioenergy projects in Tanzania 46
9 Conclusions and recommendations 47 9.1 SEKAB specific conclusions and recommendations 47 9.2 General recommendations for Tanzania 49 9.3 Lessons learnt with respect to the BIAS framework 49
10 References 51
11 Glossary 55
Appendix Biofuel companies in Tanzania 56

Environment and Natural Resources Management Series 47 1
1 Goal and scope
The Food and Agriculture Organization (FAO) commissioned the ifeu-Institute for Energy and Environmental Research Heidelberg, Germany, to conduct a case study to determine the workability of the Bioenergy Environmental Impact Analysis framework (BIAS) in its draft form (BIAS 2009) and to identify potentials for improvements. The bioethanol project of SEKAB near Bagamoyo, Tanzania was agreed with FAO as a suitable case study.
2 The BIAS Analytical Framework
The potential role of biomass within sustainable national energy systems is under discussion globally, and liquid biofuels for transport have received primary attention in the debate. In general, the overall environmental impacts of bioenergy are considered smaller than those of conventional (fossil and nuclear) energy systems, as renewable biomass is CO2-neutral when burnt, the resource base can be maintained if harvested biomass is re-grown, and residues easily decompose or can be recycled.
Still, land use is an important issue for biomass supply from energy crops, and land-use change can cause severe environmental impacts, e.g. biodiversity loss, and negative water and soil impacts. Also, the greenhouse-gas emission balance of bioenergy systems depends largely on land-use change effects. Thus, decision-makers in (national) governments, business, and societal stakeholders need to carefully elaborate the environmental pros and cons of bioenergy in order to develop this resource sustainably.
Given the challenges in addressing the various environmental concerns of bioenergy development, a framework is needed to assist concerned decision-makers and stakeholders – among others, project and policy planners, government agencies, private sector business, NGOs – in identifying and comparing the environmental impacts of bioenergy development options under consideration. For that, the BIAS project analyzed, synthesized and recommended environmental assessment methods and tools suitable for bioenergy assessment mainly on the national level, and also described data gaps, and methodological weaknesses which need further work.
The objective of the BIAS analytical framework is to provide an integrated yet simple approach for the comprehensive analysis of environmental impacts associated with production and use of biomass for bioenergy. It focuses on key impacts, i.e., biodiversity, soil and water and also greenhouse gas emissions, and briefly identifies linkages of these environmental impacts to food security issues. An overview of the BIAS framework is provided in Figure 2-1.
The indicators for BIAS modules are summarized in Table 2-1 and were selected based on "strength" (expression of potential impact), spatial (local, regional, global) scope of impact, and measurability (potential to be treated quantitatively with "field" or average data). The respective data needs to measure impacts through indicators and related tools (models, databases etc.) are discussed in each of the sections.

Environment and Natural Resources Management Series 47 2
Module Biodiversity
Module Water
Module Soil
Origin of biomass (feedstock, residual, waste)
No
use
of b
iom
ass
Sust
aina
ble
use
of
biom
ass
poss
ible
Requirements and restrictions for biomass use
Module Greenhouse Gases
Figure 2-1 BIAS logic and modules
Table 2-1 Environmental impacts and indicators for bioenergy systems considered in the BIAS framework
Area of concern Impact Possible Indicator
Biodiversity Protection of existing nature Naturalness; type of land for bioenergy production risk minimization approach
Biodiversity on managed land and changes on landscape level
Agrobiodiversity; type of land for bioenergy production risk minimization approach
Water Water availability for biomass production
Water stress, i.e. withdrawals per unit bioenergy [m³ per MJ]
Groundwater depletion Water stress in groundwater resources, i.e. withdrawals per unit bioenergy [m³ per MJ ]
Soil Carbon loss Change in carbon content of soils [t C per hectare in the next 20-100 years]
Nutrient loss Changes in nutrient content (N, P, K) in soil [kg per kg soil]
Soil erosion Loss of soil [kg per hectare per year] Climate change Global warming GHG emissions [kg CO2 eq per MJ]
Ecosystem resilience
Freshwater and terrestrial toxicity
Ecotoxicity potential [kg 1,4-dichlorobenzene-eq per MJ]
Eutrophication in aquatic and terrestrial ecosystems Eutrophication potential [kg PO4eq per MJ]
Other areas Human health Life days lost [Person-days lost per MJ] Acidification Acid deposition [kg SO2 eq per MJ]
Depletion of natural resources
Use of primary non-renewable energy [MJprimary per MJbio]
Environment and Natural Resources Management Series 47 3
3 The SEKAB Bioethanol project in Bagamoyo
3.1 Tanzanian bioenergy strategy elements
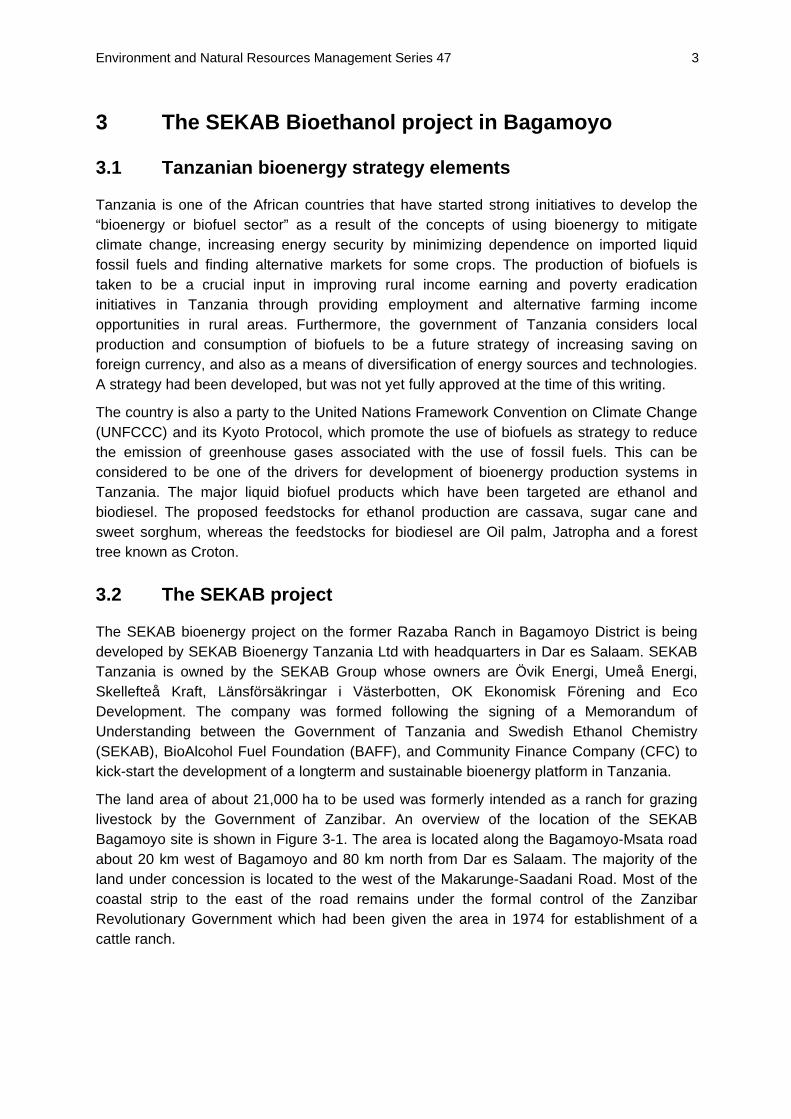
Tanzania is one of the African countries that have started strong initiatives to develop the “bioenergy or biofuel sector” as a result of the concepts of using bioenergy to mitigate climate change, increasing energy security by minimizing dependence on imported liquid fossil fuels and finding alternative markets for some crops. The production of biofuels is taken to be a crucial input in improving rural income earning and poverty eradication initiatives in Tanzania through providing employment and alternative farming income opportunities in rural areas. Furthermore, the government of Tanzania considers local production and consumption of biofuels to be a future strategy of increasing saving on foreign currency, and also as a means of diversification of energy sources and technologies. A strategy had been developed, but was not yet fully approved at the time of this writing.
The country is also a party to the United Nations Framework Convention on Climate Change (UNFCCC) and its Kyoto Protocol, which promote the use of biofuels as strategy to reduce the emission of greenhouse gases associated with the use of fossil fuels. This can be considered to be one of the drivers for development of bioenergy production systems in Tanzania. The major liquid biofuel products which have been targeted are ethanol and biodiesel. The proposed feedstocks for ethanol production are cassava, sugar cane and sweet sorghum, whereas the feedstocks for biodiesel are Oil palm, Jatropha and a forest tree known as Croton.
3.2 The SEKAB project
The SEKAB bioenergy project on the former Razaba Ranch in Bagamoyo District is being developed by SEKAB Bioenergy Tanzania Ltd with headquarters in Dar es Salaam. SEKAB Tanzania is owned by the SEKAB Group whose owners are Övik Energi, Umeå Energi, Skellefteå Kraft, Länsförsäkringar i Västerbotten, OK Ekonomisk Förening and Eco Development. The company was formed following the signing of a Memorandum of Understanding between the Government of Tanzania and Swedish Ethanol Chemistry (SEKAB), BioAlcohol Fuel Foundation (BAFF), and Community Finance Company (CFC) to kick-start the development of a longterm and sustainable bioenergy platform in Tanzania.
The land area of about 21,000 ha to be used was formerly intended as a ranch for grazing livestock by the Government of Zanzibar. An overview of the location of the SEKAB Bagamoyo site is shown in Figure 3-1. The area is located along the Bagamoyo-Msata road about 20 km west of Bagamoyo and 80 km north from Dar es Salaam. The majority of the land under concession is located to the west of the Makarunge-Saadani Road. Most of the coastal strip to the east of the road remains under the formal control of the Zanzibar Revolutionary Government which had been given the area in 1974 for establishment of a cattle ranch.

Environment and Natural Resources Management Series 47 4
Figure 3-1 Location of the SEKAB Bagamoyo project site (overview and layout) (SEKAB 2008a)
SEKAB proposes to build a state-of-the-art bioethanol plant and implement the project in phases. Initially, about 4,000 to 6,000 ha of sugar cane will be planted; ethanol production

Environment and Natural Resources Management Series 47 5
would start in the year 2011. Outgrower capacity will be developed in parallel and is expected to add another 5,000 ha in 10 years time. In full production, this implies processing of over 1 million tons of harvested cane during the nine production months.
An overview of the components of the Bagamoyo facility is shown in Figure 3-2; the plant consists of the following areas:
cane reception & juice extraction unit, power plant using Bagasse and woodchips for production of process steam and
power for internal needs as well as for the grid, alcohol distillery to convert fermentable sugars in the cane juice as well as sugars in
molasses from other Tanzanian mills to ethanol, infrastructures to provide the main industrial plants with cooling & process water,
molasses storage capacity, alcohol storage facilities, vinasse storage capacity and treatment until disposal of the vinasse as fertilizer.
Figure 3-2 Simplified process flowsheet for the SEKAB Bagamoyo plant (SEKAB 2008a)

Environment and Natural Resources Management Series 47 6
4 Biodiversity impacts
4.1 Vegetation
The vegetation of the Bagamoyo District comprises a mosaic of coastal forest, coastal bushland, thicket, grassland, degraded Brachystegia (Miombo) woodland, fallow and cultivated areas. Of these, the remaining patches of coastal forest contain most of the rare and endemic plant species found in the district.
The Environmental and Social Impact Analysis (ESIA) carried out by SEKAB (SEKAB 2008a) summarizes the vegetation as follows:
“Bio-geographically the Razaba Area belongs to the East African Coastal Forests Zone that occurs in a narrow belt along the Indian Ocean from Southern Somalia to Mozambique. Humans and their domesticated animals have long ago turned the coastal forest in the Razaba Area into a semi natural woodland habitat with bushland, dry grassland, forest thickets, seasonally flooded plains, cultivation plots and a number of modified, natural habitats such as mangroves and riverine forest remnants. The closest relatively intact coastal forest fragment is the Zaraninge Forest in Saadani National Park about 20 km north of the study area.
In the northern part of the area there are forest remnants dominated by various species known as African ebony: Diospyros bussei, Diospyros cornii and Manilkara mochisia. However, the majority of the Razaba Area is covered by acacia woodlands mixed with other species such as Spirostachys africana and Terminalia spp. Vegetation types dominated by pure stands of Acacia zanzibarica are found on the black cotton soils in a belt from the Ruvu River through the Eastern part of the area to the other side of the Wami River continuing into Saadani National Park. The persistence of coarse grasses hinders the spread of the thickets to make continuous woodland.
Riverine vegetation occurs in narrow strips of land following the riverbanks or streams and is dominated by evergreen thickets of fig trees (Ficus sur) and other species indicating abundant ground water. The streams cause siltation and temporary swamps during the rainy seasons. These swamps and existing dams on the former Razaba Ranch Area are important for the biodiversity of the area and are used as sources of water by both wild and domestic animals.
The vegetation on the coastal flood plain is dominated by palm species with Hyphaene compressa as the most dominant species. Most water logged areas are covered by grasses especially elephant grass (Pennisetum purpureum) following re-current bush fires. Part of the coastal plain is seasonally flooded. Most of the ponds and dams established by the Razaba Ranch still exist and supply water to livestock and human use. The proposed project area is also to a small extent (less than 0.1% of the proposed project area) used for seasonal cultivation of maize and other crops in the Wami Flood Plains despite its legal status as government land. Some guava, mango and custard apple trees were observed, however these might be remnants also of farming activities prior to the creation of Razaba Ranch. Outside the proposed project area mangroves occur at the estuaries of Ruvu and Wami Rivers dominated by five species: Avicennia marina, Bruguiero gymnorrhiza, Sonneratia alba, Ceriops tagal and Rhizophora mucronata. The mangrove areas are harvested for building poles, boat building, charcoal and export trade. Further the mangroves trap terrestrial sediments, litter and nutrients and are thus very important for the protection of other near-shore ecosystems such as sea-grass beds and coral reefs. Mangroves form nutrient rich environments and function as feeding and nursery ground to many species of fish, shellfish, prawns and crabs. Furthermore it has been proven that mangroves are very important for coastal protection as well as for biodiversity conservation.
Environment and Natural Resources Management Series 47 7
Most rare and endemic species are found within the forest thickets and in the riverine vegetation in the northern part of the project area. Such species include the endemic Encephalartos hildebrandtii (Cycad tree), the endangered Dalbergia melanoxylon and Trichalysia sp..
The mangroves at the Razaba area are outside the proposed project area. However as they are at the mouths of the Wami and Ruvu Rivers it is very important to ensure that these areas are not destroyed by silt or chemicals transported by the water from the project. Also it is important to ensure that the project does not cause large changes in water flow which may influence the mangroves. Scattered large baobab trees, Adansonia digitata, and, in the northern part of the area, also acacia trees give the area its unique character and should be spared wherever possible.”
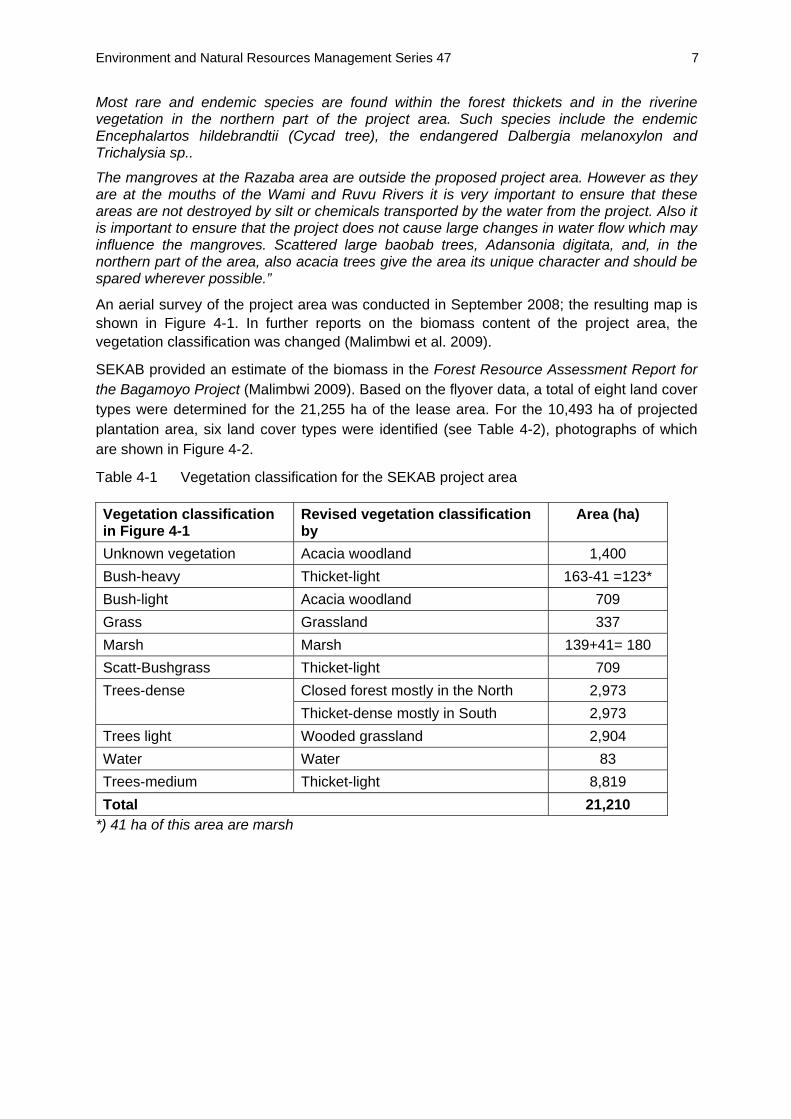
An aerial survey of the project area was conducted in September 2008; the resulting map is shown in Figure 4-1. In further reports on the biomass content of the project area, the vegetation classification was changed (Malimbwi et al. 2009).
SEKAB provided an estimate of the biomass in the Forest Resource Assessment Report for the Bagamoyo Project (Malimbwi 2009). Based on the flyover data, a total of eight land cover types were determined for the 21,255 ha of the lease area. For the 10,493 ha of projected plantation area, six land cover types were identified (see Table 4-2), photographs of which are shown in Figure 4-2.
Table 4-1 Vegetation classification for the SEKAB project area
Vegetation classification in Figure 4-1
Revised vegetation classification by
Area (ha)
Unknown vegetation Acacia woodland 1,400 Bush-heavy Thicket-light 163-41 =123* Bush-light Acacia woodland 709 Grass Grassland 337 Marsh Marsh 139+41= 180 Scatt-Bushgrass Thicket-light 709
Closed forest mostly in the North 2,973 Trees-dense Thicket-dense mostly in South 2,973
Trees light Wooded grassland 2,904 Water Water 83 Trees-medium Thicket-light 8,819 Total 21,210
*) 41 ha of this area are marsh

Environment and Natural Resources Management Series 47 8
Figure 4-1 Vegetation types in the SEKAB Bagamoyo project area (SEKAB 2008a)

Environment and Natural Resources Management Series 47 9
Figure 4-2 Vegetation types in SEKAB potential plantation areas

Environment and Natural Resources Management Series 47 10
Figure 4-3 Africover land cover of the vicinity of the SEKAB lease area
Table 4-2 Land cover at SEKAB lease and plantation areas
Vegetation type Total area [ha]
Fraction [%]
Plantation area [ha]
Fraction [%]
Thicket-light 9,696 45.6% 4,564 43% Closed forest 2,973 14.0% 1,304 12% Thicket-dense 2,973 14.0% 1,181 11% Wooded grassland 2,904 13.7% 1,463 14% Acacia woodland 2,109 9.9% 1,746 17% Grassland 337 1.6% 235 2% Swamp or Marsh 180 0.8% Water 83 0.4% Total 21,255 100.0% 10,493 100%
The data from the September 2008 flyover can be compared with the data from FAO Africover database that has been produced from visual interpretation of digitally enhanced LANDSAT TM images (Bands 4,3,2) acquired mainly in the year 1997. The land cover classes have been developed using the FAO/UNEP international standard LCCS classification system. A map of the surroundings of the project area using Africover data is shown in Figure 4-3; the relevant land cover types are listed in Table 4-3. Unfortunately, the difference in the classification schemes does not allow for an easy comparison between the flyover interpretation and the Africover database. It appears, however, that areas identified as woodland and forest has diminished from 46% (closed woody vegetation, woodland, and forest) to 29% (closed forest, acacia woodland).

Environment and Natural Resources Management Series 47 11
Table 4-3 Land cover at SEKAB lease area based on Africover data
Land cover Area [ha] Fraction [percent] Shrubland 5,739 27% Closed woody vegetation 4,038 19% Woodland 3,401 16% Forest 2,338 11% Tree savannah 2,338 11% Thicket 1,913 9% Herbaceous vegetation on flooded land 1,063 5% Shrub savannah 213 1% Total 21,255 100%
4.2 Wildlife
The Environmental and Social Impact Analysis (ESIA) carried out by SEKAB (SEKAB 2008a) summarizes the wildlife situation as follows:
“The project area is potentially rich in wildlife and shares many species with the adjacent Saadani National Park. All taxonomic groups including mammals, birds, reptiles, amphibians, fish and many invertebrate groups are represented. The area has high diversity of both resident and migratory bird species with the composition and abundance of species changing with seasons due to intra-African and Palaearctic migrations. The importance of Makurunge coastal area for bird conservation is indicated by the high abundance of birds observed during the EIA survey. More than 20 different large mammals are reported from the area. Warthog, duiker, Sykes monkey and yellow baboons were physically observed during the EIA survey while elephants, hippos, bush pig, buffalo and reedbuck were recorded through animal signs. Local hunters and other local people further reported the presence of such notable mammals as lion, leopard and black and white colobus. This was confirmed by the additional wildlife surveys carried out from July to October 2008.
Most mammals occurring in the area are at Lower Risk according to the IUCN Red List. Two species the lion and the hippopotamus are Vulnerable, the leopard and the African elephant are Near Threatened. Observations suggest that most species are threatened by loss of habitat and overexploitation.”
The Bagamoyo District Coastal Forests are listed as Important Bird Area1 (IBA) No. 46. North of Sekab’s Razaba farm, the Zaraninge Forest Reserve has now been annexed to Sadaani national park. Surveys of the near-by Zaraninge coastal forest show a rich faunal and floral diversity containing several endemic species. Forested habitat types within the area will probably hold similar biodiversity patterns. However the demand for charcoal, which is the major source of cooking fuel in Tanzania, is driving a great deal of deforestation in the area.
1 IBA = Important Bird Area as identified by Neil and Liz Baker who work on the bird Atlas in
Tanzania (http://tanzaniabirdatlas.com/important-bird-areas/important-bird-areas-iba-tanzania)

Environment and Natural Resources Management Series 47 12
Table 4-4 provides a list of species present in the Zaraninge Forest Reserve near the Bagamoyo district along with the respective IUCN classification.
Table 4-4 Threatened species recorded in the Zaraninge Forest Reserve
Scientific name Common name IUCN Classification
Rhynchocyon Petersi) Black and rufus elephant shrew (eng) NT=near threatened ver 3.1 (2001
Beamys hindei Lesser hamster-rat NT=near threatened ver 3.1 (2001) Galagoides rondensis Rondo galago CR=critically endangered Loxodonta africana African elephant VU=vulnerable A2a ver 3.1 (2001) Anthreptes reichenowi Plain-backed sunbird NT=near threatened ver 3.1 (2001)
Circaetus fasciolatus Southern banded snake-eagle
NT=near threatened ver 3.1 (2001)
Zoothera guttata Spotted ground thrush EN=endangered
Anthus sokokensis Sokoke pipit VU=vulnerable
Sheppardia gunningi East coast akalat VU=vulnerable
Source: Perking unpublished data, Baker and Baker 2002
IUCN, the International Union for Conservation of Nature and Natural Resources2 is the only organisation that produces the red list or (red data list) of endangered and threatened species for use in Tanzania. The IUCN Red List of Threatened Species™ is widely recognized as the most comprehensive, objective global approach for evaluating the conservation status of plant and animal species. From its small beginning, the IUCN Red List has grown in size and complexity and now plays an increasingly prominent role in guiding conservation activities of governments, NGOs and scientific institutions. The introduction in 1994 of a scientifically rigorous approach to determine risks of extinction that is applicable to all species, has become a world standard. In order to produce the IUCN Red List of Threatened Species™, the IUCN Species Programme working with the IUCN Survival Commission (SSC) and with members of IUCN draws on and mobilizes a network of scientists and partner organizations working in almost every country in the world, who collectively hold what is likely the most complete scientific knowledge base on the biology and conservation status of species.
In terms of threatened mammals present, the rondo galago is the most endangered bushbaby in the world and is found in Zaraninge forest. It is possible that it can also be found in other coastal forests and thickets in the area, and further surveys are required (Perkin 2003). Further field surveys are also needed to assess the status of isolated populations of the central Africa tree hyrax found in coastal forest and thicket near the Wami River at the Kisampa wildlife conservancy. There are also migrant groups of elephant in the area. In evergreen forests and thicket patches contain coastal forest endemic species such as little
2 http://www.iucnredlist.org/static/programme

Environment and Natural Resources Management Series 47 13
yellow flycatcher, black and rufus elephant shrew and many plants (Gordon-Maclean et al. 2008, Burgess and Clarke 2001).
Further, the following species endemic and near endemic to coastal forests recorded for Zaraninge3:
Mammals and reptiles East African Collared fruit bat Myonycteris relicta Black and white colobus Colobus angolensis Garnett’s galago Otolemur garnettii (Ogilby, 1838) Zanzibar galago Galagoides zanzibaricus (Matschie, 1893) Rondo galago Galagoides rondoensis Red bellied coast squirrel Paraxerus palliatus (Peters, 1852) Lesser pouched rat Beamys hindei Thomas, 1909 Unidentified shrew Crocidura sp. Green Keel-bellied lizard Gastropholis prasina Broadley’s dwarf gecko Lygodactylus broadleyi¤ Pasteur, 1995 Copal dwarf gecko Lygodactylus viscatus¤
Birds Southern Banded Snake Eagle Circaetus fasciolatus Livingstone’s Turaco Tauraco livingstonii Yellowbill Ceuthmochares aereus Eastern Green Tinkerbird Pogoniulus simplex Sokoke Pipit Anthus sokokensis Little Greenbul Andropadus virens Fischer’s Greenbul Phyllastrephus fischeri Pale-breasted Illadopsis Illadopsis rufipennis East Coast Akalat Sheppardia gunningi Kretschmer’s Longbill Macrosphenus kretschmeri Little Yellow Flycatcher Erythrocercus holochlorus Uluguru Violet-backed Sunbird Anthreptes neglectus
4.3 Mitigation strategies to reduce the impact on wildlife
The proximity of the site to Saadani National Park had created questions about how to manage incursions of elephants and other animals into the farms. SEKAB and the Tanzanian government are in the process to deal with potential wildlife-human conflict. Farming activities in this area should not clear any evergreen forest and thicket patches that may remain as they contain coastal forest endemic species such as little yellow flycatcher, black and rufus elephant shrew and many plants (Gordon-Maclean et al. 2008, Burgess and Clarke 2001).
3 Source: Burgess and Clarke 2000, Baker and Baker 2002, Perkin unpublished data.

Environment and Natural Resources Management Series 47 14
SEKAB plans to maintain part of the biodiversity of the area, including the endemic plant species with the following steps (SEKAB 2008a):
Specific protection measures for existing habitats for endemic species Protection of biodiversity zones Protection of existing water sources & maintenance of a minimum of 60 m wide river
bank buffer zone along the Wami River Preservation of buffer zone of 30 m along small seasonal streams is recommended Location of constructed drainage channels done with environmental consideration Keeping large individual trees & forest patches Clearing of vegetation & carrying out of earth movement & construction work planned
in such a way that most animals get a chance to escape Responsible soil management Endemic & / or threatened species as far as practically possible left untouched & / or
resettled / replanted within protected biodiversity zones & / or other suitably protected areas
Advice & support to nearby farmers who may suffer from increased wildlife foraging on their fields
Encouragement & support local communities to establish wildlife management areas Assistance to local communities to control problem animals Possible cooperation with Saadani National Park in involving relevant adjoining
villagers in wildlife protection & ecotourism
Environment and Natural Resources Management Series 47 15
5 Agricultural water use
5.1 Impact on water availability
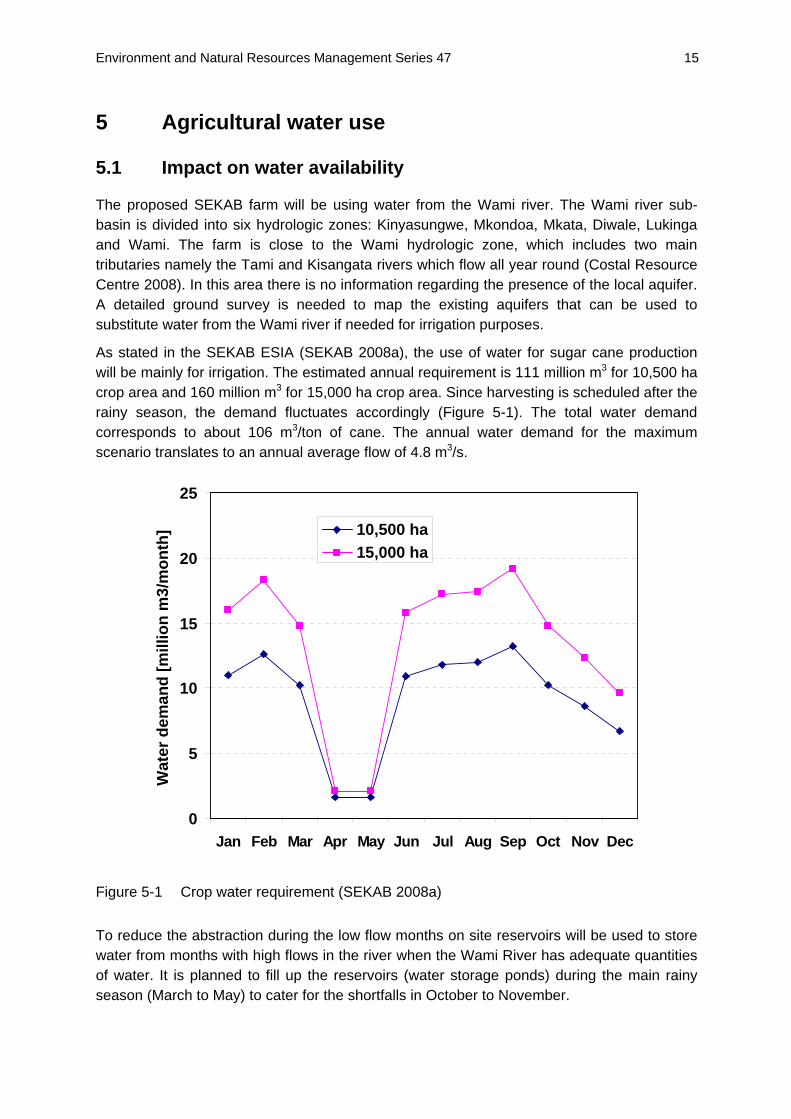
The proposed SEKAB farm will be using water from the Wami river. The Wami river sub-basin is divided into six hydrologic zones: Kinyasungwe, Mkondoa, Mkata, Diwale, Lukinga and Wami. The farm is close to the Wami hydrologic zone, which includes two main tributaries namely the Tami and Kisangata rivers which flow all year round (Costal Resource Centre 2008). In this area there is no information regarding the presence of the local aquifer. A detailed ground survey is needed to map the existing aquifers that can be used to substitute water from the Wami river if needed for irrigation purposes.
As stated in the SEKAB ESIA (SEKAB 2008a), the use of water for sugar cane production will be mainly for irrigation. The estimated annual requirement is 111 million m3 for 10,500 ha crop area and 160 million m3 for 15,000 ha crop area. Since harvesting is scheduled after the rainy season, the demand fluctuates accordingly (Figure 5-1). The total water demand corresponds to about 106 m3/ton of cane. The annual water demand for the maximum scenario translates to an annual average flow of 4.8 m3/s.
0
5
10
15
20
25
Jan Feb Mar Apr May Jun Jul Aug Sep Oct Nov Dec
Wat
er d
eman
d [m
illio
n m
3/m
onth
] 10,500 ha15,000 ha
Figure 5-1 Crop water requirement (SEKAB 2008a)
To reduce the abstraction during the low flow months on site reservoirs will be used to store water from months with high flows in the river when the Wami River has adequate quantities of water. It is planned to fill up the reservoirs (water storage ponds) during the main rainy season (March to May) to cater for the shortfalls in October to November.

Environment and Natural Resources Management Series 47 16
This raises the concern on having impact on water availability due to the fact that the production will mainly depend on irrigation. The water flow in the Wami River recorded at the Mandera station for 50 years (Jan 1954 to Aug 2003), indicating flow to be at its peak in April (Figure 5-2). In an average year, the required amount 160 million m3 of water is equivalent to about 10% of the flow of the Wami river. For the minimum year, about 40% of the water would be diverted for irrigation; for “mean-stdev” it would be about 20%.
Figure 5-2 Wami River water flow at Mandera (Valimba 2007)
Irrigation water use is expected to increase from 0.59 m3/s at the beginning of June 2009 to 11.8 m3/s when the project will reach completion. The final daily irrigation water use will vary between 2.0 m3/s and 11.8 m3/s, fluctuating between 6.1 m3/s and 11.8 m3/s from June to March (highest: 1st January – 10th March) and between 2.0 m3/s and 1.6 m3/s from March to June. The harvesting of rainwater, reuse of wastewater and drip irrigation will contribute to minimize withdrawal of river water.
The total water demand for the industrial plant including the power station will be around 300 m3/h (= 0.083 m3/s) which corresponds to about 1.5 m3/ton of cane. The net total estimated inflow rate to waste water treatment plant is expected to be 52 m3/h.
One of the steps taken to minimize water use is the proposed application of dry cane washing may be used instead of wet washing. The typical water use for wet cane washing (5 m³/ton of cane) may be reduced by the replacement with dry cane washing with high pressure blowers. Although more energy intensive the volumes of water effluent would be greatly reduced. In the proposed project, cleaning of sugar cane will be done using compressed air (a dry process) consequently virtually no wastewater will be produced.
It is known that irrigation of sugar cane consumes large amounts of water and therefore demands effective water conservation measures (Ramjeawon, 2004). This demands that

Environment and Natural Resources Management Series 47 17
SEKAB has to take effective measures to have effective irrigation system for conserving water use.
Efficient irrigation systems to be used by SEKAB to reduce water consumption include the following measures:
• Use of drip irrigation which minimizes water use • Construction of water storage reservoirs to store water from the river Wami during the
months of high water flow (March-May). This will allow adequate flow of freshwater for downstream estuarine and marine ecosystem needs. The storage reservoirs will also be used as rainwater harvesters to keep sufficient irrigation water for the rest of the year
• SEKAB intends to investigate the possibility of groundwater use for irrigation by drilling boreholes for water supply. However, this cannot be regarded as an efficient irrigation measure, if it is depleting a finite and limited resource – groundwater.
• Recycling of water by collecting drain water in special designated ponds and recycling it through irrigation ponds
• Recycling of wastewater from the different steps of feedstock processing and domestic wastewater which will be around 16.3 million m3/year.
These mitigation measures, intended to minimize ecological damage due to reduction in water quantity to the downstream aquatic ecosystems, have a number of limitations, such as:
• Inadequate availability of information on availability and current and future demand of water in Bagamoyo District
• Lack of information on environmental flows of Wami and Ruvu Rivers which could be used to predict impact of water extraction and abstraction on downstream ecological systems
• Groundwater extraction is not sustainable without extensive prior studies on the aquifers, their replenishment and other user needs
• Lack of water right allocation to different users in relation with existing water availability from the two rivers
• The estimated water demand reported in the EIS does not include the demand for irrigation by the sugar cane outgrowers.
Interviews carried out by consultant Riziki Shemdoe with representatives from the Tanzania Coastal Management Partnership for Sustainable Coastal Communities and Ecosystems in Tanzania brought to light their worries about the salinisation risks that affect the river ecosystem (Gordon-Maclean 2009). Since the saline ocean water flows back up the river to a distance of up to 50 kilometres. If more water is drawn out from the Wami River for different purposes, the influx of salt water may affect the river ecosystems, affect and the wildlife in the Wami Mbiki Game Reserve as well as that in Saadani National Park. More hydrologic studies are needed in the area before more water can be used for irrigation.
Environment and Natural Resources Management Series 47 18
There has been controversy about the ESIA carried out by SEKAB (SEKAB 2008a), which has now featured in the press in Sweden4. Orgut, the consultancy company apparently claims that SEKAB has left out details of the original report which showed that there was an insufficient amount of water present for their irrigation scheme. The original analysis used no quantitative water indicators and did not mention national guidelines. The original analysis relied on the data shown in Figure 5-2 which demonstrates that in dry years, a large amount of water would be diverted. The original report stressed that no quantitative analysis on the adverse impacts of building a water reservoir and on other water uses was provided.
5.2 Impact of sugar cane cultivation on water quality
As stated in the SEKAB ESIA [SEKAB 2008a, the sugar cane farming practices will involve use of agrochemicals in form of artificial fertilizers, herbicides and pesticides. The herbicides used will be the same as those currently imported for use in the sugar industry in Tanzania, which is also certified by the Tanzania Pesticide Research Institute (TPRI). Handling and use of these agrochemicals will be according to the Pesticide Control Regulation of 1984. The application of herbicides to control weeds is expected to be gradually reduced by exercising biological control through use of sugar cane residues as soil surface cover. The use of the herbicides and pesticides is likely to pollute the soil and water.
As indicated in the ESIA, the project area soils have a high deficiency of nitrogen, phosphorous and potassium nutrients. This will necessitate artificial fertilizer applications until the plant-soil system attains the capacity to supply the nutrients biogenically, but no agronomic plans were presented to achieve such biological fertilization. It is instead estimated that, at full production capacity the project will use up to 3,400 tons of diammonium phosphate (DAP) and 5,100 tons of urea per annum. This creates a high potential for N and P leaching into ground and surface water which would negatively impact future human ground water use and downstream aquatic ecosystems through eutrophication. A quantification of the risk was not attempted in this report.
Irrigation induced salinity impacts water quality and could impact the soil ecosystem and thus long-term sugar cane production. Salinity can increase as a result of increase in groundwater levels due to irrigation. In addition, the ESIA indicates that the position of the project site close to marine and estuarine ecosystems makes at least some project sites susceptible to irrigation induced salinity. This has been indicated by rise in water salinity in dammed water.
5.3 Mitigation strategies impact of sugar cane cultivation on water pollution
The mitigation measures proposed to minimize pollution from agrochemicals will include:
Considering alternative biological or environment-friendly weed control practices, which, however, are not clearly mentioned. Some of these methods have both risks and benefits. It is good to select well known weed control practices and advocate their application before starting the project.
4 http://www.dn.se/opinion/debatt/svenskt-bistand-ska-radda-miljofarligt-etanolprojekt-1.843272

Environment and Natural Resources Management Series 47 19
It is also stated in the ESIA report that efforts will be made to minimize environmental impacts from the use of artificial fertilizers by rotating the sugar cane crop with nitrogen fixing crops and non-crop plants like legumes. This could be a good farming practice for outgrowers who will be contracted to supply sugar cane. It can minimize impact on water pollution as a result of nutrient leaching to water bodies which can contribute to eutrophication.
There is a need to undertake studies to identify the sites which are likely to be susceptible to irrigation induced salinity, so that an alternative irrigation system can be designed with no negative effect related to salination.
The proposed use of drip irrigation which minimizes water and fertilizer use will also help to reduce pollution from agrochemicals.
Construction of water storage reservoirs to capture run off water will also reduce nutrient flow to surface water. The nutrients can also be recycled as part of drain water in irrigation ponds
Sediments from erosion together with some pesticide Another method not mentioned in the ESIA report is the use of riparian buffer zones
around sugar cane plantations planted with grass vegetation which could trap the nutrients and suspended sediments.
5.4 Impact of sugar cane processing and ethanol production on water quality
The processing of harvested sugar cane to ethanol involves a number of activities and the production of by-products and waste. Some of the wastes can have great impact on the soil and water in terms pollution load, and at the same time some of the wastes have potential economic use which can contribute to minimize their pollution hazards or load.
The ESIA (SEKAB 2008a) list of activities for processing of harvested sugar cane includes:
Sugar cane milling or crushing to extract juice Juice extraction and clarification which will generate filter cake Sugar cane juice concentration to sugar cane syrup through water evaporation Pre-treatment of fermentable feedstock consisting of a mixture of molasses and
sugar cane juice Fermentation of a mixture of molasses and sugar cane syrup into a mash Distillation of fermented mash to produce ethanol (produce 8-9 L vinasse/1 L ethanol) Dehydration of hydrous ethanol to anhydrous ethanol (96%) using molecular sieves Dehydration of vinasse to concentrate it to 50% and 65% dry matter
The major activity which will produce water polluting by-products is the distillation process that produces liquid vinasse. At the estimated ethanol production capacity of 400 m3 ethanol/day, the distillation plant will generate 3,200 – 3,600 m3 vinasse/day. This is earmarked for use as fertilizer together with filter cake which will be produced in the process of sugar cane juice extraction, clarification and syrup preparation. The EIS report has listed the environmental risks which can occur with uncontrolled discharge of vinasse that includes change in soil quality and pollution of surface and groundwater.

Environment and Natural Resources Management Series 47 20
5.5 Mitigation measures to control impact of ethanol production processes
Mitigation measures proposed to prevent water pollution from vinasse and effluent from the industrial are the following:
(1) There will be restrictions prohibiting application of vinasse as a fertilizer in the following situations and areas:
• Flooded areas or areas prone to flooding • Land within 200 meters from lakes, streams and rivers • Areas reserved for biodiversity protection • On land with a high water table
(2) The infrastructure for vinasse storage, processing and distribution will be maintained to prevent uncontrolled leakage and spills
(3) Treatment of liquid effluents from industries in designated wastewater treatment plants.
5.6 Other activities likely to impact water quality
The project will have supporting infrastructure like residential houses for workers, offices, garages and factories. These infrastructures will produce domestic wastewater; petroleum based waste sludge and other chemical wastes. The ESIA report has indicated a plan to have wastewater treatment facilities. There could also be accidental spills from the factory or from pipes or ponds holding vinasse or from other potential fluid pollutants. It is advised to introduce mitigation plans for such problems in the current mitigation plan.
Environment and Natural Resources Management Series 47 21
6 Impact on soil
6.1 Information on soil conditions and properties
Soils at the SEKAB site earmarked for sugar cane production are described as sandy. Outgrower areas are not included but are likely to be similar. The ESIA summarizes the soil situation as follows (SEKAB 2008a):
The Razaba Ranch is located in an old, uplifted and dissected coastal plain. Its topography is largely gently undulating to rolling, characterised by extensive plains, low hills or ridges, bottomlands and shallow valleys (see Figure 4.2). The terrain is rising gradually from the coastal mudflats to about 30-40 m above sea level at the western border of the area. The soils are based on old, dissected sand dunes, with grey sandy soils (locally called mbuga) on the main central areas, falling away to alluvial sands and clays along the Wami river (northern boundary) and the Ruvu river (to the South-East). The sandy topsoil which is prevalent is susceptible to erosion during farming operations. Organic matter (OM), phosphorus and potassium are the most limiting parameters for all soils in the Razaba area.
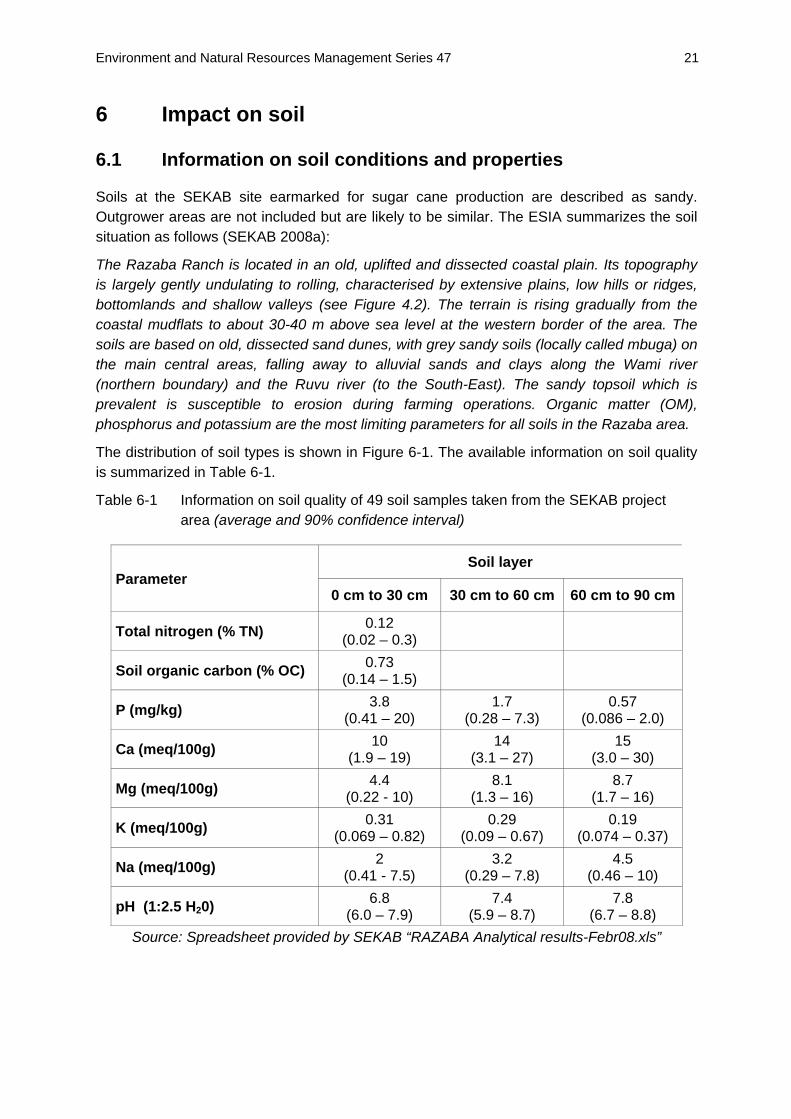
The distribution of soil types is shown in Figure 6-1. The available information on soil quality is summarized in Table 6-1.
Table 6-1 Information on soil quality of 49 soil samples taken from the SEKAB project area (average and 90% confidence interval)
Soil layer Parameter
0 cm to 30 cm 30 cm to 60 cm 60 cm to 90 cm
Total nitrogen (% TN) 0.12 (0.02 – 0.3)
Soil organic carbon (% OC) 0.73 (0.14 – 1.5)
P (mg/kg) 3.8 (0.41 – 20)
1.7 (0.28 – 7.3)
0.57 (0.086 – 2.0)
Ca (meq/100g) 10 (1.9 – 19)
14 (3.1 – 27)
15 (3.0 – 30)
Mg (meq/100g) 4.4 (0.22 - 10)
8.1 (1.3 – 16)
8.7 (1.7 – 16)
K (meq/100g) 0.31 (0.069 – 0.82)
0.29 (0.09 – 0.67)
0.19 (0.074 – 0.37)
Na (meq/100g) 2 (0.41 - 7.5)
3.2 (0.29 – 7.8)
4.5 (0.46 – 10)
pH (1:2.5 H20) 6.8 (6.0 – 7.9)
7.4 (5.9 – 8.7)
7.8 (6.7 – 8.8)
Source: Spreadsheet provided by SEKAB “RAZABA Analytical results-Febr08.xls”

Environment and Natural Resources Management Series 47 22
Figure 6-1 Soil map for SEKAB Bagamoyo project area (SEKAB 2008a)

Environment and Natural Resources Management Series 47 23
Current soil organic carbon stocks have been calculated as an average from 49 soil samples in the 0-30 cm level5. The measurements show a large spread of soil organic carbon content from 0.04% to 2.33% with a mean value of 0.73%. The cumulative frequency distribution of the data is shown in Figure 6-2. Given the large variability of the data, there is considerable uncertainty of the mean value for the project area.
0%
10%
20%
30%
40%
50%
60%
70%
80%
90%
100%
0.00 0.50 1.00 1.50 2.00 2.50
Soil organic carbon, %
Cum
ulat
ive
freq
uenc
y, %
Figure 6-2 Cumulative frequency chart of soil organic carbon at SEKAB area
The bulk density of the predominantly sandy soil was assumed to be 1.6 g cm-3. Based on the averages, the concentration soil carbon is estimated to be 35 Mg ha-1. While this value fits well with the default value for tropical dry sandy soils of 31 Mg ha-1 (IPCC 2006, Table 2.3), the uncertainty of this estimate may be significant. However, there is a clear need to determine a guideline of the number and spatial distribution of samples in heterogeneous areas that are needed for representative sampling since that accurate carbon inventory is a requirement for the overall balance of the biofuel chain.
6.2 Feedstock farming practices likely to impact the environment
The company has a target of growing sugar cane for ethanol production on 15,000 ha of land. They will also use 200 ha as a seed cane nursery. The sugar cane yield is foreseen to be 90-110 tons/ha. Maintain such a yield level will demand good farm management practices with minimal negative impact on the environment.
The project also intends to produce electricity using steam boilers. The fuel for the boilers will initially be the chips from the natural vegetation, i.e. trees, which will be cut during land clearing for sugar cane farming. This will later be supplemented with sugar cane bagasse.
5 Source: Spreadsheet provided by SEKAB “RAZABA Analytical results-Febr08.xls”

Environment and Natural Resources Management Series 47 24
The removal of natural vegetation is one of the activities with negative impacts on the environment. The company also intends to contract private outgrowers for a period of 10 years, who will produce sugar cane from a total area of 5,000 ha of land and which may lead to additional land clearing.
Based on documented information on environmental impacts of sugar cane farming and processing, the major related activities with the largest environmental impact are: sugar cane cultivation and harvesting followed by fertilizer and herbicides application, sugar processing and electricity generation, transport and cane burning. The SEKAB Environment Impact Statement (EIS) reports that the sugar cane farming practices will involve the use of agrochemicals in form of artificial fertilisers, herbicides and pesticides. The herbicide used will be the same as those currently imported for use in the sugar industry in Tanzania, which are also certified by the Tanzania Pesticide Research Institute (TPRI). Handling and use of these agrochemicals will be done according to standing regulations of the Pesticide Control Regulation of 1984. The application of herbicides to control weeds is expected to be gradually reduced by exercising biological control through the use of sugar cane residues as soil surface cover. The use of the herbicides and pesticides is likely to pollute the soil and water and impact on- and off-farm biodiversity.
The company is considering alternative biological or environment-friendly weed control practices but they are not clearly mentioned. Some of these methods have both risks and benefits. It is good to select well known weed control practices and advocate their application before starting the project.
The EIS also states that efforts will be made to minimize environmental impacts, like water pollution and eutrophication, from the use of artificial fertilizers by rotating the sugar cane crop with nitrogen fixing crops like legumes. This could be a good farming practice especially for the contracted outgrowers.
The deterioration of the soil quality is likely due to continuous use of pesticides and fertilizers. Careful biological and integrated pest and soil management will prevent or minimize such environmental impact from intensive cultivation of energy crops.
Other negative impacts likely to occur are soil erosion, the loss of soil organic carbon or carbon stock and nutrients. All of these potential impacts need to be considered in the life cycle assessment of bioethanol production from sugar cane.
There is also a need to assess the impact of co-production of energy from bagasse and other sugar cane residues on soil quality and erosion due to reduced residues in the field, i.e. reduced organic matter and soil cover. In addition, this is likely to impact life cycle energy and GHG balances by replacing organic fertilizer with artificial fertilizers.
6.3 Impacts of sugar cane production or farming practices on the soil quality
The main activities identified in the EIS report with great potential impact on physical and chemical properties of the soil include: land clearing and mechanized sugar cane cultivation, irrigation, fertilizer application and sugar cane harvesting. The clearing of the land and use of mechanized farming will initially expose the soil to soil erosion, will lower soil organic matter as well as soil organic carbon (SOC) and also soil biodiversity and soil fertility. The potential

Environment and Natural Resources Management Series 47 25
of these impacts is high given the fact that the soil in the project area is reported in the EIS report to be mainly sandy.
The report has indicated how these impacts of sugar cane production activities can be avoided or at least mitigated. Some of the proposed mitigation measures are:
Applying mechanized harvesting which leave plant residues in the field. This will ensure good soil cover which will reduce soil erosion due to water runoff, improve soil moisture conservation, increase rainwater infiltration and crop nutrient availability.
The EIS report indicates that the project area has high deficiency of essential nutrients like nitrogen, phosphorous and potassium and therefore mentions the need to use of artificial inorganic fertilizer up to the level of 3,400 tons of diammonium phosphate and 5,100 tons of urea per annum. This is likely to cause soil and water pollution and soil acidification. This problem can be mitigated by recycling of nutrients derived from sugar cane by use vinasse, filter-cake and ash from power plants as a component of irrigation water in drip irrigation system.
In addition to residue retention on the soil, the use of artificial fertilizer can also be minimised by intercropping sugar cane with nitrogen fixing crops and non-crop plants like Crotolaria, Mucuma, Pigeon pea and Soya beans. This practice is also known to reduce the sugar cane pests and the use of pesticides.
Applying drip irrigation will also mitigate the leaching of N and P nutrients thus protecting the soil from loss of fertility and reducing pollution of surface and groundwater.
The EIS does not address how these impacts can be mitigated on the lands of the contracted outgrowers who are estimated to use 5,000 ha. It is possible to mitigate the soil degradation on such farms by using the same principles mentioned above, especially avoiding the use of fire for harvesting sugar cane and promoting intercropping of sugar cane with nitrogen fixing crops.
6.4 Good farming practices for soil carbon management and to minimize soil erosion
There are a few practices that could be followed in this case. Crop rotation by outgrowers and leaving part of straw and other plant residues as a mulching at the field can be promoted by intercropping sugar cane with nitrogen fixing legume crops. Sugar cane burning as a harvesting practice should be prevented in order to improve total soil carbon stock. Thus there is a need to properly assess the total carbon stock on sugar cane farms. Sugar cane burning would also influence soil density, organic colloids, aggregates, porosity, water carrying capacity and other bio-geochemical functions of the soil. Minimizing tillage and use of sugar cane residues as soil cover to minimize soil erosion and improve carbon stock.
The SEKAB Environment Impact Statement (ESIA) report indicated that the company needs to acquire data to assess the vulnerability of the soils to pollution and degradation that may arise due to different processes of producing bioethanol. The company also intends to have a soil erosion control plan and implementation measures. The plan is to be developed by the National Environmental Management Council (NEMC).
Environment and Natural Resources Management Series 47 26
6.5 Environmental impact on soil of the processing of sugar cane feedstock
The major activity which will produce by-products with potential pollution impact on soil is the distillation process that produces vinasse liquid. At the estimated ethanol production capacity of 400 m3 ethanol/day, the distillation plant will generate 3,200 to 3,600 m3 vinasse/day. This waste is earmarked for use as a fertilizer together with filter cake which will be produced in the process of sugar cane juice extraction, clarification and syrup preparation. The ESIA report has listed the environmental risks which can occur with uncontrolled discharge of vinasse that includes change in soil quality and pollution of surface and groundwater. Mitigation measures proposed to prevent soil pollution from vinasse and effluent from the industrial cluster will include:
(1) Restrictions prohibiting application of vinasse as a fertilizer in the following situations and areas:
• Application during rainy season • Flooded areas or areas prone to flooding • Land within 200 meters from lakes, streams and rivers • Areas reserved for biodiversity protection • On land with a high groundwater table
(2) Infrastructure for vinasse storage, processing and distribution maintained to prevent uncontrolled leakages and spills
(3) Treatment of liquid effluents which could contain oil sludge in designated wastewater treatment plants
6.6 Conclusions
The BIAS Framework (FAO 2009) consists of an evaluation of the following sustainable soil criteria for energy crops: carbon loss risk, erosion risk, compaction risk and nutrient loss risk. Not all of these could be analysed in detail for this case study due to the data availability. The greatest emphasis was placed on the carbon loss risk. The issue of erosion risk and compaction loss risk and nutrient loss risk was addressed qualitatively and by pointing out mitigation strategies.
Environment and Natural Resources Management Series 47 27
7 Greenhouse gas balance
7.1 Introduction
The greenhouse gas emissions related to biomass production, processing and use are a major area of concern in the BIAS framework. Since the reduction of greenhouse gas emissions is one of the main reasons for bioenergy production, assessing related greenhouse effects is an important step towards a sustainable biomass production and use. It becomes even more important as regulations currently under consideration in Europe and the USA require – among others – minimum levels of CO2 savings as a prerequisite for importing biofuels.
Biofuels can help reduce greenhouse gas emissions compared to the fossil fuel they replace and thus may help mitigate effects on climate. However, the exact dimension of reduction depends on various factors, among others on the methodologies used and the design of system boundaries. The goal of the greenhouse gas balance method within the BIAS framework is the definition of clear methodologies and data requirements in order to perform verifiable life cycle analyses of energy crops.
In order to evaluate the strengths and limitations of the BIAS greenhouse gas methodology, a screening life cycle assessment (LCA) was carried out according to the proposed methodology. Both the allocation and substitution method were applied to determine potential greenhouse gas emissions and savings of the SEKAB Bioethanol production system planned in Bagamoyo, Tanzania.
Goal and scope The goal of this section is to apply the greenhouse gas section of the BIAS framework (FAO 2009) to the SEKAB Bioethanol project (SEKAB 2008a). Within the framework, the ‘Directive of the European Parliament and of the European Council on the promotion of the use of energy from renewable sources’ (so called RES directive, CEC 2008) has been used as the basis for choosing the selected methodologies.
In detail, the following aspects are investigated:
Calculation of the greenhouse gas balances of bioethanol to prove whether the sugar cane ethanol can meet the 35 % (as of today) and 50 % (as of 2017) greenhouse gas emission savings required by the RES directive
Influence of direct land use change as well as cultivation and conversion on the overall results
Influence of different system boundaries as well as different co-product use options on the overall results
Comparison of the allocation and substitution methods regarding qualitative differences
General approach The sugar cane greenhouse gas balances are calculated for the whole life cycle of sugar cane ethanol from a possible land use change through cultivation, production and transport.

Environment and Natural Resources Management Series 47 28
Figure 7-1 shows the schematic life cycle of sugar cane ethanol production including all relevant by-products which are derived throughout the production.
Sugar cane cultivation
Harvesting
Distillation
Anhydr. ethanol
Transport
Sugar cane juice
extraction&
fermentation
Land use change
Bagasse
Filter cake
Vinasse
Heads &fusel oils
Ashes
Figure 7-1 Flow chart of schematic life cycle of sugar cane bioethanol production
(simplified from FAO 2009)
7.2 Methodology
This chapter describes the methodological framework as well as specifications which are applied in this study (chapter 7.2.1 and 7.2.2). Subsequently, origin and quality of the basic data used for the analyses are documented (chapter 7.2.3).
7.2.1 Methodological details
The calculation of the greenhouse gas balances of sugar cane ethanol follows the BIAS framework (FAO 2009). The evaluation is done as a screening assessment which describes basic interrelationships regarding greenhouse gas emissions.
The framework proposes the application of two different methodologies in order to cover different user requirements: the allocation and the substitution method. One of the goals of the BIAS framework is to provide information that is conforming to requirements of international certification schemes and regulations for bioenergy most of which are based on the allocation method (FAO 2009). To account for the fact that the SEKAB bioethanol will be sold in Europe, the calculations follow the allocation methodology as defined in the ‘Directive of the European Parliament and of the Council on the promotion of the use of energy from renewable sources’ (CEC 2008, referred to as RES directive throughout this study). According to the RES directive, the greenhouse gas emission savings of biofuels shall be 35 % (50 % as from 2017) compared to fossil fuels.

Environment and Natural Resources Management Series 47 29
For the calculation based on the allocation method, a tiered approach is applied:
Tier 1: Default values from the RES directive are used for the greenhouse gas emissions of sugar cane ethanol production. These values do not include net carbon emissions from land use change (CEC 2008). Therefore, impacts of land use change on the greenhouse gas balances are calculated by using generic data of the SEKAB project.
Tier 2: Exact greenhouse gas emissions of sugar cane ethanol production are calculated following the RES directive (CEC 2008) based on the generic data provided by SEKAB. Net carbon emissions from land use change are included as calculated in the Tier 1 approach.
Beside the allocation method, also the substitution method is applied in order to represent the ethanol production system in a more realistic way. The calculation mainly follows the methodology as defined in the BIAS framework. However, in order to increase consistency and to be able to compare the results of both methodologies, emissions caused by the biofuel usage are set to zero. This is also required in the RES directive (CEC 2008).
For differences between both methods, please refer to FAO 2009 and to Figure 7-2. To be in line with the BIAS framework, the lower heating values will serve as allocation basis (FAO 2009).
Cultivation
Harvesting
ProductProcess
Bagasse
Filter cake
DistillationVinasse
Anhydr. ethanol
Transport
Heads &fusel oils
Sugar cane juice
extraction&
fermentation
Alternative land use
Power mix
Mineral fertiliser
Mineral fertiliser
Power mix
Substitution Allocation
Equivalent system
Cultivation
Harvesting
Distillation
Anhydr. ethanol
Transport
Bagasse
Vinasse
Heads &fusel oils
Filter cake
Residue
%
%
Sugar cane juice
extraction&
fermentation
Land use change
Ashes Mineral fertiliser
Ashes %
%
%
Figure 7-2 Comparison of substitution and allocation method
Environment and Natural Resources Management Series 47 30
7.2.2 General specifications for this study
Specifications in this study include the following main items:
Functional unit: in this study, all results refer to 1 MJ sugar cane ethanol. Geographic and time-related coverage: the production of sugar cane ethanol is related to
current Tanzanian conditions, thus Tanzanian conditions for power mix are applied. As the sugar cane ethanol is sold in Europe, European conditions for gasoline production and the European gasoline characteristics are considered.
Depth of balances: all emissions from the system are taken into account. Exceptions are emissions from the production of infrastructure (FAO 2009) and emissions occurring during the usage of the biofuel (CEC 2008). For being able to compare both methodologies, also in the substitution methodology the usage of biofuel is not included.
Land use changes: as to date no generally accepted method exists to account for indirect land use changes, only direct land use changes are examined (FAO 2009).
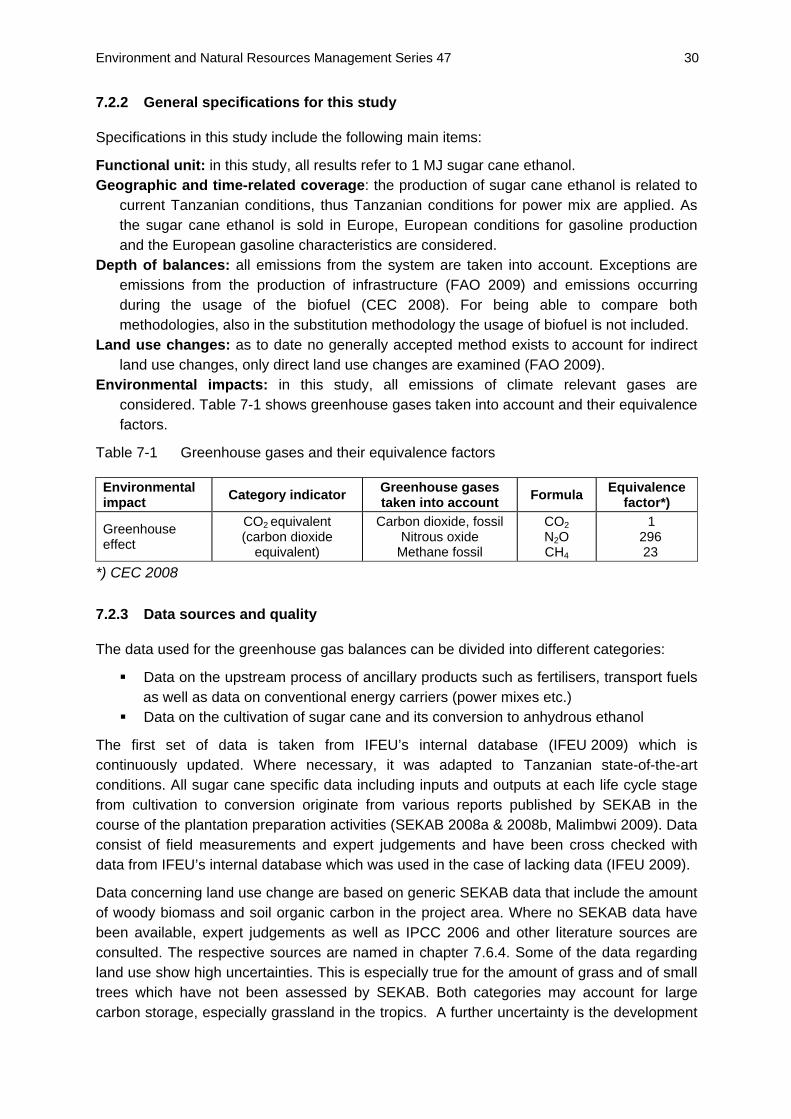
Environmental impacts: in this study, all emissions of climate relevant gases are considered. Table 7-1 shows greenhouse gases taken into account and their equivalence factors.
Table 7-1 Greenhouse gases and their equivalence factors
Environmental impact Category indicator Greenhouse gases
taken into account Formula Equivalence factor*)
Greenhouse effect
CO2 equivalent (carbon dioxide
equivalent)
Carbon dioxide, fossil Nitrous oxide
Methane fossil
CO2 N2O CH4
1 296 23
*) CEC 2008
7.2.3 Data sources and quality
The data used for the greenhouse gas balances can be divided into different categories:
Data on the upstream process of ancillary products such as fertilisers, transport fuels as well as data on conventional energy carriers (power mixes etc.)
Data on the cultivation of sugar cane and its conversion to anhydrous ethanol
The first set of data is taken from IFEU’s internal database (IFEU 2009) which is continuously updated. Where necessary, it was adapted to Tanzanian state-of-the-art conditions. All sugar cane specific data including inputs and outputs at each life cycle stage from cultivation to conversion originate from various reports published by SEKAB in the course of the plantation preparation activities (SEKAB 2008a & 2008b, Malimbwi 2009). Data consist of field measurements and expert judgements and have been cross checked with data from IFEU’s internal database which was used in the case of lacking data (IFEU 2009).
Data concerning land use change are based on generic SEKAB data that include the amount of woody biomass and soil organic carbon in the project area. Where no SEKAB data have been available, expert judgements as well as IPCC 2006 and other literature sources are consulted. The respective sources are named in chapter 7.6.4. Some of the data regarding land use show high uncertainties. This is especially true for the amount of grass and of small trees which have not been assessed by SEKAB. Both categories may account for large carbon storage, especially grassland in the tropics. A further uncertainty is the development

Environment and Natural Resources Management Series 47 31
of soil organic carbon after land conversion in long term sugar cane cultivation. All uncertainties and the data base chosen for this analysis will be addressed in chapter 7.6.4 and in the conclusion chapter as a need for further research (chapter 9.3). Nonetheless, the data quality is sufficiently sound to evaluate the SEKAB ethanol project and to meet the goal of this study – the application of the BIAS framework.
7.3 Existing carbon stock
7.3.1 Estimate based on SEKAB field data
Based on the average concentration of organic matter in the soils of the project area of 0.73%, the carbon content in soil is estimated to be 35 Mg ha-1. This value fits well with the default value for tropical dry sandy soils of 31 Mg ha-1 (IPCC 2006, Table 2.3). The total biomass of the natural vegetation consists of woody biomass (trees, bushes etc.), grass and the below-ground biomass (roots). The SEKAB report measured the diameter of all trees with a diameter >1cm at breast height (dbh) and estimated the biomass from this (Table 7-2, column 2). In order to account for biomass in small branches and twigs, the value for biomass in stems was multiplied by a factor of 2. In this report, the biomass in grass cover was accounted for using an average for wet and dry tropical grassland (IPCC 2006, Table 6.4). For all mixed vegetation types, 50% of grass cover was assumed. A major uncertainly in the assessment is the selection of the appropriate ratio of the root: shoot ratio [(ton d.m. below-ground biomass): (ton d.m. above-ground biomass)]. According to IPCC 2006, Table 6.1, potential shoot : root ratios range from 0.5 (woodland/savannah) to 2.8 (shrubland). In this study, an average of 1.65 was assumed. A uniform value of 0.47 was applied for the carbon content per unit of dry biomass. The results are presented in Table 7-2. The carbon stock in biomass was estimated to be 30 tons C ha-1. The stock would be 17 tons ha-1 if the shoot : root ratio is 0.5 and 43 tons C ha-1 if the shoot : root ratio is 2.8.
Table 7-2 Carbon in biomass of the natural vegetation in SEKAB plantation area
Biomass [tons d.m. ha-1]
Vegetation type Stems > 1cm dbh
Twigs and leaves
Assumed grass cover
Roots (root:shoot
ratio = 1.65)
Carbon in biomass [t C ha-1]
Thicket-light 8.6 8.6 2.2 32 24 Closed forest 23.2 23.2 0 77 58 Thicket-dense 19.7 19.7 2.2 69 52 Wooded grassland 4.5 4.5 2.2 18 14 Acacia woodland 9.9 9.9 2.2 36 27 Grassland 4.3 7 5.4 Weighted average 30
7.3.2 Estimate of carbon in biomass using global carbon map data
The data can be compared with the IPCC Tier-1 Global Biomass Carbon Map for the Year 2000 (Ruesch and Gibbs 2008) which used globally consistent default values provided for aboveground biomass (IPCC 2006). The authors added belowground biomass (root) carbon

Environment and Natural Resources Management Series 47 32
stocks using the IPCC “root to shoot” ratios for each vegetation type, and then converted total living vegetation biomass to carbon stocks using the carbon fraction for each vegetation type (varies between forests, shrublands and grasslands). All estimates and conversions were specific to each continent, ecoregion and vegetation type (stratified by age of forest). Thus, a total of 124 carbon zones or regions with unique carbon stock values based on the IPCC Tier-1 methods were compiled. Data from the Global Land Cover 2000 Project (GLC2000, see Figure 7-3) was used which is based on SPOTVEGETATION satellite imagery for the year 2000. The vegetation types were identified by ecofloristic zones (see Figure 7-4).
Based on this method, the major part of the SEKAB lease area was identified as tropical rain forest for which the carbon content was estimated to be 200 t C/ha; a smaller portion is characterized as tropical moist deciduous forest with 152 t C/ha and shrub cover with 46 t/ha (see Table 7-3).
It is evident that the characterization of the major part of the SEKAB lease area as tropical moist deciduous forest is inaccurate and that the identification as shrub cover would be more fitting. The derivation of the default carbon values by Ruesch and Gibbs 2008 is shown in Table 7-3 and appear to represent the averages of the range of values for above-ground biomass in Table 4.7 of IPCC (2006). It should be noted that in that table, the biomass values for shrubland have a range from 20 to 200 tons d.m. ha-1] for which the range for carbon in biomass is 13 to 130 tons C ha-1.
Table 7-3 Default carbon content in selected land cover types (Ruesch and Gibbs 2008)
Land cover Aboveground
biomass [tons d.m. ha-1]
Root : shoot ratio
Carbon fraction
Carbon in biomass [t C ha-1]
Tropical rain forest 310 0.37 0.47 200
Tropical moist deciduous forest
260 0.24 0,47 152
Shrub cover 70 0.4 0.47 46

Environment and Natural Resources Management Series 47 33
Figure 7-3 Global land cover zones
Figure 7-4 Ecofloristic zones

Environment and Natural Resources Management Series 47 34
Figure 7-5 Carbon stock estimate by CDIAC (Ruesch and Gibbs, 2008)
7.4 Land use change
Between 11,000 and 15,000 ha of natural vegetation will be cleared for the establishment of the sugar cane plantations. This land use change leads to potentially significant emissions of greenhouse gases due to the loss of carbon which has been stored in biomass and soil and therefore influences the greenhouse gas balances of the sugar cane ethanol. For the carbon inventories before and after the land use change, the above- and belowground vegetation carbon content as well as the soil organic carbon (SOC) stock have to be taken into account. The carbon storage in the sugar cane plantation was assumed according to Gibbs et al. (2008). The respective numbers are given in Table 7-4.
Table 7-4 Yields and time-averaged carbon in SEKAB sugar cane plantation biomass
Parameter Unit Low yield High yield Reference
Annual yield tons cane ha-1 90 110 SEKAB 2008a
Time averaged carbon content in plantation biomass tons C ha-1 16 19 Gibbs 2008 a)
a) Gibbs et al. assume that sugar cane stores 14 t C ha-1 in seasonal Americas. The average yield in Brazil is 80 tons of cane ha-1 (FAO Stat). The C in sugar cane for „low yield“ and „high yield“ was scaled accordingly.
Time series data on Brazilian sugar cane plantations where the leaves remain on the field indicate a carbon content of soil in the range of 44 to 59 tons C ha-1 (Zuurbier & van de Vooren 2008). Since the current organic carbon in soil in the SEKAB is 35 tons C ha-1, it is likely that the carbon stock will remain constant. Even an increase is possible, however, this
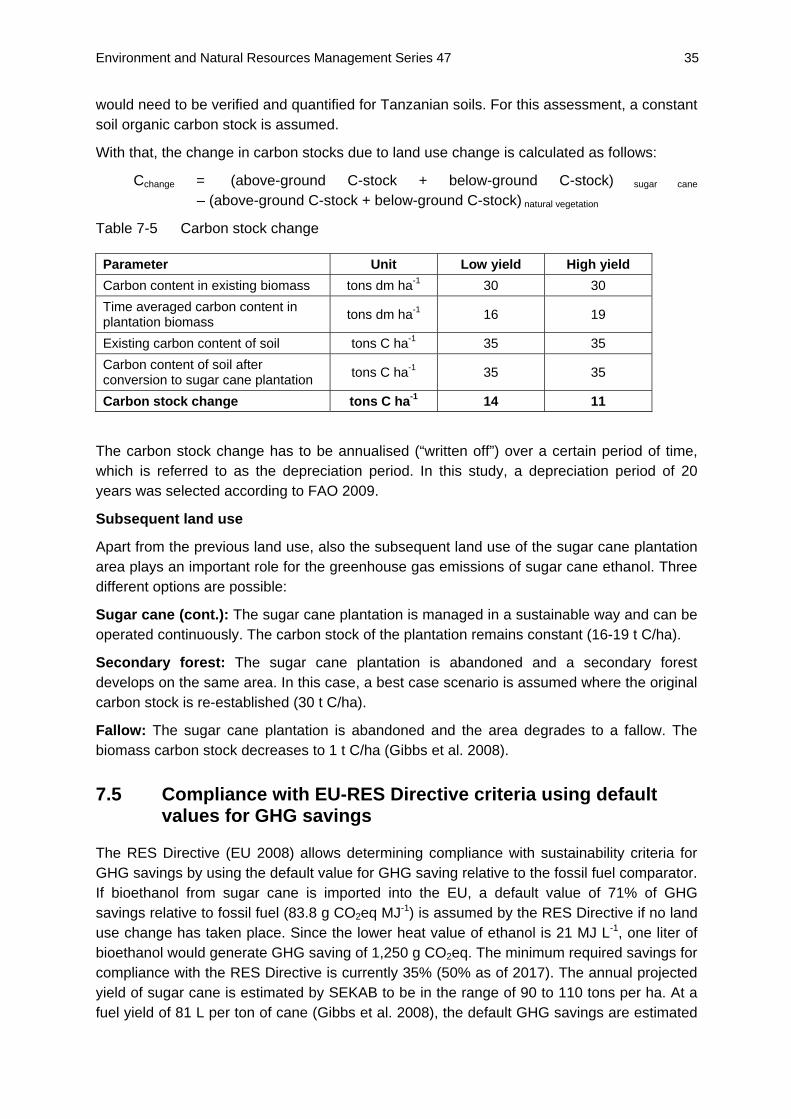
Environment and Natural Resources Management Series 47 35
would need to be verified and quantified for Tanzanian soils. For this assessment, a constant soil organic carbon stock is assumed.
With that, the change in carbon stocks due to land use change is calculated as follows:
Cchange = (above-ground C-stock + below-ground C-stock) sugar cane – (above-ground C-stock + below-ground C-stock) natural vegetation
Table 7-5 Carbon stock change
Parameter Unit Low yield High yield Carbon content in existing biomass tons dm ha-1 30 30 Time averaged carbon content in plantation biomass tons dm ha-1 16 19
Existing carbon content of soil tons C ha-1 35 35 Carbon content of soil after conversion to sugar cane plantation tons C ha-1 35 35
Carbon stock change tons C ha-1 14 11
The carbon stock change has to be annualised (“written off”) over a certain period of time, which is referred to as the depreciation period. In this study, a depreciation period of 20 years was selected according to FAO 2009.
Subsequent land use
Apart from the previous land use, also the subsequent land use of the sugar cane plantation area plays an important role for the greenhouse gas emissions of sugar cane ethanol. Three different options are possible:
Sugar cane (cont.): The sugar cane plantation is managed in a sustainable way and can be operated continuously. The carbon stock of the plantation remains constant (16-19 t C/ha).
Secondary forest: The sugar cane plantation is abandoned and a secondary forest develops on the same area. In this case, a best case scenario is assumed where the original carbon stock is re-established (30 t C/ha).
Fallow: The sugar cane plantation is abandoned and the area degrades to a fallow. The biomass carbon stock decreases to 1 t C/ha (Gibbs et al. 2008).
7.5 Compliance with EU-RES Directive criteria using default values for GHG savings
The RES Directive (EU 2008) allows determining compliance with sustainability criteria for GHG savings by using the default value for GHG saving relative to the fossil fuel comparator. If bioethanol from sugar cane is imported into the EU, a default value of 71% of GHG savings relative to fossil fuel (83.8 g CO2eq MJ-1) is assumed by the RES Directive if no land use change has taken place. Since the lower heat value of ethanol is 21 MJ L-1, one liter of bioethanol would generate GHG saving of 1,250 g CO2eq. The minimum required savings for compliance with the RES Directive is currently 35% (50% as of 2017). The annual projected yield of sugar cane is estimated by SEKAB to be in the range of 90 to 110 tons per ha. At a fuel yield of 81 L per ton of cane (Gibbs et al. 2008), the default GHG savings are estimated
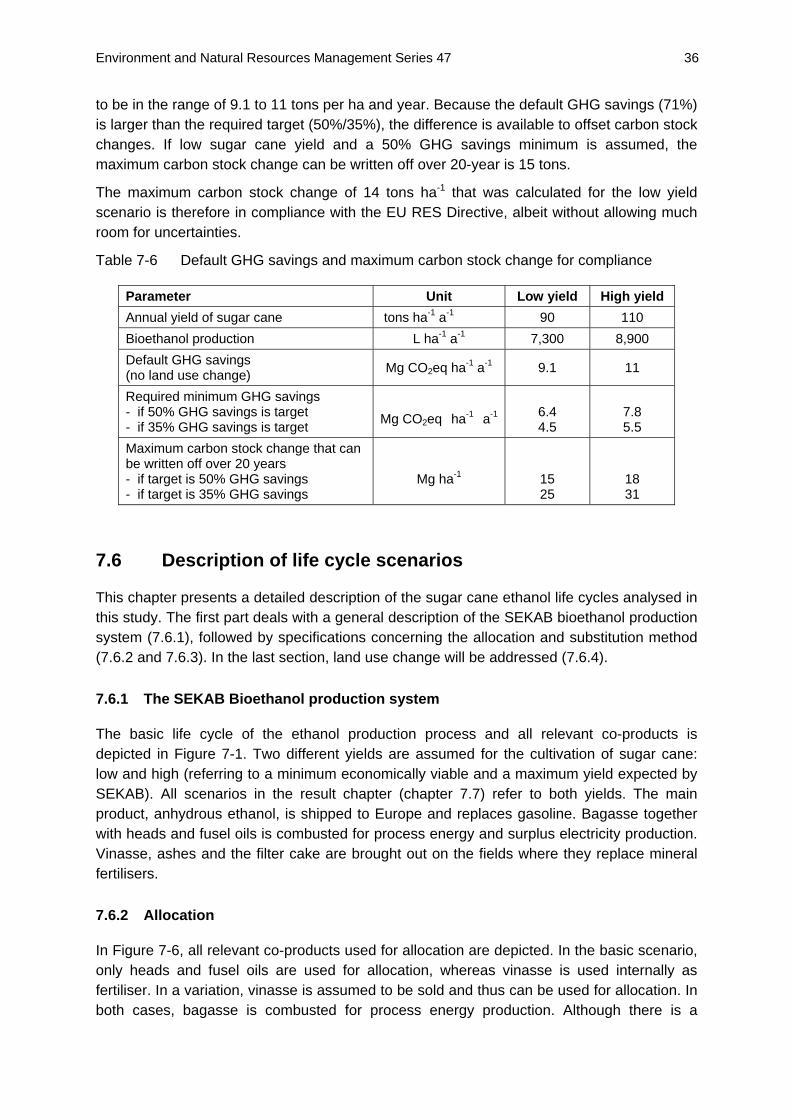
Environment and Natural Resources Management Series 47 36
to be in the range of 9.1 to 11 tons per ha and year. Because the default GHG savings (71%) is larger than the required target (50%/35%), the difference is available to offset carbon stock changes. If low sugar cane yield and a 50% GHG savings minimum is assumed, the maximum carbon stock change can be written off over 20-year is 15 tons.
The maximum carbon stock change of 14 tons ha-1 that was calculated for the low yield scenario is therefore in compliance with the EU RES Directive, albeit without allowing much room for uncertainties.
Table 7-6 Default GHG savings and maximum carbon stock change for compliance
Parameter Unit Low yield High yield Annual yield of sugar cane tons ha-1 a-1 90 110 Bioethanol production L ha-1 a-1 7,300 8,900 Default GHG savings (no land use change) Mg CO2eq ha-1 a-1 9.1 11
Required minimum GHG savings - if 50% GHG savings is target - if 35% GHG savings is target
Mg CO2eq ha-1 a-1
6.4 4.5
7.8 5.5
Maximum carbon stock change that can be written off over 20 years - if target is 50% GHG savings - if target is 35% GHG savings
Mg ha-1
15 25
18 31
7.6 Description of life cycle scenarios
This chapter presents a detailed description of the sugar cane ethanol life cycles analysed in this study. The first part deals with a general description of the SEKAB bioethanol production system (7.6.1), followed by specifications concerning the allocation and substitution method (7.6.2 and 7.6.3). In the last section, land use change will be addressed (7.6.4).
7.6.1 The SEKAB Bioethanol production system
The basic life cycle of the ethanol production process and all relevant co-products is depicted in Figure 7-1. Two different yields are assumed for the cultivation of sugar cane: low and high (referring to a minimum economically viable and a maximum yield expected by SEKAB). All scenarios in the result chapter (chapter 7.7) refer to both yields. The main product, anhydrous ethanol, is shipped to Europe and replaces gasoline. Bagasse together with heads and fusel oils is combusted for process energy and surplus electricity production. Vinasse, ashes and the filter cake are brought out on the fields where they replace mineral fertilisers.
7.6.2 Allocation
In Figure 7-6, all relevant co-products used for allocation are depicted. In the basic scenario, only heads and fusel oils are used for allocation, whereas vinasse is used internally as fertiliser. In a variation, vinasse is assumed to be sold and thus can be used for allocation. In both cases, bagasse is combusted for process energy production. Although there is a

Environment and Natural Resources Management Series 47 37
significant amount of surplus (power from) bagasse, according to the RES directive (CEC 2008) it cannot be used for allocation as it is defined there as an ‘agricultural residue’.
Processing
Sugar cane cultivation
Land use change
Harvest
Product Process
Filter cake
Vinasse
Anhydr. ethanol
Transport
Heads &fusel oils
Heat / power
Fertiliser
Ashes
Bagasse
Vinasse%
%
Residue Variation
%
Figure 7-6 Detailed life cycle setup of sugar cane ethanol based on the allocation method
7.6.3 Substitution
Figure 7-7 gives a detailed overview of the life cycle as a basis for the substitution approach. On the right side, all conventional products substituted by the co-products are shown. In contrast to the allocation method, as defined by the RES directive (CEC 2008), surplus bagasse can be used for electricity production which is fed to the national grid. Both, the marginal mix and the current national power mix of the Tanzanian grid are assumed to be replaced. A marginal approach is based on the assumption that any future increase of conventional power generation will rely on either hard coal (50%) or natural gas (50%). It is assumed that with an increased renewable energy production (i.e. green electricity), some of these power plants would reduce their output or they even would be put out of service or not be built at all.

Environment and Natural Resources Management Series 47 38
Processing
Sugar cane cultivation
Harvest
Product Process
Filter cake
Vinasse
Anhydr. ethanol
Transport
Heads &fusel oils
Heat / power
Fertiliser
Ashes
Ferti-liser
Irriga-tionSeed Diesel
fuelPesti-cides
Land use change
Marginal mix
Mineral fertiliser
Surplus power
Bagasse
Equivalent system
Figure 7-7 Detailed life cycle setup for sugar cane ethanol following the substitution
approach
7.6.4 Land use change
To measure the impact of the land use change at the SEKAB project from natural vegetation to sugar cane plantation the carbon inventories before and after the land use change have to be taken into account, including the above- and belowground vegetation carbon content as well as the soil organic carbon (SOC) stock.
The carbon storage in the sugar cane plantation was assumed as described in chapter 7.4 (see Table 7-4). The carbon stock change has to be annualised (“written off”) over a certain period of time which is referred to as the depreciation period. In this study, a depreciation period of 20 years was selected according to FAO 2009. Subsequent land use
Apart from the previous land use, also the subsequent land use of the sugar cane plantation area plays an important role for the greenhouse gas emissions from the sugar cane ethanol life cycle. Three different options are possible:
Sugar cane (continued): The sugar cane plantation is managed in a sustainable way and can be operated continuously. The carbon stock of the plantation remains constant (8-11 t C/ha).
Secondary forest: The sugar cane plantation is abandoned and a secondary forest develops on the same area. In this case, a best case scenario is assumed where the original carbon stock is re-established (30 t C/ha).
Fallow: The sugar cane plantation is abandoned and the area degrades to a fallow. The biomass carbon stock decreases to 1 t C/ha (Gibbs et al. 2008).
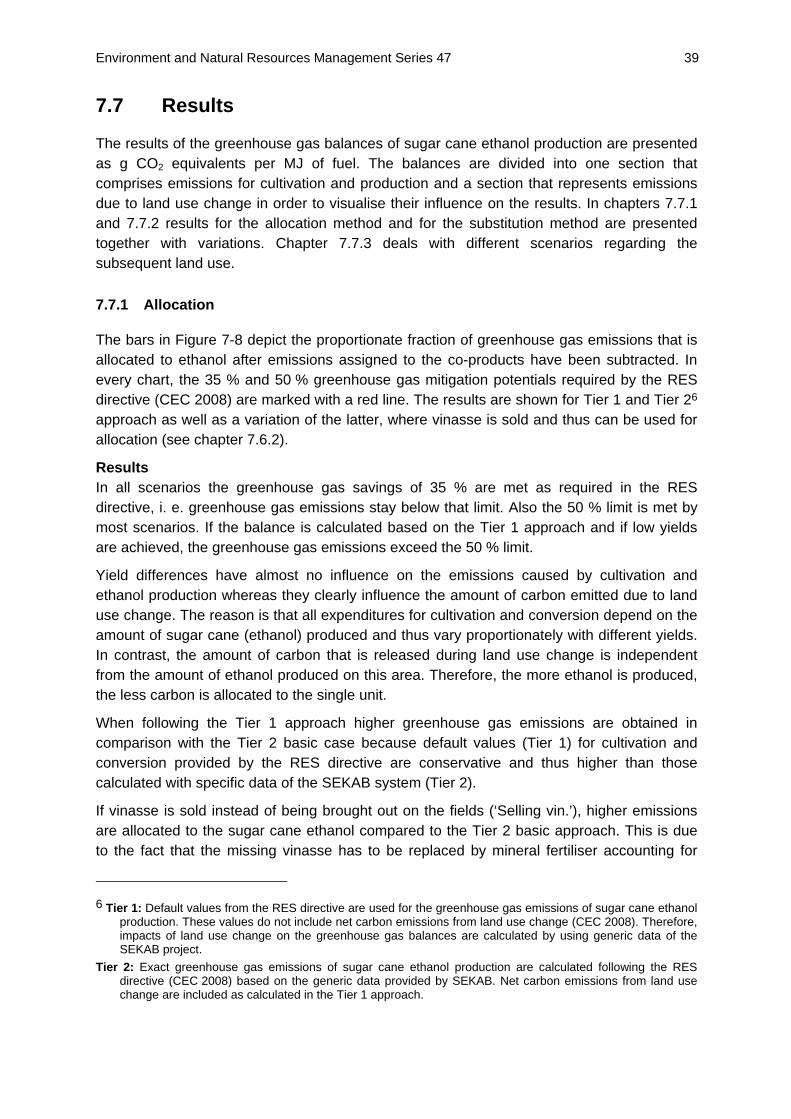
Environment and Natural Resources Management Series 47 39
7.7 Results
The results of the greenhouse gas balances of sugar cane ethanol production are presented as g CO2 equivalents per MJ of fuel. The balances are divided into one section that comprises emissions for cultivation and production and a section that represents emissions due to land use change in order to visualise their influence on the results. In chapters 7.7.1 and 7.7.2 results for the allocation method and for the substitution method are presented together with variations. Chapter 7.7.3 deals with different scenarios regarding the subsequent land use.
7.7.1 Allocation
The bars in Figure 7-8 depict the proportionate fraction of greenhouse gas emissions that is allocated to ethanol after emissions assigned to the co-products have been subtracted. In every chart, the 35 % and 50 % greenhouse gas mitigation potentials required by the RES directive (CEC 2008) are marked with a red line. The results are shown for Tier 1 and Tier 26 approach as well as a variation of the latter, where vinasse is sold and thus can be used for allocation (see chapter 7.6.2).
Results In all scenarios the greenhouse gas savings of 35 % are met as required in the RES directive, i. e. greenhouse gas emissions stay below that limit. Also the 50 % limit is met by most scenarios. If the balance is calculated based on the Tier 1 approach and if low yields are achieved, the greenhouse gas emissions exceed the 50 % limit.
Yield differences have almost no influence on the emissions caused by cultivation and ethanol production whereas they clearly influence the amount of carbon emitted due to land use change. The reason is that all expenditures for cultivation and conversion depend on the amount of sugar cane (ethanol) produced and thus vary proportionately with different yields. In contrast, the amount of carbon that is released during land use change is independent from the amount of ethanol produced on this area. Therefore, the more ethanol is produced, the less carbon is allocated to the single unit.
When following the Tier 1 approach higher greenhouse gas emissions are obtained in comparison with the Tier 2 basic case because default values (Tier 1) for cultivation and conversion provided by the RES directive are conservative and thus higher than those calculated with specific data of the SEKAB system (Tier 2).
If vinasse is sold instead of being brought out on the fields (‘Selling vin.’), higher emissions are allocated to the sugar cane ethanol compared to the Tier 2 basic approach. This is due to the fact that the missing vinasse has to be replaced by mineral fertiliser accounting for
6 Tier 1: Default values from the RES directive are used for the greenhouse gas emissions of sugar cane ethanol
production. These values do not include net carbon emissions from land use change (CEC 2008). Therefore, impacts of land use change on the greenhouse gas balances are calculated by using generic data of the SEKAB project.
Tier 2: Exact greenhouse gas emissions of sugar cane ethanol production are calculated following the RES directive (CEC 2008) based on the generic data provided by SEKAB. Net carbon emissions from land use change are included as calculated in the Tier 1 approach.

Environment and Natural Resources Management Series 47 40
high GHG emissions. The allocation on vinasse cannot compensate for these emissions since vinasse has a very low heating value.
0 10 20 30 40 50 60 70 80 9
Gasoline
Selling vin. high yield
Selling vin. low yield
Tier 2 basic, high yield
Tier 2 basic, low yield
Tier 1 high yield
Tier 1 low yield
g CO2 equiv. / MJ fuel0
Cultivation & production Land use change Fossil equivalent
GHG emissions →
Figure 7-8 Greenhouse gas emissions for bioethanol and gasoline for the Tier 1 and Tier 2
approach based on the allocation method. Red lines: EU RES Directive criteria
(35% limit - continuous red line and 50% limit - dashed red line)
Reading the diagram (Using the 1st bar as an example)
The production of ethanol according to the Tier 1 ‘low yield’ scenario causes greenhouse gas emissions of about 44 g CO2 equiv. / MJ fuel produced. This exceeds the 50 % emission savings limit of 42 g per MJ ethanol.
Conclusions Almost all sugar cane ethanol production systems can meet the greenhouse gas limits of 35 % and 50 % required by the RES directive (CEC 2008). Hence, in these cases, the ethanol could – currently and in future – be sold on European markets. However, if the calculation is based on the Tier 1 approach and if low yields are achieved, the 50 % limit is not met.
The calculation of the greenhouse gas emissions following the Tier 2 approach leads to slightly more favourable results than using the default values. The Tier 1 approach provides for an easier calculation with less need for specific data collection. Therefore, if – in future assessments – the Tier 1 approach does not result in meeting the greenhouse gas emission limits, the Tier 2 approach should be applied; otherwise the Tier 1 results satisfy the requirements of the RES directive.
Higher yields lead to less greenhouse gas emissions per MJ of bioenergy. Therefore, they should be strived for by high-yielding varieties as well as optimal management methods.

Environment and Natural Resources Management Series 47 41
From a climate protection point of view, vinasse should be used as fertiliser rather than being sold. However, also in case vinasse is sold, both greenhouse gas mitigation limits can be met. Therefore, in this case, the decision on how to use the vinasse can be based on other – e. g. economic – factors.
7.7.2 Substitution
Figure 7-9 presents the results based on the substitution methodology. Also the results from the allocation approach are shown to enable a direct comparison of both methodologies.
Results The production of sugar cane ethanol causes less greenhouse gas emissions than the production of conventional fossil fuel. All credits gained during the production process – mainly surplus power replacing conventional power – are assigned to the cultivation and production steps. In doing so, for the ‘marginal mix’ scenario, the biggest part of the expenditures occurring during cultivation and conversion can be compensated by the credits.
In all scenarios, emissions caused by land use change are lower for high yields as here emissions are distributed among a larger amount of ethanol. In contrast, emissions caused during sugar cane cultivation and ethanol production stay nearly the same for both yield variants. The reason is that expenditures and credits during cultivation and conversion directly depend on the sugar cane yield and the amount of ethanol produced.
If the marginal power mix is replaced by surplus electricity derived from bagasse, the production of sugar cane ethanol causes lower greenhouse gas emissions compared to the substitution of the national power mix. The marginal mix includes high shares of hard coal and natural gas as primary energy sources causing high greenhouse gas emissions. In contrast, the national mix has a large share of hydro energy which causes only small amounts of greenhouse gas emissions. Since by replacing the marginal mix more electricity generated from hard coal and natural gas is replaced, more greenhouse gas emission savings are credited to the sugar cane ethanol.
The choice of either allocation or substitution method when dealing with co-products leads to significant differences in the greenhouse gas balances of sugar cane ethanol. Following the substitution method results in significantly lower emissions compared to the allocation method - especially if the marginal power mix is replaced by surplus bagasse power. This is because when using the substitution method, electricity derived from surplus bagasse replaces energy from the power grid and the respective savings in greenhouse gas emissions are credited to the sugar cane ethanol. In contrast, following the RES directive, surplus bagasse cannot be considered in the allocation method as bagasse is defined as an agricultural residue in the RES directive (see chapter 7.6.2). As a result almost all greenhouse gases are allocated to the sugar cane ethanol.

Environment and Natural Resources Management Series 47 42
0 10 20 30 40 50 60 70 80 9
Gasoline
Tier 2 basic, high yield
Tier 2 basic, low yield
Nat. mix, high yield
Nat. mix, low yield
Marg. mix, high yield
Marg. mix, low yield
g CO2 equiv. / MJ fuel0
Cultivation & production Land use change Fossil equivalent
GHG emissions →
Allocation
Substitution
Figure 7-9 Greenhouse gas balances for sugar cane ethanol production according to the
substitution method and compared to the allocation method
Reading the diagram (Using the 1st bar as an example)
The production of sugar cane ethanol causes greenhouse gas emissions of about 23 g CO2 equivalents per MJ biofuel if the marginal power mix is substituted.
Conclusions In the SEKAB case study, the production of sugar cane ethanol accounts for less greenhouse gas emissions than the production of conventional fuel. The amount of greenhouse gas savings highly depends on the composition of the replaced power mix. If the current situation is to be analysed, the national mix should be taken into account. However, decision makers might rather be interested in the long-term development of energy production. In that case, the marginal mix might be the more appropriate choice.
High yields of sugar cane lead to lower greenhouse gas emissions. Therefore, they should be strived for by introducing high-yielding varieties as well as by good management practices. However, it has to be taken into account that applying intensive management practices create other risks and disadvantages, like soil degradation and loss or soil and water pollution.
There are major uncertainties in the calculation of carbon stock change which account for a large influence on the results. Therefore, the carbon storage in the natural vegetation and the change in SOC should be measured as exactly as possible.
The choice of allocation or substitution method leads to different results – in this case, applying the substitution method clearly leads to lower greenhouse gas emissions. However, it has to be taken into account that this result is caused by the specific regulations of the RES directive which do not allow taking into account the large amount of surplus bagasse. Other international regulations and frameworks could lead to different results. In general, the
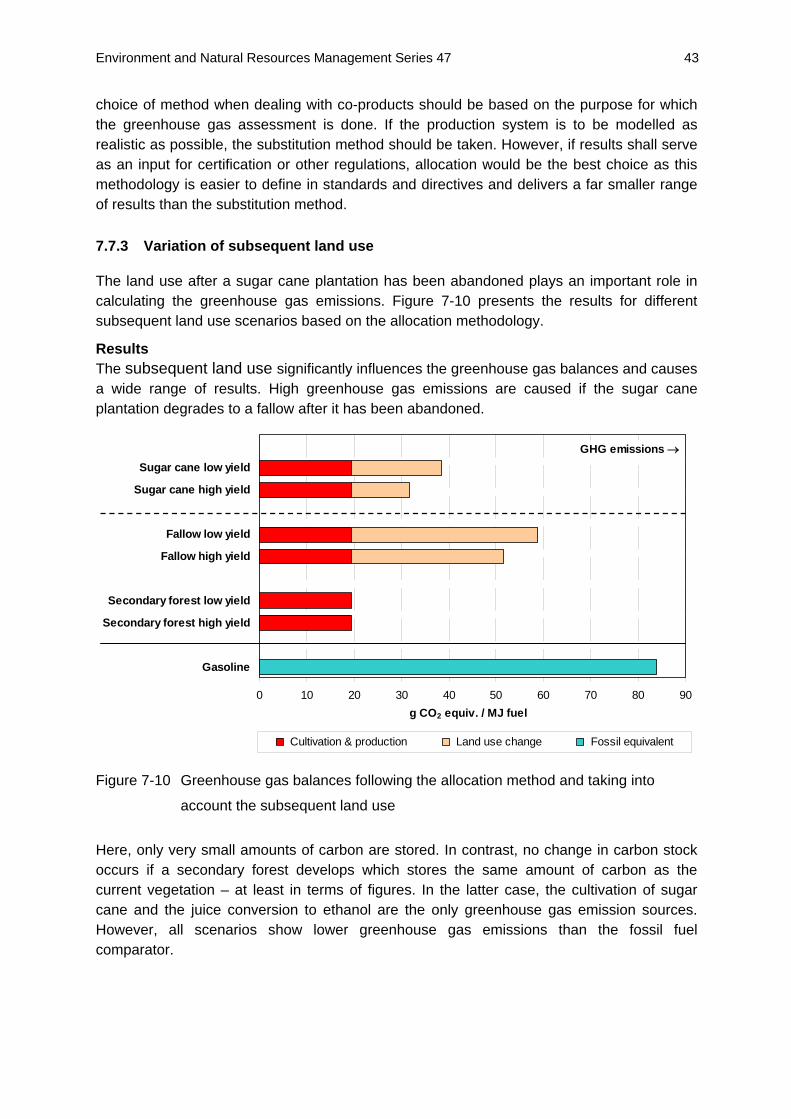
Environment and Natural Resources Management Series 47 43
choice of method when dealing with co-products should be based on the purpose for which the greenhouse gas assessment is done. If the production system is to be modelled as realistic as possible, the substitution method should be taken. However, if results shall serve as an input for certification or other regulations, allocation would be the best choice as this methodology is easier to define in standards and directives and delivers a far smaller range of results than the substitution method.
7.7.3 Variation of subsequent land use
The land use after a sugar cane plantation has been abandoned plays an important role in calculating the greenhouse gas emissions. Figure 7-10 presents the results for different subsequent land use scenarios based on the allocation methodology.
Results The subsequent land use significantly influences the greenhouse gas balances and causes a wide range of results. High greenhouse gas emissions are caused if the sugar cane plantation degrades to a fallow after it has been abandoned.
0 10 20 30 40 50 60 70 80 9
Gasoline
Secondary forest high yield
Secondary forest low yield
Fallow high yield
Fallow low yield
Sugar cane high yield
Sugar cane low yield
g CO2 equiv. / MJ fuel0
Cultivation & production Land use change Fossil equivalent
GHG emissions →
Figure 7-10 Greenhouse gas balances following the allocation method and taking into
account the subsequent land use
Here, only very small amounts of carbon are stored. In contrast, no change in carbon stock occurs if a secondary forest develops which stores the same amount of carbon as the current vegetation – at least in terms of figures. In the latter case, the cultivation of sugar cane and the juice conversion to ethanol are the only greenhouse gas emission sources. However, all scenarios show lower greenhouse gas emissions than the fossil fuel comparator.
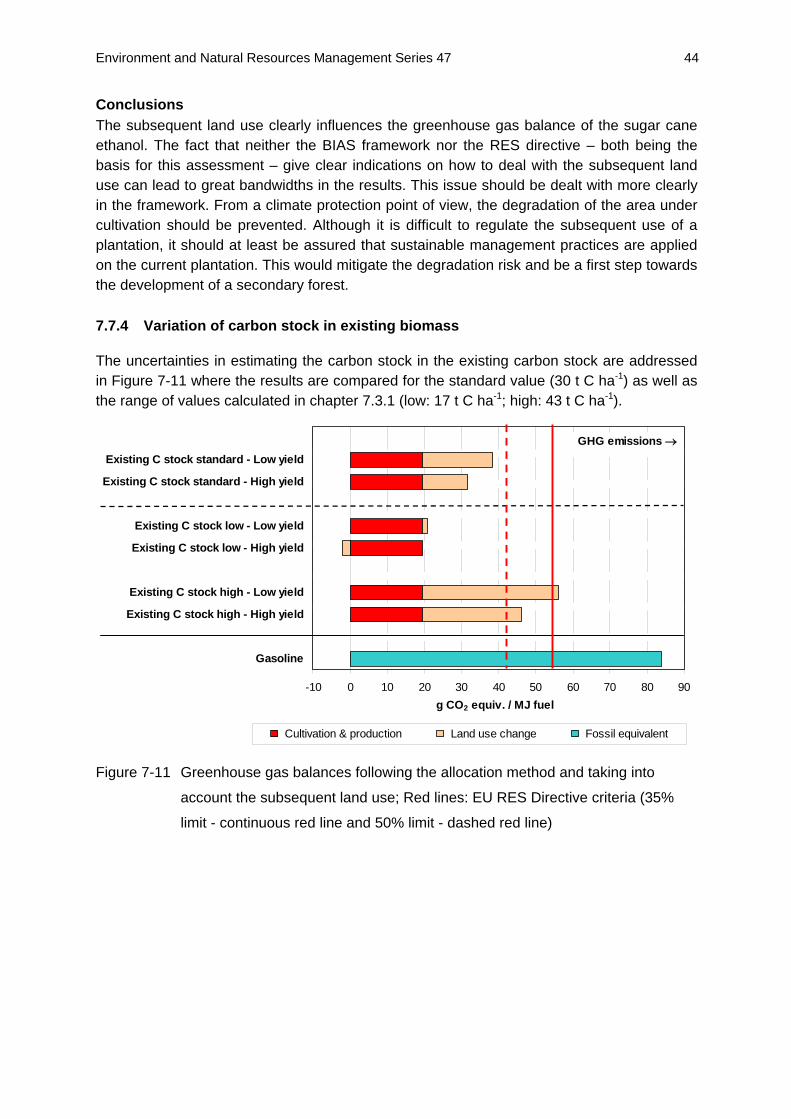
Environment and Natural Resources Management Series 47 44
Conclusions The subsequent land use clearly influences the greenhouse gas balance of the sugar cane ethanol. The fact that neither the BIAS framework nor the RES directive – both being the basis for this assessment – give clear indications on how to deal with the subsequent land use can lead to great bandwidths in the results. This issue should be dealt with more clearly in the framework. From a climate protection point of view, the degradation of the area under cultivation should be prevented. Although it is difficult to regulate the subsequent use of a plantation, it should at least be assured that sustainable management practices are applied on the current plantation. This would mitigate the degradation risk and be a first step towards the development of a secondary forest.
7.7.4 Variation of carbon stock in existing biomass
The uncertainties in estimating the carbon stock in the existing carbon stock are addressed in Figure 7-11 where the results are compared for the standard value (30 t C ha-1) as well as the range of values calculated in chapter 7.3.1 (low: 17 t C ha-1; high: 43 t C ha-1).
-10 0 10 20 30 40 50 60 70 80 90
Gasoline
Existing C stock high - High yield
Existing C stock high - Low yield
Existing C stock low - High yield
Existing C stock low - Low yield
Existing C stock standard - High yield
Existing C stock standard - Low yield
g CO2 equiv. / MJ fuel
Cultivation & production Land use change Fossil equivalent
GHG emissions →
Figure 7-11 Greenhouse gas balances following the allocation method and taking into
account the subsequent land use; Red lines: EU RES Directive criteria (35%
limit - continuous red line and 50% limit - dashed red line)

Environment and Natural Resources Management Series 47 45
Results The carbon stock in the existing pre-plantation vegetation has a significant impact on the greenhouse gas balance. Almost no carbon stock change is expected if the low C stock estimate of 17 t C ha-1 is assumed. If the high estimate for the carbon stock of 43 t C ha-1 in the existing vegetation is assumed, the greenhouse gas emissions are still lower than the fossil fuel comparator; however they would not meet the EU target of 50% GHG emission savings.
7.8 Conclusions
The BIAS framework provides a suitable basis for the assessment of greenhouse gas balance. It has been demonstrated that the allocation as well as the substitution method should be used which is in-line with other international developments. In additions, the need to comply with export regulations (EU RES Directive) prioritizes a choice of methods. All aspects are sufficiently discussed in BIAS and can be readily applied. The case study has shown that the most intensive and expensive data need is local carbon stock (above and below ground) Therefore, the uncertainties in carbon stock estimates need to be carefully addressed and especially the carbon stored in the underground biomass should be determined on a site-specific basis. In addition, the review of compliance with good farming practices should be performed to ensure impact reductions.

Environment and Natural Resources Management Series 47 46
8 Applying the BIAS framework to other bioenergy projects in Tanzania
In addition to the SEKAB Bagamoyo project, information relating to biodiversity, soil, water and greenhouse gas issues was compiled for seven other biofuel projects by companies operating in Tanzania.
An overview of readily available information is given in the Appendix Biofuels Companies in Tanzania: A report for IFEU/ FAO BEFS Project authored by Andrew Gordon-Maclean. Table 8-1 provides a summary of the availability of the information. It appears that information on biodiversity issues is readily available, whereas data on greenhouse gas balances is totally lacking or is of limited relevance. Another major source of debate has been the amount of water available for crops that need intensive irrigation such as sugar cane.
Table 8-1 Information available for BIAS assessment of biofuel projects
Company Feedstock Maximum Area
Bio-diversity Water Soil GHG
balance
Africa Biofuel Croton 20,000 ha + + + -
SEKAB Rufiji Sugar cane 80,000 ha + + + -
Bioshape Jatropha 81,000 ha + + + o
Prokon Jatropha outgrowersonly + - - -
Diligent Jatropha n/a + + o
SunBiofuels Jatropha 8,211 ha + + + -
CAMS Energy
Sweet sorghum 40,000 ha + + + -
Information is categorized as follows: + some information available; o information with limited relevance; - no information available
Without the necessary information and a thorough analysis, a determination of the impacts as required by the BIAS framework is not possible. As a lesson learnt from this report, assessments of the natural resources are suggested for each area before concessions are made for large-scale plantations.

Environment and Natural Resources Management Series 47 47
9 Conclusions and recommendations
9.1 SEKAB specific conclusions and recommendations
Biodiversity impacts
The project area is rich in wildlife and shares many species with the adjacent Saadani National Park. All taxonomic groups including mammals, birds, reptiles, amphibians, fish and many invertebrate groups are represented. The area has high diversity of both resident and migratory bird species with the composition and abundance of species changing with seasons due to intra-African and Palaearctic migrations.
The proximity of the site to Saadani National Park had created questions about how to manage incursions of elephants and other animals into the farms. The company and the government are in the process of dealing with potential wildlife-human conflict. SEKAB plans to maintain part of the biodiversity of the area, including the endemic plant species, through a variety of actions, such as specific protection measures for existing habitats with endemic species and protection of biodiversity zones. A detailed plan for wildlife corridor and on-farm wildlife management should be part of the approval process due to the area’s biological richness. The evaluation of its “sufficiency” should be done by a competent independent expert.
Farming activities in this area should not clear any evergreen forest and thicket patches that may remain as they contain coastal forest endemic species such as little yellow flycatcher, black and rufus elephant shrew and many plants..
Agricultural water use
The proposed SEKAB farm will be using water from the Wami river, mainly for irrigation. The estimated maximum annual requirement is 160 million m3 for 15,000 ha crop area, corresponding to about 106 m3/ton of cane. Since harvesting is scheduled after the rainy season, the demand fluctuates accordingly. To reduce the abstraction during the low flow months on site reservoirs will be used to store water from months with high flows in the river when the Wami River has adequate quantities of water.
This raises the concern on water availability. In an average year, the required amount 160 million m3 of water is equivalent to about 10% of the flow of the Wami river. For the minimum year, about 40% of the water would be diverted for irrigation; for the annual water flow in the case “mean minus one standard deviation” it would be about 20%.
Representatives of the Tanzania Coastal Management Partnership for Sustainable Coastal Communities and Ecosystem in Tanzania are concerned about salinisation risks that affect the river ecosystem. Since the saline water does flow back to the river from the ocean to a distance up to 50 Kilometres, if more water is drawn out from Wami River for different purposes, the saline water may affect the river. The influx of salt water could affect the wildlife in the Wami Mbiki Game Reserve as well as that in Saadani National Park. There has been controversy about the EIA carried out by SEKAB. Orgut, the consultancy company that prepared much of the ESIA, claims that SEKAB has left out details of the original ESIA

Environment and Natural Resources Management Series 47 48
which showed that there was an insufficient amount of water present for their irrigation scheme.
The issue of water use has not been sufficiently assessed in the ESIA provided by SEKAB. More hydrologic studies are needed before it can be decided whether the estimated amounts of water withdrawal can be safe.
If the project is carried out, the following requirements are suggested
Monitoring the levels of salinity, herbicides, pesticides and fertilizer nutrients in river water and groundwater.
Monitoring water availability through monitoring of hydrological changes of water resources used for irrigation. The hydrological indicators will include: low, medium, high flow and flow variability of the River Wami which will be the major source of irrigation water.
Monitoring of impact of irrigation abstraction from groundwater to provide indicators of inland intrusion of saline water. This will require observation wells in different places within the project area.
Mitigation options are planned and approved for different levels of water limitations before project approval and are regularly monitored and updated.
Impact on soil
It is recommended to monitor carbon storage in the soil and carbon stock over a period of at least 10 years after the project inception. This can be done by monitoring change over time in soil carbon density per unit area which is a good indicator of carbon related ecosystem services such as fertility, water storage, soil biodiversity enhancement and resistance to erosion. This information will enable decision makers to avoid farming practices which could result in lowering of soil carbon levels and creation of soil erosion.
With regard to the impact of farming practices on soil, the project intends to have a “soil erosion control plan”. The plan will be developed by NEMC and will include all the good farming practices to minimize impact of cultivation on soil fertility and general physical and chemical properties. The plan will supposed to address the sustainable production of biofuels by minimizing soil erosion and decline in soil health and fertility as a result of sugar cane cultivation. However, the overall environmental management plan for the SEKAB project lacks due consideration of impact from the outgrowers who will use almost one third as large an area as the company cultivated land. A plan needs careful integration with biological control of weeds and pests, with irrigation and with on- and off-farm wildlife management.
Greenhouse gas balance
Concerning the SEKAB greenhouse gas balances, the EU RES directive target of 35 % and 50 % greenhouse gas emission savings can be met in most cases, regardless of whether the Tier 1 or the Tier 2 approach is chosen. As a conclusion, almost all Tier 1 results satisfy the requirements of the RES directive. Generally, the Tier 2 approach leads to lower greenhouse gas emissions than Tier 1 which is based on conservative default values.
In Tier 2, the substitution method shows lower greenhouse gas emissions than the allocation method. This is mainly due to the fact that according to the RES directive, in the allocation

Environment and Natural Resources Management Series 47 49
method bagasse cannot be accounted for. In general, the choice of method should be based on the requirements of the user: if one strives to model the system in a most realistic way, the substitution method is an appropriate choice. If the results shall serve as an input to certification systems the allocation method should be used. The latter shows less variability in the results because variability in co-product use is reduced. Furthermore, the allocation methodology is a more transparent and unambiguous approach than the substitution method.
In all scenarios, high yields lead to higher greenhouse gas savings per unit ethanol produced as the carbon emissions caused during land use change are allocated to a higher amount of ethanol. Therefore, high yielding varieties should be used and sustainable management methods with reduced artificial input should be applied to sustain optimum growth conditions. The latter is also required from a subsequent use point of view, since the subsequent land use has a significant impact on the life cycle greenhouse gas balances. The degradation of the plantation area would cause high carbon emissions and therefore needs to be avoided. In addition, efforts should be put into developing a secondary forest that stores the same amount or more of carbon as the current vegetation.
The exact knowledge of the existing carbon stock is of great importance to demonstrate compliance with export criteria such as those in the EU RES Directive. Therefore, the uncertainties in carbon stock estimates need to be carefully addressed. For sufficient precision to satisfy management needs, the carbon storage in the underground biomass needs to be determined on a site-specific basis.
9.2 General recommendations for Tanzania
In addition to the SEKAB project, seven other biofuel projects were identified in Tanzania. It appears that information on biodiversity issues is readily available, whereas data on greenhouse gas balances is totally lacking or of limited relevance. Another major debate is about the amount of water available for crops that need intensive irrigation such as sugar cane. Without the necessary information and a thorough analysis, a determination of the potential impacts according to the BIAS framework and as required for impact avoidance or mitigation is not possible. As a lesson learnt from this report, assessments of the natural resources are suggested for each area before concessions are made for large-scale plantations.
A general problem that may create negative impact from intensive biofuel feedstock production on soil and water resources is the lack of a national environmental policy to guide sustainable production of biofuels. The government should prepare a policy on sustainable bioenergy crops production with clear indicators relevant to specific Tanzania environments.
While this requires a national capacity to assess water availability or soil conditions, it is important that the government or reliable third parties can conduct the necessary upfront studies and monitoring or evaluation of those tasks carried by others.
9.3 Lessons learnt with respect to the BIAS framework
The BIAS framework is a useful tool in guiding the analysis of biofuel projects. The case study demonstrated strengths and weaknesses that are summarized in the following section.

Environment and Natural Resources Management Series 47 50
Module Biodiversity
The BIAS module for Assessment of biodiversity impacts requires thorough analysis of available information that may or may not be available. Mitigation strategies that are being implemented by project developers have to be credited for.
Module Water
The BIAS framework provides a suitable methodology to address the impact on water availability. It should be reviewed though to include better accounting of the needs of existing and future competing users. A proper analysis is impossible without detailed site-specific data that also addresses year-to-year fluctuations of water availability. The framework should therefore outline best or sufficient methods to obtain and integrate such information.
Module Soil
The BIAS Framework provides for a clear guidance for the evaluation of impacts on soil: carbon loss risk, erosion risk, compaction risk and nutrient loss risk. Not all of these could be analysed in detail for this case study due to the data availability. The prominent issue in soil impact that was identified is the carbon stock in existing soil.
The BIAS framework does not give clear guidance to determine the reliability of the carbon stock value in existing soils and its change after conversion. Considerable site-specific data is needed to quantify erosion risk, compaction loss risk and nutrient loss risk.
Module Greenhouse Gases
The BIAS module for GHG assessment provides a comprehensive guidance for GHG balances for biofuels. Since it does not strictly follow one methodology but rather indicates options for different methodologies, calculations can be adapted to the needs of the respective users.
However, the BIAS framework does not give clear indications on how to proceed with the following issues:
- subsequent use of the crop plantations
- determining the carbon stock in above-ground biomass of the existing vegetation
- determining the carbon stock in below-ground biomass of the existing vegetation
- determining the carbon stock in bioenergy feedstock plantations
- changes of soil organic carbon under continuous bioenergy production
Weaknesses:
Weaknesses: Specific indicator values for thresholds are missing, but may be of limited usefulness in specific cases, i.e. local adaptation needs?? Shows that substantial local data are necessary for thorough analysis??

Environment and Natural Resources Management Series 47 51
10 References
Baker, N. and Baker, E. (2002). Important Bird Areas in Tanzania. A first Inventory. Wildlife Conservation Society of Tanzania/ Birdlife International.
Ball-Coelho et al. (1992). Ball-Coelho, B.; Sampaio, E. V. S. B.; Tiessen, H.; Stewart, J. W. B.: Root dynamics in plant and ratoon crops of sugar cane. In: Plant and Soil, Springer Netherlands, Volume 142, Number 2, p. 297-305
Beeharry, R. P. (2001). Carbon balance of sugar cane bioenergy systems Biomass and Bioenergy. 20(5):361-370.
BIAS (2009). Refers to an early draft version of FAO, 2010. Significant changes were introduced into FAO 2010 in part as a result of this study, in particular related to water assessment.
Bioenergy and Food Security (BEFS) (2008): Copernicus Institute, Utrecht University: Modelling the Bioenergy and Food Security Nexus: An analytical framework. Draft for comments. Project financed by the Food and Agricultural Organization (FAO), Rome.
Bioenergy Environmental Impact Analysis (BIAS) (2009): Öko-Institut, Ifeu-Institute, Copernicus Institute: Bioenergy Environmental Impact Analysis. Project financed by the Food and Agriculture Organization (FAO), Rome.
Borken, J.; Patyk, A. & Reinhardt, G.A. (1999): Basisdaten für ökologische Bilanzierungen (Basis data for ecological balances). Verlag Vieweg, Braunschweig / Wiesbaden
Brown, S. (1997). Estimating Biomass and Biomass Change of Tropical Forests: a Primer. FAO Forestry Paper 134, Food and Agriculture Organization of the United Nations (FAO), Rome. http://www.fao.org/docrep/W4095E/w4095e06.htm (download 24 April 2009)
Burgess, N.D. & Clarke, G.P. (Eds.) (2001). Coastal Forests of Eastern Africa. IUCN Forest Conservation Series. Cambridge & Gland, IUCN.
Calzoni, J.; Caspersen, N.; Dercas, N.; Gaillard, G.; Gosse, G.; Hanegraaf, M.; Heinzer, L.; Jungk, N.; Kool, A.; Korsuize, G.; Lechner, M.; Leviel, B.; Neumayr, R.; Nielsen, A. M.; Nielsen, P. H.; Nikolaou, A.; Panoutsou, C.; Panvini, A.;Patyk, A.; Rathbauer, J.; Reinhardt, G. A.; Rivad, G.; Smedile, E.; Stettler, C.; Pedersen Weidema, B.; Wörgetter, M.: van Zeijts, H. (2000): Bioenergy for Europe – Which one fits best? Supported by the EC-Commission, DG XII. Heidelberg
CEC (2008). Council of the European Commission 2008: Directive of the European Parliament and of the Council on the promotion of the use of energy from renewable sources. COM (2008), Brussels, 11/12/2008.
Coastal Resource Center, University of Rhode Island and Florida International University (2008). How much water do we need for nature, livelihoods and people? Assessing the environmental flow of the Wami River and its sub-basin, 34 pp. Ministry of Water and Irrigation, Water Resource Division.
Draft Biomass Sustainability Regulation (2007): Draft on the German biomass sustainability ordinance (BioNachV), dated December 5th, 2007
Environment and Natural Resources Management Series 47 52
Ejigu, M. (2008). Towards energy and livelihood security in Africa: Smallholder production and processing of bioenergy as a strategy. Natural Resources Forum: 32: 152-162.
FAO (1997). Renewable biological systems for alternative sustainable energy production (FAO Agricultural Services Bulletin 128). http://www.fao.org/docrep/w7241e/ w7241e0h.htm
FAO (2010). Fritsche, U. R.; Hennenberg, K. J.; Wiegmann, K.; Franke, B.; Köppen, S.; Reinhardt, G.; Dornburg, V.; Faaij, A.; Smeets, E.: Bioenergy Environmental Impact Analysis (BIAS): Analytical Framework. Project financed by the Food and Agriculture Organization of the United Nations (FAO), Rome.
Gerd Sparovek, Göran Berndes, Andrea Egeskog, Flavio Luiz Mazzaro de Freitas, Stina Gustafsson, Julia Hansson (2007). Sugar cane ethanol production in Brazil: an expansion model sensitive to socioeconomic and environmental concerns. Biofuels. Bioproducts and Biorefining. 1(4): 270-282
Gibbs et al. (2008) Gibbs, H. K.; Johnston, M.; Foley, J. A.; Holloway, T.; Monfreda, C.; Ramankutty, N.; Zaks, D.: Carbon payback times for crop-based biofuel expansion in the tropics: the effects of changing yield and technology.- in: Environmental Research Letters, IOP Publishing, Letter 3, 034001, 10 p.
Goldenberg, J., S. T. Coelho and P. Guardabassi (2008). The sustainability of ethanol production from sugar cane. Energy Policy 36: 2086-2097.
Gordon-Maclean, James Laizer, Paul Harrison & Riziki Shemdoe (2008) Biofuel Industry study; An Assessment of the Current Situation. WWF.
Gordon-Maclean (2009). personal communication with Bernd Franke 19 May 2009
Grassi, G.; Fjallstrom, T.; Zhou Qiong (2002): Large-scale integration of bioenergy with petrochemical complexes. Paper presented at the 12th European Conference on Biomass for Energy, Industry and Climate Protection, Amsterdam, The Netherlands, 17-21 June 2002.
GTZ (2005). German Technical Cooperation: Liquid Biofuels for Transportation in Tanzania Potential and Implications for Sustainable Agriculture and Energy in the 21st Century, August 2005.
Hartemink, A.E. (2008). Sugar for Bioethanol: Soil and Environmental Issues. Advances in Agronomy. 99: 125-172.
Heller, M.C., Gregory A. Keoleian, Timothy A. Volk (2003).Life cycle assessment of a willow bioenergy cropping system. Biomass and Bioenergy. 25(2): 147-165.
House, J. I. & Hall, D. O. (2003). Primary production reported for tropical grasslands and savannas. http://www.savannas.net/savt4.htm (downloaded 24 April 2009)
IFEU (2009). ifeu-Institut für Energie- und Umweltforschung Heidelberg GmbH (IFEU): Continuously updated internal IFEU Database. Heidelberg, 2009.
Intergovernmental Panel on Climate Change (IPCC) (2001). Climate Change 2001 – The Scientific Basis. Contribution of Working Group I to the Third Assessment Report of the Intergovernmental Panel on Climate Change. Cambridge University Press, Cambridge (UK), 2001.

Environment and Natural Resources Management Series 47 53
International Organisation for Standardisation (ISO) (2006). ISO 14040:2006 / 14044:2006. Environmental management – Life cycle assessment – Principles and framework / Requirements and guidelines. Beuth Verlag, Berlin 2006.
IPCC (2006). IPCC Guidelines for National Greenhouse Gas Inventories, Prepared by the National Greenhouse Gas Inventories Programme, Eggleston H.S., Buendia L., Miwa K., Ngara T. and Tanabe K. (eds). IGES, Japan.
IPCC (2007). Changes in Atmospheric Constituents and in Radiative Forcing. In: Climate Change 2007: The Physical Science Basis. Contribution of Working Group I to the Fourth Assessment Report of the Intergovernmental Panel on Climate Change: Cambridge University Press, Cambridge, United Kingdom and New York, NY, USA.
ISO 14040&14044 Deutsches Institut für Normung e.V. (German Institute for Standardi-zation): ISO 14040:2006(E) & ISO 14044:2006(E). Environmental management – Life cycle assessment – Requirements and guidelines. Beuth Verlag, Berlin, 2006.
Jippe Hoogeveen, Jean-Marc Faurès, Nick van de Giessen (2009). Increased biofuel production in the coming decade: to what extent will it affect global freshwater resources? Irrigation and Drainage, 58(1): S148-S160
Jungk, N.C. & Reinhardt, G.A. (2000): Landwirtschaftliche Referenzsysteme in ökologischen Bilanzierungen (Agricultural reference systems in ecological balances). By order of the Federal Ministry for Agriculture, Food and Forestry, FKZ 99 NR 009, Bonn, 2000.
Kim, S. and B.E. Dale (2005). Life cycle assessment of various cropping systems utilized for producing biofuels: Bioethanol and Biodiesel. Biomass and Energy 29: 426-439.
Malimbwi, R.E., Zahabu, E., and Katani, J.Z. (2009). Forest resource assessment report for the Bagamoyo BioEnergy project. Faculty of Forestry and Nature Conservation, Sokoine University of Agriculture, Chuo Kikuu, Morogoro, Tanzania.
Perkin A.W. (2003). Galago and nocturnal mammal surveys within the Rufiji Environmental Management Project area. Rufiji Environmental Management Project. Unpublished Report 1-17.
Ramjeawon, T (2004). Life Cycle Assessment of Cane-Sugar on the Island of Mauritius. International Journal of Life Cycle Analysis 9(4):250-260.
Rutz, D. and R. Janssen (2007). Biofuel Technology Handbook
Ruesch, A. & Gibbs H.K. (2008). New IPCC Tier-1 Global Biomass Carbon Map For the Year 2000. Available online from the Carbon Dioxide Information Analysis Center [http://cdiac.ornl.gov], Oak Ridge National Laboratory, Oak Ridge, Tennessee
SEKAB (2008a). Environmental and Social Impact Statement of the Proposed BioEthanol production on the former Razaba Ranch, Bagamoyo District, Tanzania. Final Report. SEKAB Bioenergy Limited, Dar es Salaam, Tanzania.
SEKAB (2008b). Study on Biomass Harvesting and Chipping SEKAB Bagamoyo BioEnergy Project. Final report. SEKAB Bioenergy Limited, Dar es Salaam, Tanzania.
SEKAB (2009). Razaba analytical soil results, Bagamoyo, Tanzania.

Environment and Natural Resources Management Series 47 54
Valimba P. (2007). Environmental Flow Assessment (EFA), Wami River Sub-Basin, Tanzania: The Wami Hydrology. Volume 1 – General Description. 2007. Wami-Ruvu Basin Water Office. 42p. http://wami.fiu.edu/LinkClick.aspx?fileticket=EBmUsrK6zGc%3d&tabid=56&mid=394
Walter, A., P.Dolzan, O. Quilodrn, J. Garcia, C. Da Silva, F. Piacente and A. Segerstedt (2008). A sustainability analysis of the Brazilian ethanol.
Zuurbier, P. & van de Voore, J. (eds.) (2008). Sugar cane ethanol. Wageningen Academic Publishers, Wageningen.

Environment and Natural Resources Management Series 47 55
11 Glossary
Abbreviation / Expression
Explanation
BEFS Bioenergy and Food Security; Research project funded by the FAO (see references)
BIAS Bioenergy Environmental Impact Analysis ; Research project funded by the FAO (see references)
DDGS Dried Distillers Grains with Solubles: Cereal by-product of the grain fermentation process; created by drying and pelletising the stillage; used as feed, especially for ruminants
dm Dry matter: Here, all solids of a crop, i.e. all constituents excluding water of biomass
EtOH Ethanol: Here, first generation Ethanol which is produced by fermenting sugary juice (from Sweet Sorghum or sugar cane) or starch (from Sweet Sorghum or wheat grains)
EtOH 2 Second generation ethanol: Here, cellulosic ethanol; after a pre-treatment, sugar molecule chains are broken down to glucose molecules with the help of enzymes; the sugar can then be fermented to bioethanol; by-product is lignin which can produce process power
fm Fresh matter: Here, whole biomass including water GJ Gigajoule: Unit of energy measuring heat, electricity and mechanical
work, 1 Gigajoule is 1.000.000.000 Joule ha x yr One hectare in one year kWh Kilowatt hour. Unit of energy which is most commonly used to express
amounts of energy delivered by electric utilities LCA Life Cycle Assessment: Investigation and valuation of the environmental
impacts of a given product or service taking into account the entire life cycle of the product from raw material acquisition through production to utilisation of the products (‘well to wheels’ approach)
MJ Megajoule: Unit of energy measuring heat, electricity and mechanical work, 1 Megajoule is 1.000.000 Joule
to x km Ton-kilometer: Unit of measurement used to assess the environmental implications in LCA associated with transportation; the number of ton-kilometers is calculated by the weight in tons of a product multiplied by the number of kilometers transported
WUE Water use efficiency: Production of dry matter divided by water loss

Environment and Natural Resources Management Series 47 56
Appendix
Biofuel Companies in Tanzania: A report for IFEU/ FAO BEFS Project
Andrew Gordon-Maclean Natural Resource Consultant Dar es Salaam, Tanzania May 2009