Embed Size (px)
Citation preview

Biochimica et Biophysica Acta 1787 (2009) 1170–1178
Contents lists available at ScienceDirect
Biochimica et Biophysica Acta
j ourna l homepage: www.e lsev ie r.com/ locate /bbab io
Spectral characteristic of fluorescence induction in a model cyanobacterium,Synechococcus sp. (PCC 7942)☆
Radek Kaňa a,b,⁎, Ondřej Prášil a,b, Ondřej Komárek a,b,e, George C. Papageorgiou c, Govindjee d
a Laboratory of Photosynthesis, Institute of Microbiology, Academy of Sciences Czech Republic, Třeboň, Czech Republicb Institute of Physical Biology and Faculty of Biology, University of South Bohemia in České Budějovice, Czech Republicc National Center for Scientific Research Demokritos, Institute of Biology, 153 10 Athens, Greeced Department of Plant Biology, Department of Biochemistry and Center of Biophysics and Computational Biology, University of Illinois at Urbana-Champaign, 265 Morrill Hall,505 South Goodwin Avenue, Urbana, IL 61801-3707, USAe Institute of System Biology and Ecology, Academy of Sciences Czech Republic, Nové Hrady 136, 37 333, Czech Republic
☆ Dedicated to Prof. Dr. Achim Trebst at his 80th birth⁎ Corresponding author. Tel.: +420 384340436; fax:
E-mail address: [email protected] (R. Kaňa).
0005-2728/$ – see front matter © 2009 Elsevier B.V. Adoi:10.1016/j.bbabio.2009.04.013
a b s t r a c t
a r t i c l e i n f oArticle history:Received 5 December 2008Received in revised form 24 March 2009Accepted 15 April 2009Available online 3 May 2009
Keywords:Fluorescence inductionCyanobacteriumPCC 7942PhycobilisomeState transition
We present here three-dimensional time-wavelength-intensity displays of changes in variable fluores-cence, during the O(JI)PSMT transient, observed in cyanobacterium at room temperature. We were able tomeasure contributions of individual chromophores to fluorescence spectra at various times of fluorescenceinduction (FI). The method was applied to a freshwater cyanobacterium, Synechococcus sp. (PCC 7942).Analysis of our experimental results provides the following new conclusions: (i) the main chlorophyll(Chl) a emission band at ∼685 nm that originates in Photosystem (PS) II exhibits typical fast (OPS) andslow (SMT) FI kinetics with both orange (622 nm) and blue (464 nm) excitation. (ii) Similar kinetics areexhibited for its far-red emission satellite band centered at ∼745 nm, where the PS II contributionpredominates. (iii) A significant OPS-SMT-type kinetics of C-phycocyanin emission at ∼650 nm areobserved with the blue light excitation, but not with orange light excitation where the signal rose onlyslightly to a maximum. The induction of F650 was not caused by an admixture of the F685 fluorescenceand thus our data show light-inducible and dark-reversible changes of phycobilin fluorescence in vivo. Wediscuss possible interpretations of this new observation.
© 2009 Elsevier B.V. All rights reserved.
1. Introduction
A dilute solution of chlorophyll (Chl) a emits fluorescence, theintensity of which is constant with time of illumination. In contrast,the intensity of the Chl a fluorescencewhich photosynthetic cells emitchanges with time, tracing characteristic and reproducible kineticpatterns throughout illumination intervals that extend from sub-picosecond (ps) to tens of minutes, and even longer (reviewed byPapageorgiou et al. [1]). Chl a fluorescence is affected by physico-chemical and physiological processes that occur within and across thethylakoid membranes and relate to photosynthesis; in addition,syntheses and the degradations of holochromic proteins affect thestoichiometry of photosystems and the sizes of their antennae [2].
The ps-to-min time course of Chl a fluorescence is rich ininformation on several disparate photosynthesis-related levels thatinclude: ultrafast intermolecular exciton transfer, exciton trapping andcharge stabilization (∼sub-ps to ns; reviewed by Tyystjärvi and Vass[3]); ground state electron and proton transport processes (∼μs tο s;
day on June 9, 2009.+420 384340415.
ll rights reserved.
reviewed by Bruce and Vasil'ev [4], Kramer et al. [5]); and intersystemholochrome movements (∼s to min; in the so-called state transitions,reviewed by Mullineaux and Emlyn-Jones [6]). In particular, the μs tomin segment of this Chl afluorescence time course, commonly referredto asfluorescence induction (FI), has been extensively investigated andexploited (see reviews by Papageorgiou et al. [1], Mullineaux andEmlyn-Jones [6], Govindjee [7], Lazár [8], and Strasser et al. [9]).
We studied the FI properties of the freshwater cyanobacteriumSynechococcus sp. PCC 7942 (formerly Anacystis nidulans R2), a modelorganism inphotosynthesis research. The thylakoidmembranes of thisprokaryote contain the core antenna Chl a-protein complexes ofPhotosystem (PS) I and PS II, which are common in all oxyphototrophs,but lack the peripheral trans-membrane light-harvesting Chl a, bcomplexes (LHC) of the eukaryotic cells. Instead, they use for lightharvesting the phycobiliproteins, C-phycocyanin (CPC) and allophy-cocyanin (APC), assembled into externally-attached organelles, thephycobilisomes, PBS (reviewed by MacColl [10] and Adir [11]).
Electronic excitation that is generated in the light-harvestingsystem of Synechococcus (in the extrinsic phycobiliproteins or in theintrinsic PS I and PS II Chl a holochromes) is transferred to the reactioncenter of PS I or PS II (PS I RC, PS II RC) that initiates photosyntheticelectron transport [12]. Electronic excitation is also dissipated as heatand as fluorescence emission that can be used effectively to monitor

1171R. Kaňa et al. / Biochimica et Biophysica Acta 1787 (2009) 1170–1178
various photosynthetic processes. Selective excitation of Chl a by bluelight generates fluorescence from the Chl a molecules of both PS II andPS I, while selective excitation of CPC (by orange light) generatesbroadband fluorescence from the CPC and APC proteins of theextrinsic PBS as well as from the intrinsic Chl a holochromes of PS IIand PS I.
The regulation of electronic excitation and its distribution arereflected in FI pattern usually measured in the 690–700 nm spectralrange that relates to changes in PS II photochemistry. The fast part of FIcurve in cyanobacteria (first second of actinic irradiance) is rathershallow in comparison to the well-structured and dynamic OJIPkinetics in higher plant leaves [1]. The fast OJIPS transient is followedby a much slower fluorescence increase from the S-plateau to the Mpeak appearing tens of seconds after the onset of light. The SM rise ofFI is dominant in cyanobacteria in contrast to the higher plants andgreen algae [1] and has been assigned mostly to an increased PBS →PS II excitation transfer for the following reasons: (i) it has beenobserved only in PBS-sensitized Chl a fluorescence [1]; (ii) it is usuallymuch lower or is absent in higher plants, green algae and non-PBS-containing cyanobacteria [1] (iii) hyper-osmotic conditions block theSM rise in PBS-containing cyanobacteria reversibly, without blockingthe OJIPS phase [13]; (iii) the SM rise can be observed also in thepresence of DCMU (diuron, that blocks electron transfer from PS II toPS I), and this rules out the involvement of QB and the PQ-pool in it[14]. Blocking of the PBS → PS I excitation transfer enhances the SMrise (maximal PBS excitation ends up in PS II) and on the other handstimulation of this transfer can fully abolish the SM rise as much lessPBS excitation ends up in PS II [1,13]. This phenomenology suggeststhat the SM rise reflects the regulatory distribution of PBS excitation,which is known as state 2-to-state 1 transition (see e.g. [6] for review)since cyanobacteria tend to stay in the low fluorescence state 2 duringdark and are transformed into the highly fluorescent state 1 duringirradiation [13].
This FI measured at narrow spectral range results in two-dimensional displays of the momentary value of fluorescenceintensity as a function of illumination time (Ft= f(t)) that reflectsmostly photochemical events in PS II. However, modern diode-arrayequipment allows us to measure the entire emission spectrumwithinapprox. 1 s that enables us to measure families of fluorescence spectraat various times of actinic light illumination together with fluores-cence induction (FI) curves at various wavelengths. This can be thenpresented as three-dimensional diagrams in which the fluorescenceintensity (F) is plotted against two independent variables, wavelength(λ) and time (t), namely displays of the function Ft=Φ(λ,t). Theinformation content of the three-dimensional FI diagrams is richerthan that of the two-dimensional Ft= f(t) ones, thus this analysisprovides us a clearer insight into the physicochemical and molecularevents that lie behind the phenomenology of FI. To achieve this,we havespectrally resolved the characteristic SMT transient in cyanobacteriumSynechococcus sp. PCC 7942 at characteristic wavelengths of emissionof various chromophores (i.e. PS II, PS I, PBS). The 3-dimensional spectralcharacteristics offluorescence induction (Ft=Φ(λ,t))were detected, forthe first time, during the O(JI)PSMT transient, with selective excitationeither of Chl a or of CPC. We discuss these results in the context of ourpresent understanding of the regulation in excitation energy distribu-tion in the pigment systems of cyanobacteria during photosyntheticinduction.
2. Materials and methods
2.1. Photosynthetic organism
The freshwater cyanobacterium Synechococcus sp. PCC 7942 wascultivated in the batch mode in standard BG 11 medium underconstant white light irradiance of 50 μmol photons m−2 s−1 of PAR
(Photosynthetically Active Radiation) [15]. The cultures were periodi-cally diluted with fresh medium.
2.2. Steady-state absorption and fluorescence spectra
Absorption spectra were recorded with a Unicam UV 550(Thermospectronic, UK) spectrophotometer that was equipped withan integrating sphere. Cells were infiltrated on nitrocellulosemembrane filters (pore diameter 0.6 μm; Pragochema, Czech Repub-lic), and these filters were positioned in the integrating sphere.Absorbance was measured with a 4 nm detection bandwidth step inthe 390 nm to 750 nm range.
Fluorescence emission spectra at 77 K were measured using anAminco-Bowman Series 2 spectrofluorometer, in a standard instru-ment geometry. Dilute suspensions (in order to avoid fluorescencereabsorption) were first dark adapted at room temperature for∼15 min and then infiltrated on nitrocellulose membrane filterswhich were fitted in a sample holder and immersed in an opticalDewar flask filled with liquid nitrogen. Excitationwas provided at twospectral bands, 438 nm and 580 nm, each with a 4 nm bandwidth.Fluorescence emission was scanned with a 4 nm bandwidth.
2.3. Fluorescence kinetics
Fluorescence induction measurements were performed with aDouble-Modulation Fluorometer FL-100 (Photon Systems Instru-ments, Czech Republic); for details, see Trtílek et al. [16]. Actinicirradiance was provided by a set of photodiodes either at 464 nm(∼200 μmol (photons) m−2 s−1), or at 622 nm (∼33 μmol (photons)m−2 s−1) and fluorescence was detected in the 690–710 nm spectralrange. Fluorescence was sampled continuously with logarithmicallyincreasing intervals between measured points (55 points per everydecade with a first point at 46 μs after the onset of exciting light).Before each measurement, Synechococcus cells were dark adapted for≥15 min.
Simultaneous recordings of fluorescence spectra were performedwith Spectrometer SM-9000 (Photon Systems Instruments, CzechRepublic) that has a constant instrument response for all the usedwavelengths. A light guide of the spectrometer was fitted to thecuvette of the FL-100 fluorometer in a geometry that allowedsimultaneous detection of signal from FL-100 Fluorometer and SM-9000 Spectrometer. The dark current of the instrument wasautomatically subtracted before measurements. The Fo level spectrawere collected for approximately 10 s at the low measuring light thatthe FL-100 Fluorometer provided (light intensity, b0.5 μmol (photons)m−2 s−1 of blue (464 nm) or of orange (622 nm) light). We note thatthe Fo level is the minimum fluorescence of the system, when theprimary quinone acceptor, QA, of PS II is fully oxidized [1,7,9]. Thespectral characteristics of the fluorescence emitted during theinduction were detected at the actinic light provided by FL-100Fluorometer, i.e., ∼200 μmol (photons) m−2 s−1 of blue light or at∼33 μmol (photons) m−2 s−1 of orange light. The spectrophotometer,used in this research, allowed us to scan the entire emission spectraevery 1 s for a total of 300 s (at a spectral bandwidth of 2 nm)simultaneously with the measurements of modulated fluorescence(see above).
2.4. Data analysis
Raw data of fluorescence emission spectra, measured by SM-9000Spectrometer during slow FI were imported into analytical softwareOrigin (version 8.0, OriginLab Corp., USA). All datawere normalized tothe changes in the intensity of excitation light. The spectrum of theexcitation light was subtracted from the raw data before processingand then the analytical tools of Origin were used to construct thethree-dimensional FI plots and to deconvolute the fluorescence

Fig. 1. Absorption (A) and fluorescence spectra (B) of Synechococcus sp. PCC 7942. Absorption of a cell suspension was recorded at room temperature; fluorescence of frozen cellsuspension was measured at 77 K, following excitation either at 438 nm (closed circles) or at 580 nm (open circles). Displayed curves are average of three measurements. Cells weredark adapted for 15 min before each measurement.
Fig. 2. Time course of chlorophyll a fluorescence (fluorescence induction, FI) from dark-pre-adapted Synechococcus sp. PCC 7942 suspension during continuous excitation atroom temperature. Fluorescence was detected in the 690–710 nm range (F690–710) withexcitation either at 464 nm (200 μmol (photons) m−2 s−1; blue actinic light) or at622 nm (33 μmol (photons) m−2 s−1; orange actinic light). The FI curves werenormalized to equal M–O differences and the O level fluorescence was set to zero toallow us to compare blue light induced FI with FI after orange light excitation; r.u. on theordinate stands for relative units; the nomenclature of time points (OJIPSM) followsthat used earlier [1].
1172 R. Kaňa et al. / Biochimica et Biophysica Acta 1787 (2009) 1170–1178
emission spectra at particular times into their Gaussian components.In the latter process, band peaks and bandwidths were first taken asinitial conditions for the fitting procedure but subsequently theirparticular values were adjusted using chi squared (χ2) reduction. Thisapproach allowed us to compare changes in the contribution ofparticular pigment–protein complexes during the course of FI.
3. Results
3.1. Absorption and emission spectra
Fig. 1A shows the room temperature absorption spectrum of aSynechococcus cell suspension and Fig. 1B fluorescence emissionspectra of the same cell suspensions frozen at 77 K measured at 2different wavelengths of excitation. The absorption band maxima andthe main contributing chromophores are: 436 nm (mainly Chl a);489 nm (mainly carotenoids); 625 nm (mainly CPC and APC); and677 nm (mainly Chl a). Low temperature fluorescence was excitedeither at 438 nm where Chl a in vivo absorbs strongly [17,18] and CPC[19–21] plus APC [19,22] weakly, or at 580 nmwhere CPC [20,23] andAPC [22,23] absorb strongly and Chl a less strongly [17,18]. Thesespectra are shown here in order to characterize the cyanobacterialcells we used in this research.
The two 77 K emission spectra are conspicuously different (Fig.1B). Excitation at 438 nm generates two emission bands, F685 andF696, that originate from the Chls a of the CP43 and CP47 proteins ofPS II [24], and one emission band, ∼F715, that originates mostly fromChls a in PS I [25]. The smaller band at 653 nm is most likely directlyexcited CPC fluorescence. In contrast, the spectrum of the 580 nmexcitation gives a prominent emission band, F650, that originates fromCPC [19] and a smaller band around 675 nm that originates from APC-B [26] and the F685 emission band, which originates from Chls a of PSII, and contains also some APC emission, and finally a shoulder at715 nm that can be assigned to Chls a of PS I [25]. The 696 nm Chl aemission band is not resolved under this excitation.
3.2. Fluorescence induction
Fig. 2 displays fluorescence induction (FI) curves recorded at roomtemperature with (15 min) dark pre-adapted Synechococcus cellsuspensions. The cells were illuminated continuously either with theblue (464 nm), or with orange (622 nm) actinic light and fluorescencewas detected in the spectral interval 690–710 nm (F690–710). Since the
blue excitation at 464 nm is not significantly absorbed by CPC [19–21]or by APC [22], only Chl a is excited directly by this blue excitation. Theorange excitation at 622 nm is absorbed mainly by the phycobilipro-teins that generates directly excited phycobiliprotein fluorescence andindirectly excited Chl a fluorescence due to excitation energy transferfrom CPC → APC → Chl a [12].
The F690–710 signal (presented in Fig. 2) contains mainly Chl aemission from PS II [cf. 24], with negligible amount of CPC [19,20] andAPC emission [19,23]. There could be also Chl a emission from PS I[24]. According to e.g., Franck et al. ([27], experiments with leaves),the PS I fraction of the total Chl a fluorescence signal is maximal at Foand minimal at Fm, suggesting that all, or most, of the variable Chl afluorescence originates in PS II (see Itoh and Sugiura [28] for a reviewon PS I fluorescence). However, the constancy of the PS I fluorescence

1173R. Kaňa et al. / Biochimica et Biophysica Acta 1787 (2009) 1170–1178
and the phycobilin fluorescence emissions in cyanobacteria, during FI(i.e., under continuous actinic illumination from μs to min), has notbeen proven rigorously.
The two curves shown in Fig. 2 were normalized (see the legendfor details) to facilitate their comparison. In cyanobacteria, the 464 nmexcitation is preferentially absorbed by PS I that contains more Chl a[29] than by PS II [30,31] and is stoichiometricallymore abundant thanPS II (PS I/PS II≈2–5, according to Fujita et al. [31]). However, because
Fig. 3. Three-dimensional displays of fluorescence emitted by Synechococcus sp. PCC 7942 celactinic light illumination. At the beginning, Fo spectra of the dark adapted cells were recordpanel A) or orange (622 nm— panel B) light. After the onset of actinic blue light (464 nm, ∼2(photons)m−2 s−1; panel B), fluorescence spectrawere recorded every second. Fluorescence(Y-axis). Artificial colors of the 3D plots represent the intensity of fluorescence at a particularSlice parallel to the XZ plane is the room temperature fluorescence emission spectrum at a patime course of fluorescence at a particular wavelength. The data were obtained by spectromeunits.
PS I RC (P700) turns over faster than the PS II, it has lower fluorescenceintensity than the PS II antenna. Therefore, Chl a fluorescence excitedby blue actinic light at 464 nm is weaker in comparison to excitationby orange light at 622 nm (data not shown) as the orange lightabsorbed by CPC is primarily transferred to more fluorescent Chls a ofPS II. This is indicated by a low temperature PS I emission band (F715)of dark adapted cells (Fig. 1B) where F715 (emission of PSI) is muchweaker for 580 nm excitation than the PS II emission band (F685). The
ls in suspension relative to the wavelength of fluorescence detection and the duration ofed using weak measuring excitation (0.5 μmol(photons) m−2 s−1) of blue (464 nm —
00 μmol(photons) m−2 s−1; panel A) or actinic orange illumination (622 nm, ∼33 μmolintensity (Z-axis) is plotted against emissionwavelength (X-axis) and illumination timetime of fluorescence induction (see Y-axis) and at a particular wavelength (see X-axis).rticular illumination time, while a slice parallel to the YZ plane can be interpreted as theter SM-9000 together with data presented in Fig. 2. a.u. on the Z-axis stands for arbitrary
1174 R. Kaňa et al. / Biochimica et Biophysica Acta 1787 (2009) 1170–1178
F715 is the CPC-sensitized emission of PS I Chls a that represents thelargest fraction of CPC excitation transferred to PS I. Therefore only asmall fraction of the CPC excitation is transferred to the Chls a of PSI,and this fraction is largest in the dark adapted state of cyanobacteria(state 2) and smallest in the light-adapted state (state 1; see reviewsin [1] and [18] and references cited therein).
Fluorescence kinetic patterns, such as those in Fig. 2 for excitationat 622 nm (orange), with a low-amplitude fast phase (OJIPS) and adominant slow phase (SMT), are typical of PBS-containing cyanobac-teria exposed to orange light. According to Fig. 2, a similar OJIPSMTfluorescence kinetic pattern [1] is also generated by exciting Chls a at464 nm (blue). Despite their qualitative similarity, the two FI patternsare different both in the slow SMT phase and in the fast OJIPS phase.With excitation at 464 nm, the SM phase rises faster and M peakoccurs ∼30 s earlier than with excitation at 622 nm. We have alsoobserved that the SM amplitude depends on the length of the darkpre-adaptation period; long dark pre-adaptation results in higher Mpeaks with blue light excitation but lower M peaks with orange lightexcitation (data not shown).
3.3. Spectral characteristic of fluorescence induction
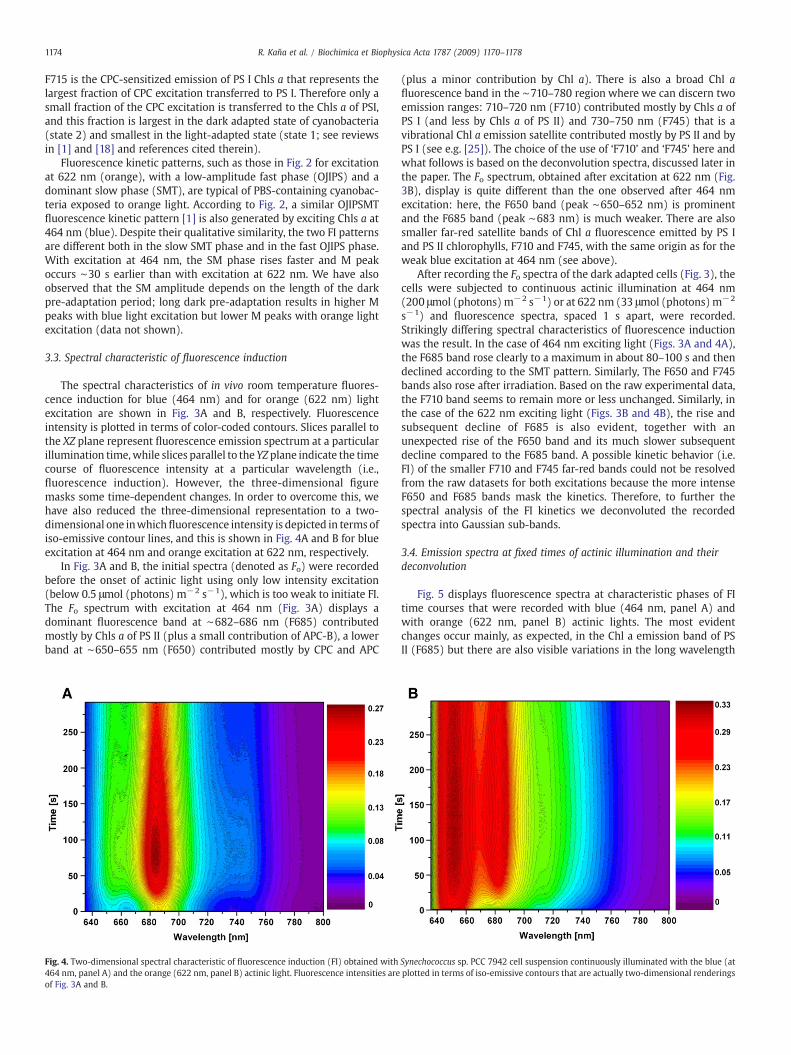
The spectral characteristics of in vivo room temperature fluores-cence induction for blue (464 nm) and for orange (622 nm) lightexcitation are shown in Fig. 3A and B, respectively. Fluorescenceintensity is plotted in terms of color-coded contours. Slices parallel tothe XZ plane represent fluorescence emission spectrum at a particularillumination time,while slices parallel to the YZ plane indicate the timecourse of fluorescence intensity at a particular wavelength (i.e.,fluorescence induction). However, the three-dimensional figuremasks some time-dependent changes. In order to overcome this, wehave also reduced the three-dimensional representation to a two-dimensional one inwhichfluorescence intensity is depicted in terms ofiso-emissive contour lines, and this is shown in Fig. 4A and B for blueexcitation at 464 nm and orange excitation at 622 nm, respectively.
In Fig. 3A and B, the initial spectra (denoted as Fo) were recordedbefore the onset of actinic light using only low intensity excitation(below 0.5 μmol (photons) m−2 s−1), which is too weak to initiate FI.The Fo spectrum with excitation at 464 nm (Fig. 3A) displays adominant fluorescence band at ∼682–686 nm (F685) contributedmostly by Chls a of PS II (plus a small contribution of APC-B), a lowerband at ∼650–655 nm (F650) contributed mostly by CPC and APC
Fig. 4. Two-dimensional spectral characteristic of fluorescence induction (FI) obtained with464 nm, panel A) and the orange (622 nm, panel B) actinic light. Fluorescence intensities areof Fig. 3A and B.
(plus a minor contribution by Chl a). There is also a broad Chl afluorescence band in the ∼710–780 region where we can discern twoemission ranges: 710–720 nm (F710) contributed mostly by Chls a ofPS I (and less by Chls a of PS II) and 730–750 nm (F745) that is avibrational Chl a emission satellite contributed mostly by PS II and byPS I (see e.g. [25]). The choice of the use of ‘F710’ and ‘F745’ here andwhat follows is based on the deconvolution spectra, discussed later inthe paper. The Fo spectrum, obtained after excitation at 622 nm (Fig.3B), display is quite different than the one observed after 464 nmexcitation: here, the F650 band (peak ∼650–652 nm) is prominentand the F685 band (peak ∼683 nm) is much weaker. There are alsosmaller far-red satellite bands of Chl a fluorescence emitted by PS Iand PS II chlorophylls, F710 and F745, with the same origin as for theweak blue excitation at 464 nm (see above).
After recording the Fo spectra of the dark adapted cells (Fig. 3), thecells were subjected to continuous actinic illumination at 464 nm(200 μmol (photons) m−2 s−1) or at 622 nm (33 μmol (photons) m−2
s−1) and fluorescence spectra, spaced 1 s apart, were recorded.Strikingly differing spectral characteristics of fluorescence inductionwas the result. In the case of 464 nm exciting light (Figs. 3A and 4A),the F685 band rose clearly to a maximum in about 80–100 s and thendeclined according to the SMT pattern. Similarly, The F650 and F745bands also rose after irradiation. Based on the raw experimental data,the F710 band seems to remain more or less unchanged. Similarly, inthe case of the 622 nm exciting light (Figs. 3B and 4B), the rise andsubsequent decline of F685 is also evident, together with anunexpected rise of the F650 band and its much slower subsequentdecline compared to the F685 band. A possible kinetic behavior (i.e.FI) of the smaller F710 and F745 far-red bands could not be resolvedfrom the raw datasets for both excitations because the more intenseF650 and F685 bands mask the kinetics. Therefore, to further thespectral analysis of the FI kinetics we deconvoluted the recordedspectra into Gaussian sub-bands.
3.4. Emission spectra at fixed times of actinic illumination and theirdeconvolution
Fig. 5 displays fluorescence spectra at characteristic phases of FItime courses that were recorded with blue (464 nm, panel A) andwith orange (622 nm, panel B) actinic lights. The most evidentchanges occur mainly, as expected, in the Chl a emission band of PSII (F685) but there are also visible variations in the long wavelength
Synechococcus sp. PCC 7942 cell suspension continuously illuminated with the blue (atplotted in terms of iso-emissive contours that are actually two-dimensional renderings

Fig. 5. Fluorescence spectra at characteristic phases (times) of fluorescence induction. The spectrawere recorded with continuous blue (464 nm, panel A) and orange (622 nm, panelB) actinic light excitation. They correspond to sections of Fig. 3 landscapes (parallel to the wavelength-fluorescence intensity axes) or of Fig. 4 contour maps (parallel to thewavelength axis). Approximate correspondence of the spectra to the FI phases, as labeled in Fig. 2, are as follows: Fo (dark adapted cells, open circles, black curve) to the O level; 1 s(open circles, red curve) to the S level; 80 s (triangles, blue curve) to the M level; and 300 s (upside down triangles, green curve) to the T level. The intensity of exciting light was thesame as in Fig. 3.
1175R. Kaňa et al. / Biochimica et Biophysica Acta 1787 (2009) 1170–1178
bands (F710, F745). Moreover, the pronounced changes in the F650emission band reflecting CPC emission fromphycobilisomes are clearlyvisible for both the blue and the orange light excitation, since kineticsof F650 band was detectable even under blue excitation (Fig. 5). Theposition of other bands (F685, F710, F745) is comparable with thoseobtained by Ivanov et al. [32] on Synechococcus PCC 7942 cellsmeasured at 77 K. We have performed similar experimental spectradeconvolution also for our measurements at room temperature; theanalysis has resulted in 4 main bands: F650, F685, F710 and F745 forblue (464 nm) and for orange excitation (622 nm) light withparameters presented in Table 1. The results of spectral deconvolutionfor orange light excitation (Table 1) can be compared with thoseobtained by Ma et al. [33] for Synechocystis sp PCC 6803. In both cases(excitation by blue and orange light), our room temperature spectradid not show the F692–702 bands and the position of F721 reflectingmostly PS I fluorescence was blue shifted to F710.
3.5. The slow fluorescence induction kinetics at particular wavelengths:the SMT transient
In order to obtain an insight into the fate of phycobilin and PS I andPS II emission during FI at room temperature, we made use of thedeconvolution of the experimental spectra. The kinetics of individualGaussian components (amplitudes of F650, F685, F710 and F745) forthe blue (464 nm) and orange (622 nm) light excitation are presentedin Fig. 6A and B, respectively. The amplitudes are normalized to theamplitudes of particular bands of the Fo spectrum.
Fig. 6 shows that the main Chl a emission band of PS II (F685)follows the typical OPSMT kinetics either with the blue light (464 nm;panel A) or with the orange light (622 nm; panel B). The similar,
Table 1Parameters of fluorescence emission spectra deconvolution.
Excitation Emission F650
464 nm λ 653.8±0.8FWHM 13.8±0.3
622 nm λ 651.2±0.4FWHM 11.7±0.6
Four Gaussians were used to fit the experimental curves measured at room temperature in vlocations, and bandwidths (FWHM — full width at half maximum) of particular bands (F65induction. Data represents n=15 deconvolutions (see Supplementary material for raw fitti
although not identical, OPSMT kinetics has been found also for the far-red satellite band (F745) of PSII chlorophylls, however with absolutechangesmuch smaller than for the F685 band (data not shown). Thesetwo time courses (F685 and F745) were kinetically similar to thoseshown in Fig. 2 for both types of irradiances. This was not the case forthe F710 band reflecting mostly PSI emission and the phycobilisomeemission band (F650) that behave differently for blue and orange lightexcitation. The absolute intensities of the F710 band for the blue and forthe orange excitations weremuch smaller than those of the F685 band(data not shown). However, after normalization to Fo level an increaseof the F650 and F710 fluorescence to theirmaximumwas visible. In thecase of blue light excitation the initial increase in the PSI fluorescence(F710) and in phycobilisome fluorescence (F650) was followed byslight decrease. The blue light induced SMT phase of F650 and F710bands was not synchronous with that emitted by Chl a of PS II (F685and F745) as they occur 20s later. This suggests that the SMT kinetics ofthe F650 (and F710) bands were not caused just by F685 admixture.The direct interpretation of changes in the F710 fluorescence band,where mostly chlorophylls of PSI but also of PSII contribute cannot bemade directly without further experimentation, as the absolutechanges in the deconvoluted F710 signal were rather small (data notshown). On the other hand, more pronounced variation in the F650band provides the first report of light-inducible changes of phycobilinfluorescence in vivo during FI, excited by blue light (see Discussion).
4. Discussion
We have explored a spectrally resolved fluorescence induction (i.e.Ft=Φ(λ,t) function) of Synechoccocus sp. PCC7942. Mimuro [34]) hadearlier summarized the use of such graphs during picosecond time
F685 F710 F745
685.0±0.7 708.2±2.0 744.0±1.810.4±0.4 12.4±1.0 17.4±1.3
682.0±0.8 711.5±0.8 741.0±1.111.9±0.7 15.2±1.5 21.8±3.3
ivo (raw data presented in Figs. 3 and 4). This table represents average wavelength (λ)0, F685, F710 and F745), used for deconvolution at various times during fluorescenceng data).

Fig. 6. Fluorescence induction of the main fluorescence band in PCC 7942. Datarepresent maximum amplitudes of the Gaussian components obtained from deconvo-lution of the experimental data (see Fig. 3) into the four bands: F650 (allophycocyaninemission of phycobilins); F685 (PSII chlorophylls a); F710 (vibration satellite of PSIchlorophylls) and F745 (vibration satellite of PSII chlorophylls). The blue (464 nm;∼200 μmol(photons) m−2 s−1 — panel A) and orange (622 nm; ∼33 μmol(photons)m−2 s−1 — panel B) actinic illumination was used. The presented maximumamplitudes of the Gaussian components are normalized to their appropriate valuesobtained from the Fo spectrum deconvolution, measured with a weak excitation(0.5 μmol(photons) m−2 s−1) before the actinic light was turned on. The nomenclatureof time points (O P SM and T) is as in Fig. 2. The F/Fo values reported above are too highbecause the Fo values were not corrected for light intensity, but this does not affect theshapes of the curves shown here.
Table 2Relative PBS fluorescence intensity at characteristic times of induction.
Excitation Emission Time
0 s (O) 1 s (P) 80 s (M) 240 s (T)
464 nm F650/F685 0.22 0.57 0.41 0.47F650/F710 0.63 1.22 1.14 1.22
622 nm F650/F685 2.07 1.93 1.08 1.09F650/F710 3.15 2.70 2.22 2.23
The intensities of PBS fluorescence (F650) were taken from the Fig. 3 data. The valuesrepresent maximum of PBS fluorescence (F650) normalized to the fluorescencemaximum of PS I Chl a (F650/F710). The fluorescence intensity ratios for blue lightexcitation (464 nm, ∼200 μmol(photons) m−2 s−1) or orange light excitation (622 nm,∼33 μmol(photons) m−2 s−1), are presented. O, P, S, M, T represent the different FIphases (at corresponding times in s). The same results have been obtained also forratios of deconvoluted bands presented in Fig. 6.
1176 R. Kaňa et al. / Biochimica et Biophysica Acta 1787 (2009) 1170–1178
scales where excitation energy transfer steps were measured. Like-wise, Strasser [35; also see 36] had also used 3-dimensional displaysfor the Chl a fluorescence of higher plant leaves (however, of theFλ=f(λF, λE) type, where λE is the excitation wavelength) in order toanalyse the phenomenon of the spillover of electronic excitation fromPS II Chl a holochromes to those of PS I during the transition from state1 to 2. Here, we have extended these methods to longer time scalewhere electron transfer and state changes control fluorescencechanges. This three-dimensional curve provides a panoramic view ofthe time-dependent and wavelength-dependent changes of thefluorescence emission of the main cyanobacterial pigment–proteincomplexes (PS II, PS I, PBS) during continuous actinic illumination invivo. Typically, FI is measured only in a narrow spectral band (∼690–710 nm) where the emission of the Chls a that are embedded in PS IIpredominates. In PBS-containing cyanobacteria, these kinetics obey acharacteristic pattern that consists of the initial OJIPS transient (∼1–
2 s) followed by the slower SMT transient (∼severalmin; see Fig. 2). Inthis work, we have spectrally resolved the slower SMT phase of FI.
We show in Fig. 2, that the typical OJIPS-SMT fluorescence kineticpattern is elicited not only by orange actinic illumination, that isdirected primarily to the PBS phycobilins, but also by blue actinicillumination that is directed primarily to the Chls a of bothphotosystems, and where CPC [19,20,22] and APC [23] almost do notabsorb. The somewhat steeper SM rise and the earlier occurrence of Min the FI pattern recordedwith the blue actinic light (Fig. 2) can simplybe due to its higher intensity compared to the orange actinic light usedin the experiment (see the legend of Fig. 2). However, the SM risereflects not only the state 2 to state 1 transition (as a consequence ofevents initiated by the oxidation of the PQ-pool), but is also partly dueto the suppression of photochemical quenching (reduction of QA andof the PQ-pool) and non-photochemical quenching that depends onthe light quality in cyanobacterium (Ref. [1]). Generally, the PQ-pooloxidation proceeds faster with the blue actinic light compared to theorange actinic light because the PS I RCs turn over faster than the PS IIRCs [13,37]. This is due to the higher Chl a content of PS I compared toPS II in cyanobacteria [29–31]. Fluorescence rise is governed not onlyby the suppression of the photochemical quenching, but also the non-photochemical quenching. To explain the kinetic differences in the FIcurves in Fig. 2, we speculate that the photochemical de-quenchingmay be more significant for the SM rise in orange light (622 nm) thanin blue (464 nm) light.
The spectral analysis of the fluorescence kinetics that we haveelaborated in this paper (Figs. 3, 4 and 5) broadens our under-standing of the FI phenomenology in the case of the PBS-containingcyanobacteria. Analysis of the serial emission spectra (Fig. 5) intoGaussian components and time plots of the intensities of theGaussian sub-bands (Fig. 6) reveal the occurrence of SMT-like kineticpatterns not only for the Chl a fluorescence (F685) but also for theCPC fluorescence (F650) for the blue (464 nm) actinic excitation. Inthe classical approach, the SM rise of Chl a FI has been assignedmostly to an increased PBS → PS II excitation transfer. Therefore, theSM rise is a manifestation of the light induced regulation of the PBSexcitation redistribution from PS I to PS II (or state 2-to-1 transition).This is possible because the PBS-containing cyanobacteria tend tostay in the weakly fluorescent state 2 during the dark pre-adaptationand transit into the highly fluorescent state 1 during actinicillumination (see Ref. [1], and citations therein). Our experimentalapproach has brought new possibilities to the analysis of the statetransition phenomenonelogy.
Two possible state transition mechanisms have been proposed incyanobacteria: (1) reversible PBS movement between PS II and PS I (seee.g. [14,38–40] for further details); (2) intramembranous transfer ofexcitation from Chl a holochromes of PS II to Chl a holochromes of PS Iwith no direct involvement of PBS movement— the so-called spill-overmechanism (see e.g. [18,41]) or combination of both [42–44]. In contrastto higher plants and green algae, our knowledge about the state

1177R. Kaňa et al. / Biochimica et Biophysica Acta 1787 (2009) 1170–1178
transitions mechanism in cyanobacteria is fragmentary. In plants andgreen algae, state transitions cause reversible phosphorylation–depho-sphorylation of light-harvesting LHCII polypeptides; and this is essentialfor the process [45]. In PBS-containing cyanobacteria and red algae, onthe other hand, no light-regulated phosphorylation of the PS II corepolypeptides takes place [46]. In cyanobacteria, the phosphorylation ofphycobilisomes seems to have quite a different role [47] and alsoinhibitor of phosphorylation reaction does not have an effect on the SMfluorescence rise [48]. Even though a direct mechanism of statetransition triggering is not known, it seems to be controlled by redoxstate of electron carriers between PS II and PS I [49].
Measurements of fluorescence spectra during the SM rise reflect-ing state 2 to state 1 transition have shown (Fig. 6): (i) a slight S-M-Tincrease in the F710 band attributed mostly to PS I emission; (ii)significant SM rise of PS II fluorescence (F685) that is in line withstandard FI measurement presented in Fig. 2; (iii) pronouncedincrease in PBS fluorescence with SMT pattern for blue light excitation(Fig. 6A), andwith gradual increase of the F650 band amaximumwithorange excitation (Fig. 6B). The F650 changes cannot be simplyattributed to F685 admixture as the Fig. 6 represents deconvoluteddata. The different origin of F650 and F685 changes is also indicated bytheir different SMT kinetics for F685 and F650 (Fig. 6). Some olderwork has already pointed out on the F650 fluorescence increase [48],however our result is the first observation of the stimulation of PBSfluorescence with SMT pattern (i.e. including SM rise and ST decline)under normal conditions in vivo.
There are only few papers dealingwith the phenomenon of changesin PBS fluorescence in vivo. Similar increases in PBS fluorescence hasbeen attributed to PBSdecoupling in cyanobacteria at low temperatures[50], at high temperatures (or high light) [51] or under oscillating light[52]. It has been also documented in red algae that contain PBS [53] andin cryptophytes [54,55] that contain special types of phycoerythrins.Snyder and Biggins [54] had proposed that such decouplingmay reflecta photoprotective mechanism that may be triggered by changes in thepH of the lumen. In the case of cyanobacteria, the reverse process(coupling of PBS to PS II) seems to be connected with the formation ofan active water-oxidizing complex in PS II [56]. Therefore PBS de-coupling seems to be a general mechanism for avoiding overexcitationand possible PS II photodamage during conditions of rapidly changingambient light intensities [51,56].
Another noteworthy observation, in this paper, concerns relativechanges in the PBS fluorescence (F650 band) in comparison with thePS II (F685 band) and PS I (F710 band) fluorescence (see Table 2).Quite frequently the cyanobacterial emission spectra are interpretedby normalizing fluorescence intensities at ∼650 nm. Here, in the caseof blue light excitation, the F650 signal almost doubled in comparisonto the F685 and F710 emissions (cf. F650/685 and F650/710 ratios,Table 2). On the other hand, the PBS emission relatively declined tohalf in comparison to F685 and F710 emissionwhen excited by orangelight (Table 2). Our results indicate that we must be cautious of such anormalization process because PBS fluorescence also changes.
The Table 2 also indicates different changes in excitation energyflow during FI for blue and orange light excitations (its relativestimulation by blue light and reduction by orange light). This couldindicate a possible role of blue light induced non-photochemicalquenching recently proposed in cyanobacteria (reviewed by Kir-ilovsky [57]) that is controlled by specific cytoplasmic orangecarotenoid protein (OCP). The detailed mechanism behind such aprocess is still under extensive research [58,59]. However it has beenshown that Synechococcus sp. PCC 7942 does not have a gene codingOCP protein [60]. This indicates that blue light induced quenchingregulated by OCP protein is not involved in the observed relativeincrease in F650 fluorescence (see F650/F685 ratios in Table 2).
The photoinduced, reversibly variable F650 fluorescence, dis-cussed in this paper, would certainly require considering additionalmechanisms. It is a challenging and tempting phenomenon for further
investigations. Instead of speculating on the possible mechanisms, weprefer to keep it as our goal for future research.We expect the answersto come from further research on the application of our approach toother organisms with different regulation and organization of lightharvesting.
Note Added in Proofs
While correcting our proofs, we became aware of a very recentpaper (by Küpper and coworkers [61]), relevant to our studies,showing reversible phycobilisome (PBS) uncoupling (resulting inchanges in PBS fluorescence) during cell cycle of a nitrogen fixingcyanobacterium Trichodesmium. We expect, in the future, to comparethese data with similar data obtained with cyanobacteria containingPcb-type light-harvesting antennae, as well as with algae and higherplants.
Acknowledgements
Govindjee thanks Ladislav Nedbal, Ondřej Prášil and Ivan Šetlikfor their hospitality when this work was initiated in Nové Hrady andTřeboň; he is also thankful to the support received from Feng ShengHu, Head of Plant Biology, at the University of Illinois at Urbana-Champaign, during the preparation of this manuscript. The projecthas been supported by GAČR 206/09/094 and by GAČR 206/07/0917. O.P. and R.K. were supported by research grants (GAAVA608170603 and the Institutional Research Concepts AV0Z50200510and MSM6007665808).
Appendix A. Supplementary data
Supplementary data associated with this article can be found, inthe online version, at doi:10.1016/j.bbabio.2009.04.013.
References
[1] G.C. Papageorgiou, M. Tsimilli-Michael, K. Stamatakis, The fast and slow kinetics ofchlorophyll a fluorescence induction in plants, algae and cyanobacteria: aviewpoint, Photosynth. Res. 94 (2007) 275–290.
[2] W.S. Chow, A. Melis, J.M. Anderson, Adjustment of photosystem stoichiometry inchloroplasts improves the quantum efficiency of photosynthesis, Proc. Natl. Acad.Sci. U. S. A. 87 (1990) 7502–7506.
[3] E. Tyystjärvi, I. Vass, Light emission as a probe of charge separation and recom-bination in the photosynthetic apparatus: relation of prompt fluorescence todelayed light emission and thermoluminescence, in: G.C. Papageorgiou, Govindjee(Eds.), Advances in Photosynthesis and Respiration, Vol. 19, Chlorophyll Fluores-cence: a Signature of Photosynthesis, Springer, Dordrecht, 2004, pp. 363–388.
[4] D. Bruce, S. Vasiľev, Excess light stress: multiple dissipative processes of excessexcitation, in: G.C. Papageorgiou, Govindjee (Eds.), Advances in Photosynthesisand Respiration, Vol. 19, Chlorophyll Fluorescence: a Signature of Photosynthesis,Springer, Dordrecht, 2004, pp. 497–523.
[5] D.M. Kramer, T.J. Avenson, A. Kanazawa, J.A. Cruz, B. Ivanov, G. Edwards, Therelationship between photosynthetic electron transfer and its regulation, in: G.C.Papageorgiou, Govindjee (Eds.), Advances in Photosynthesis and Respiration, Vol.19, Chlorophyll Fluorescence: a Signature of Photosynthesis, Springer, Dordrecht,2004, pp. 252–278.
[6] C.W. Mullineaux, D. Emlyn-Jones, State transitions: an example of acclimation tolow-light stress, J. Exp. Bot. 56 (2005) 389–393.
[7] Govindjee, Sixty-three years since Kautsky: chlorophyll a fluorescence, Aust. J.Plant Physiol. 22 (1995) 131–160.
[8] D. Lazár, The polyphasic chlorophyll a fluorescence rise measured under highintensity of exciting light, Funct. Plant Biol. 33 (2006) 9–30.
[9] R.J. Strasser, M. Tsimilli-Michael, A. Srivastava, Analysis of the chlorophyll afluorescence transient, in: G.C. Papageorgiou, Govindjee (Eds.), Advances inPhotosynthesis and Respiration, Vol. 19, Chlorophyll Fluorescence: a Signature ofPhotosynthesis, Springer, Dordrecht, 2004, pp. 321–362.
[10] R. MacColl, Cyanobacterial phycobilisomes, J. Struct. Biol. 124 (1998) 311–334.[11] N. Adir, Elucidation of the molecular structures of components of the phycobili-
some: reconstructing a giant, Photosynth. Res. 85 (2005) 15–32.[12] A.N. Glazer, Phycobilisome: a macromolecular complex optimized for energy
transfer, Biochim. Biophys. Acta 768 (1984) 29–51.[13] K. Stamatakis, M. Tsimilli-Michael, G.C. Papageorgiou, Fluorescence induction in
the phycobilisome-containing cyanobacterium Synechococcus sp PCC 7942:analysis of the slow fluorescence transient, Biochim. Biophys. Acta 1767 (2007)766–772.

1178 R. Kaňa et al. / Biochimica et Biophysica Acta 1787 (2009) 1170–1178
[14] M. Tsimilli-Michael, K. Stamatakis, G.C. Papageorgiou, Dark-to-light transition inSynechococcus sp. PCC 7942 cells studied by fluorescence kinetics assessesplastoquinone redox poise in the dark and photosystem II fluorescencecomponent and dynamics during state 2 to state 1 transition, Photosynth. Res.99 (2009) 243–255.
[15] R. Ripka, J.B. Waterbury, R.Y. Stanier, Isolation and purification of cyanobacteria;some general principles, in: M.P. Starr, H. Stolp, H.G. Truper, A. Balows, H.G.Schlegel (Eds.), The Prokaryotes, Springer-Verlag, Berlin, 1981, pp. 212–220.
[16] M.D. Trtílek, M. Kramer, M. Koblížek, L. Nedbal, Dual modulation LED kineticfluorometer, J. Luminescence 72–74 (1997) 597–599.
[17] H. Scheer, The pigments, in: B.R. Green, W.W. Parson (Eds.), Advances inPhotosynthesis and Respiration, Vol. 13, Light Harvesting Antennas, KluwerAcademic Publishers, Dordrecht, 2003, pp. 29–81.
[18] PapageorgiouG.C. , Fluorescence of photosynthetic pigments in vitro and in vivo,in: G.C. Papageorgiou, Govindjee (Eds.), Advances in Photosynthesis andRespiration, Vol. 19, Chlorophyll Fluorescence: a Signature of Photosynthesis,Springer, Dordrecht, 2004, pp. 43–63.
[19] V.T. Oi, A.N. Glazer, L. Stryer, Fluorescent phycobiliprotein conjugates for analysesof cells and molecules, J. Cell Biol. 93 (1982) 981–986.
[20] G. Patil, S. Chethana, A.S. Sridevi, K.S.M.S. Raghavarao, Method to obtain C-phycocyanin of high purity, J. Chromatogr. 1127 (2006) 76–81.
[21] S.P. Zhang, J. Xie, J.P. Zhang, J.Q. Zhao, L.J. Jiang, Electron spin resonance studies onphotosensitized formation of hydroxyl radical by C-phycocyanin from Spirulinaplatensis, Biochim. Biophys. Acta 1426 (1999) 205–211.
[22] J. Gysi, H. Zuber, Isolation and characterization of allophycocyanin II from thethermophilic blue-green alga Mastigocladus laminosus Cohn. FEBS Lett. 48 (1974)209–213.
[23] R. MacColl, K. Csatorday, D.S. Berns, E. Traeger, Chromophore interactions inallophycocyanin, Biochemistry 19 (1980) 2817–2820.
[24] E.G. Andrizhiyevskaya, A. Chojnicka, J.A. Bautista, B.A. Diner, R. van Grondelle, J.P.Dekker, Origin of the F685 and F695 fluorescence in photosystem II, Photosynth.Res. 84 (2005) 173–180.
[25] E.G. Andrizhiyevskayaa, T.M.E. Schwabe, M. Germano, S. D Haene, J. Kruip, R. vanGrondelle, J.P. Dekker, Spectroscopic properties of PSI–IsiA supercomplexes fromthe cyanobacterium Synechococcus PCC 7942, Biochim. Biophys. Acta 1556 (2002)265–272.
[26] A.N. Glazer, D.A. Bryant, A new cyanobacterial phycobiliprotein, Arch. Microbiol.104 (1975) 15–22.
[27] F. Franck, P. Juneau, R. Popovic, Resolution of the photosystem I and photosystem IIcontributions to chlorophyll fluorescence of intact leaves at room temperature,Biochim. Biophys. Acta 1556 (2002) 239–246.
[28] S. Itoh, K. Sugiura, Fluorescence of photosystem I, in: G.C. Papageorgiou, Govindjee(Eds.), Advances in Photosynthesis and Respiration, Vol. 19, ChlorophyllFluorescence: a Signature of Photosynthesis, Springer, Dordrecht, 2004,pp. 231–250.
[29] P. Jordan, P. Fromme, H.T. Witt, O. Klukas, W. Saenger, N. Krauss, Three-dimensional structure of cyanobacterial photosystem I at 2.5 Å resolution, Nature411 (2001) 909–917.
[30] B. Loll, J. Kern, W. Saenger, A. Zouni, J. Biesiadka, Towards complete cofactorarrangement in the 3.0 Å resolution structure of photosystem II, Nature 438(2005) 1040–1044.
[31] Y. Fujita, A. Murakami, K. Aizawa, K. Ohki, Short-term and long-term adaptation ofthe photosynthetic apparatus: homeostatic properties of thylakoids, in: D.A.Bryant (Ed.), Advances in Photosynthesis and Respiration, Vol. 1, The MolecularBiology of Cyanobacteria, Kluwer Academic Publishers, Dordrecht, 1994,pp. 677–692.
[32] A.G. Ivanov, A. Krol, E. Selstam, P.V. Sane, D. Sveshnikov, Y.-I. Park, G. Öquist, N.P.A.Huner, The induction of CP43′ by iron-stress in Synechococcus sp. PCC 7942 isassociated with carotenoid accumulation and enhanced fatty acid unsaturation,Biochim. Biophys. Acta 1767 (2007) 807–813.
[33] W. Ma, L. Chen, L. Wei, Q. Wang, Excitation energy transfer between photosystemsin the cyanobacterium Synechocystis 6803, J. Luminiscence 126 (2008) 546–548.
[34] M. Mimuro, Visualization of excitation energy transfer processes in plants andalgae, Photosynth. Res. 73 (2002) 133–138.
[35] StrasserR.J. , Mono, -bi, tri, and poly-partite models in photosynthesis, Photosynth.Res. 10 (1986) 255–276.
[36] LombardF. , StrasserR.J. , Evidence of spill over changes during state-1 to state-2transition, in: C. Sybesma (Ed.), Advances in Photosynthesis Research, Proceed-ings of the VI th Congress on Photosynthesis, Brussels, Belgium 1983, III, MartinusNijhoff/Dr. W. Junk Publishers, The Hague, 1984, pp. 271–274.
[37] S. Savikhin, Ultrafast optical spectroscopy of photosystem I, in: J.H. Golbeck (Ed.),Photosystem I: the Light-Driven Plastocyanin: Ferredoxin Oxidoreductase.Advances in Photosynthesis and Respiration, Vol. 24, Springer, Dordrecht, 2006,pp. 155–175.
[38] C.W. Mullineaux, M.J. Tobin, G.R. Jones, Mobility of photosynthetic complexes inthylakoid membranes, Nature 390 (1997) 421–424.
[39] S. Joshua, C.W. Mullineaux, Phycobilisome diffusion is required for light-statetransitions in cyanobacterial, Plant Physiol. 135 (2004) 2112–2119.
[40] D.H. Li, J. Xie, J.Q. Zhao, A.D. Xia, D.H. Li, Y.D. Gong, Light-induced excitation energyredistribution in Spirulina platensis cells: “spillover” or “mobile PBSs”? Biochim.Biophys. Acta 1608 (2004) 114–121.
[41] D. Bruce, S. Brimble, D.A. Bryant, State transitions in a phycobilisomes less mutantof the cyanobacterium Synechococcus sp. PCC 7002, Biochim. Biophys. Acta. 974(1989) 66–73.
[42] M. Koblížek, J. Komenda, J. Masojidek, State transitions in the cyanobacteriumSynechococcus PCC7942. Mobile antenna or spillover? in: G. Garab (Ed.),
Photosynthesis: Mechanisms and Effects, Kluwer Academic Publishers, Dordrecht,1998, pp. 213–216.
[43] M.D. McConnell, R. Koop, S. Vasil ev, D. Bruce, Regulation of the distribution ofchlorophyll and phycobilin-absorbed excitation energy in cyanobacteria. Astructure based model for the light state transition, Plant Physiol. 130 (2002)1201–1212.
[44] H. Li, D.H. Li, S.Z. Yang, H. Xie, J.Q. Zhao, The state transition mechanism — simplydepending on light-on and -off in Spirulina platensis, Biochim. Biophys. Acta 1757(2006) 1512–1519.
[45] M. Tikkanen, M. Nurmi, M. Suorsa, R. Danielsson, F. Mamedov, S. Styring, E.M. Aro,Phosphorylation-dependent regulation of excitation energy distribution betweenthe two photosystems in higher plants, Biochim. Biophys. Acta 1777 (2008)425–432.
[46] S. Pursiheimo, E. Rintamaki, E. Baena-Gonzalez, E.M. Aro, Thylakoid proteinphosphorylation in evolutionally divergent species with oxygenic photosynthesis,FEBS Lett. 423 (1998) 178–182.
[47] I. Piven, G. Ajlani, A. Sokolenko, Phycobilisome linker proteins are phosphorylatedin Synechocystis sp PCC 6803, J. Biol. Chem 280 (2005) 21667–21672.
[48] G. Papageorgiou, Govindjee, Light induced changes in the fluorescence yield ofchlorophyll a in vivo. I. Anacystis nidulans, Biophysic. J. 8 (1968) 1299–1315.
[49] C.W. Mullineaux, J.F. Allen, State-1–state-2 transitions in the cyanobacterium Sy-nechococcus 6301 are controlled by the redox state of electron carriers betweenphotosystem-I and photosystem-II, Photosynth. Res. 23 (1990) 297–311.
[50] U. Schreiber, Reversible uncoupling of energy-transfer between phycobilins andchlorophyll in Anacystis nidulans — light stimulation of cold-induced phycobili-some detachment, Biochim. Biophys. Acta 591 (1980) 361–371.
[51] K. Stoitchkova, O. Zsiros, T. Javorfi, T. Pali, A. Andreeva, Z. Gombos, G. Garab, Heat-and light-induced reorganizations in the phycobilisome antenna of Synechocystissp PCC 6803. Thermo-optic effect, Biochim. Biophys. Acta 1767 (2007) 750–756.
[52] L. Nedbal, V. Brezina, F. Adamec, D. Stys, V. Oja, A. Laisk, G. Govindjee, Negativefeedback regulation is responsible for the non-linear modulation of photosyn-thetic activity in plants and cyanobacteria exposed to a dynamic light environ-ment, Biochim. Biophys. Acta 1607 (2003) 5–17.
[53] L.-N. Liu, A.T. Elmalk, T.J. Aartsma, J.-C. Thomas, B. Lamers, C.H. Zhou, Y.-Z. Zhang,Light-induced energetic decoupling as a mechanism for phycobilisome-relatedenergy dissipation in red algae: a single molecule study, PLoS ONE 3 (9) (2008)e3134.
[54] U.K. Snyder, J. Biggins, Excitation-energy redistribution in the cryptomonad algaCrytomonas ovata, Biochim. Biophys. Acta 892 (1987) 48–55.
[55] R. Kaňa, O. Prášil, C. Mullineaux, Immobility of phycobilins in the thylakoid lumenof a cryptophyte suggests that protein diffusion in the lumen is very restricted,FEBS Lett. 583 (2009) 670–674.
[56] H.J. Hwang, A. Nagarajan, A. McLain, R.L. Burnap, Assembly and disassembly of thephotosystem II manganese cluster reversibly alters the coupling of the reactioncenter with the light-harvesting phycobilisome, Biochemistry 47 (2008)9747–9755.
[57] D. Kirilovsky, Photoprotection in cyanobacteria: the orange carotenoid protein(OCP)-related non-photochemical-quenching mechanism, Photosynth. Res. 93(2007) 7–16.
[58] M. Rakhimberdieva, I. Stadnichuk, I. Elanskaya, N. Karapetyan, Carotenoid-induced quenching of the phycobilisome fluorescence in photosystem II-deficientmutant of Synechocystis sp. PCC 6803, FEBS Lett. 574 (2004) 85–88.
[59] M. Scott, C. McCollum, S. Vasil'ev, C. Crozier, G.S. Espie, M. Krol, N.P.A. Huner, D.Bruce, Mechanism of the down regulation of photosynthesis by blue light in thecyanobacterium Synechocystis sp. PCC 6803, Biochemistry 45 (2006) 52–89.
[60] C. Boulay, L. Abasova, Ch. Six, I. Vass, D. Kirilovsky, Occurrence and function of theorange carotenoid protein in photoprotective mechanisms in various cyanobac-teria, Biochim. Biophys. Acta 1777 (2008) 1344–1354.
[61] H. Küpper, E. Andresen, S. Wiegert, S. Miloslav, B. Leitenmaier, I. Šetlík, Reversiblecoupling of individual phycobiliprotein isoforms during state transitions in thecyanobacterium Trichodesmium analysed by single-cell fluorescence kineticmeasurements, Biochim. Biophys. Acta 1787 (2009) 155–167.
Abbreviations
APC: allophycocyaninCPC: C-phycocyaninChl: chlorophyllFWHM: Full width at half maximumFI: fluorescence inductionFm (Fo): maximal (minimal) variable chlorophyll a fluorescenceF685: fluorescence band with a peak at ∼ 685–686 nmF650: fluorescence band with a peak between ∼ 650 and 654 nmF710: fluorescence band with a peak between ∼ 710 and 720 nmF745: fluorescence band with a peak between ∼ 710 and 720 nmF690–710: fluorescencemeasured by commercial instruments in thewavelength region of690–710 nmOCP: orange carotenoid proteinPAR: photosynthetic active radiationPS I (II): Photosystem I (II)PS II RC: PS I RC, reaction centers of PS II, PSIPBS: phycobilisome